

Abstract
Centrosome positioning is actively regulated by forces acting on microtubules radiating from the centrosomes. Two mechanisms, center-directed and polarized cortical pulling, are major contributors to the successive centering and posteriorly displacing migrations of the centrosomes in single-cell–stage Caenorhabditis elegans. In this study, we analyze the spatial distribution of the forces acting on the centrosomes to examine the mechanism that switches centrosomal migration from centering to displacing. We clarify the spatial distribution of the forces using image processing to measure the micrometer-scale movements of the centrosomes. The changes in distribution show that polarized cortical pulling functions during centering migration. The polarized cortical pulling force directed posteriorly is repressed predominantly in the lateral regions during centering migration and is derepressed during posteriorly displacing migration. Computer simulations show that this local repression of cortical pulling force is sufficient for switching between centering and displacing migration. Local regulation of cortical pulling might be a mechanism conserved for the precise temporal regulation of centrosomal dynamic positioning.
Introduction
Positioning of the centrosomes is critical for the intracellular organization of organelles and the cell division plane (Kellogg et al., 1994). Forces acting on the microtubules (MTs) radiating from the centrosomes regulate the positions of the centrosomes (Dogterom et al., 2005). However, it is unclear how the various forces work in concert to spatiotemporally regulate centrosomal positioning.
The mechanism of centrosomal positioning has been characterized extensively in the single-cell–stage Caenorhabditis elegans embryo (Fig. 1 A; Albertson, 1984; Cowan and Hyman, 2004). The centering phase starts after fertilization. In the establishment stage of centering (hereafter called the establishment stage), the sperm-supplied centrosomes and the associated male pronucleus migrate from the posterior pole to the center of the embryo. During this stage, the male and female pronuclei meet, and the two centrosomes rotate to align along the anterior-posterior (AP) axis. After the establishment, the centrosomes are maintained at the center (maintenance stage). During this stage, nuclear envelope breakdown (NEBD) occurs, and the mitotic spindle, which contains the centrosomes as its poles, forms. The displacing phase begins at metaphase. The centrosomes and the associated spindle are displaced from the center to a posterior position. The off-center positioning of the spindle causes the first cell division to be asymmetric.
Figure 1.

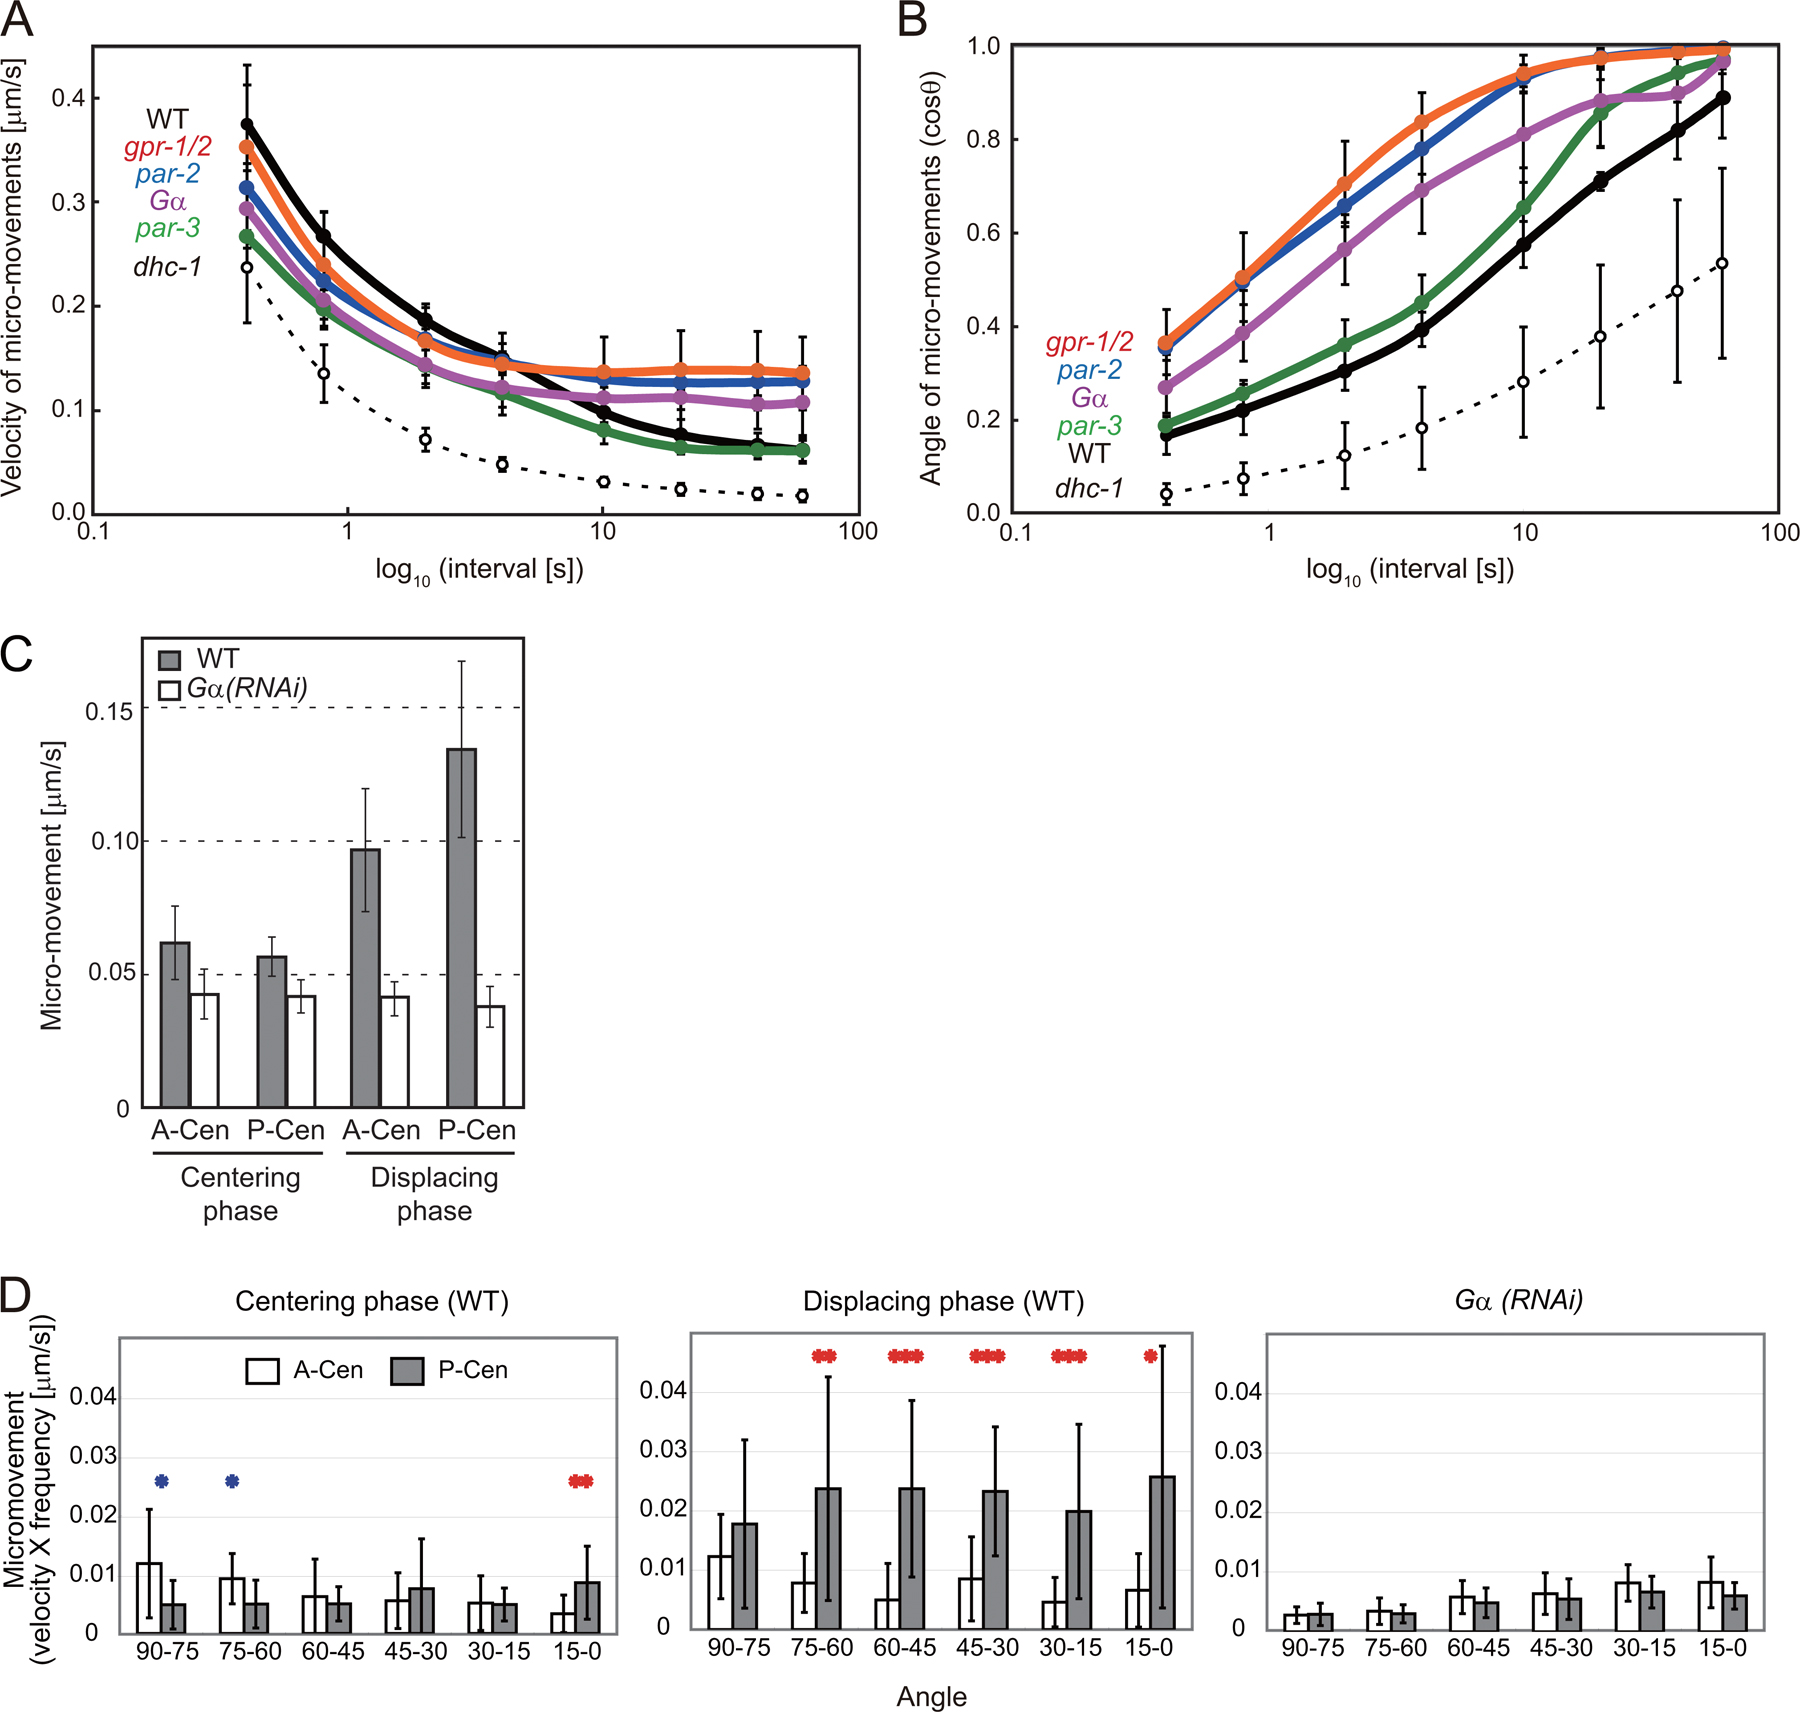
Cortex-directed micromovements during the centering phase. (A) Schematic outline of centrosomal movements in a single-cell–stage C. elegans embryo. Centrosomes (red stars), nuclei (blue circles), and mitotic spindles (MTs, green; chromosomes, blue) are shown. (B) Distance-time graph of the pronucleus–centrosome complex in wild-type (WT) and RNAi-treated embryos. EL, egg length. (C) Mean speed of the pronucleus–centrosome complex during 20–80% of the overall migration (n = 5 for each strain). (D) Trajectory of migration over 40 s during the establishment stage. The position of the center of the nuclear–centrosome complex was quantified every 4 s and plotted. The bottom panels show magnified trajectories. The bold lines at the right of each bottom panel indicate the right-hand margins of the cells. (E) Distribution of micromovements at 4-s intervals. Endpoints of the vectors were plotted. X and y axes are as indicated in D. (F and G) Mean angle (F; in cosine) and velocity (G) of micromovements (n = 5 each). θ is the angle between the direction of a micromovement and the center. Error bars represent SD. Bars, 10 μm.
A notable feature about the centrosome positioning in the C. elegans embryo is that the positioning switches direction from centering to posteriorly displacing (Fig. 1 A). Center-directed forces bring the centrosomes toward the geometric center of the cells. Potential mechanisms include pushing forces generated by MT polymerization and pulling forces generated by MT motor proteins (Hamaguchi and Hiramoto, 1986; Reinsch and Gönczy, 1998; Grill and Hyman, 2005; Vallee and Stehman, 2005; Goulding et al., 2007). Quantification of the centering migration has revealed that the change in migration speed over time in vivo is consistent with a model in which the force that pulls the MTs in a manner dependent on MT length is the primary centering force (Kimura and Onami, 2005). In posterior displacement, the polarized cortical pulling force is critical. The force is stronger toward the posterior cortex, where PAR-2 protein is localized, than toward the anterior cortex, where PAR-3 is localized (Kemphues et al., 1988; Grill et al., 2001). LET-99 is another protein that shows a characteristic cortical localization peaking at the posterolateral cortex and regulates the cortical pulling force (Tsou et al., 2002). The cortical pulling force is dependent on two Gα subunits of the heterotrimeric G proteins GOA-1 and GPA-16 (Gotta and Ahringer, 2001).
A straightforward model for switching of the direction of centrosome migration from centering to displacing is that during the centering phase, only the center-directed forces are active, and the polarized cortical pulling force is activated at the displacing phase. However, laser ablation of the MTs implies the existence of a polarized cortical pulling force during the maintenance stage of the centering (Labbé et al., 2004). If the polarized cortical pulling force were to act in the centering phase, one would expect the centrosomes to become positioned posteriorly. Labbé et al. (2004) proposed a tethering mechanism by which MTs tether the centrosomes at the anterior cortex and prevent posterior displacement. The tethering mechanism explains the maintenance but not the establishment of centering. Importantly, the polarized cortical pulling mechanism may be active even during the establishment stage: asymmetric localization of PAR-2 and -3 has been established (Cuenca et al., 2003), and inactivation of Gα affects migration of the centrosomes (Tsou et al., 2003; Goulding et al., 2007) during the establishment stage. If the polarized cortical pulling mechanism is active at the establishment stage, there should be a counteracting mechanism that establishes (and maintains) centering. Regulation of such a mechanism must be critical to switch centrosomal migration from centering to displacing.
In this study, by using image processing to measure micrometer-scale movements of the centrosomes, we evaluated the spatial distribution of the forces acting on the centrosomes during the centering and displacing phases. The differences between the movements during the two phases provide evidence for a mechanism that switches the centrosomal positioning between the centering and displacing phases.
Results and discussion
To clarify whether the polarized cortical pulling mechanism was active in the establishment stage of centering, we quantified the centering migration of the centrosomes. We used image processing that automatically recognizes the pronucleus in Nomarski differential interference contrast images of C. elegans embryos (Hamahashi et al., 2005; Kimura and Onami, 2005) because the centrosomes associate with the male pronucleus at this stage. We found that centering migration of the pronucleus–centrosome complex, starting from the posterior pole, was faster in embryos in which the polarized cortical pulling was inactivated through RNAi of the goa-1 and gpa-16 genes (Gα(RNAi); Gotta and Ahringer, 2001) than in wild-type (WT) embryos (P = 0.004; Fig. 1, B and C). This result may seem inconsistent with the report that the speed of pronuclear centration after two pronuclei meet is reduced in Gα(RNAi) (Goulding et al., 2007), but it is actually consistent. In Gα(RNAi) embryos, the pronucleus–centrosome complex migrates faster and thus approaches the center earlier than in WT. As a result, the distance and speed of migration after pronuclear meeting become shorter and slower, respectively (Fig. 1 B). Our measurements revealed that Gα acts to decelerate the overall centering migration and suggest that the Gα-dependent polarized cortical pulling mechanism is active during the establishment stage.
To clarify whether the Gα-dependent deceleration of centering migration in WT was caused by the polarized cortical pulling mechanism, we analyzed the migration at a high spatiotemporal resolution. Movements of the pronucleus–centrosome complex within time intervals of 4 s were quantified by image processing. We called these tiny movements, which were <1 μm, micromovements. The micromovements in dhc-1(RNAi) embryos, in which MT-dependent movement of the centrosomes was impaired (Gönczy et al., 1999), were significantly smaller than those in the WT, confirming that the micromovements reflected MT-dependent forces (Fig. S1 A, available at http://www.jcb.org/cgi/content/full/jcb.200706005/DC1).
In WT embryos, we found marked Gα-dependent micromovements toward the posterior cortex during the establishment stage (Fig. 1, D and E; and Videos 1 and 2, available at http://www.jcb.org/cgi/content/full/jcb.200706005/DC1): a notable proportion of the micromovements were headed toward the posterior cortex. In contrast, marked cortex-directed micromovements were not observed in Gα(RNAi) embryos (Fig. 1, D and E); in these embryos, the micromovements were significantly more center directed than in WT embryos (P = 4 × 10⁻⁵; Figs. 1 F and S1 B). The results indicate that changes in the direction but not the velocity (Figs. 1 G and S1 A) of the micromovements caused the faster centering migration in Gα(RNAi) embryos. The cortex-directed micromovements were also dependent on gpr-1;gpr-2 and par-2 but not on par-3 (Figs. 1 and S1). The genes required for cortex-directed micromovements during centering migration coincide with the genes required to produce the stronger pulling forces toward the posterior cortex during posterior-displacing migration (Grill et al., 2001; Colombo et al., 2003). We concluded that in WT embryos, the polarized cortical pulling force was active in addition to the center-directed forces from the establishment stage and opposed centering migration.
The existence of the polarized cortical pulling mechanism during the establishment stage predicts the existence of a counteracting mechanism to prevent an off-center posterior positioning during the centering phase. To obtain insight into this counteracting mechanism, we compared the micromovements in the centering phase and displacing phase. For direct comparison, we analyzed the micromovements just before and after the onset of displacing migration. The centering phase in this assay covered the time from NEBD to the onset of posteriorly displacing migration. During this phase, the spindle is maintained at the center and aligns along the AP axis (Video 3, available at http://www.jcb.org/cgi/content/full/jcb.200706005/DC1). The displacing phase in this assay (Video 4) covers the time from the onset of displacing migration to the onset of chromosome segregation (anaphase). The majority of the posterior displacement, as judged from the position of the center of the spindle along the AP axis, occurs during this phase (Labbé et al., 2004). Our measurements did not include anaphase, in which extensive spindle oscillation takes place. We quantified the positions of the centrosomes by using the GFP signal in GFP-tubulin– and GFP-histone–producing embryos (Fig. 2 A). Then, we calculated the micromovements of the centrosomes within a 4-s period (Fig. S2). A significant portion of the micromovements depended on Gα (P < 10−6) and, thus, likely reflected the cortical pulling forces (Fig. S1 C).
Figure 2.

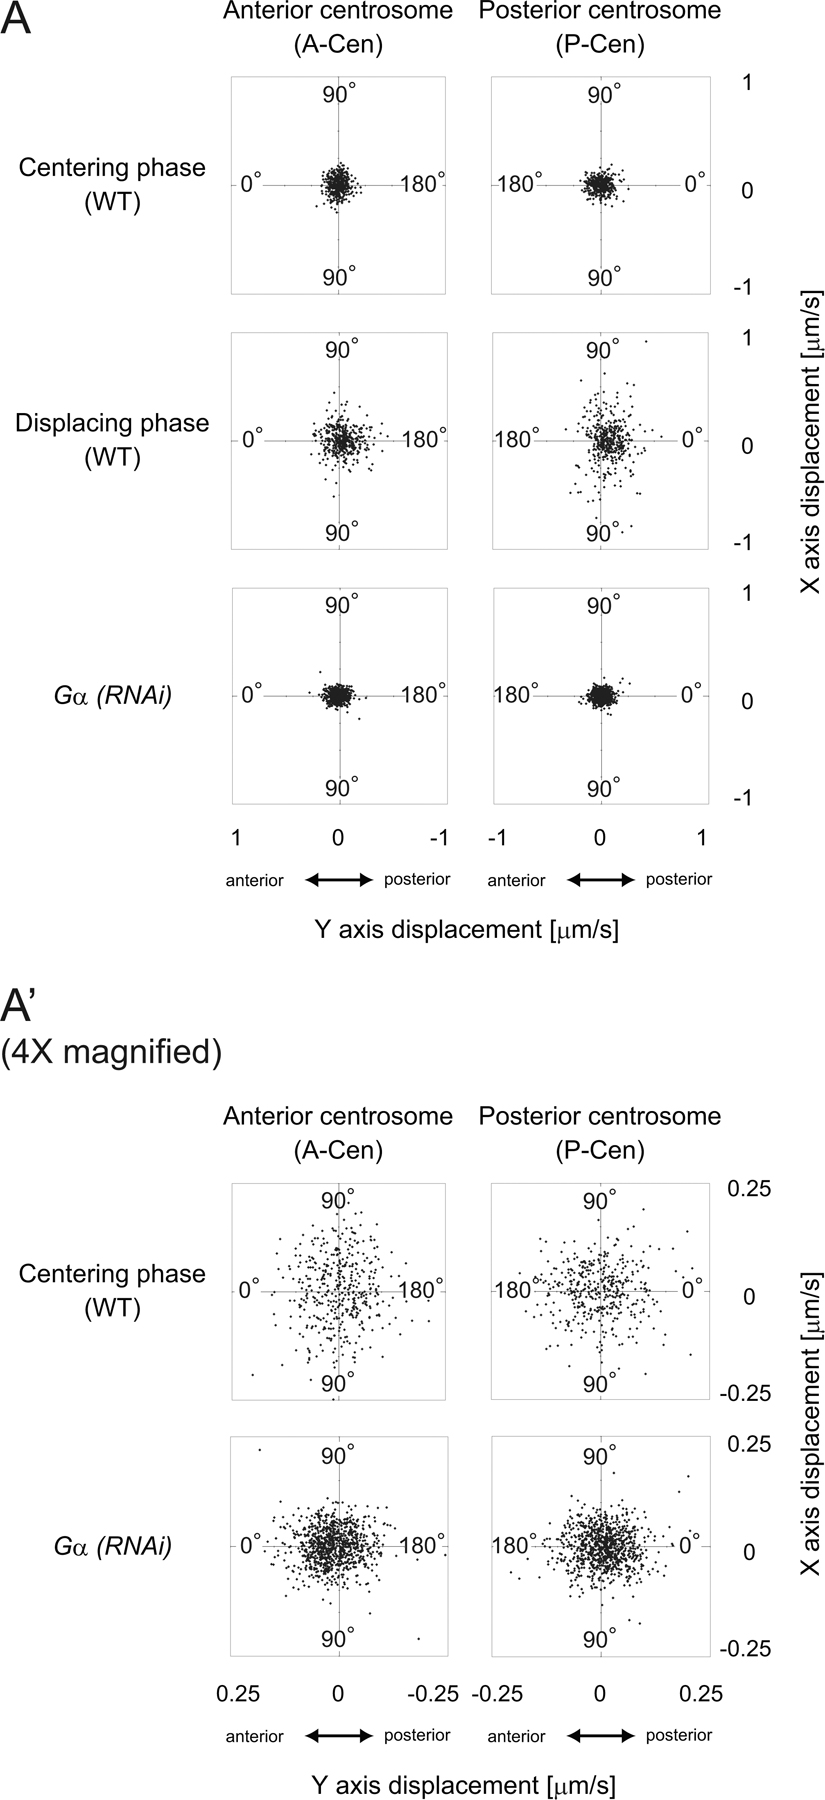
Comparison of micromovements during the centering and displacing phase. (A) Image processing to detect centrosomes and chromosomes (bottom) in images of GFP-tubulin and -histone embryos (top). Time is shown in minutes and seconds. (B) Micromovements were classified according to their angles to the AP axis (θ). (C) Posterior indexes (see Results and discussion) for each angle class. n = 13 for WT and n = 15 for Gα(RNAi). (D) Lateral components of the micromovements (V × sinθ). (E) Micromovements of the anterior centrosome (V × F A) and the posterior centrosome (V × F P) toward the polar regions (0–15°). Error bars represent SD. Bar, 10 μm.
To evaluate the spatial distribution of forces acting on the centrosomes, we focused on the balance of opposing micromovements. θ (0° ≤ θ ≤ 90°) is the angle of micromovement to the AP axis (Fig. 2 B). Micromovements with small and large θ should reflect the pulling forces toward the polar and lateral cortex, respectively. For every 15° of θ, we calculated a posterior index by dividing the mean velocity (V) of the micromovements scaled with the frequency of classification of micromovements in that class (F) exhibited by the posterior centrosome (V × F P) by that exhibited by both the anterior and posterior centrosomes (V × F A + V × F P; Fig. 2 C). An index of >0.5 indicates that the forces pulling posteriorly were stronger than that pulling anteriorly. The indexes in Gα(RNAi) embryos were ∼0.5 (Fig. 2 C, right), whereas those during the displacing phase in the WT (Fig. 2 C, middle) were >0.5 for all angle ranges. The results are consistent with current knowledge on displacing migration, thus supporting the validity of the analysis (i.e., PAR-2 and PAR-3 are distributed in the posterior and anterior halves of the cortex, respectively, and their distribution regulates the strength of the cortical pulling forces, which requires Gα activity; Grill et al., 2001; Colombo et al., 2003).
We analyzed the spatial distribution of forces acting on the centrosomes during the centering phase in WT (Fig. 2 C, left). The posterior index in the most polar direction (0–15°) was >0.5 (P = 5 × 10⁻⁴ compared with Gα(RNAi) embryos). The result is consistent with the fact that the polarized cortical pulling mechanism was active during the establishment stage of centering (Fig. 1). Interestingly, the index decreased as the direction became more lateral: the index was significantly lower than that during the displacing phase for all of the remaining directions (15–90°; P < 0.02) and was <0.5 for lateral directions (P = 0.07 for 60–75° compared with Gα(RNAi) embryos; Fig. 2 C). The result indicates two features during the centering phase. For the polar region, the force pulling posteriorly is stronger than that pulling anteriorly. For the lateral region, in contrast, the force pulling posteriorly is weaker than that pulling anteriorly. These two features may cancel out each other's effects on the net force along the AP axis. As a result, the net force pulling toward anterior and posterior is balanced out at the cell center.
The lower posterior indexes in the lateral region during the centering phase compared with those during the displacing phase (Fig. 2 C) were caused by the repression of forces toward the posterior but not by the activation of forces toward the anterior. We calculated the lateral components (the components perpendicular to the AP axis; V × sinθ) of the micromovements (Fig. 2 D). The lateral components of movement of the posterior centrosome were smaller than those of the anterior centrosome during the centering phase (P = 9 × 10⁻⁵), a finding that is consistent with the low posterior indexes in the lateral regions. The lateral components of movement of the posterior centrosome were significantly smaller during the centering phase than during the displacing phase (P = 10−6). In contrast, those of the anterior centrosome were no larger during the centering phase than during the displacing phase.
Repression of the pulling forces in the posterior half of the embryo during the centering phase is not restricted to the lateral region but is observed over the entire posterior half. Even at the posterior-polar region, micromovements are repressed during the centering phase compared with those in the displacing phase (P = 0.04; Figs. 2 E and S1 D). Repression at the posterolateral regions is prominent, as the forces are smaller than those in the corresponding anterior regions (Fig. 2, C [left] and D), and is critical to equilibration of the net forces along the AP axis at the center.
On the basis of these results, we propose that a local repression mechanism prevents posterior displacement of the centrosomes during the centering phase. By this local mechanism, the cortical pulling force toward the posterior half of the embryo is repressed during the centering phase compared with that during the displacing phase. This repression is prominent in the posterolateral region. The local repression mechanism creates equilibrium of the net force along the AP axis at the cell center. Therefore, the mechanism can account not only for the maintenance but also for the establishment of the central positioning of the centrosomes. Using computer simulations, we confirmed that the local repression mechanism was sufficient for the centrosomes to reach the cell center (Fig. 3 A). Despite the balance of the net forces at the center, the spatial distribution of the pulling forces is not symmetrical around the cell center during the centering phase. This asymmetry can explain the results of laser ablation experiments, which show that the movement of one centrosome upon ablation of the other is not symmetric between the anterior and posterior centrosomes in the maintenance stage (Labbé et al., 2004).
Figure 3.

Model of centering and displacing migration of centrosomes in C. elegans embryo. (A) Roles of three mechanisms in centering migration as examined by computer simulation (top). The bottom images are from real embryos expected to reflect the conditions in the top panels. The asterisks indicate centrosomes. The center-directed mechanism alone brings the centrosomes to the cell center (left), but addition of polarized cortical pulling mechanisms does not (middle). Further addition of a local repression mechanism brings the centrosomes to the center (right). Interestingly, we observed timely nuclear rotation when we included local repression in the model (right), which is consistent with the proposal made by Tsou et al. (2002). (B) Schematic outline and computer simulation of the proposed model. In the schematic outline (top), embryos (yellow ovals), centrosomes (blue stars), center-directed forces (green arrows), cortical pulling forces (red bars), and repression of cortical pulling forces (dashed red box) are indicated. The width of the red bar indicates the strength of the cortical pulling forces along the AP axis. During the displacing phase (right), the cortical pulling force is polarized and stronger toward the posterior half of the embryo. During the centering phase (left), the polarized cortical pulling mechanism is already active but is repressed in the posterior region and prominently in the posterolateral region. In computer simulation panels (bottom), each panel shows a snapshot of the simulation result (left) and movements in the real WT embryo (right). Asterisks indicate chromosomes. Time is shown in minutes and seconds. Bars, 10 μm.
We propose that inactivation of the local repression mechanism is involved in the switching of migration from centering to displacing. During the displacing phase, the local repression mechanism was lost: the micromovements toward the posterior half of the embryo were greater than those during the centering phase (Figs. 2, D and E; and S1 D). This increase was prominent in the lateral regions (Fig. 2, C and D). By using computer simulations, we confirmed that derepression of the pulling force toward the posterior cortex was sufficient for switching from centering to displacing migration (Fig. 3 B)
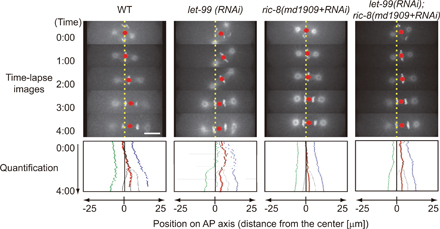
The molecular basis of local repression of cortical pulling likely involves let-99. LET-99 protein is enriched in the cortex with the peak at the posterolateral region (Tsou et al., 2002; Bringmann et al., 2007). The region enriched with LET-99 coincides with the region with prominent repression of cortical pulling forces. LET-99 represses Gα-dependent cortical pulling forces (Tsou et al., 2003). The phenotypes predicted by our model to be involved in loss of the local repression mechanism agreed well with those of let-99 mutant embryos (Fig. 3 A, middle). The centrosomes in the let-99 embryos fail to reach the cell center (Rose and Kemphues, 1998), and the let-99 embryos do not exhibit posterior-displacing migration. The final position of the centrosomes at cell division in the let-99 embryos is comparable with that in the WT, which experiences complete centering and displacing migration (Rose and Kemphues, 1998; Tsou et al., 2003). These observations strongly suggest that LET-99 is involved in local repression during the centering phase. The molecular bases of the inactivation of local repression are less clear. ric-8, a gene required for asymmetric cell division (Afshar et al., 2004; Couwenbergs et al., 2004), is a candidate for involvement in the inactivation because let-99 is epistatic to ric-8 in terms of the final position of the centrosomes before cell division (let-99, posterior; ric-8, center; let-99;ric-8, posterior; Fig. S3, available at http://www.jcb.org/cgi/content/full/jcb.200706005/DC1).
We propose that local repression of cortical pulling is the primary mechanism for switching between centering and displacing migrations of centrosomes in the single-cell–stage C. elegans embryo. The establishment of global polarity in advance of the migrations and the prevention of polarity-directed migration until a specific time by adjusting the force in local regions seem to be efficient strategies for the cell to accomplish prompt switching from the centering phase to the displacing phase. The polarized cortical pulling mechanisms are conserved among species (Reinsch and Gönczy, 1998; Vallee and Stehman, 2005). Local regulation of cortical pulling might be a mechanism conserved for precise regulation of the dynamic positioning of the centrosomes.
Materials and methods
Strains and manipulation of C. elegans
The Bristol N2 strain was used as the WT (Brenner, 1974). XA3501 (GFP-tubulin and -histone) and RM2209 (ric-8(md1909)) strains were distributed by the Caenorhabditis Genetics Center. RNAi was performed as described previously (Kimura and Onami, 2005). The templates for RNAi of dhc-1, par-2, and goa-1;gpa-16 were amplified from yk161f11, yk325e4 clones, and goa-1;gpa-16 cDNAs (Colombo et al., 2003), respectively. The knockdown of ric-8 was performed as described previously (Afshar et al., 2004).
Measurement of micromovement of the pronucleus–centrosome complex
Nomarski differential interference contrast images of embryos placed in M9 solution were obtained by using a microscope (DMRE; Leica) equipped with an HCX PL APO 100× 1.40 NA objective at 22°C. Digital images were acquired every 0.4 s with a CCD camera (Orca; Hamamatsu) controlled by IP Lab software (BD Biosciences). Image processing for objective measurement of the pronucleus–centrosome complex was performed as described previously (Kimura and Onami, 2005). A micromovement was quantified as the direction vector from the center of the nucleus at a given time point to that at 10 time points (4 s) later. The results obtained using other intervals are shown in Fig. S1. Micromovements during 20–80% of the overall migration of the nuclear–centrosome complex (from the posterior cortex to the cell center) were subjected to calculation of mean velocity and mean angle.
Measurement of micromovement of the centrosomes after NEBD
GFP-tubulin and -histone in GFP-expressing embryos placed in M9 solution were visualized using a spinning-disk confocal system (CSU21; Yokogawa) mounted on a microscope (BX51; Olympus) equipped with a UPlanApo 100× 1.35 NA objective at room temperature. Digital images were obtained every 2 s with a CCD camera (Orca-II-ER; Hamamatsu) controlled by IP Lab software. To detect centrosomes or chromosomes automatically independent of the quality of the images, several thresholds were applied for binarization, and the bright regions with areas from 100 to 999 pixels (1 pixel = 0.018 μm2) were selected as candidate regions. Tracking and calculation of micromovements were performed as in the aforementioned micromovement analysis of the pronucleus–centrosome complex. For Gα(RNAi), the whole phase from NEBD to onset of anaphase was calculated.
Significance test
We used the nonparametric version of one-way analysis of variance to predict the direction of the differences between two groups because there was no support for an assumption that the data followed a normal distribution (Barnard et al., 2001).
Computer simulations
Computer simulation of the dynamic positioning of the centrosomes in one-cell C. elegans embryos was performed as described previously (Kimura and Onami, 2005). The following modifications were introduced.
Parameter values used in the simulation are shown in Table S1 (available at http://www.jcb.org/cgi/content/full/jcb.200706005/DC1). The same values used in the previous study (Kimura and Onami, 2005) as standard conditions were used except for the following conditions. Values describing dynamic instability and the number of MTs were changed according to recent measurements (Srayko et al., 2005; Kozlowski et al., 2007). The speed of growth and shrinkage of an MT in the one-cell C. elegans embryo is ∼0.5 μm/s and 0.8 μm/s, respectively. The other values to describe dynamic instability of MTs (i.e., catastrophe and rescue rates) have yet to be measured in the embryo. Because the parameters describing dynamic instability of MTs are related to each other, we used a set of parameters measured under the same experimental conditions. Among those measurements, the MT growth speed given by Dhamodharan and Wadsworth (1995) was nearest to that observed in C. elegans embryos and was thus used in the simulation. Srayko et al. (2005) also reported that the number of MT fibers was ∼300. Thus, we increased the number of MT fibers to 208, which is a convenient number near 300, to distribute the MTs evenly within the two hemispheres around the centrosomes. The density of motors on the MTs and the probability that MTs reaching the cortex will encounter motors are not known. We first estimated the density of motors. Because this is the only uncharacterised parameter when cortical pulling forces are absent, we set the value to five/millimeter to make the speed of pronuclear migration in the simulation consistent with that in Gα(RNAi) embryos. The number of motors interacting with an MT was an integer and was calculated on the basis of the Poisson distribution. We next estimated the cortical pulling forces on the basis of the observation that the centrosomes are displaced from the center to ∼60% of the egg length by cortical pulling forces after metaphase. Because the ratio of pulling forces toward the anterior and posterior cortexes is ∼2:3 (Grill et al., 2003), we set the expected number of motors associated with an MT when it reaches the cortex at 0.8/s for the anterior cortex and at 1.2/s for the posterior cortex. The mechanism for local repression of cortical pulling was implemented by decreasing the expected number of motors at the posterior cortex linearly from 1.2/s at the pole to 0.4/s at the most lateral region.
Cortical pulling forces were introduced by assuming that an MT that reaches the cortex encounters force generators and is pulled. For simplicity, we assume minus end–directed motor as the force generator (Pecreaux et al., 2006; Couwenbergs et al., 2007; Nguyen-Ngoc et al., 2007). Introducing other force-generating mechanism, such as depolymerization of MTs (Kozlowski et al., 2007), would not affect the conclusions.
In addition to translational movements of the centrosome-containing complex (pronucleus or mitotic spindle; Kimura and Onami, 2005), we included rotational movements of the complex in the simulation. To obtain the rotational vector, ( ), in addition to the translational vector, (
 ), of the complex, the following set of simultaneous equations based on Stokes' law was solved:
 |
r is the Stokes' radius of the complex, and η is the viscosity of the cytosol. The right-hand sides of the equations are the net force vector or the net rotation moment (torque) vectors summing the contributions from each MT. Ni is the number of motors on the i-th MT. Fi is the pulling force generated by a motor acting on the i-th MT.  is a unit direction vector from the minus to plus end of the i-th MT.
  is a direction vector from the center of the centrosome-containing complex to the minus end (centrosome) of the i-th MT.
Fi was calculated as follows (Kimura and Onami, 2005): (1) if vi ≤ 0, then Fi = Fstall; (2) if 0 < vi ≤ Vmax, then Fi = Fstall (1 − vi/Vmax); (3) if vi > Vmax, then Fi = 0. Fstall is the stall force, and Vmax is the maximum velocity of minus end–directed motors. vi is the velocity of the motor on the i-th MT. Over a short period of time, Δt, the displacement of the motor on the i-th MT (Di) is given as follows:  , where
 |
 |
If α is small, cosα sinα can be approximated using Taylor expansion as cosα ≈ 1 − α2/2 +…≈ 1 and sinα ≈ α − α3/6 +…≈ α. Using this approximation, vi is expressed as follows:
 |
The equations were solved using the Newton-Raphson method for nonlinear systems of equations (Press et al., 1992).
Online supplemental material
Table S1 is a list of parameter values used in the simulation. Figs. S1 and S2 show controls and raw data of micromovement analyses. Fig. S3 shows centrosomal positioning after NEBD in WT, let-99, ric-8, and let-99;ric-8 embryos. Videos 1 and 2 show centering migration of the pronucleus–centrosome complex in WT (Video 1) and Gα(RNAi) (Video 2) embryos. Videos 3 and 4 show movement of centrosomes after NEBD during the centering phase (Video 3) and displacing phase (Video 4) in WT embryos. Online supplemental material is available at http://www.jcb.org/cgi/content/full/jcb.200706005/DC1.
Supplemental Material
Acknowledgments
Mutant strains were provided by the Caenorhabditis Genetics Center, which is funded by the National Institutes of Health. We are grateful to P. Gönczy for clones and discussions, Y. Kohara for clones, and F. Motegi and members of the Onami laboratory for discussions.
This study was supported by a KAKENHI (grant in aid for scientific research) on the Systems Genomics Priority Area, Special Coordination Funds for the Promotion of Science and Technology, and a Japan Society for the Promotion of Science fellowship (to A. Kimura) from the Ministry of Education, Culture, Sports, Science and Technology of Japan.
A. Kimura's present address is National Institute of Genetics, Mishima 411-8540, Japan.
Abbreviations used in this paper: AP, anterior-posterior; MT, microtubule; NEBD, nuclear envelope breakdown; WT, wild type.
References
- Afshar, K., F.S. Willard, K. Colombo, C.A. Johnston, C.R. McCudden, D.P. Siderovski, and P. Gönczy. 2004. RIC-8 is required for GPR-1/2-dependent Galpha function during asymmetric division of C. elegans embryos. Cell. 119:219–230. [DOI] [PubMed] [Google Scholar]
- Albertson, D.G. 1984. Formation of the first cleavage spindle in nematode embryos. Dev. Biol. 101:61–72. [DOI] [PubMed] [Google Scholar]
- Barnard, C., F. Gilbert, and P. McGregor. 2001. Asking Questions in Biology: Key Skills for Practical Assessments and Project Work. Pearson Education, New York. 190 pp.
- Brenner, S. 1974. The genetics of Caenorhabditis elegans. Genetics. 77:71–94. [DOI] [PMC free article] [PubMed] [Google Scholar]
- Bringmann, H., C.R. Cowan, J. Kong, and A.A. Hyman. 2007. LET-99, GOA-1/GPA-16, and GPR-1/2 are required for aster-positioned cytokinesis. Curr. Biol. 17:185–191. [DOI] [PubMed] [Google Scholar]
- Colombo, K., S.W. Grill, R.J. Kimple, F.S. Willard, D.P. Siderovski, and P. Gönczy. 2003. Translation of polarity cues into asymmetric spindle positioning in Caenorhabditis elegans embryos. Science. 300:1957–1961. [DOI] [PubMed] [Google Scholar]
- Couwenbergs, C., A.C. Spilker, and M. Gotta. 2004. Control of embryonic spindle positioning and Galpha activity by C. elegans RIC-8. Curr. Biol. 14:1871–1876. [DOI] [PubMed] [Google Scholar]
- Couwenbergs, C., J.C. Labbé, M. Goulding, T. Marty, B. Bowerman, and M. Gotta. 2007. Heterotrimeric G protein signaling functions with dynein to promote spindle positioning in C. elegans. J. Cell Biol. 179:15–22. [DOI] [PMC free article] [PubMed] [Google Scholar]
- Cowan, C.R., and A.A. Hyman. 2004. Asymmetric cell division in C. elegans: cortical polarity and spindle positioning. Annu. Rev. Cell Dev. Biol. 20:427–453. [DOI] [PubMed] [Google Scholar]
- Cuenca, A.A., A. Schetter, D. Aceto, K. Kemphues, and G. Seydoux. 2003. Polarization of the C. elegans zygote proceeds via distinct establishment and maintenance phases. Development. 130:1255–1265. [DOI] [PMC free article] [PubMed] [Google Scholar]
- Dhamodharan, R., and P. Wadsworth. 1995. Modulation of microtubule dynamic instability in vivo by brain microtubule associated proteins. J. Cell Sci. 108:1679–1689. [DOI] [PubMed] [Google Scholar]
- Dogterom, M., J.W. Kerssemakers, G. Romet-Lemonne, and M.E. Janson. 2005. Force generation by dynamic microtubules. Curr. Opin. Cell Biol. 17:67–74. [DOI] [PubMed] [Google Scholar]
- Gönczy, P., S. Pichler, M. Kirkham, and A.A. Hyman. 1999. Cytoplasmic dynein is required for distinct aspects of MTOC positioning, including centrosome separation, in the one cell stage Caenorhabditis elegans embryo. J. Cell Biol. 147:135–150. [DOI] [PMC free article] [PubMed] [Google Scholar]
- Gotta, M., and J. Ahringer. 2001. Distinct roles for Galpha and Gbetagamma in regulating spindle position and orientation in Caenorhabditis elegans embryos. Nat. Cell Biol. 3:297–300. [DOI] [PubMed] [Google Scholar]
- Goulding, M.B., J.C. Canman, E.N. Senning, A.H. Marcus, and B. Bowerman. 2007. Control of nuclear centration in the C. elegans zygote by receptor-independent G{alpha} signaling and myosin II. J. Cell Biol. 178:1177–1191. [DOI] [PMC free article] [PubMed] [Google Scholar]
- Grill, S.W., and A.A. Hyman. 2005. Spindle positioning by cortical pulling forces. Dev. Cell. 8:461–465. [DOI] [PubMed] [Google Scholar]
- Grill, S.W., P. Gönczy, E.H. Stelzer, and A.A. Hyman. 2001. Polarity controls forces governing asymmetric spindle positioning in the Caenorhabditis elegans embryo. Nature. 409:630–633. [DOI] [PubMed] [Google Scholar]
- Grill, S.W., J. Howard, E. Schaffer, E.H. Stelzer, and A.A. Hyman. 2003. The distribution of active force generators controls mitotic spindle position. Science. 301:518–521. [DOI] [PubMed] [Google Scholar]
- Hamaguchi, M.S., and Y. Hiramoto. 1986. Analysis of the role of astral rays in pronuclear migration in sand dollar eggs by the colcemid-UV method. Dev. Growth Differ. 28:143–156. [DOI] [PubMed] [Google Scholar]
- Hamahashi, S., S. Onami, and H. Kitano. 2005. Detection of nuclei in 4D Nomarski DIC microscope images of early Caenorhabditis elegans embryos using local image entropy and object tracking. BMC Bioinformatics. 6:125. [DOI] [PMC free article] [PubMed] [Google Scholar]
- Kellogg, D.R., M. Moritz, and B.M. Alberts. 1994. The centrosome and cellular organization. Annu. Rev. Biochem. 63:639–674. [DOI] [PubMed] [Google Scholar]
- Kemphues, K.J., J.R. Priess, D.G. Morton, and N.S. Cheng. 1988. Identification of genes required for cytoplasmic localization in early C. elegans embryos. Cell. 52:311–320. [DOI] [PubMed] [Google Scholar]
- Kimura, A., and S. Onami. 2005. Computer simulations and image processing reveal length-dependent pulling force as the primary mechanism for C. elegans male pronuclear migration. Dev. Cell. 8:765–775. [DOI] [PubMed] [Google Scholar]
- Kozlowski, C., M. Srayko, and F. Nedelec. 2007. Cortical microtubule contacts position the spindle in C. elegans embryos. Cell. 129:499–510. [DOI] [PubMed] [Google Scholar]
- Labbé, J.C., E.K. McCarthy, and B. Goldstein. 2004. The forces that position a mitotic spindle asymmetrically are tethered until after the time of spindle assembly. J. Cell Biol. 167:245–256. [DOI] [PMC free article] [PubMed] [Google Scholar]
- Nguyen-Ngoc, T., K. Afshar, and P. Gönczy. 2007. Coupling of cortical dynein and Galpha proteins mediates spindle positioning in Caenorhabditis elegans. Nat. Cell Biol. 9:1294–1302. [DOI] [PubMed] [Google Scholar]
- Pecreaux, J., J.C. Roper, K. Kruse, F. Julicher, A.A. Hyman, S.W. Grill, and J. Howard. 2006. Spindle oscillations during asymmetric cell division require a threshold number of active cortical force generators. Curr. Biol. 16:2111–2122. [DOI] [PubMed] [Google Scholar]
- Press, W.H., S.A. Teukolsky, W.T. Vetterling, and B.P. Flannery. 1992. Numerical Recipes in C: the Art of Scientific Computing. Cambridge University Press, Cambridge, UK. 994 pp.
- Reinsch, S., and P. Gönczy. 1998. Mechanisms of nuclear positioning. J. Cell Sci. 111:2283–2295. [DOI] [PubMed] [Google Scholar]
- Rose, L.S., and K. Kemphues. 1998. The let-99 gene is required for proper spindle orientation during cleavage of the C. elegans embryo. Development. 125:1337–1346. [DOI] [PubMed] [Google Scholar]
- Srayko, M., A. Kaya, J. Stamford, and A.A. Hyman. 2005. Identification and characterization of factors required for microtubule growth and nucleation in the early C. elegans embryo. Dev. Cell. 9:223–236. [DOI] [PubMed] [Google Scholar]
- Tsou, M.F., A. Hayashi, L.R. DeBella, G. McGrath, and L.S. Rose. 2002. LET-99 determines spindle position and is asymmetrically enriched in response to PAR polarity cues in C. elegans embryos. Development. 129:4469–4481. [DOI] [PubMed] [Google Scholar]
- Tsou, M.F., A. Hayashi, and L.S. Rose. 2003. LET-99 opposes Galpha/GPR signaling to generate asymmetry for spindle positioning in response to PAR and MES-1/SRC-1 signaling. Development. 130:5717–5730. [DOI] [PubMed] [Google Scholar]
- Vallee, R.B., and S.A. Stehman. 2005. How dynein helps the cell find its center: a servomechanical model. Trends Cell Biol. 15:288–294. [DOI] [PubMed] [Google Scholar]
Associated Data
This section collects any data citations, data availability statements, or supplementary materials included in this article.