

Abstract
αβ and γδ T cell lineages develop in the thymus from a common precursor. It is unclear at which stage of development commitment to these lineages takes place and in which way T cell receptor signaling contributes to the process. Recently, it was demonstrated that strong TCR signals favor γδ lineage development, whereas weaker TCR signals promote αβ lineage fate. Two models have been proposed to explain these results. The first model suggests that commitment occurs after TCR expression and TCR signaling directly instructs lymphocytes to adopt one or the other lineage fate. The second model suggests that commitment occurs before TCR expression and that TCR signaling merely confirms the lineage choice. By tracing the fate of single T cell precursors, this study shows that there is no commitment to either the αβ or γδ lineage before TCR expression and that modulation of TCR signaling in progeny of a single TCR-expressing cell changes lineage commitment.
T cells develop in the thymus from progenitors of bone marrow origin. Within the thymus, T cell precursors progress through a series of phenotypically distinct stages. Early double-negative (DN) precursors lack CD4 and CD8 expression. DN cells can be further subdivided on the basis of their differential CD44 and CD25 expression. The earliest T cell precursors in the thymus are contained within the CD44+CD25− DN1 subset. They progress through the cKit+CD44+CD25+ DN2 stage to become cKit−CD44−CD25+ DN3 cells. Genes encoding β, δ, and γ chains of the TCR rearrange in the DN2 and DN3 subsets. Thymocytes with productive Tcrb or Tcrd and Tcrg rearrangements express the pre-TCR or TCRγδ on their surface. The DN3 population is heterogeneous and contains at least two subpopulations. The majority of DN3 cells have not yet succeeded in TCR gene rearrangement sufficient for expression of either the TCRγδ or pre-TCR. These cells do not proliferate and are characterized by their small size and low level of CD27 expression and are known as DN3a cells (1). Once a cell succeeds in rearrangement of Tcrb or Tcrd and Tcrg genes, it expresses a TCR on its surface and starts to proliferate. For pre-TCR–expressing cells, this transition is called β selection. TCR-expressing cells that have increased cell size and up-regulate CD27 are known as DN3b cells (1). These cells down-regulate CD25 and progress to the CD44−CD25− DN4 stage. Thymocytes that select the αβ fate then become CD4+CD8+ double-positive (DP), whereas cells that choose the γδ fate do not progress through the DP stage as revealed by fate-mapping experiments (2). The progression to the DP stage is considered to represent an essential step of the αβ program and to mark an irreversible commitment to the αβ lineage.
Initially, αβ and γδ T cell lineages were defined on the basis of TCR expression. It became clear, however, that expression of a TCRγδ can drive cells to the DP stage, e.g., in TCRβ−/− (3) or pTα−/−, TCRα−/− (4) mice, whereas in another scenario, cells expressing a TCRαβ prematurely at the DN stage do not progress to the DP stage (5) and resemble, with the exception of TCR expression, phenotypically and functionally γδ lineage cells (5–7). Thus, αβ and γδ lineages are currently defined by whether or not cells progress to the DP stage, which is accompanied by the silencing of TCRγ expression, TCRα rearrangement, deletion of the TCRδ locus, and expression of the αβTCR on the cell surface.
Although the type of TCR does not play an absolutely deterministic role in lineage commitment, it clearly influences the outcome: pre-TCR expression appears to always result in αβ lineage development, whereas TCRγδ and a prematurely expressed TCRαβ are compatible with commitment to both αβ and γδ lineages (3–11). In fact, recent studies suggest that TCR signal strength, rather than the type of TCR, is crucial in this process by showing that strong TCRγδ signaling favors γδ and weak TCRγδ signaling favors αβ lineage development (10, 11).
Some experimental evidence is compatible with the notion that commitment to αβ and γδ lineages occurs before TCR expression at the DN2 stage (8, 12), and thus TCR signaling would only play a confirmatory role in commitment, whereby the cells that receive a “wrong” TCR signal die. An alternative model suggests that cells are not committed before TCR expression (i.e., before the late DN3 stage) and that TCR signaling directly instructs the fate decision (13). Neither model of commitment is presently in conflict with the bulk of experimental data (13, 14).
To test these hypotheses, we studied the lineage potential of early TCR-expressing thymocytes in the OP9-DL1 co-culture system. In this study, it is shown that TCRγδ+ DN3 cells that can give rise to both αβ and γδ lineages developed only into the γδ lineage when they received a strong signal from the TCR. In particular, the progeny of single TCRγδ+ DN3 cells that developed into the αβ lineage was diverted to the γδ lineage when a strong TCR signal was provided. Likewise, single-cell experiments with post–β-selection DN3b cells revealed that the majority of these cells were bipotent and could be deviated to become γδ lineage cells, which is in line with in vivo experiments showing that DN cells expressing a TCRαβ prematurely can become γδ lineage cells (5–7). We conclude that commitment to αβ and γδ lineages occurs after TCR expression and is instructed by TCR signals.
RESULTS
Immature TCRγδ+ thymocytes can give rise to both αβ and γδ lineages
In a first set of experiments, the αβ/γδ lineage potential of TCRγδ+ cells was analyzed. These experiments cannot distinguish whether the TCR has an instructive or confirmatory role in lineage commitment, but were set up to establish culture conditions and identify subsets of T cell precursors able to give rise to distinct lineages. To extend the notion that TCRγδ+ thymocytes can become αβ as well as γδ lineage cells (4), TCRγδ+ thymocytes were sorted and co-cultured with OP9-DL1 cells for 7 d, and their progression to the DP stage was analyzed as an indicator of αβ lineage choice. Mature TCRγδ+ T cells from the spleen were used as a control. 4% of cells derived from TCRγδ+ thymocytes exhibited the CD4+CD8+ phenotype, whereas no CD4+CD8+ cells were generated in cultures of TCRγδ+ splenocytes (Fig. 1 A).
Figure 1.

αβ lineage potential of immature TCRγδ expressing thymocytes. (A) TCRγδ+ cells derived from spleen (left) or thymus (right) of WT mice were co-cultured on OP9-DL1 monolayers. On day 7 of co-culture CD4 and CD8 expression was analyzed by flow cytometry. (B) Thymocytes from pTα−/− (middle and right) or TCRδ−/− (left) mice were stained with CD4, CD8, TCRγδ, CD25, and CD24 antibodies. TCRγδ+CD25+, TCRγδ+CD25−CD24hi, and TCRγδ+CD25−CD24lo cells were sorted from the thymi of pTα−/− mice. Post-sort reanalysis of TCRγδ+CD25+ cells is shown on the right. The applied gates are shown above each plot. Unstained thymocytes were used as negative control for CD24 staining (shaded). (C) Sorted subsets (as described in B) were co-cultured with OP9-DL1 in wells coated with anti-TCRγδ antibodies (C, bottom row) or in uncoated wells (C, top row). On day 5, cells were transferred to a fresh OP9-DL1 monolayer in uncoated wells. On day 8, cells were harvested and analyzed as in A. (D) 5,000 of the TCRγδ+CD25+ thymocytes were cultured on OP9-DL1 (left) or OP9-GFP (right) monolayers with (bottom) or without (top) anti-TCRγδ coating. On day 4, cells were transferred to a fresh feeder of the same type in uncoated wells. On day 8, cells were harvested and analyzed as in A. Absolute cell numbers are shown in red on the top of each plot. (E) TCRγδ+CD25+ thymocytes were cultured on an OP9-DL1 monolayer, as in D. CD24 expression on TCRγδ+ DN cells was analyzed on day 8 of culture. Unstained thymocytes were used as negative control for CD24 staining (shaded). Numbers in each gate indicate the percentage of cells.
TCRγδ+ thymocytes were then further subdivided into CD25+, CD25−CD24hi, and CD25−CD24lo subsets, reflecting different stages of maturity (Fig. 1, B and C), and analyzed for their ability to generate DP cells. To exclude any contribution of the pre-TCR, we performed these experiments with thymocytes from pre-TCRα chain (pTα)–deficient mice. Because some studies (15, 16), but not others (17), failed to document the existence of a TCRγδ+CD25+ (TCRγδ+ DN3) subset in the thymus, thymocytes from TCRδ knockout mice were used to control for the specificity of the TCRγδ staining (Fig. 1 B). Even though TCRγδ+CD25+ thymocytes could be detected in pTα knockout (Fig. 1 B) and wild-type mice (Fig. S1, available at http://www.jem.org/cgi/content/full/jem.20072425/DC1), the TCRγδ antibody did not stain thymocytes in TCRδ-deficient animals (Fig. 1 B), confirming the specificity of staining. DN3 cells represent the earliest DN subset with TCRγδ expression because DN2 cells are almost completely TCRγδ negative (Fig. S1). After co-culture with OP9-DL1 cells, the most immature TCRγδ+CD25+ (TCRγδ+ DN3) thymocytes (purity after sort is shown in Fig. 1 B) gave rise to DP cells most efficiently (with 42% of cells expressing CD4, CD8, or both), some TCRγδ+CD25−CD24hi cells were still capable of adopting the αβ fate (9% CD4/8-expressing cells after culture), whereas TCRγδ+CD25−CD24lo cells failed to progress to the DP stage (Fig. 1 C, top). Similar results were obtained with CD25+TCRγδ+ thymocytes from WT mice (Fig. S2). Thus, shortly after TCRγδ expression, immature thymocytes were still able to give rise to αβ lineage cells in cell culture, as well as in vivo (4), whereas this ability was gradually lost upon maturation. These results suggest that down-regulation of CD24 expression on CD4−CD8− TCR+ cells can serve as a marker for irreversible γδ lineage commitment. Also shown in Fig. 1 D is the observation that culture of TCRγδ+ DN3 cells on OP9-GFP monolayers lacking Notch ligands results in poor recovery of such cells, consistent with earlier findings that Notch signaling contributes to survival and proliferation of TCRγδ+ cells (9). Furthermore, such cells do not become CD4+8+, which is consistent with the notion that commitment of TCRγδ+ cells to the αβ lineage requires Notch signaling (9).
The analysis of DP cells derived from TCRγδ+ precursors shows that some of these cells express a TCRαβ on the cell surface (as do DP cells in pTα−/− mice [18]), as well as the CD8β chain, as bona fide DP cells do (Fig. 2, A and C). DP cells in such cultures could be detected for several weeks (Fig. 2 D and not depicted). Importantly, these DP cells were continuously generated from DN cells, as DN cells sorted from such cultures on day 14 were still able to give rise to DP cells (Fig. 2 D, right), whereas DP cells sorted at the same time point and placed on OP9-DL1 feeder were no longer detected after 4 d (not depicted). The DP cells had almost completely down-regulated the TCRγδ (Fig. 2 C), which is again consistent with the phenotype of DP cells in pTα−/− or even pTα−/−, TCRα−/− mice (5), the generation of which depends on TCRγδ expression by their precursors.
Figure 2.

Characterization of TCRγδ-driven αβ lineage cells. (A) Surface expression of CD4 and CD8α by ex vivo pTα−/− thymocytes (left) or by cells derived from TCRγδ+CD25+ pTα−/− thymocytes cultured for 8 d on OP9-DL1 monolayer (right). (B) CFSE dilution profiles of TCRγδ+CD25+ pTα−/− thymocytes cultured on an OP9-DL1 monolayer for 4 d with (red) or without (blue and green) TCRγδ antibody. Gated on all live cells (blue and red) or on CD4+CD8+ cells only (green). (C) Surface expression of TCRβ (left), CD8β (middle), and TCRγδ (right) on ex vivo (top) or generated in cell culture (as in A; bottom) pTα−/− DP cells (red). Unstained (for TCRβ and CD8β) thymocytes or thymocytes from Rag2−/− TCRβ transgenic mice (for TCR γδ) were used as negative control (shaded). TCRγδ expression on DN pTα−/− thymocytes is shown as positive control (dotted). (D, left) Kinetics of expansion and differentiation of TCRγδ+CD25+ pTa−/− in OP9-DL1 co-cultures. (D, right) CD4−CD8− cells were sorted from OP9-DL1 co-culture (no antibody) on day 14 and cultured for an additional 7 d. CD4/CD8 expression was analyzed.
It has been reported that strong TCR signaling favors the development of γδ lineage cells (10, 11). At least for some γδ T cell receptors, a stronger signal might be provided by ligands expressed on thymic stroma (10). We therefore tested whether the latter observation could be mimicked in the OP9-DL1 system by coating the wells with TCRγδ antibodies before plating irradiated OP9-DL1 feeder cells. Indeed, antibody-mediated cross-linking of the TCRγδ favored γδ lineage development, as DP cells disappeared from the cultures (Fig. 1, C and D, bottom).
All cells in the anti-TCRγδ–coated wells had down-regulated CD24 (Fig. 1 E), whereas only a relatively small fraction of the thymocytes in the uncoated wells were CD24lo, which is consistent with the notion that TCRγδ cross-linking commits cells irreversibly to the γδ lineage (Fig. 1 D). The absence of DP cells in antibody-coated wells cannot be explained by outgrowth of DN cells, as cell recoveries were only twofold higher in the presence of the antibody (Fig. 1 D). In OP9-GFP co-cultures, the TCRγδ antibody can compensate for the absence of Notch signaling by increasing cell numbers (Fig. 1 D). Fig. 2 B shows that CFSE-labeled DN3 TCRγδ+ cells divided on the OP9-DL1 monolayer and that division was further enhanced by the addition of the TCRγδ antibody. However, the DP cells generated in the absence of antibody represented the most divided cells (Fig. 2 B).
Importantly, DP cells did not reappear after transfer of cells to uncoated wells on day 5 (Fig. 1 C), indicating stable γδ lineage commitment rather than a transient delay in DP progression or temporary down-regulation of CD4 and CD8 molecules.
To exclude the possibility that antibody-stimulated γδ lineage cells suppress αβ lineage differentiation of co-cultured cells, we mixed WT CD45.2+ DN3b cells that progress very efficiently to the DP stage (1) with CD45.1 TCRγδ+ DN3 thymocytes from pTα-deficient mice at different ratios and co-cultured them on an OP9-DL1 monolayer in wells coated with TCRγδ antibodies (plates coated for 2 h with 0.01 μg/ml of the antibody). There was no inhibition of progression of CD45.2+ DN3b cells to the DP stage with increasing numbers of TCRγδ+ DN3 cells in culture (Fig. S3, available at http://www.jem.org/cgi/content/full/jem.20072425/DC1), and DP cells were still detectable when WT DN3b cells were cultured with TCRγδ+ DN3 cells at a ratio of 1:10. At higher concentrations of the antibody (0.1 μg/ml and higher), DP cells were reduced in numbers in the presence of TCRγδ+ thymocytes. This was likely caused by the killing of OP9-DL1 feeder cells by TCRγδ+ thymocytes (unpublished data). Thus, in all subsequent experiments, we coated plates for 2 h with 0.01 μg/ml of the TCRγδ antibody to avoid trans effects (no feeder cell death was observed in experiments with WT DN3b cells when 10 μg/ml of CD3 antibody was used for coating).
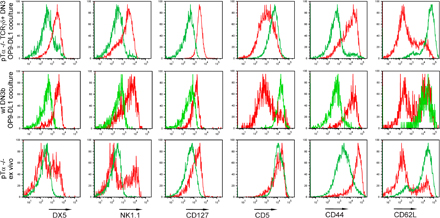
As there are no known markers that are cell autonomous with expression restricted to γδ lineage cells (19) (Supplemental text and Fig. S4, available at http://www.jem.org/cgi/content/full/jem.20072425/DC1), we compared the expression of a broad panel of surface antigens on ex vivo γδ lineage cells and γδ lineage cells generated in culture. CD24lo cells that are generated in culture and normally present in the thymus expressed some level of NKT cell markers (DX5 and NK1.1), high levels of CD127 (IL7Rα), and generally exhibited a phenotype of activated T cells (CD44hi CD62Llo) (Fig. S5). This expression profile is reminiscent of the phenotype exhibited by CD44+CD24− (“cluster B”) γδ thymocytes described by Prinz et al. (17), and it was shared by a subset of CD24lo cells developing in cultures in the absence of TCRγδ antibody (unpublished data). Notably, all TCRγδ+ cells assumed this phenotype in wells coated with TCRγδ antibodies, not only those converted away from the αβ lineage, indicating that this phenotype results from strong TCR signaling in all γδ thymocytes. In fact, previous data had shown that numbers of mature CD24lo γδ lineage cells were increased among TCRγδ transgenic cells when a cognate ligand was expressed in the thymus or on the stroma cells in fetal thymic organ culture (10), even though this was not observed with another transgenic TCRγδ (20). Thus, γδ lineage cells generated in the co-culture system share phenotypic properties with a subpopulation of γδ thymocytes and resemble NKT cells in some aspects of their surface phenotype.
γδ lineage cells generated in culture home to the intestinal epithelium
To further test how well γδ lineage cell development is recapitulated in the cell culture system, we performed adoptive transfer experiments with γδ cells generated in culture. To this end, 105 γδ lineage cells generated from Thy1.1 TCRγδ+ DN3 thymocytes in the presence of TCRγδ antibody were transferred into nude mice (Thy1.2), and their tissue distribution was analyzed 2 wk later. Few, if any, donor-derived cells were found in the spleen, LNs, and Peyer's patches of the recipient (Fig. 3 A). However, Thy1.1 cells were readily detected in the intraepithelial lymphocyte (IEL) compartment of the small intestine (Fig. 3 A). These cells maintained TCRγδ expression and the CD4−CD8− phenotype (Fig. 3 B and not depicted). As many of the γδ lineage cells in the gut are Thy1 negative, it is possible that the detected Thy1.1+ cells represent only a fraction of donor-derived cells. The epithelium of the small intestine is one of the major physiological locations for γδ lineage cells, where they comprise about half of the lymphocytes (21). Migration to the IEL is known to depend on specific chemoattracting signals (22). In accordance with this notion, no donor-derived cells were found among IELs when 106 splenic CD4 cells were used for the transfer Fig. 3 C. It is important to note that endogenous IELs are present in the intestinal epithelium of nude mice, albeit in reduced numbers. Approximately 35% of them are TCRγδ+ (not depicted). Thus, transferred cells are likely to compete for appropriate niches with endogenous γδ lineage IELs. The nude recipient mice contained relatively large numbers of Thy1.2-positive cells in IELs and PP, which may represent thymus-independent T cells or their precursors.
Figure 3.

γδ Lineage cells generated in culture home to the IEL compartment. (A and B) TCRγδ+CD25+ thymocytes form Thy1.1 BALB/c mice were sorted and co-cultured with OP9-DL1 in wells coated with anti-TCRγδ antibodies. On day 4, cells were transferred to a fresh OP9-DL1 monolayer in uncoated wells. On day 10, CD45+CD4−CD8− TCRγδ+ cells were sorted from the cultures and 105 cells were transferred intravenously into nude mice (Thy1.2). On day 14 after transfer, recipients were killed and the presence of donor-derived (Thy1.1+) cells among CD45+ cells in LNs, spleen, Peyer's patches (PP), and among IELs was analyzed (A). Expression of TCRγδ and CD4 on the donor-derived IELs is shown (B). (C) 106 of CD4+ splenocytes from Thy1.1 BALB/c mice were transferred intravenously into nude mice. No donor-derived IELs were found 14 d after transfer.
Overall, the data suggest that the co-culture system in the presence of TCRγδ antibodies recapitulates a process of γδ lineage cell generation in the thymus that is initiated by strong TCRγδ signaling.
Commitment to αβ and γδ T cell lineages can occur after TCR expression
The above experiments in bulk cultures were conducted to define culture conditions and kinetics to proceed with crucial single-cell experiments. Although the bulk culture experiments show that immature TCRγδ+ thymocytes can give rise to both αβ and γδ lineages and that αβ lineage development can be inhibited by TCRγδ cross-linking, these observations can still be explained by the precommitment model and hence are not decisive with regard to the issue of whether the TCR has a confirmatory or instructive role in lineage commitment. The only way to discriminate between these possibilities is to analyze whether the progeny of a single cell can be instructed by TCR signaling to adopt either lineage fate.
TCR signal strength represents an important factor in αβ versus γδ lineage development (10, 11). Because we start from cells that already express a TCRγδ, it is likely that TCR signal strength is “fixed” for the progeny of a single cell because all cells will express the same TCR. Therefore, it is likely that the progeny will behave uniformly and not exhibit the complete spectrum of differentiation potential of a heterogeneous TCRγδ+ population. To nevertheless reveal such potential, we altered the signal strength over time by antibody-mediated TCR ligation which favors γδ lineage development in a nonclonal population (Fig. 1). To this end, single thymocytes were sorted into the wells containing an OP9-DL1 monolayer.
To ensure that clones were derived from a single TCR-expressing cell, we verified the purity of the sort as described in Fig. 1 B. Furthermore, proper single-cell distribution was probed by distributing a 1:1 mixture of CD45.1 and CD45.2 DN3b cells into wells with an OP9-DL1 monolayer and analyzing clones 7 d later. As shown in Fig. 4, of 168 wells analyzed, not a single well contained a mixture of CD45.1 and CD45.2 cells, whereas only 11 wells contained no cells, confirming perfect single-cell distribution and a high cloning efficiency.
Figure 4.

Verification of single-cell sort purity. WT DN3b cells from CD45.2 and CD45.1 donors were sorted and mixed at a 1:1 ratio. Single cells from the mixture were sorted onto OP9-DL1 monolayers. On day 7, contents of each well were analyzed by FACS for surface expression of CD45.1 and CD45.2. 168 individual wells were analyzed. Number of wells containing no cells, CD45.1+ cells, CD45.2+ cells, or both (A) and representative FACS plots (B) are shown.
After single TCRγδ+ DN3 cells were distributed by the same procedure, each clone was divided into 3 parts after 7 d of culture. One part was analyzed for CD45, CD4, CD8, TCRβ, and TCRγδ expression, whereas the other two parts were transferred into TCRγδ antibody-coated or uncoated wells with an OP9-DL1 monolayer. On day 14, cells were harvested and analyzed by FACS for expression of markers as described above. Finally, cells from antibody-coated wells were transferred to uncoated wells on day 14 and analyzed by FACS on day 19 (Fig. 5 A). Note that the color code of the plates in Fig. 5 A is again used in the stainings in Fig. 5 (C and D).
Figure 5.

Commitment to αβ and γδ T cell lineages after TCR expression. (A) Single pTα−/− CD4−CD8−CD25hi TCRγδ+ cells were sorted onto OP9-DL1 monolayers. On day 7, the contents of each well were divided into 3 parts. One part was analyzed by FACS for surface marker expression (CD45, CD4, CD8, TCRγδ, and TCRβ), the other two parts were transferred to wells with fresh OP9-DL1 monolayers coated with TCRγδ antibodies or uncoated. On day 14 cells were again analyzed for surface marker expression, and cells from anti-TCRγδ–coated wells were further transferred to uncoated wells with fresh OP9DL1 monolayers and analyzed for marker expression on day 19. (B) The proportion of wells containing DN or both DN and DP cells is shown. Numbers represent percentages of particular wells among the total number of wells that contained CD45+ cells at any time point. (C) A representative well containing γδ lineage cells only is shown. CD4−CD8−TCRγδ+ cells are detected at least at one time point, and CD4+CD8+ cells are absent at all time points. (D) A representative well containing αβ and γδ lineage cells only is shown. CD4+CD8+ cells are present before anti-TCRγδ stimulation. Only CD4−CD8−TCRγδ+ cells are detected in the presence of anti-TCRγδ antibody and after its removal. Histogram below shows comparison of surface expression of TCRγδ on DN and DP cells in the same well on day 14 of culture without antibody. Numbers in quadrants indicate the percentage of cells. Red numbers above plots refer to absolute cell number.
In the experiment shown in Fig. 5, the cloning efficiency was 27% (a well was considered positive when CD45+ cells were detected during at least one point of the analysis). In 82% of all lymphocyte-containing wells, only TCRγδ+ CD4−CD8− (and sometimes a few TCRγδ+CD4−CD8+) γδ lineage cells were detected (Fig. 5, B and C). However, 18% of the wells contained CD4+CD8+ αβ lineage cells. After TCR ligation, every well analyzed contained only DN γδ lineage cells (Fig. 5, B and D), and DP cells never reappeared after transfer of DN cells to uncoated wells (Fig. 5 D). The TCRγδ was expressed on the surface of all DN cells from uncoated as well as coated wells, but was down-regulated on DP cells (Fig. 5 D), reflecting αβ lineage commitment that is associated with Tcrg locus silencing (23) and Tcrd locus deletion. From these experiments, we conclude that 18% of immature TCRγδ+ thymocytes that are capable of adopting the αβ lineage fate can be diverted by strong TCR signals to the γδ lineage, i.e., are not precommitted before TCR expression. As shown in Fig. 5 D, the absence of DP cells in antibody-coated wells cannot be explained by the outgrowth of DN TCRγδ+ cells, as cell numbers in wells with and without antibodies differed only slightly.
Strong TCR signals can divert WT DN3b cells to the γδ lineage
The fact that the majority of TCRγδ-expressing thymocytes displayed only γδ lineage potential may reflect properties of γδ TCRs. If so, the majority of TCRγδ-expressing cells received a sufficiently strong signal in vivo or in culture to commit to the γδ lineage. Because in the described experiment we only modulated weak TCRγδ signaling into strong TCRγδ signaling, it can only be tested whether TCRγδ-expressing cells that efficiently become αβ lineage cells in culture can be diverted to the γδ lineage by a strong TCR signal, and not vice versa.
To address the question of whether a larger proportion of cells generating αβ lineage cells can be converted to become γδ lineage cells, it was tested whether a subpopulation of DN3 cells that had progressed beyond the β-selection checkpoint (DN3b cells) and was reported to generate mostly αβ lineage cells (1) could be diverted by strong TCR signaling to assume the γδ lineage fate. DN3b (after β-selection) and DN3a (pre–β-selection) cells were sorted according to CD27 expression and cell size (Fig. 6 A and not depicted) and intracellular TCRβ chain expression was analyzed. More than 90% of DN3b cells were TCRβ+, whereas only 5% of DN3a cells expressed intracellular TCRβ (Fig. 6 B). Less than 1% of DN3b cells showed TCRβ surface expression (Fig. 6 C).
Figure 6.

WT DN3b cells give rise to DN TCR+ cells when a strong TCR signal is provided. (A) Sorting strategy for DN3a and DN3b cells. Gated on CD4−CD8−CD25+ cells. Additional forward scatter gating on small (DN3a) and large (DN3b) cells was applied (not depicted) (1). (B) Sorted DN3a (left) and DN3b (right) cells were stained for intracellular expression of TCRβ and TCRγδ. (C) Expression of NK1.1 and surface TCRβ on the cells in DN3b gate. (D, left) Kinetics of expansion and differentiation of DN3b cells in OP9-DL1 co-cultures. (D, right) CD4−CD8− cells were sorted from OP9-DL1 co-culture (no antibody) on day 14 and cultured for an additional 7 d. CD4/CD8 expression was analyzed. The CD8+CD4− subset is likely to represent immature single-positive population. Accumulation of these cells is often observed in OP9-DL1 co-cultures. (E) CFSE dilution profiles of DN3b thymocytes cultured on OP9-DL1 monolayer for 4 d with (red) or without (blue, green) CD3 antibody. Gated on all live cells (blue and red) or on CD4+CD8+ cells only (green). (F; left and middle columns). 1,000 of sorted DN3b thymocytes were cultured on OP9-DL1 monolayers in the presence (two middle rows) or absence (top row) of CD3 antibodies. On day 5, cells were transferred to uncoated wells containing fresh OP9-DL1 monolayers. On day 5 (left) and 8 (middle), CD4, CD8, TCRβ, TCRγδ, and CD24 expression was analyzed by flow cytometry. Absolute cell numbers are shown in red on top the plots. (F, right row) DN3b thymocytes from WT mice were cultured for 8 d on OP9-DL1 monolayers without CD3 antibody, and then transferred to a fresh monolayer with or without (top) of anti-CD3. Expression of surface markers was analyzed on day 14 as before. Unstained thymocytes were used as negative control for CD24 staining (shaded). Numbers in quadrants indicate percentage of cells.
When DN3b cells were cultured in OP9-DL1–containing wells coated with CD3 antibodies, the progression to the DP stage was severely inhibited (Fig. 6 F). A first set of experiments was conducted by culturing DN3b cells for 5 d in either the presence or absence of CD3 antibodies (Fig. 6 F, left column), and then for another 3 d in the absence of antibodies (middle column). In a second set of experiments, DN3b cells were cultured for 8 d in the absence of antibodies, and then for another 6 d in the presence or absence of CD3 antibodies (right column).
In all cases, addition of the antibody strongly inhibited CD4/CD8 DP development, but had a very different impact on TCR expression. Whereas early antibody addition yielded large numbers of TCR-negative cells, some TCRγδ-expressing cells and only low numbers of TCRαβ-expressing cells (third row, left and middle column), delayed addition of the CD3 antibody resulted in a majority of DN cells expressing TCRαβ (third row, right column). This indicates that when the CD3 antibody was added early, the cells did not have a chance to initiate TCRα rearrangement and to express a TCRαβ. The cells cultured for 8 d without the CD3 antibody did initiate TCRα rearrangement, such that the majority of DN cells at the end of the 14-d culture period (last 6 d in the presence of antibody) expressed a TCRαβ on their surface.
Only when DN3b cells were placed into antibody-coated wells immediately after their isolation did partial NK1.1 expression occur (Fig. S5). Both TCRγδ+ (not depicted) and TCRβ+ (Fig. S5) cells shared phenotypic characteristics with antibody-treated TCRγδ+ DN3 cells and a subset of ex vivo γδ lineage cells. Importantly, no NK1.1+ cells were found in ex vivo DN3b cells (Fig. 6 C), suggesting that the in vitro observations could not be accounted for by outgrowth of a preexisting NK1.1+ population.
All cultures contained similarly divided cells at day 4 (Fig. 6 E), whether cultured with or without antibodies and cells cultured in the presence of antibodies exhibited lower CD24 expression (Fig. 6 F, last row). The results suggest that the CD3 antibody interfered with the normal differentiation program of these cells, before or after TCRα rearrangement.
Partial inhibition of DP cell development by CD3 antibodies could also be observed when DN3 cells expressing transgenic TCRβ or TCRγδ chains were cultured in the presence of antibodies (Fig. S2).
Importantly, DN3b differentiation toward the αβ lineage was highly asynchronous. DP cells could be detected in DN3b cultures as early as on day 2 and could be found in the cultures for at least 3 wk (Fig. 6 D and not depicted). When DP cells were sorted ex vivo or from cultures and placed on OP9DL1 monolayer, no cells could be detected after 4 d, which is consistent with a notion that DP thymocytes have a short lifespan (24). At all time points analyzed, cultures without antibody consisted of a mixture of DN, immature single-positive, and DP cells (unpublished data). Thus, even after several days, cultures contained cells that did not progress to DP stage, and thus might not yet be αβ lineage committed.
The results obtained in bulk cultures of DN3b cells showing that these cells can adopt a γδ lineage phenotype after strong TCR signal are compatible with both TCR-instructed lineage diversion, as well as selection of a subpopulation of precommitted cells. As discussed above, the only way to address the question of commitment is to trace progeny of a single cell under similar conditions.
DN3b cells exhibited a high cloning efficiency (83.3%), with 92% of wells containing DP cells (Fig. 7 A) after OP9-DL1 co-culture, which is consistent with the notion that the vast majority of DN3b cells express the pre-TCR and, in the standard OP9-DL1 co-cultures, commit to the αβ lineage. The progeny of single cells were divided into 3 parts at day 7 of OP9-DL1 co-culture. The first part was used to analyze expression of CD45, CD4, CD8, TCRβ, and TCRγδ by FACS. The second and third parts were transferred to anti–CD3-coated or uncoated wells with an OP9-DL1 monolayer. These single-cell cultures, corresponding in timing and antibody addition to bulk cultures shown in Fig. 6 F, right column, were analyzed on day 14 and cells from antibody-coated wells were transferred to uncoated wells and analyzed 7 d later to ascertain stability of the phenotype in the absence of the antibody (day 21).
Figure 7.

WT DN3b clones can be diverted to the γδ lineage by strong TCR signaling. Single WT DN3b cells were sorted onto OP9-DL1 monolayers. On day 7, the contents of each well were divided into 3 parts. One part was analyzed by FACS for surface marker expression (CD45, CD4, CD8, TCRβ, and TCRγδ), and the other two parts were transferred to anti-CD3–coated or uncoated fresh OP9-DL1 monolayers. On day 14, cells were again analyzed for surface marker expression, and cells from coated wells were transferred to uncoated wells with fresh OP9-DL1 monolayers and analyzed for marker expression on day 21. (A) Proportion of wells according to progression to the DP stage. (B–D) Examples of wells containing αβ and γδ lineage cells.
8% of wells with growth contained no DP cells at any time of analysis (DN). 15% of wells contained DP cells on either day 7 or 14 in the absence of antibody, but no cells could be recovered at day 14 after addition of antibody (Fig. 7 A). The contents of the majority of wells were like the ones shown in detail in Fig. 7 (B–D), where DP cells were detected on day 7 and 14 in the absence of antibody, but only DN cells were detected in the presence of antibody. In 85% of wells, cells expressed TCRαβ only (Fig. 7 B), and 11% of wells contained both TCRαβ+ and TCRγδ+ cells (Fig. 7, C and D), whereas 2% contained TCRγδ DN cells only (not depicted). DN cells found in the wells in presence of anti-CD3 or after antibody withdrawal expressed TCRαβ or TCRγδ on their surface. Thus, the progeny of single DN3b cells can be diverted by strong TCR signaling to assume a stable DN TCR+ phenotype characteristic for γδ lineage cells that can express either an αβ or γδ TCR. In these cultures (as well as in bulk culture; Fig. 6 F), the recovery of cells in the presence of CD3 antibodies was generally lower than that in the absence of antibodies. This may be caused by the fact that the CD3 antibody induces apoptosis in CD4+8+ DP cells that develop from the DN3b cells. However, this cannot be the only reason why either in bulk cultures or in single-cell culture, mostly DN cells are observed at different time points (day 5–14) in wells containing CD3 antibodies. When such cultures were further propagated in the absence of CD3 antibodies, DP cells did not return, even though they were detected when DN cells from cultures that were kept without antibody for 14 d were sorted and recultured for an additional 7 d (Fig. 6 D, right). These results indicate that a strong TCR signal induces lineage conversion.
DISCUSSION
Although TCR signaling strength was shown to play a role in αβ versus γδ lineage development (10, 11), some studies have suggested that lineage commitment may occur before TCR expression.
Kang et al. (12) noticed that DN2 cells could be divided into two subpopulations on the basis of IL-7R expression. Although both populations could give rise to αβ (DP) and γδ lineage cells after intrathymic injection, the proportion of γδ lineage cells among donor-derived cells was higher after injection of IL-7R high than IL-7R low/negative population (12). If the observed bias was truly TCR independent, these data would suggest that commitment can occur before TCR expression, and thus is TCR independent. However, the IL-7R high population had more extensive Tcrd rearrangements (12); this fact alone could account for the observed bias.
Recently, Ciofani et al. (8) also addressed the issue of precommitment. They sorted single DN2 and DN3 precursor cells onto a monolayer of OP9-DL1 cells that can support αβ and γδ cell development (8). The progeny of a large proportion of single DN2 cells were capable of developing into both TCRαβ- and TCRγδ-positive cells. In contrast, single DN3 cells gave rise almost exclusively to either TCRαβ- and TCRγδ-positive cells. From these studies, the authors concluded that the branch point of αβ and γδ T cell lineages is at the late DN2 to DN3 developmental stages. As TCR surface expression takes place at the late DN3 (DN3b) stage, this conclusion could be consistent with a precommitment model. However, alternative explanations are possible. The cloning efficiency was relatively high for DN2 cells, but very low for DN3 cells. The majority of the DN3 population consists of nonproliferating TCR-less DN3a cells (1), whereas the minority belongs to the DN3b population, which already expresses a TCR and begins to proliferate (1). If in these experiments (8) the majority of clones came from TCR-expressing DN3b cells it would not be surprising that they are largely committed in terms TCR expression. This, however, does not necessarily mean that the cells are lineage committed, especially because the absence of CD4/CD8 expression analysis in these experiments makes it difficult to draw definitive conclusions in regard to αβ/γδ lineage commitment.
It was also suggested that as antigen receptors of cranial vertebrates represent a relatively recent evolutionary acquisition (25) and many cell fate decisions are guided by a limited set of evolutionarily more ancient molecular pathways such as Notch, BMP, Hh, or Wnt (26), they are likely to play a role in αβ versus γδ lineage commitment (27). Therefore, it was suggested that TCR signaling merely confirms lineage decisions that depend on other pathways (14).
The single-cell experiments described in this study show conclusively that developing thymocytes are not committed to either the αβ or γδ lineage before pre-TCR or TCRγδ expression. Our results show that the progeny of a single TCR-expressing cell (TCRγδ or pre-TCR) that would assume the αβ lineage fate can be diverted to the γδ lineage by strong TCR signaling, ruling out precommitment before TCR expression. Although other experiments on TCR-dependent lineage fate determination of the αβ and γδ lineages (10, 11) or CD4 and CD8 lineages (17) were compatible with a TCR-mediated instructive process, they did not rule out precommitment before TCR expression that needs to be confirmed by “matched” TCR signaling. Such a model of lineage commitment can only be conclusively disproved by single-cell experiments where changes in TCR signaling are shown to change the lineage fate within a single clone. Thus, our single cell data exclude the possibility that T lineage commitment occurs before TCR expression.
The results cannot be explained by selective outgrowth of certain cell types because the absolute cell numbers of bulk cultures or wells obtained from a single precursor are not compatible with selective outgrowth. Furthermore, co-culture experiments with TCRγδ-expressing cells and DN3b WT cells in the presence of TCRγδ antibodies do not show any inhibiting effect of the TCRγδ antibodies on the development of DP cells from DN3b precursors, even at high ratios of TCRγδ+ DN3 cells versus WT DN3b cells.
The DP cells derived from TCRγδ+ DN3 precursors appear to represent bona fide αβ lineage cells because they down-regulate TCRγδ expression, express CD8α and β chains, and some cells express an αβTCR on the cell surface. The frequency of such TCRαβ-expressing DP cells is lower than in WT mice because only a fraction of TCRγδ+ cells also express TCRβ chains (4). In fact, the DP cells developing from TCRγδ+ DN3 cells in cell culture resemble the DP cells developing from TCRγδ precursors in vivo in pTα−/− mice, but not in TCRβ−/−, TCRδ−/− mice, which cannot express either of the conventional TCRs. Our analysis focused on the lineage potential of TCRγδ+ DN3 cells because these are the earliest cells with a TCRγδ on the cell surface.
Because 18% of TCRγδ+ cells develop into the DP αβ lineage, thereby defeating the purpose of TCRγδ expression, we established a broader basis for lineage conversion using WT DN3b cells, the vast majority of which express pre-TCRs and are bound to develop into the DP αβ lineage because that appears to represent the only option of a pre-TCR–expressing cell. However, as earlier in vivo studies in TCR transgenic mice indicate, a strong TCR signal can interfere with this pathway and generate γδ lineage cells (6, 7) that do not pass through the DP stage (5). These in vivo experiments indicate that signal strength can influence lineage choice, but they cannot distinguish a TCR instruction model from a precommitment model. However, the single-cell experiments with DN3b cells make this distinction because they show that the lineage potential of the progeny of a single pre-TCR–expressing cell can be changed by a strong TCR signal that converts this cell into a γδ lineage cell. Again, absolute cell numbers in either bulk cultures or single-cell cultures are inconsistent with αCD3-induced outgrowth of γδ lineage cells. In fact, the notion that the time point at which these cells were exposed to a strong TCR signal decides whether the resulting DN cells express a γδTCR (early interference) or TCRαβ (late interference) strongly indicate that a developmental program is being changed rather than αβ lineage cells are simply being eliminated by this treatment; the early interference does not allow for TCRα rearrangement, whereas the late interference takes place when cells are already undergoing TCRα rearrangement, which results in DN TCRαβ+ cells with a very similar phenotype to the DN TCRαβ-positive cells that can be found in mice that express a transgenic TCRαβ prematurely (6, 7), diverting cells away from the αβ lineage. This is consistent with the notion that a 20-fold greater number of bone marrow cells from TCRαβ transgenic mice is required to produce an equal number of DP cells when compared with the number of WT bone marrow cells (28).
Thus, overall, the results obtained in cell culture are well mirrored by previously reported in vivo studies both in terms of development of DP αβ lineage cells from TCRγδ+ precursors, as well as interference with αβ lineage development by strong TCR signaling. The novel aspect of the analysis reported in this study is that single-cell experiments rule out a precommitment of αβ versus γδ lineage before TCR expression that is only confirmed by weak and strong TCR signaling, respectively.
MATERIALS AND METHODS
Mice.
pTα-deficient mice, Rag1−/− TCRγδ transgenic mice, and Rag1−/− TCRβ transgenic mice (previously described in [18], [9], and [29], respectively) and Thy1.1 BALB/c mice were bred and maintained in the animal facilities at the Dana-Farber Cancer Institute (DFCI). C57BL/6 and B6.TCRδ−/− mice were obtained from The Jackson Laboratory. NCr nude mice were obtained from Taconic. All mice were maintained in the specific pathogen–free animal facilities of the DFCI. All animal procedures were done in compliance with the guidelines of the DFCI Animal Resources Facility, which operates under regulatory requirements of the U.S. Department of Agriculture and the Association for Assessment and Accreditation of Laboratory Animal Care.
Flow cytometry and cell sorting.
mAbs specific for CD4 (RM4-5), CD8a (53–6.7), CD8b (H35-17.2), CD25 (PC61), CD44 (IM7), TCRβ (H57-597), TCRγδ (GL3), CD49b (DX5), NK1.1 (PK136), CD45.1 (A20), CD45.2 (104), CD45 (30-F11), CD24 (M1/69), CD5 (53–7.3), CD127 (A7R34), CD62L (MEL-14), Thy1.1 (HIS51), and Thy1.2 (53–2.1) were purchased from BD Biosciences or eBioscience and were used as biotin, FITC, PE, peridinin chlorophyll protein (PerCP), PerCP-Cy5.5, PE-Cy7, allophycocyanin (APC), APC-Cy7, or Pacific Blue conjugates. APC and APC-Cy7–conjugated streptavidin was used to reveal staining with biotinylated mAb. Flow cytometry was performed on a FACSCalibur, FACSAria, and LSR II (BD Biosciences). Data were analyzed with FlowJo software (Tree Star, Inc.). Intracellular staining was performed using Cytofix/Cytoperm kit (BD Biosciences). DN cells were enriched from total thymocytes of WT mice by staining cell suspensions with biotinylated antibodies to CD4 and CD8 molecules, followed by incubation with streptavidin-conjugated magnetic beads (Dynal) and magnetic bead depletion of CD4+/CD8+ cells. Enriched cell suspensions were surface stained with streptavidin-APC. Cells were sorted using a FACSAria. DN3b and TCRγδ+ DN3 populations were resorted; sorted cells were of ≥99% purity, as determined by post-sort analysis.
Adoptive transfers.
Cells from Thy1.1 donors were intraorbitally injected into nude mice as indicated. Mice were analyzed 2 wk after transfer by flow cytometry. Donor cells were distinguished from host cells by expression of Thy1.1 and absence of expression of Thy1.2.
Purification of intestinal IELs.
Small intestines were excised and flushed with PBS. Peyer's patches were removed. Intestines then were opened longitudinally, cut into 5–10-mm fragments, and rinsed 3 times with PBS. The fragments were incubated in PBS/10%FCS/5 mM EDTA at 37°C with shaking. The buffer was changed every 15 min, at a total of 4 times. Resulting supernatants were pooled, and IELs were enriched by 44/66% Percoll density gradient centrifugation. Cells were stained with indicated antibodies and analyzed by FACS. CD45 antibody was used to gate on IELs.
OP9 co-cultures.
OP9 bone marrow stromal cells expressing the Notch ligand DL-1 (OP9-DL1) and control OP9-GFP cells provided by J. Carlos Zúñiga-Pflücker (University of Toronto, Toronto, Canada) were maintained as previously described (30). For bulk OP9-DL1 co-cultures, precursors were plated at an initial density of 103–5 × 10⁴ onto subconfluent OP9 monolayers at 2 × 10⁴ cells/well in a 24-well plate. When indicated plates were coated with mAbs specific for CD3 (145-2C11; BD Biosciences; final concentration 10 μg/ml) or TCRγδ (clone UC7-13D5; BD Biosciences; final concentration 0.01 μg/ml) before OP9 cells were plated. In such experiments, OP9-DL1 cells were γ-irradiated (15 Gy) for both coated and uncoated wells. For single-cell experiments, cells were plated directly onto 96-well plates containing 4 × 10³ γ-irradiated OP9-DL1 cells (15 Gy) by a FACSAria cell sorter. All co-cultures were performed in the presence of 1 ng/ml IL-7 and 5 ng/ml Flt3L. Every 4 d, half of the medium was replaced with fresh medium containing 2 ng/ml IL-7 and 10 ng/ml Flt3L.
Real-time PCR.
Total RNA was prepared from sorted thymocyte and splenocyte populations using the RNeasy kit (QIAGEN) followed by DNase digestion (QIAGEN). cDNA was synthesized from total RNA using Superscript II reverse transcription and oligo(dT) (Invitrogen Life Technologies) according to the manufacturer's recommendations. Real-time RT-PCR was performed on an ABI PRISM thermal cycler (Applied Biosystems) using SYBR Green PCR core reagents (Applied Biosystems). Real-time RT-PCR primer set for sox13 was obtained from SuperArray. Oligonucleotide primer sequences for rgs1 and hprt1 were as follows: Rgs1-F, 5′-CACATCTGGAATCTGGGATG-3′; Rgs1-R, 5′-TAGTCCTCACAAGCCAACCAG-3′; Hprt1-F, 5′-AGTGTTGGATACAGGCCAGAC-3′; and Hprt1-R, 5′-CGTGATTCAAATCCCTGAAGT-3′ (31).
Online supplemental material.
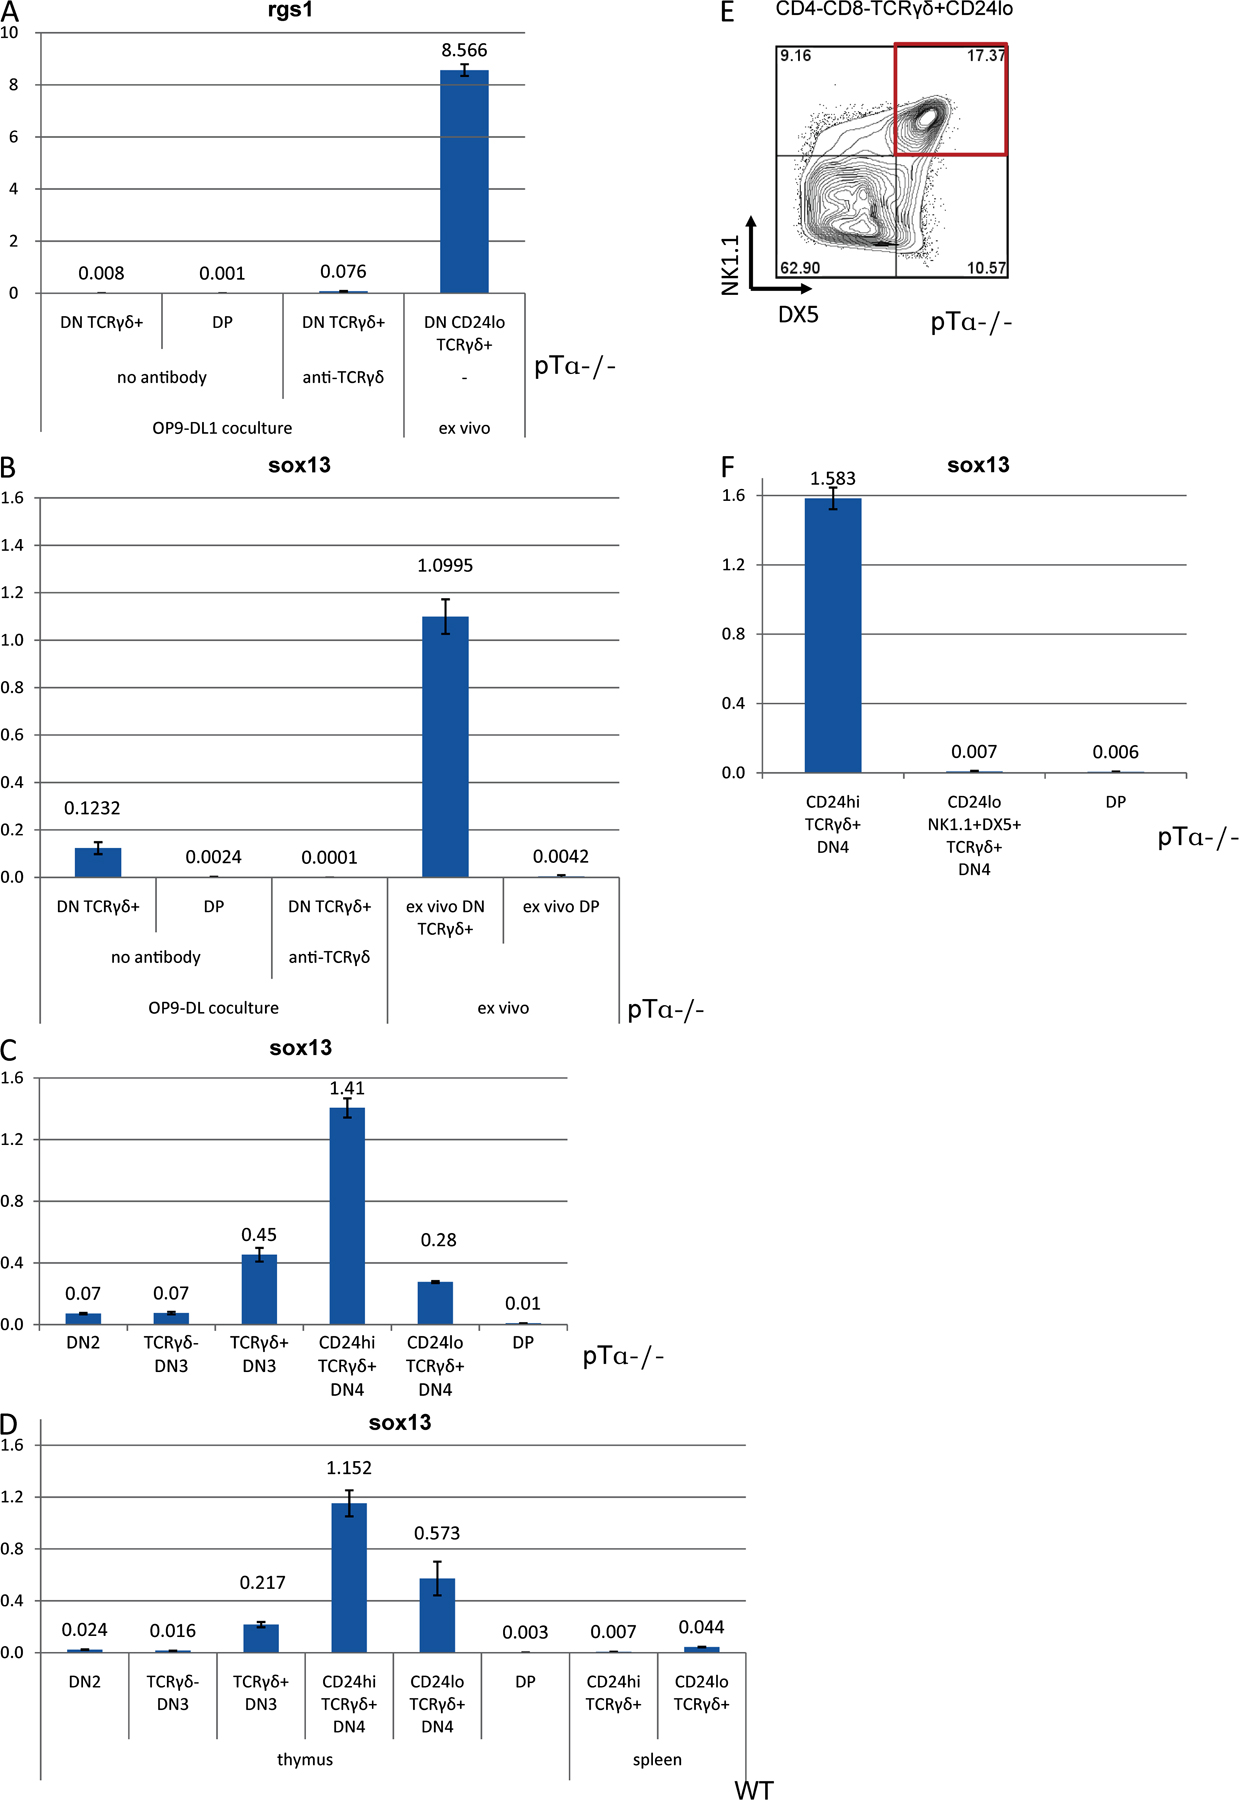
Fig. S1 shows that some DN3, but not DN2, thymocytes express TCRγδ. Fig. S2 shows that a strong TCR signal can inhibit progression of pTα-deficient, as well as WT and TCR-transgenic, thymocytes to the DP stage. Fig. S3 demonstrates that anti-TCRγδ–treated γδ lineage cells do not inhibit development of co-cultured αβ T cells. Fig. S4 demonstrates that sox13 and rgs1 are not relievable markers for γδ lineage cells. This result is discussed in the supplementary text. Fig. S5 compares the surface phenotype of γδ lineage cells generated in culture to their ex vivo counterparts. The online version of this article is available at http://www.jem.org/cgi/content/full/jem.20072425/DC1.
Supplementary Material
Acknowledgments
We would like to thank J.C. Zúñiga-Pflücker for providing reagents; N. Cohen and G. Turchinovich for critical reading of the manuscript; and M.L. Arcangeli, T. Heng, and D. Gray for helpful discussions. We are grateful to V. Schmidt for technical assistance and to L. Benson for editorial help.
These studies were supported by National Institutes of Health grant R01 AI45846.
The authors declare no competing financial interests.
Abbreviations used: APC, allophycocyanin; DN, double negative; DP: double positive; IEL, intraepithelial lymphocyte; pTα, pre-TCR α chain.
A.I. Garbe's present address is TU Dresden, Medical Faculty, MTZ, Institute of Physiological Chemistry, 01307 Dresden, Germany.
A. Krueger's present address is Institute of Immunology (OE5240), Hannover Medical School, D-30625, Hannover, Germany.
References
- 1.Taghon, T., M.A. Yui, R. Pant, R.A. Diamond, and E.V. Rothenberg. 2006. Developmental and molecular characterization of emerging beta- and gammadelta-selected pre-T cells in the adult mouse thymus. Immunity. 24:53–64. [DOI] [PubMed] [Google Scholar]
- 2.Eberl, G., and D.R. Littman. 2004. Thymic origin of intestinal alphabeta T cells revealed by fate mapping of RORgammat+ cells. Science. 305:248–251. [DOI] [PubMed] [Google Scholar]
- 3.Kang, J., M. Coles, D. Cado, and D.H. Raulet. 1998. The developmental fate of T cells is critically influenced by TCRgammadelta expression. Immunity. 8:427–438. [DOI] [PubMed] [Google Scholar]
- 4.Buer, J., I. Aifantis, J.P. DiSanto, H.J. Fehling, and H. von Boehmer. 1997. Role of different T cell receptors in the development of pre-T cells. J. Exp. Med. 185:1541–1547. [DOI] [PMC free article] [PubMed] [Google Scholar]
- 5.Egawa, T., T. Kreslavsky, D.R. Littman, and H. von Boehmer. 2008. Lineage Diversion of T cell receptor transgenic thymocytes revealed by lineage fate mapping. PLoS ONE. 3:e1512. [DOI] [PMC free article] [PubMed] [Google Scholar]
- 6.Bruno, L., H.J. Fehling, and H. von Boehmer. 1996. The alpha beta T cell receptor can replace the gamma delta receptor in the development of gamma delta lineage cells. Immunity. 5:343–352. [DOI] [PubMed] [Google Scholar]
- 7.Terrence, K., C.P. Pavlovich, E.O. Matechak, and B.J. Fowlkes. 2000. Premature expression of T cell receptor (TCR)αβ suppresses TCRγδ gene rearrangement but permits development of γδ lineage T cells. J. Exp. Med. 192:537–548. [DOI] [PMC free article] [PubMed] [Google Scholar]
- 8.Ciofani, M., G.C. Knowles, D.L. Wiest, H. von Boehmer, and J.C. Zuniga-Pflucker. 2006. Stage-specific and differential notch dependency at the alphabeta and gammadelta T lineage bifurcation. Immunity. 25:105–116. [DOI] [PubMed] [Google Scholar]
- 9.Garbe, A.I., A. Krueger, F. Gounari, J.C. Zuniga-Pflucker, and H. von Boehmer. 2006. Differential synergy of Notch and T cell receptor signaling determines αβ versus γδ lineage fate. J. Exp. Med. 203:1579–1590. [DOI] [PMC free article] [PubMed] [Google Scholar]
- 10.Haks, M.C., J.M. Lefebvre, J.P.H. Lauritsen, M. Carleton, M. Rhodes, T. Miyazaki, D.J. Kappes, and D.L. Wiest. 2005. Attenuation of gammadeltaTCR signaling efficiently diverts thymocytes to the alphabeta lineage. Immunity. 22:595–606. [DOI] [PubMed] [Google Scholar]
- 11.Hayes, S.M., L. Li, and P.E. Love. 2005. TCR signal strength influences alphabeta/gammadelta lineage fate. Immunity. 22:583–593. [DOI] [PubMed] [Google Scholar]
- 12.Kang, J., A. Volkmann, and D.H. Raulet. 2001. Evidence that γδ versus αβ T cell fate determination is initiated independently of T cell receptor signaling. J. Exp. Med. 193:689–698. [DOI] [PMC free article] [PubMed] [Google Scholar]
- 13.Garbe, A.I., and H. von Boehmer. 2007. TCR and Notch synergize in alphabeta versus gammadelta lineage choice. Trends Immunol. 28:124–131. [DOI] [PubMed] [Google Scholar]
- 14.Narayan, K., and J. Kang. 2007. Molecular events that regulate alphabeta versus gammadelta T cell lineage commitment: old suspects, new players and different game plans. Curr. Opin. Immunol. 19:169–175. [DOI] [PubMed] [Google Scholar]
- 15.Krotkova, A., E. Smith, G. Nerz, I. Falk, and K. Eichmann. 2004. Delayed and restricted expression limits putative instructional opportunities of Vgamma1.1/Vgamma2 gammadelta TCR in alphabeta/gammadelta lineage choice in the thymus. J. Immunol. 173:25–32. [DOI] [PubMed] [Google Scholar]
- 16.Wilson, A., M. Capone, and H.R. MacDonald. 1999. Unexpectedly late expression of intracellular CD3epsilon and TCR gammadelta proteins during adult thymus development. Int. Immunol. 11:1641–1650. [DOI] [PubMed] [Google Scholar]
- 17.Prinz, I., A. Sansoni, A. Kissenpfennig, L. Ardouin, M. Malissen, and B. Malissen. 2006. Visualization of the earliest steps of gammadelta T cell development in the adult thymus. Nat. Immunol. 7:995–1003. [DOI] [PubMed] [Google Scholar]
- 18.Fehling, H.J., A. Krotkova, C. Saint-Ruf, and H. von Boehmer. 1995. Crucial role of the pre-T-cell receptor alpha gene in development of alpha beta but not gamma delta T cells. Nature. 375:795–798. [DOI] [PubMed] [Google Scholar]
- 19.Pennington, D.J., B. Silva-Santos, J. Shires, E. Theodoridis, C. Pollitt, E.L. Wise, R.E. Tigelaar, M.J. Owen, and A.C. Hayday. 2003. The inter-relatedness and interdependence of mouse T cell receptor gammadelta+ and alphabeta+ cells. Nat. Immunol. 4:991–998. [DOI] [PubMed] [Google Scholar]
- 20.Schweighoffer, E., and B.J. Fowlkes. 1996. Positive selection is not required for thymic maturation of transgenic γδ T cells. J. Exp. Med. 183:2033–2041. [DOI] [PMC free article] [PubMed] [Google Scholar]
- 21.Hayday, A., E. Theodoridis, E. Ramsburg, and J. Shires. 2001. Intraepithelial lymphocytes: exploring the Third Way in immunology. Nat. Immunol. 2:997–1003. [DOI] [PubMed] [Google Scholar]
- 22.Wurbel, M.A., M. Malissen, D. Guy-Grand, E. Meffre, M.C. Nussenzweig, M. Richelme, A. Carrier, and B. Malissen. 2001. Mice lacking the CCR9 CC-chemokine receptor show a mild impairment of early T- and B-cell development and a reduction in T-cell receptor gammadelta(+) gut intraepithelial lymphocytes. Blood. 98:2626–2632. [DOI] [PubMed] [Google Scholar]
- 23.Ishida, I., S. Verbeek, M. Bonneville, S. Itohara, A. Berns, and S. Tonegawa. 1990. T-cell receptor gamma delta and gamma transgenic mice suggest a role of a gamma gene silencer in the generation of alpha beta T cells. Proc. Natl. Acad. Sci. USA. 87:3067–3071. [DOI] [PMC free article] [PubMed] [Google Scholar]
- 24.Huesmann, M., B. Scott, P. Kisielow, and H. von Boehmer. 1991. Kinetics and efficacy of positive selection in the thymus of normal and T cell receptor transgenic mice. Cell. 66:533–540. [DOI] [PubMed] [Google Scholar]
- 25.Cooper, M.D., and M.N. Alder. 2006. The evolution of adaptive immune systems. Cell. 124:815–822. [DOI] [PubMed] [Google Scholar]
- 26.Gerhart, J. 1999. 1998 Warkany lecture: signaling pathways in development. Teratology. 60:226–239. [DOI] [PubMed] [Google Scholar]
- 27.Melichar, H., and J. Kang. 2007. Integrated morphogen signal inputs in gammadelta versus alphabeta T-cell differentiation. Immunol. Rev. 215:32–45. [DOI] [PubMed] [Google Scholar]
- 28.Kisielow, P., H. Bluthmann, U.D. Staerz, M. Steinmetz, and H. von Boehmer. 1988. Tolerance in T-cell-receptor transgenic mice involves deletion of nonmature CD4+8+ thymocytes. Nature. 333:742–746. [DOI] [PubMed] [Google Scholar]
- 29.Dose, M., I. Khan, Z. Guo, D. Kovalovsky, A. Krueger, H. von Boehmer, K. Khazaie, and F. Gounari. 2006. c-Myc mediates pre-TCR-induced proliferation but not developmental progression. Blood. 108:2669–2677. [DOI] [PMC free article] [PubMed] [Google Scholar]
- 30.Schmitt, T.M., and J.C. Zuniga-Pflucker. 2002. Induction of T cell development from hematopoietic progenitor cells by delta-like-1 in vitro. Immunity. 17:749–756. [DOI] [PubMed] [Google Scholar]
- 31.Anrather, J., G. Racchumi, and C. Iadecola. 2005. cis-Acting Element-specific Transcriptional activity of differentially phosphorylated nuclear factor-{kappa }B. J. Biol. Chem. 280:244–252. [DOI] [PubMed] [Google Scholar]
Associated Data
This section collects any data citations, data availability statements, or supplementary materials included in this article.