Abstract
The temperature dependence of the dynamics of mesophilic and thermophilic dihydrofolate reductase is examined using elastic incoherent neutron scattering. It is demonstrated that the distribution of atomic displacement amplitudes can be derived from the elastic scattering data by assuming a (Weibull) functional form that resembles distributions seen in molecular dynamics simulations. The thermophilic enzyme has a significantly broader distribution than its mesophilic counterpart. Furthermore, although the rate of increase with temperature of the atomic mean-square displacements extracted from the dynamic structure factor is found to be comparable for both enzymes, the amplitudes are found to be slightly larger for the thermophilic enzyme. Therefore, these results imply that the thermophilic enzyme is the more flexible of the two.
INTRODUCTION
Protein function is commonly understood to depend both on the three-dimensional structure and the dynamics of the polypeptide chain. Further, it has been proposed that increased structural stability of proteins arises from increased rigidity, while increased flexibility may favor higher activity (1–3).
Proteins extracted from mesophilic and thermophilic organisms are interesting subjects for studying the relationships between protein structural stability, dynamics, and function (4,5). A structural comparison between mesophilic and thermophilic protein homologs has revealed that different protein families employ different structural mechanisms to adapt to higher temperatures, with the only systematic rule being an increase in the number of ion pairs with increasing growth temperature (6). This suggests that dynamics may play an important role in thermal stability.
Thermophilic enzymes, which are stable and catalytically active at higher temperatures than their mesophilic counterparts, have therefore been hypothesized to have higher rigidity and correspondingly lower activity than their mesophilic counterparts (7–10). According to this “corresponding state” hypothesis, at moderate temperature the thermophilic protein is less flexible than its mesophilic counterpart but both proteins exhibit the same flexibility when compared at their respective optimal growth temperature. However, some questions have been raised regarding the inverse relationship between activity and stability, as mediated by dynamics (2). For example, and in contrast to the above-mentioned studies, a higher structural flexibility on the picosecond timescale has been measured for a thermostable α-amylase as compared with its mesophilic counterpart (11,12). Moreover, a study at moderate temperature of the millisecond-timescale flexibility of rubredoxin from a hyperthermophile organism has provided no evidence that enhanced conformational rigidity underlies thermal stability (13). These seemingly contrasting findings underline the question raised above whether indeed dynamics plays a key role in the thermal adaptation of proteins, and whether this dynamics may be timescale-dependent.
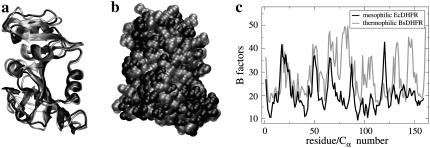
The protein studied here, dihydrofolate reductase (DHFR), is an enzyme important for cell growth. The structure and function of DHFR are well characterized, and DHFR from Escherichia coli (Ec) has become an important model for investigating the relationship between protein dynamics and catalytic function (14). Here, the dynamics of DHFR extracted from mesophilic Ec and from thermophilic Geobacillus stearothermophilus (Bs) are studied over a physiological temperature range (of Ec) on the sub-nanosecond timescale. Although motions on this timescale do not comprise the full range required for enzymatic function they are indicative of global flexibility. DHFR from Ec and Bs show closely similar overall and secondary structures as is shown in Fig. 1, a and b (15,16). However, the x-ray crystallographic B (or temperature) factors, which are indicative of equilibrium structural flexibility and are shown in Fig. 1 c, suggest that BsDHFR is, on average, more flexible than its mesophilic Ec counterpart.
FIGURE 1.
Structural comparison between mesophilic EcDHFR (solid representation) and thermophilic BsDHFR (shaded representation), (a) in cartoon and (b) in space-filling van der Waals representation. (c) The Cα-atom crystallographic B factors are plotted for both enzymes. The Ec and Bs structural coordinates and B factors were obtained from the Protein Data Bank (43) accession codes 2ANQ (16) and 1ZDR (15), respectively. Both structures were determined at the same temperature, 100 K.
The pico- to nanosecond timescale dynamics present in proteins can be determined using incoherent neutron scattering (INS) (17). INS has been extensively used to study the dynamics of proteins and, in particular, to characterize the temperature-dependent change in inferred dynamics that is often referred to as the dynamical transition (18). Much of the dynamical transition work has involved the examination of the elastic incoherent neutron scattering (EINS) from which the average atomic mean-square displacements (MSD) can be derived (19). The physical models used to interpret the experimental EINS data have been extensively tested using molecular dynamics simulations. It has been shown that dynamical inhomogeneity in a protein contributes significantly to EINS (20–22). Furthermore, diffusive protein motions and the finite energy resolution of the spectrometer also influence EINS (23–25). However, a method still commonly used to extract atomic fluctuations from experimental EINS data assumes that all atoms have the same, i.e., an average, fluctuation amplitude. To avoid using this oversimplified description, in this report a model based on a distribution function for the atomic fluctuations is proposed and used to analyze the experimental EINS data.
METHODS
Sample preparation
Chemicals
Deuterium oxide (D2O, 99.9% and 98%) was purchased from Minipul (Norell, Landisville, NJ). Reagents and medium components for the purification and the analysis of variant DHFRs were purchased from Sigma-Aldrich (St. Louis, MO) and Merck KgaA (Darmstadt, Germany).
Overexpression and purification of recombinant Ec and BsDHFR
Recombinant variants of EcDHFR (provided by Carston R. Wagner, University of Minnesota) and BsDHFR (provided by Judith Klinman, University of California at Berkeley) were purified from Ec cells (BL21 (DE3)) bearing the plasmid encoding for the DHFR genes, pTZwt1-3 and pET-21a, respectively. The EcDHFR variant was purified by a one-step procedure (26), using methotrexate affinity chromatography (Sigma, St. Louis, MO). The BsDHFR enzyme was first partially purified by heat denaturation (incubation 20 min at 55°C) and then subjected to anion exchange chromatography instead of affinity chromatography (27). Afterwards, a final ultrafiltration step (Amicon concentrator, YM-10 membrane; Amicon Plastics, Houston, TX) was carried out. Finally, the enzymes were lyophilized and kept at 4°C. Their purity was assessed by sodium-dodecyl-sulfate gel electrophoresis.
Neutron scattering sample preparation
The purified protein was dissolved in D2O (purity 98%) and gently stirred at room temperature overnight to replace the labile hydrogen atoms by deuterium and then freeze-dried. The operation was repeated two more times with higher grade D2O (purity 99.9%) and the sample was then freeze-dried and stored at 4°C until use. The dry enzyme (115 mg) was mixed into D2O (345 mg) as a homogenous highly-concentrated solution (300 mg protein/ml) in which protein translational and rotational diffusion is likely to be considerably lower than in a dilute solution. The samples were then sealed in a flat aluminum sample holder (dimension 0.4 × 30 × 50 mm3).
Neutron scattering, data acquisition, and processing
The neutron scattering experiments were performed on the IN13 backscattering spectrometer of the Institut Laue-Langevin (ILL) in Grenoble, France. This spectrometer is sensitive to the q-range 0.3 Å−1 ≤ q ≤ 5.5 Å−1, with an energy resolution of 8 μeV corresponding to observable motions on the timescale of 40–100 ps or faster.
Sample containers were mounted on a cryostat and cooled to 280 K at a rate of −5 K min−1. Scattering data were taken at 280 K and at intervals of 5 K to 305 K (heating rate +5 K min−1). At each temperature, the scattering intensity was integrated for 4 h (280 and 285 K) or 5 h (290–305 K) to ensure sufficient statistics. The weights of the sample containers were measured before and after the scattering experiment to ensure that no sample was lost during the experiment; no loss was detected.
The raw data were corrected for scattering of the empty sample container and pure solvent (D2O), detector response (by using a standard vanadium sample), and for self-absorption events (by using the transmission of the sample) using the softwares Capri and Elascan provided by the ILL for IN13 to obtain Sinc(q, 0;T) at various temperatures T.
Analysis of neutron scattering data
INS provides information on the self-correlations of atomic motions (28). Due to their large incoherent scattering cross-section, the scattering from hydrogens (1H) dominates the EINS from the present samples. For a Gaussian scatterer, the elastic incoherent scattering is given by (29)
 |
(1) |
where q is the momentum transfer of the scattered neutron, 〈Δr2〉(t) = 〈[R(t) – R(0)]2〉 is the time-dependent mean-square displacement (MSD) of the scatterer on the timescale of the instrument, and A is a constant amplitude. Note that the time-dependent MSD is related to the static thermal atomic mean-square position fluctuation by 
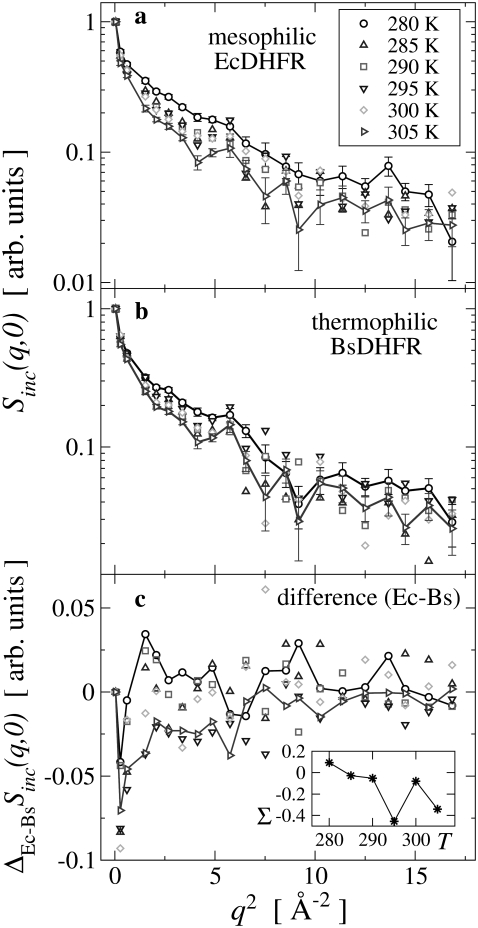
In a commonly-used method to extract the temperature-dependent atomic MSD from Sinc(q, 0), use is made of Eq. 1 and linear regressions are performed on log Sinc(q, 0) plotted against q2. However, as is shown in Fig. 2, the experimental log Sinc(q, 0) data is not linear over the full q2-range. This nonlinearity, which has also been reported in previous studies (18,30–32), may, in principle, be due to anharmonic motion and/or the presence of dynamical inhomogeneity, i.e., a distribution of MSD amplitudes. However, it has been demonstrated using molecular dynamics simulations that dynamic inhomogeneity is the major contributor (20,22,33,34). Furthermore, due to their large abundance in proteins, the (rotational) dynamics of methyl groups has recently been identified as contributing significantly to this dynamical inhomogeneity (32,35–38).
FIGURE 2.
Elastic scattering intensity, Sinc(q, 0) measured at various temperatures for (a) EcDHFR and (b) BsDHFR. For clarity, representative error bars are shown only for the 280 K and 305 K data. Connecting lines are drawn for convenience and the vertical axes are logarithmic. (c) The difference,  for each temperature; the inset shows the integrated difference, Σ(T) = ΣqΔEc–BsSinc(q, 0) plotted against temperature, T.
Whereas Eq. 1 is not applicable for anharmonic motions, in the case of dynamical inhomogeneity and assuming that the scattering from individual atoms can be described by Eq. 1, the observed Sinc(q, 0) is given by the sum
 |
(2) |
where NG is the number of distinct populations of Gaussian scatterers with MSD  A version of Eq. 2 has been used in the literature (30,31,39). to perform independent linear regressions to distinct q-regions. For instance, in Engler et al. (39). the authors used Eq. 2 to fit experimental data taken from Doster et al. (18) with NG = 3, but supplied the weights Ai. In doing so, the question arises of which number NG should be used to yield a physically meaningful description of the dynamics present while not overfitting the data. Here, a generalization of Eq. 2 is proposed by using the continuum limit,
 |
(3) |
where ρ(〈Δr2〉;α) is the distribution function of the MSD-amplitudes with a set of parameters α. In a recent molecular dynamics study it has been shown that the non-Gaussian behavior of the EISF of globular proteins can be well described using Eq. 3 (22).
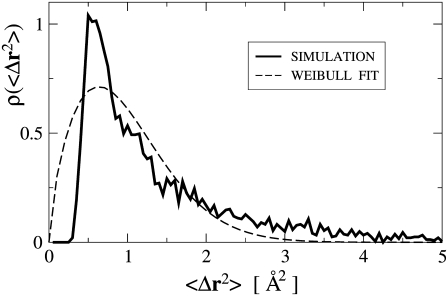
A priori, the functional form of ρ(〈Δr2〉) is not known. However, for a given system, ρ(〈Δr2〉) can be directly obtained from molecular dynamics simulation. In Fig. 3, ρ(〈Δr2〉) is shown derived from an MD simulation of a globular protein (40). The quantity ρ(〈Δr2〉) strongly increases at small values of 〈Δr2〉, has a single maximum at 〈Δr2〉 ≈ 0.5 Å2, and then decreases with a tail to zero for larger 〈ΔT2〉. Besides this shape description, any analytical function for ρ(〈Δr2〉;α must fulfill two other prerequisites. First, since 〈ΔT2〉 < 0 is unphysical, ρ(Δr2 < 0) ≡ 0, thus precluding the use of a Gaussian distribution. Second, the number of parameters α should be small enough to allow meaningful fitting and interpretation. Here, a Weibull distribution was chosen as the functional form, given by (41)
 |
(4) |
The parameters α and β determine the shape and the scale of the distribution, respectively. As an example, a fit to the simulated MSD data is also shown in Fig. 3. Although the height of the peak and the length of the tail in ρ(〈Δr2〉) are underestimated by the Weibull distribution, the general shape is reproduced. Equations 3 and 4 were used to fit the experimental Sinc(q, 0) in a least-squares sense,
 |
(5) |
The average root mean-square displacement  is then readily calculated from the distribution parameters (41),
 |
(6) |
where Γ(·) denotes the γ-function. To obtain an estimate of the error in μΔr, the fit was performed on 100 subsets of data points, randomly chosen from the full q-range with weights proportional to the inverse of their statistical error. Finally, note that for the limit α → ∞, the Weibull distribution Eq. 4 converges toward the Dirac distribution, such that the monodisperse Gaussian model is retrieved: With Γ(1) = 1, the limits for the mean and variance, b−2, become  and
and 
 |
respectively. Vanishing variance and normalization 1 are properties of the Dirac distribution, and it follows that 
FIGURE 3.
Distribution of atomic mean-square displacements from a molecular dynamics simulation of crystalline Staphylococcal nuclease calculated from a 1-ns trajectory and with Δt = 40 ps corresponding to the IN13 energy/time resolution. Simulation details are described elsewhere (40). The simulation data is fitted using a Weibull distribution, Eq. 4, with the parameters α = 1.68 and β = 1.09.
RESULTS
In Fig. 2 are plotted log Sinc(q, 0) against q2 for mesophilic and thermophilic DHFR at all temperatures studied (280–305 K) and over the full q-range. For comparison, for each enzyme, the data are normalized such that for the lowest q-value Sinc(q2 = 0.038 Å−2, 0) = 1 at all temperatures. With increasing temperature, the average slope in the scattering intensity increases for both samples, indicating an increase with temperature in the structural flexibility. The difference in scattering intensity from the Ec and Bs samples at all temperatures is plotted against q2 in Fig. 2 c. The figure shows a significant difference in low-q scattering (q2 ≲ 6 Å−2), whereas the differences at larger q are somewhat smaller. The inset to Fig. 2 c shows that the integrated difference depends on temperature.
For both DHFR samples and all temperatures, log Sinc(q, 0) versus q2 clearly deviates from linearity (Fig. 2, a and b), indicating the presence of anharmonic dynamics and/or dynamical inhomogeneity. Here, the analysis is performed assuming the validity of the Gaussian approximation but explicitly considering dynamical inhomogeneity, modeled by a Weibull distribution for the atomic displacements. The following analysis utilizes only the elastic scattering data to study differences in the intramolecular flexibility between the two enzymes. In principle, translational and rotational diffusive whole-molecule motions are also present and will contribute to the elastic intensity in the back-scattering regime (19,42). However, the proteins Ec and BsDHFR have very similar mass (18.0 kDa and 18.7 kDa, respectively) and three-dimensional structure/shape (Fig. 1, a and b), which determine the whole-molecule diffusive dynamics. Therefore, differences in the elastic scattering can, to a good approximation, be attributed to differences in the protein-internal dynamics.
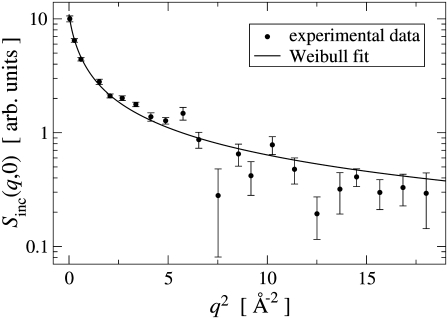
A realistic description of the elastic scattering within the framework of the Gaussian approximation is given by Eq. 3. An example of the analysis of experimental data using the Weibull model, i.e., Eqs. 3–5, is presented in Fig. 4 and found to reproduce Sinc(q, 0) reasonably well over the full q-range. In particular, the Weibull model provides an excellent fit to the data for q2 < 6 Å−2, where log Sinc(q, 0) versus q2 is strongly nonlinear and the commonly-used analysis method using only Eq. 1 is inadequate.
FIGURE 4.
Example fit of the Weibull model, Eqs. 3–5, to the experimental elastic scattering data for thermophilic BsDHFR at 300 K over the full q-range. The vertical axis is logarithmic.
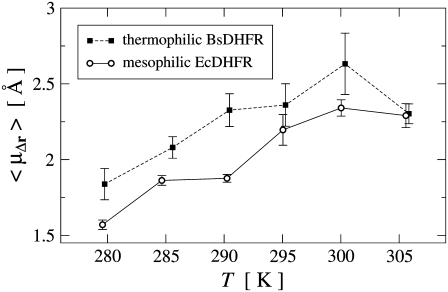
Using Eqs. 3–5, the average RMS-displacements, μΔr(T) were determined for both mesophilic Ec and thermophilic BsDHFR and are shown in Fig. 5. For both enzymes, μΔr(T) significantly, and roughly linearly, increases with increasing temperature, with an approximately equal rate of increase. The BsDHFR data point at 305 K appears anomalous. If this point is not considered, the slope of μΔr(T) is the same for Ec and BsDHFR, being 0.036 ± 0.005 Å K−1 and 0.037 ± 0.004 Å K−1, respectively.
FIGURE 5.
Temperature dependence of the average RMS-displacements μΔr obtained by fitting the Weibull model, Eqs. 3–5, to the experimental EISF data. Error bars denote the standard deviation for 100 fits to data subsets as described in the text. Lines connecting data points are drawn for convenience.
At a given temperature, μΔr(T) is somewhat larger for the thermophilic BsDHFR, implying that the thermophilic enzyme is more flexible than its mesophilic counterpart. However, μΔr(T) provides only an average, i.e., an overall figure that relates to the protein flexibility. In the following, therefore, the utility of the Weibull model is demonstrated by directly visualizing the estimated distributions of atomic fluctuation amplitudes.
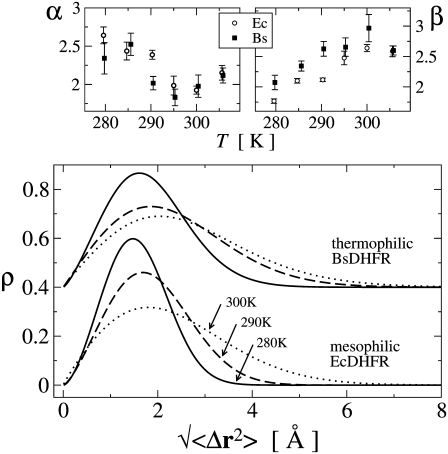
In Fig. 6 are shown the temperature-dependent distributions, ρ(Δr) of displacement amplitudes for both enzymes. The temperature dependence of ρ(Δr) is similar for both enzymes. For both systems with increasing temperature the distribution ρ(Δr) becomes broader and the maximum shifted to larger displacement amplitudes. However, this behavior is significantly stronger for the thermophilic BsDHFR, for which the distribution ρBs(Δr) is significantly broader than ρEc(Δr). Furthermore the shift of the distribution maximum is larger for the thermophilic BsDHFR: the maxima for ρBs(Δr) and ρEc(Δr) are at 1.6 Å and 1.5 Å, respectively, at 280 K but 2.1 Å and 1.8 Å at 300 K.
FIGURE 6.
(Top) Fit parameters α and β for the Weibull model plotted against temperature. (Bottom) Average Weibull-distributions of RMS-displacements for mesophilic EcDHFR and thermophilic BsDHFR at 280 K (solid line), 290 K (dashed line), and 300 K (dotted line). For convenience, the profiles for BsDHFR are vertically shifted by 0.4.
Fig. 6 also shows the temperature dependence of the Weibull fit parameters α and β. The shape parameter α is similar for both enzymes and decreases with increasing temperature for T < 300 K, indicating a longer tail in the distribution, ρ. The average root mean-square displacement, μΔr, is only slightly affected by the variation of α in this parameter range. However, μΔr is directly proportional to the scale parameter β. The value β is significantly larger for the thermophilic enzyme, indicating that ρBs is broader than ρEc. For both enzymes, β increases with increasing temperature. Thus, while the distributions of atomic fluctuations have approximately the same shape (determined by α) for both enzymes, the scale or width (determined by β) is larger for the thermophilic protein. With increasing temperature, the distributions for both enzymes become longer-tailed, reflecting that large-scale atomic fluctuations become more likely.
DISCUSSION AND CONCLUSION
The sub-nanosecond dynamics of mesophilic and thermophilic dihydrofolate reductase are studied here using elastic incoherent neutron scattering. The scattering data were analyzed using a model based on the Gaussian approximation (quasi-harmonic dynamics) that explicitly incorporates dynamical inhomogeneity using a distribution of atomic displacement amplitudes. Here, a Weibull function was used to model this distribution and the experimental scattering data were well reproduced over the full accessible q-range. In comparison, the commonly-used analysis method based on only one average fluctuation amplitude for all atoms, Eq. 1, typically needs to be restricted to certain q-ranges and, in particular, is incapable of reproducing Sinc(q, 0) for the present samples at small q.
For mesophilic E. coli DHFR the average RMS-displacements, μΔr(T), increase from 1.6 Å at 280 K to 2.3 Å at 305 K. Over the temperature range studied here, μΔr(T) of EcDHFR increases approximately linearly with temperature. For thermophilic G. stearothermophilus DHFR μΔr(T) increases from 1.8 Å at 280 K to 2.6 Å at 300 K. The decrease of μΔr(T) in the last temperature step at 305 K appears anomalous and may be erroneous. However, considering the relatively large uncertainty for the 300 K μΔr-value, a flattening of μΔr(T) for T ≲ 295 K is also compatible with the experimental data.
A particular advantage of this analysis method, i.e., the Weibull model, is that the distribution of atomic fluctuation amplitudes can be estimated. Although the Weibull model has only two adjustable parameters, the combination of a power law and an exponential function confers versatility on the distribution profile. Furthermore, a comparison between the results for μΔr(T) and ρ(T) in Figs. 5 and 6 shows that, due to the tail in the distribution ρ, μΔr is generally larger than Δrmax, i.e., the position of the maximum in ρ. This also illustrates the difficulty of using only one single value (or moment) to characterize the distribution of atomic fluctuation amplitudes. For a strongly skewed ρ, the average fluctuation amplitude can be significantly different from the value where ρ is maximal. The ambiguity in distinguishing the contributions of protein-internal and whole-molecule dynamics to the elastic scattering remains but can, in principle, be alleviated by exploiting the quasielastic scattering (42). This suggests an analysis method combining distribution functions for the amplitudes of internal fluctuations with rigid-body displacements for whole-molecule translation and rotation.
A further finding concerns the shape of the distribution of atomic displacement amplitudes. These results indicate that this is broader for the thermophilic enzyme. The significance of this is that it suggests that a larger proportion of atoms in the thermophilic enzyme fluctuate with high amplitude. For example, in the distributions at 290 K, 17% of the atoms in the thermophilic enzyme fluctuate with Δr > 3.5 Å whereas this value is 4% for the mesophilic species. One can speculate that this highly-mobile fraction might involve the relatively nonstructured loops of the protein, thus preserving a relatively rigid functional core at higher temperatures. This hypothesis is supported by the observation that the offset between the μΔr(T)-slopes for EcDHFR and BsDHFR in Fig. 5 is ≈7 K, whereas their optimal growth temperatures differ by ≈15 K. Testing such hypotheses will become possible with specific deuteration and facilitated by the coming on line of next-generation neutron sources, such as the Spallation Neutron Source at Oak Ridge National Laboratory.
Finally, the biological relevance of the results for mesophilic and thermophilic protein dynamics is addressed. The importance of protein rigidity for structural stability has been discussed previously (1–3), but the question arises as to whether rigidity should refer to smaller displacements or a smaller change in displacements with increasing temperature. This report finds the increase in flexibility with increasing temperature to be similar for both enzymes, whereas the fluctuation amplitudes are found to be slightly larger for the thermophilic enzyme. This suggests that thermophilic BsDHFR is intrinsically more flexible than its mesophilic counterpart EcDHFR. The greater flexibility of the thermophilic enzyme may permit the larger fluctuation amplitudes at higher temperatures to be more easily accommodated within the native structure. Further studies on different proteins will be required to ascertain whether this is a general characteristic of mesophilic and thermophilic counterpart proteins.
Acknowledgments
We thank Dr. V. Kurkal-Siebert for helpful discussions. We also thank an anonymous referee for pointing out the relationship between the Weibull and Dirac distributions.
We gratefully acknowledge supply of sample material by Drs. C. R. Wagner and J. Klinman, help from Drs. F. Natali and M. Bée at IN13, and support from the ILL.
Lars Meinhold's present address is California Institute of Technology, Physical Biology Center for Ultrafast Science and Technology, 1200 East California Boulevard, Pasadena, CA 91125.
Editor: Helmut Grubmuller.
References
- 1.Daniel, R. M. 1986. Protein structure, folding and design. In UCLA Symposia on Molecular and Cellular Biology, New Series, Vol. 39. D. L. Oxender, editor. A. R. Liss, New York.
- 2.Jaenicke, R. 2000. Do ultrastable proteins from hyperthermophiles have high or low conformational rigidity? Proc. Natl. Acad. Sci. USA. 97:2926–2964. [DOI] [PMC free article] [PubMed] [Google Scholar]
- 3.Arnold, F. H., P. L. Wintrode, K. Miyazaki, and A. Gershenson. 2001. How enzymes adapt: lessons from directed evolution. Trends Biochem. Sci. 26:100–106. [DOI] [PubMed] [Google Scholar]
- 4.Scandurra, R., V. Consalvi, R. Chiaraluce, L. Politi, and P. C. Engel. 1998. Protein thermostability in extremophiles. Biochimie. 80:933–941. [DOI] [PubMed] [Google Scholar]
- 5.Fields, P. A. 2001. Review: Protein function at thermal extremes: balancing stability and flexibility. Comp. Biochem. Physiol. A. 129:417–431. [DOI] [PubMed] [Google Scholar]
- 6.Szilagyi, A., and P. Zavodszky. 2000. Structural differences between mesophilic, moderately thermophilic and extremely thermophilic protein subunits: results of a comparative survey. Structure. 8:493–504. [DOI] [PubMed] [Google Scholar]
- 7.Varley, P. G., and R. H. Pain. 1991. Relation between stability, dynamics and enzyme activity in 3-phosphoglycerate kinases from yeast and Thermus thermophilus. J. Mol. Biol. 220:531–538. [DOI] [PubMed] [Google Scholar]
- 8.Kohen, A., and J. P. Klinman. 2000. Protein flexibility correlates with degree of hydrogen tunneling in thermophilic and mesophilic alcohol dehydrogenases. J. Am. Chem. Soc. 122:10738–10739. [Google Scholar]
- 9.Zavodszky, P., J. Kardos, A. Svingor, and G. A. Petsko. 1998. Adjustment of conformational flexibility is a key event in the thermal adaptation of proteins. Proc. Natl. Acad. Sci. USA. 95:7406–7411. [DOI] [PMC free article] [PubMed] [Google Scholar]
- 10.Wolf-Watz, M., V. Thai, K. Henzler-Wildman, G. Hadjipavlou, E. Z. Eisenmesser, and D. Kern. 2004. Linkage between dynamics and catalysis in a thermophilic-mesophilic enzyme pair. Nat. Struct. Mol. Biol. 11:945–949. [DOI] [PubMed] [Google Scholar]
- 11.Fitter, J., and J. Heberle. 2000. Structural equilibrium fluctuations in mesophilic and thermophilic α-amylase. Biophys. J. 79:1629–1636. [DOI] [PMC free article] [PubMed] [Google Scholar]
- 12.Fitter, J., R. Herrmann, N. A. Dencher, A. Blume, and T. Hauss. 2001. Activity and stability of a thermostable α-amylase compared to its mesophilic homologue: mechanisms of thermal adaptation. Biochemistry. 40:10723–10731. [DOI] [PubMed] [Google Scholar]
- 13.Hernandez, G., F. E. Jenney, Jr., M. W. W. Adams, and D. M. LeMaster. 2000. Millisecond time scale conformational flexibility in a hyperthermophile protein at ambient temperature. Proc. Natl. Acad. Sci. USA. 97:3166–3170. [DOI] [PMC free article] [PubMed] [Google Scholar]
- 14.Schnell, J. R., H. J. Dyson, and P. E. Wright. 2004. Structure, dynamics, and catalytic function of dihydrofolate reductase. Annu. Rev. Biophys. Biomol. Struct. 33:119–140. [DOI] [PubMed] [Google Scholar]
- 15.Kim, H. S., S. M. Damo, S. Y. Lee, D. Wemmer, and J. P. Klinman. 2005. Structure and hydride transfer mechanism of a moderate thermophilic dihydrofolate reductase from Bacillus stearothermophilus and comparison to its mesophilic and hyperthermophilic homologues. Biochemistry. 44:11428–11439. [DOI] [PubMed] [Google Scholar]
- 16.Summerfield, R. L., D. M. Daigle, S. Mayer, D. Mallik, D. W. Hughes, S. G. Jackson, M. Sulek, M. G. Organ, E. D. Brown, and M. S. Junop. 2006. A 2.13 Å structure of E. coli dihydrofolate reductase bound to a novel competitive inhibitor reveals a new binding surface involving the M20 loop region. J. Med. Chem. 49:6977–6986. [DOI] [PubMed] [Google Scholar]
- 17.Smith, J. C. 1991. Protein dynamics: comparison of simulations with inelastic neutron scattering experiments. Q. Rev. Biophys. 24:227–291. [DOI] [PubMed] [Google Scholar]
- 18.Doster, W., S. Cusack, and W. Petry. 1989. Dynamical transition of myoglobin revealed by inelastic neutron scattering. Nature. 337:754–756. [DOI] [PubMed] [Google Scholar]
- 19.Gabel, F., D. Bicout, U. Lehnert, M. Tehei, M. Weik, and G. Zaccaï. 2002. Protein dynamics studied by neutron scattering. Q. Rev. Biophys. 35:327–367. [DOI] [PubMed] [Google Scholar]
- 20.Hayward, J. A., and J. C. Smith. 2002. Temperature dependence of protein dynamics: computer simulation analysis of neutron scattering properties. Biophys. J. 82:1216–1225. [DOI] [PMC free article] [PubMed] [Google Scholar]
- 21.Becker, T., J. A. Hayward, J. L. Finney, R. M. Daniel, and J. C. Smith. 2004. Neutron frequency windows and the protein dynamical transition. Biophys. J. 87:1–9. [DOI] [PMC free article] [PubMed] [Google Scholar]
- 22.Tokuhisa, A., Y. Joti, H. Nakagawa, A. Kitao, and M. Kataoka. 2007. Non-Gaussian behavior of elastic incoherent neutron scattering profiles of proteins studied by molecular dynamics simulation. Phys. Rev. E Stat. Nonlin. Soft Matter Phys. 75:041912. [DOI] [PubMed] [Google Scholar]
- 23.Gabel, F. 2005. Protein dynamics in solution and powder measured by incoherent elastic neutron scattering: the influence of Q-range and energy resolution. Eur. Biophys. J. 34:1–12. [DOI] [PubMed] [Google Scholar]
- 24.Gabel, F., and M. C. Bellissent-Funel. 2007. C-phycocyanin hydration water dynamics in the presence of trehalose: an incoherent elastic neutron scattering study at different energy resolutions. Biophys. J. 92:4054–4063. [DOI] [PMC free article] [PubMed] [Google Scholar]
- 25.Kneller, G. 2007. Estimating the influence of finite instrumental resolution on elastic neutron scattering intensities from proteins. J. Chem. Phys. 126:125107. [DOI] [PubMed] [Google Scholar]
- 26.Baccanari, D. P., D. Averett, C. Briggs, and J. Burchall. 1977. Escherichia coli dihydrofolate reductase: isolation and characterization of two isozymes. Biochemistry. 16:3566–3572. [DOI] [PubMed] [Google Scholar]
- 27.Wilquet, V., J. A. Gaspar, M. van de Lande, M. V. de Casteele, C. Legrain, E. M. Meiering, and N. Glansdorff. 1998. Purification and characterization of recombinant Thermotoga maritima dihydrofolate reductase. Eur. J. Biochem. 255:628–637. [DOI] [PubMed] [Google Scholar]
- 28.Bée, M. 1988. Quasielastic Neutron Scattering. Adam Hilger, Bristol and Philadelphia.
- 29.van Hove, L. 1954. Correlations in space and time and Born approximation scattering in systems of interacting particles. Phys. Rev. 95:249–262. [Google Scholar]
- 30.Réat, V., G. Zaccaï, M. Ferrand, and C. Pfister. 1997. Functional dynamics in purple membrane. In Biological Macromolecular Dynamics. S. Cusack, H. Büttner, M. Ferrand, P. Langan, and P. Timmins, editors. Adenine Press, Schenectady, New York.
- 31.Lehnert, U., V. Réat, M. Weik, G. Zaccaï, and C. Pfister. 1998. Thermal motions in bacteriorhodopsin at different hydration levels studied by neutron scattering: correlation with kinetics and light-induced conformational changes. Biophys. J. 75:1945–1952. [DOI] [PMC free article] [PubMed] [Google Scholar]
- 32.Doster, W. 2006. Dynamical structural distributions in proteins. Physica B (Amsterdam). 385–386:831–834. [Google Scholar]
- 33.Becker, T., and J. C. Smith. 2003. Energy resolution and dynamical heterogeneity effects on elastic incoherent neutron scattering from molecular systems. Phys. Rev. E Stat. Nonlin. Soft Matter Phys. 67:021904. [DOI] [PubMed] [Google Scholar]
- 34.Hayward, J. A., J. L. Finney, R. M. Daniel, and J. C. Smith. 2003. Molecular dynamics decomposition of temperature-dependent elastic neutron scattering by a protein solution. Biophys. J. 85:679–685. [DOI] [PMC free article] [PubMed] [Google Scholar]
- 35.Curtis, J. E., M. Tarek, and D. J. Tobias. 2004. Methyl group dynamics as a probe of the protein dynamical transition. J. Am. Chem. Soc. 126:15928–15929. [DOI] [PubMed] [Google Scholar]
- 36.Doster, W., and M. Settles. 2005. Protein-water displacement distributions. Biochim. Biophys. Acta. 1749:173–186. [DOI] [PubMed] [Google Scholar]
- 37.Roh, J. H., V. N. Novikov, R. B. Gregory, J. E. Curtis, Z. Chowdhuri, and A. P. Sokolov. 2005. Onsets of anharmonicity in protein dynamics. Phys. Rev. Lett. 95:038101. [DOI] [PubMed] [Google Scholar]
- 38.Roh, J. H., J. E. Curtis, S. Azzam, V. N. Novikov, I. Peral, Z. Chowdhuri, R. B. Gregory, and A. P. Sokolov. 2006. Influence of hydration on the dynamics of lysozyme. Biophys. J. 91:2573–2588. [DOI] [PMC free article] [PubMed] [Google Scholar]
- 39.Engler, N., A. Ostermann, N. Niimura, and F. G. Parak. 2003. Hydrogen atoms in proteins: positions and dynamics. Proc. Natl. Acad. Sci. USA. 100:10243–10248. [DOI] [PMC free article] [PubMed] [Google Scholar]
- 40.Meinhold, L., and J. C. Smith. 2005. Fluctuations and correlations in crystalline protein dynamics: a simulation analysis of Staphylococcal nuclease. Biophys. J. 88:2554–2563. [DOI] [PMC free article] [PubMed] [Google Scholar]
- 41.Bronstein, I. N., K. A. Semendjajew, G. Musiol, and H. Mühlig. 1997. Taschenbuch der Mathematik. Verlag Harri Deutsch, Frankfurt am Main, Germany.
- 42.Pérez, J., J. M. Zanotti, and D. Durand. 1999. Evolution of the internal dynamics of two globular proteins from dry powder to solution. Biophys. J. 77:454–469. [DOI] [PMC free article] [PubMed] [Google Scholar]
- 43.Berman, H. M., J. Westbrook, Z. Feng, G. Gilliland, T. N. Bhat, H. Weissig, I. N. Shindyalov, and P. E. Bourne. 2000. The Protein Data Bank. Nucleic Acids Res. 28:235–242. [DOI] [PMC free article] [PubMed] [Google Scholar]


