

Abstract
Intercellular Ca2+ waves are believed to propagate through networks of glial cells in culture in one of two ways: by diffusion of IP3 between cells through gap junctions or by release of ATP, which functions as an extracellular messenger. Experiments were conducted to determine the mechanism of Ca2+ wave propagation between glial cells in an intact CNS tissue. Calcium waves were imaged in the acutely isolated rat retina with the Ca2+ indicator dye fluo-4. Mechanical stimulation of astrocyte somata evoked Ca2+ waves that propagated through both astrocytes and Müller cells. Octanol (0.5 mm), which blocks coupling between astrocytes and Müller cells, did not reduce propagation into Müller cells. Purinergic receptor antagonists suramin (100 μm), PPADS (20–50 μm), and apyrase (80 U/ml), in contrast, substantially reduced wave propagation into Müller cells (wave radii reduced to 16–61% of control). Suramin also reduced wave propagation from Müller cell to Müller cell (51% of control). Purinergic antagonists reduced wave propagation through astrocytes to a lesser extent (64–81% of control). Mechanical stimulation evoked the release of ATP, imaged with the luciferin–luciferase bioluminescence assay. Peak ATP concentration at the surface of the retina averaged 78 μm at the stimulation site and 6.8 μm at a distance of 100 μm. ATP release propagated outward from the stimulation site with a velocity of 41 μm/sec, somewhat faster than the 28 μm/sec velocity of Ca2+ waves. Ejection of 3 μm ATP onto the retinal surface evoked propagated glial Ca2+ waves. Together, these results indicate that Ca2+ waves are propagated through retinal glial cells by two mechanisms. Waves are propagated through astrocytes principally by diffusion of an internal messenger, whereas waves are propagated from astrocytes to Müller cells and from Müller cells to other Müller cells primarily by the release of ATP.
Keywords: calcium waves, calcium wave propagation, astrocyte, Müller cell, glial cells, ATP
Stimulation of glial cells often evokes increases in intracellular Ca2+that propagate into neighboring glial cells as intercellular Ca2+ waves. These Ca2+ waves have been well characterized in cultured astrocytes (Finkbeiner, 1993; Verkhratsky et al., 1998). Glial Ca2+ waves also have been observed in intact tissue preparations, including the mammalian retina (Newman and Zahs, 1997) and cultured (Dani et al., 1992) and acutely isolated (Kang et al., 1998) hippocampal slices.
Propagated Ca2+ waves in glial cells may modulate neuronal activity and influence information processing in the CNS. In culture, Ca2+ increases in astrocytes are accompanied by the release of glutamate (Parpura et al., 1994; Bezzi et al., 1998; Innocenti et al., 2000), which modulates synaptic efficacy and evokes inward currents in neighboring neurons (Araque et al., 1998a,b; Sanzgiri et al., 1999). In the retina, Ca2+ waves propagated through astrocytes and Müller cells, the principal retinal glial cell (Newman, 2001), can either excite or inhibit the light-evoked spike activity of nearby neurons (Newman and Zahs, 1998). In acutely isolated hippocampal slices Ca2+ increases in astrocytes potentiate inhibitory synaptic transmission (Kang et al., 1998), whereas at the neuromuscular junction Ca2+increases in perisynaptic Schwann cells result in a reduction in neurotransmitter release (Robitaille, 1998).
Calcium waves, in glial cells as well as in other tissues, initially were believed to be propagated by the diffusion of inositol trisphosphate (IP3) through gap junctions (Sanderson et al., 1994; Sanderson, 1996). Several lines of evidence support this mechanism of propagation. Glial cells in culture andin situ are coupled extensively by gap junctions (Ransom, 1995). Agents that block gap junctional coupling, including octanol and halothane (Finkbeiner, 1992) and activators of protein kinase C (Enkvist and McCarthy, 1992), also block the propagation of Ca2+ waves. C6 glioma cells, which are poorly coupled, do not support wave propagation, although transfection of C6 cells with connexin43 restores wave propagation (Charles et al., 1992; Cotrina et al., 1998a). Furthermore, agents that interfere with IP3 signaling also block wave propagation (Boitano and Dirksen, 1992; Charles et al., 1993; Newman and Zahs, 1997).
Recent evidence has demonstrated, however, that wave propagation also may proceed by an extracellular pathway. Calcium waves can be propagated between astrocytes in culture even when the cells are not contacting each other directly (Hassinger et al., 1996; Guthrie et al., 1999) or when gap junctional coupling is reduced experimentally (Guan et al., 1997; John et al., 1999), demonstrating that propagation also can occur by the release of an extracellular messenger. The messenger is believed to be ATP, because ATP receptor antagonists (Guan et al., 1997; Cotrina et al., 1998a,b, 2000; Guthrie et al., 1999; Fam et al., 2000) and apyrase (Cotrina et al., 1998a,b, 2000; Guthrie et al., 1999), which hydrolyzes ATP, block the propagation of Ca2+ waves in cultured astrocytes. In addition, Ca2+ wave propagation in culture is accompanied by the release of ATP from glial cells (Cotrina et al., 1998a; Guthrie et al., 1999; Wang et al., 2000).
The mechanism by which Ca2+ waves are propagated between glial cells in intact tissue has not been investigated previously. I report here studies of the propagation of Ca2+ waves through glial cells of the acutely isolated mammalian retina. The results suggest that propagation occurs by both intracellular and extracellular mechanisms.
MATERIALS AND METHODS
Retinal preparations
The everted eyecup, isolated whole-mount retina, and retinal slice preparations were used in these experiments. In all cases, male Long–Evans rats (250–400 gm) were anesthetized deeply with sodium pentobarbital administered intraperitoneally, and the eyes were removed.
Eyecup preparation. Eyecups were prepared as described previously (Newman and Bartosch, 1999). Briefly, a portion of the back of the eye was cut from the eyeball and everted over a Plexiglas dome in the bottom half of a superfusion chamber. The top half of the chamber was placed over the eyecup and served to hold the preparation in place. Then the bulk of the vitreous humor was removed by suction, leaving a thin layer of vitreous adhering to the retinal surface. (The vitreous humor could not be removed enzymatically because this treatment detached the retina from the underlying pigment epithelium.)
Whole-mount retina. Whole-mount retinas were prepared as described previously (Zahs and Newman, 1997). Briefly, retinas were removed from the back of the eye, cut in one-half, and stored in oxygenated Ringer's for later use. The vitreous humor was removed from a piece of retina by enzymatic digestion (11 min at ∼23°C in 2 mg/ml collagenase–dispase and 0.1 mg/ml DNase), rinsed in Ringer's solution, and attached to a polycarbonate membrane filter (vitreal side up) by suction. The retina and filter were held in place in a superfusion chamber by a ring of platinum wire.
Retinal slice preparation. Retinal slices were prepared as described previously (Newman, 1985). Briefly, isolated retinas were fixed to a piece of membrane filter as described above, submerged in Ringer's solution in a tissue chopper, and cut into ∼500 μm sections. Slices were fixed to the bottom of a superfusion chamber (cut surface upward) with beads of vacuum grease.
For all three preparations the retinas were incubated in the Ca2+ indicator dye fluo-4 AM (21 μg/ml; Molecular Probes, Eugene, OR) and pluronic acid (2.6 mg/ml) in Ringer's solution for 30 min at ∼23°C. Retinal slice preparations were labeled before the slices were cut.
Superfusion of preparations
Preparations were superfused at 1–2.5 ml/min with HCO3− -buffered Ringer's solution at 24°C. In preliminary experiments trials also were conducted at 30 and 36°C. Calcium wave propagation was qualitatively similar at these higher temperatures, but responses were not characterized in detail. The Ringer's solution contained (in mm): 117.0 NaCl; 3.0 KCl, 2.0 CaCl2, 1.0 MgSO4, 0.5 NaH2PO4, 15.0d-glucose, 32 NaHCO3, and 0.01l-glutamate; the solution was equilibrated with 5% CO2 in O2.
In experiments that used expensive reagents (apyrase, luciferin–luciferase), superfusion of the preparation was halted after an initial 30 min period and the reagents were added directly to the superfusion chamber. In these experiments the standing Ringer's solution in the chamber was oxygenated by enclosing the space between the chamber and the objective lens of the microscope with a Plexiglas cylinder. A steady stream of humidified 5% CO2in O2 was directed into the space above the preparation. In control experiments the retinas that were maintained in this unsuperfused state continued to generate Ca2+ waves of normal magnitude and size for 3 hr.
Imaging intracellular Ca2+
Incubation of retinas in fluo-4 AM selectively labeled astrocytes and Müller cells, leaving retinal neurons unlabeled. Fluo-4-labeled cells were imaged with a video rate (30 Hz) Noran Odyssey confocal scanner (Middleton, WI) and a BX60 Olympus microscope with 20× and 40× water immersion objectives. Fluo-4 was imaged with 488 nm argon excitation and a 500 nm long-pass barrier filter. MetaMorph software (Universal Imaging, West Chester, PA) was used to acquire, store, and analyze images.
Imaging ATP release
ATP release from the retina was detected with the luciferin–luciferase bioluminescence assay in experiments on whole-mount retinas. After an initial 30 min superfusion period, superfusion was halted and the Ringer's solution in the chamber was replaced with 400 μl of Ringer's containing 25 μl of luciferase stock solution (Sigma L 1759; 10 mg/ml in 0.5 m Tris buffer, pH 7.5; St. Louis, MO) and 25 μl of luciferin stock solution (Sigma L 6882; 11.1 mg/ml in H2O). ATP bioluminescence was detected with an intensified cooled CCD camera (I-PentaMAX, Princeton Instruments, Trenton, NJ), using an integration time of 0.5 sec and 2 × 2 binning.
ATP release calibration
ATP bioluminescence was calibrated by imaging a series of ATP standards in the bulk solution between a glass slide and the water immersion objective (Olympus 20×, 0.5 numerical aperture, 3.3 mm working distance). After background subtraction, log bioluminescence was found to vary linearly with log ATP concentration for concentrations ranging from 1 nm to 10 μm. The slope of the log–log relation was almost precisely 1, indicating a linear relation between ATP concentration and bioluminescence, as shown previously (Wang et al., 2000).
ATP calibrations also were performed in the presence of suramin. For concentrations between 1 nm and 10 μm ATP, 100 μm suramin reduced ATP bioluminescence to 28% of control. This correction factor was used when ATP levels were calculated in experiments done in the presence of suramin.
In the calibration procedure described above, ATP bioluminescence was measured throughout the entire depth of the solution. When ATP is released from glial cells at the retinal surface, in contrast, bioluminescence comes only from a thin layer of solution above the retina. For a given ATP concentration at the retinal surface, a far smaller bioluminescence signal will be measured when ATP is released from glial cells.
Two additional procedures were used to compensate for this difference in the ATP bioluminescence signal. First, the bioluminescence from a 145 μm thickness of solution (an arbitrary thickness contained conveniently beneath a coverglass) was compared with the signal from the bulk solution beneath the objective. For the same ATP concentration the signal from the bulk solution was 20.8 times larger. Second, diffusion of ATP from the retinal surface into the bath was estimated by using the diffusion equation for release of a substance from a plane into a semi-infinite volume (Crank, 1985):
where C is the ATP concentration, M is the instantaneous ATP source, D is the ATP diffusion coefficient (3.3 · 10−6cm2/sec at 22°C; Hubley et al., 1996),t is time, and x is the distance above the retinal surface.
The profile of ATP concentration above the surface was calculated for a continuous ATP source of 4 sec duration. (ATP levels peaked ∼4 sec after stimulation in experiments.) Using this concentration profile, the ATP concentration at the surface (x = 0) was found to be 4.0 times the average ATP concentration within the first 145 μm above the surface. (Calculated ATP concentration was negligible beyond 145 μm.) Taken together, these calculations imply that the bioluminescence signal measured in calibrations from the bulk solution is 83.2 times greater (4 · 20.8) than the bioluminescence signal generated by ATP release from the retina for the same ATP concentration at the retinal surface. This factor of 83.2 was applied in ATP release experiments to calculate the actual ATP concentration at the surface of the retina.
Retinal stimulation
Calcium waves were evoked by mechanical stimulation of glial cells. A metal-in-glass microelectrode plated with a ∼10 μm diameter Pt ball was used to stimulate cells. A piezoelectric actuator (Burleigh Instruments, Fishers, NY) was used to advance the probe 15–25 μm for a 10 msec pulse.
Glial cell sensitivity to ATP was assessed by pressure-ejecting ATP in Ringer's solution onto the retina from pipettes with tip diameters of ∼5 μm. Pressure pulses (5 sec duration) at 10 psi were used. Pipette tips were positioned 10–15 μm above the retinal surface.
Image analysis
Calcium wave size was assessed 9.5 sec after the waves were evoked by measuring wave radius visualized in ratio images of Ca2+ indicator dye fluorescence. Calcium fluorescence images that were acquired between 6.5 and 9.5 sec after stimulation were averaged and divided by the average of images that were acquired in a control period before stimulation. These ratio images were displayed as pseudocolor pictures. Threshold for detection of the leading edge of Ca2+ waves was taken as a ΔF/F increase of 0.6.
Calcium wave propagation through astrocytes and Müller cells could be differentiated by the pattern of Ca2+ increases observed at the retinal surface. Propagation through astrocytes was marked by increases in fluorescence in astrocyte somata and in their processes. Propagation through Müller cells, in contrast, was distinguished by increases in background fluorescence and, in some cases, by the appearance of bright fluorescent spots (Müller cell endfeet). When maximum wave radii were unclear when they were viewed in ratio images, the maximal extent of wave propagation in the two types of glial cells could be determined by viewing speeded-up movies of the waves.
Results are given as mean ± SEM (number of samples). Statistical significance was assessed by the Student's t test (unpaired samples).
RESULTS
Astrocyte stimulation
As reported previously (Newman and Zahs, 1997), mechanical stimulation of an astrocyte on the surface of the retina evoked an increase in intracellular Ca2+ that propagated through neighboring glial cells on the retinal surface as a Ca2+ wave. These Ca2+ waves were analyzed by computing ratio images that clearly delineated the maximum spread of the wave (Fig. 1A). A number of pharmacological experiments were performed to differentiate between the two likely mechanisms of Ca2+ wave propagation: diffusion of an intracellular messenger through gap junctions and release of an extracellular messenger. Experiments were performed on eyecups. Movies of glial Ca2+waves in the rat retina can be viewed athttp://www.neurosci.umn.edu/faculty/newman.html.
Fig. 1.
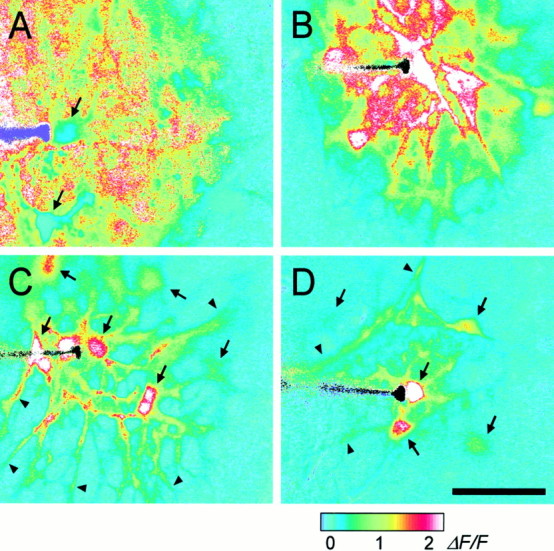
Propagation of intercellular Ca2+ waves in retinal glial cells. A, Control. A Ca2+ wave propagates through both astrocytes and Müller cells, with large Ca2+increases occurring in both types of glial cells. [The apparent absence of Ca2+ increases in two astrocytes (arrows) is an artifact; the Ca2+signal in these cells was saturated before stimulation.]B, Octanol, 0.5 mm. A Ca2+ wave propagates through both astrocytes and Müller cells. C, Suramin, 100 μm. A Ca2+ wave propagates from the stimulated astrocyte into other astrocyte somata (arrows) and processes (arrowheads), but not into Müller cells (theblueregions between astrocytes).D, Apyrase, 80 U/ml. A Ca2+ wave propagates into several astrocyte somata (arrows) and processes (arrowheads), but not into Müller cells. Waves were evoked by mechanical stimulation of astrocyte somata. The stimulating probe is seen at the left in each panel. Recordings were from eyecups. Scale bar, 50 μm. The pseudocolor ratio images were calculated as described in Materials and Methods. The pseudocolor scale, at the bottom, indicates fluorescence ratio values for this and subsequent figures.
Control
In control solution the Ca2+ waves propagated through both astrocytes and Müller cells. In ratio images of wave propagation (Fig. 1A) most astrocytes and Müller cells within the boundary of the wave showed increases in Ca2+. Maximum wave spread, measured at 9.5 sec after stimulation, was determined independently for astrocytes and Müller cells by examining ratio images and by viewing movies of wave propagation. In control solution the maximum wave radius was almost identical for astrocytes and Müller cells, 85 and 82 μm, respectively (Table 1).
Table 1.
Effect of agents on Ca2+ wave propagation in the rat eyecup
| Condition | Astrocyte wave radius (μm) | Müller cell wave radius (μm) | Astrocyte → Müller cell delay (sec) |
|---|---|---|---|
| Astrocyte stimulation | |||
| Control | 84.7 ± 3.2 (24) | 82.2 ± 3.4 (24) | 0.85 ± 0.09 (18) |
| Octanol (0.5 mm) | 100.6 ± 3 (20)* | 100.6 ± 3 (20)* | 0.99 ± 0.06 (12) |
| Suramin (100 μm) | 54.5 ± 6.2 (21)* | 12.9 ± 5.2 (21)* | 2.38 ± 0.13 (4)* |
| PPADS (20 and 50 μm) | 69.0 ± 3.7 (33)* | 49.8 ± 6.0 (33)* | 2.14 ± 0.14 (22)* |
| Apyrase (80 U/ml) | 63.3 ± 9.6 (9)* | 20.7 ± 6.8 (9)* | |
| Müller cell stimulation | |||
| Control (eyecup)1-a | 64.4 ± 2.2 (18) | ||
| Control (slice) | 66.0 ± 3.0 (28) | ||
| Suramin (slice, 100 μm) | 32.6 ± 3.5 (22)* |
Calcium waves were evoked by mechanical stimulation. Wave radii were measured 9.5 sec after stimulation. The last column gives the time between the onset of a Ca2+ increase in an astrocyte process and the onset of an increase in an adjacent Müller cell endfoot. Mean ± SEM (n) are given.
p < 0.01; control versus test.
Wave radius measured at the retinal surface.
After stimulation of an astrocyte soma, wave propagation proceeded smoothly through the processes of the stimulated astrocyte and into the soma and processes of adjacent astrocytes. Propagation into Müller cells, in contrast, always followed a distinct pause. The delay between a Ca2+ increase in an astrocyte process and the Ca2+ increase in an adjacent Müller cell endfoot averaged 0.85 sec (Table 1; Fig.2A,B). Wave propagation from astrocytes to Müller cells occurred in 100% of the trials.
Fig. 2.

Propagation of Ca2+ waves from astrocytes to Müller cells. A and Cshow fluorescence intensity (arbitrary units) from selected regions of astrocytes (1, 3) and Müller cells (2, 4). The location of each region is indicated in the fluorescence images in B andD. A, B, Control. Stimulation of an astrocyte soma evokes a wave that propagates rapidly into adjacent Müller cells. Near the stimulated soma (*) the wave propagates from the astrocyte process (1) into an adjacent Müller cell (2) with a delay of 1.1 sec. Farther from the soma the delay in propagation from the astrocyte process (3) to a Müller cell (4) is 1.3 sec. C,D, PPADS, 50 μm. PPADS impairs astrocyte-to-Müller cell propagation. Near the stimulated soma (*) the wave propagates from the astrocyte process (1) to an adjacent Müller cell (2) with a delay of 2.3 sec. (The secondary rise in Ca2+ in region 1 represents the arrival of the Ca2+ wave in the Müller cells underneath the astrocyte process.) The wave propagates into the soma of a nearby astrocyte (3) but fails to invade an adjacent Müller cell (4). Recordings are from eyecups. In A and C the small dots mark the onset of Ca2+ increases, andvertical arrows indicate the time of mechanical stimulation. Scale bar in D, 50 μm.
Octanol
If wave propagation is mediated by diffusion of an intracellular messenger between coupled cells, propagation should be compromised by gap junctional blockers. Octanol has been shown to block gap junctions between astrocytes and Müller cells in the rat retina, although it does not block junctions between astrocytes and other astrocytes (Zahs and Newman, 1997).
Calcium wave propagation was not reduced by the addition of 0.5 mm octanol in the superfusate. After astrocyte stimulation, waves propagated through both astrocytes and Müller cells (see Fig. 1B). Maximum wave radius in octanol was 101 μm for both astrocytes and Müller cells (Table 1), slightly larger than wave radius in control solution. [It was not possible to determine the effect of uncoupling astrocytes from other astrocytes because there is no known agent that uncouples retinal astrocytes effectively without compromising the health of the cells (Zahs and Newman, 1997). High concentrations of gap junction blockers might reduce wave propagation through astrocytes. This reduction likely would be attributable to cell damage rather than to a specific block of the junctions, however.]
Purinergic antagonists
If wave propagation is mediated by the release of ATP, propagation should be compromised by the addition of purinergic receptor blockers. This proved to be the case. Although wave propagation through astrocytes continued in the presence of purinergic antagonists, propagation into Müller cells either was blocked entirely or was reduced substantially.
Suramin (100 μm) and PPADS (20 and 50 μm), P2 receptor antagonists, both inhibited Ca2+ wave propagation in Müller cells. In 24 of 54 trials Ca2+ waves evoked by the stimulation of an astrocyte propagated into adjacent astrocytes but failed to propagate into Müller cells (see Fig.1C). In 30 other trials Ca2+waves did propagate into Müller cells, but the Müller cell waves were smaller in magnitude and did not travel nearly so far. Averaged over all trials, maximum wave radius in Müller cells was 13 and 50 μm in suramin and PPADS, respectively (Table 1), substantially smaller than the mean radius of 82 μm in control solution.
When a Ca2+ wave did propagate into Müller cells, the delay in propagation from an astrocyte to a neighboring Müller cell was substantially longer than in the absence of the antagonist. Mean delays were 2.4 and 2.1 sec in suramin and PPADS, respectively, compared with 0.85 sec in control solution (Table 1; Fig. 2C,D).
Although wave propagation through astrocytes continued in the presence of purinergic antagonists, the waves were reduced somewhat in size. Maximum wave radius in astrocytes was reduced from 85 to 54 and 69 μm in suramin and PPADS, respectively (Table 1).
Apyrase
If wave propagation from astrocytes to Müller cells is mediated by the release of ATP, then propagation should be compromised by the addition of apyrase, which hydrolyzes ATP. This was the case. Apyrase (80 U/ml) strongly inhibited wave propagation from astrocytes to Müller cells (see Fig. 1D). Maximum wave radius in Müller cells was 21 μm (Table 1). Apyrase also reduced wave propagation in astrocytes to a lesser extent (Table1).
Effect of superfusate flow
Superfusate flow should influence Ca2+ wave propagation if ATP, acting as an extracellular messenger, is involved in the propagation mechanism. This was tested in isolated whole-mount retinas in which the vitreous humor had been removed by enzymatic digestion and the superfusate directly contacted the retinal surface. In this preparation, superfusate flow dramatically altered Ca2+ wave propagation (Fig. 3). When flow was stopped, propagation proceeded uniformly in all directions (Fig. 3A). Maximum wave radius measured along radii in opposite directions was identical (Table 2). With superfusate flow turned on, in contrast, propagation was highly asymmetric; the wave traveled much farther in the direction of flow (Fig.3B). Maximum wave radius was 2.5 times greater when measured in the direction of superfusate flow as compared with the radius in the direction opposite the flow (Table 2).
Fig. 3.

Calcium wave propagation is altered by superfusate flow. A, Superfusate flow turned off. Propagation is symmetric. B, Superfusate flow from leftto right. Propagation is highly asymmetric. Propagation in the direction of superfusate flow is greatly extended, whereas propagation in the direction opposite the flow is reduced. The two images were obtained from nearby regions of the same retina. Waves were evoked by mechanical stimulation. The tip of the stimulating probe is near the center of the images. Shown are recordings from a whole-mount retina. Scale bar, 50 μm.
Table 2.
Calcium wave propagation through glial cells in rat isolated whole-mount retinas
| Condition | Wave radius in direction of flow (μm) | Wave radius in opposite direction of flow (μm) | Ratio of wave radii |
|---|---|---|---|
| Superfusion OFF | 126 ± 5 (8) | 128 ± 5 (8) | 0.99 ± 0.03* |
| Superfusion ON | 236 ± 8 (19) | 95 ± 2 (19) | 2.51 ± 0.10 |
| Superfusion ON, 100 μm suramin | 88 ± 3 (15) | 86 ± 3 (15) | 1.03 ± 0.03* |
Waves were evoked by mechanical stimulation of astrocyte somata. Radii were measured 9.5 sec after stimulation. With superfusion turned off, wave radii were measured relative to the normal direction of superfusate flow. Mean ± SEM (n) are given.
p > 0.3; ratio not different from 1.
There was no detectable effect of superfusate flow on Ca2+ wave propagation when measured in the eyecup. This is presumably because the thin layer of vitreous humor that remained on the surface of the eyecup shielded the retinal surface from flowing superfusate.
Additional extracellular messengers
Other extracellular messengers, in addition to ATP, could contribute to Ca2+ wave propagation. This issue was addressed in additional experiments on isolated whole-mount retinas. In control solution and with superfusate flowing, wave propagation was highly asymmetric (Fig.4A), as described above. This asymmetry was eliminated completely by the addition of 100 μm suramin to the superfusate, despite the fact that the superfusate continued to flow (Table 2; Fig.4B). The effect of suramin was reversible, and asymmetric propagation returned when the purinergic antagonist was washed out (Fig. 4C). The results suggest that ATP is the only extracellular messenger contributing to Ca2+ wave propagation.
Fig. 4.

ATP receptor antagonist blocks asymmetric wave propagation. Superfusate flow is from top left to bottom right in all three trials.A, Control. Superfusate flow causes asymmetric wave propagation. B, Suramin, 100 μm. The purinergic receptor blocker eliminates the asymmetric wave propagation despite the continued superfusate flow. C, Recovery. After washout of suramin (39 min) the asymmetry in wave propagation returns. Waves were evoked by mechanical stimulation. The three images were obtained from nearby regions of the same retina. Shown are recordings from a whole-mount retina. Scale bar, 50 μm.
Müller cell stimulation
Eyecup
The experiments described above characterize Ca2+ wave propagation between astrocytes and from astrocytes to Müller cells after stimulation of astrocyte somata. Additional experiments were conducted in eyecups to explore wave propagation between Müller cells. Small clusters of Müller cells were stimulated with a probe positioned in the inner plexiform layer (IPL) 15–30 μm below the retinal surface. At this depth the probe stimulates Müller cell processes; astrocyte processes rarely extend past the ganglion cell layer.
Müller cell stimulation evoked Ca2+waves that propagated radially through Müller cells (into cell endfeet and somata) and laterally from Müller cell to Müller cell parallel to the retinal surface. Waves were always initiated at the tip of the stimulating probe, within the IPL, rather than at the surface where the probe penetrated the retina. The maximum lateral radius of waves propagated through Müller cells (parallel to the surface) was 64 μm (see Table 1), somewhat smaller than the maximum radius of waves initiated by stimulation at the retina surface.
Calcium waves occasionally propagated from Müller cells into astrocytes at the retinal surface after Müller cell stimulation, although waves often propagated past astrocytes without invading them. When a Müller cell wave did propagate into an astrocyte, there was a considerable delay, 2.6 ± 0.2 sec (9), between the rise of Ca2+ within Müller cells and the Ca2+ increase within the adjacent astrocyte.
Retinal slices
Additional experiments were conducted by using retinal slices to visualize the spread of Müller cell Ca2+ waves within the retina. A stimulating probe was positioned 20–50 μm beneath the cut surface of the slice at the level of the IPL, where the probe stimulated radial Müller cell processes (Fig.5F). Müller cell stimulation initiated Ca2+ waves that propagated spherically through Müller cells from the tip of the stimulating probe. Waves traveled proximally into Müller cell endfeet, distally into Müller cell somata (but not beyond the somata), and laterally, parallel to the retinal surface (Fig.5A–E). Maximum wave radius, measured parallel to the retinal surface, was 66 μm, similar to the radius of Müller cell waves in the eyecup (see Table 1).
Fig. 5.
Propagation of an intercellular Ca2+ wave in Müller cells. Shown are images from a retinal slice, viewed looking down onto the cut surface of the slice. A–E, Pseudocolor images of Ca2+ wave propagation through Müller cells evoked by mechanical stimulation. The wave propagates in all directions within Müller cells, invading cell somata and endfeet, where large Ca2+ increases are seen. Elapsed time after stimulation in A–E: 0, 1.3, 2.0, 3.0, and 5.0 sec.F, A fluorescence image of the slice showing labeled Müller cells. Müller cell somata in the inner nuclear layer are at the top of the image. Müller cell endfeet at the vitreal surface of the retina are at the bottom. Müller cell processes (thin vertical lines) within the inner plexiform layer were stimulated by the probe. Scale bar, 50 μm.
Suramin (100 μm) substantially reduced the propagation of Ca2+ waves through Müller cells in retinal slices. The maximum radius of Müller cell waves in the presence of the antagonist was 33 μm, one-half that of control trials (see Table 1).
ATP release
The experiments described above suggest that ATP or a related compound serves as an extracellular messenger and activates P2 purinergic receptors on glial cells. If this is the case, ATP should be released from glial cells during Ca2+ wave propagation. To test this, ATP release was monitored in isolated whole-mount retinas with the luciferin–luciferase bioluminescence assay.
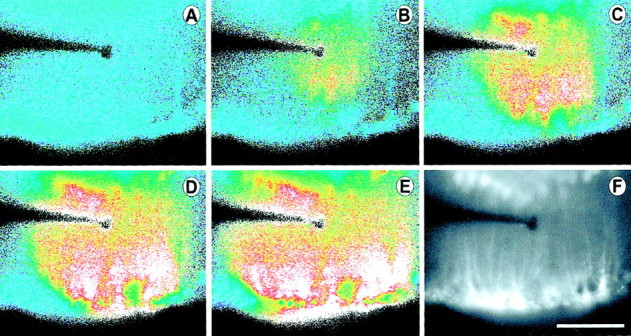
Mechanical stimuli that reliably evoked Ca2+ waves indeed did evoke a wave of ATP release that propagated outward from the point of stimulation (Fig.6). At 10 sec after stimulation the mean radius of the ATP wave was 162 ± 9 μm (8). (A 3 μm ATP concentration was used as a criterion for judging the edge of the wave.) This radius is similar to, but somewhat greater than, the radius of Ca2+ waves in whole-mount retinas, which was 148 μm at 10 sec. Maximum ATP concentration at the point of stimulation averaged 78 μmand decreased at increasing distances from the stimulation site (Table3). (As described in Materials and Methods, ATP concentrations cited in this study represent concentrations at the retinal surface; simple diffusion of ATP into the bath solution is assumed.)
Fig. 6.

Propagation of a wave of ATP release from the retina. ATP release was monitored via the luciferin–luciferase bioluminescence assay. ATP concentration at the retinal surface is indicated by the pseudocolor scale at thebottom. The ATP release wave was evoked by a mechanical stimulus identical to that used to elicit Ca2+waves. Elapsed time after stimulation in A–F: 0, 0.7, 2.0, 4.0, 7.9, and 16.5 sec. Shown are images from a whole-mount retina. Scale bar, 100 μm.
Table 3.
ATP release after mechanical stimulation of the retina
| Condition | Peak ATP concentration at retinal surface (μm) | ||
|---|---|---|---|
| At stimulation site | At 50 μm | At 100 μm | |
| Control | 78.1 ± 3.3 (8) | 18.9 ± 2.7 (8) | 6.8 ± 1.3 (8) |
| 100 μm suramin | 60.9 ± 3.43-150 (6) | 6.2 ± 0.43-150 (6) | 3.1 ± 0.23-150 (6) |
ATP concentration was measured by using the luciferin–luciferase bioluminescence assay. Mean ± SEM (n) are given.
F3-150: p < 0.02, control versus suramin.
It could be argued that the wave of ATP release observed in these experiments is not actually a propagated wave but rather represents the diffusion of ATP released solely from cells directly stimulated by the probe. This possibility was tested by monitoring ATP release in the presence of suramin. In 100 μm suramin, retinal stimulation did evoke the release of ATP. As evident in line scans of ATP concentration, however, the ATP increase failed to propagate outward from the stimulation site (Figs.7, 8). In addition, peak ATP levels were reduced significantly in the presence of suramin, particularly at a distance from the stimulation site (Table3).
Fig. 7.

ATP receptor antagonist blocks propagation of ATP release wave. Spatial profiles of ATP concentration at the retinal surface are shown for five time points after stimulation.Left, Control trial. Immediately after stimulation (1.3 sec) ATP release is confined to a region near the stimulation site (center of trace). At later times ATP release occurs at greater distances from the stimulation site. Right, Suramin, 100 μm. ATP release is confined to a small region near the stimulation site, even at later times. ATP release does not propagate to neighboring regions. Shown are recordings from whole-mount retinas.
Fig. 8.

Comparison of ATP release wave and Ca2+ wave propagation. Wave radius is plotted as a function of time after stimulation for control ATP release waves (▪), ATP release waves in the presence of 100 μm suramin (▴), and control Ca2+ waves (○). Propagation of control ATP release waves precedes Ca2+ waves by ∼25 μm and ∼0.9 sec during the first seconds after stimulation. In the presence of suramin the ATP release fails to spread beyond 30 μm from the stimulation site. Threshold for detecting the leading edge of ATP waves was 3 μm ATP. Threshold for Ca2+ waves was a ΔF/F increase of 0.6. Means ± SEM are shown. n = 8, 6, and 8 for control ATP, suramin ATP, and Ca2+ waves, respectively. Shown are recordings from whole-mount retinas.
The propagation velocity of ATP waves was determined by plotting wave radius (using a 3 μm ATP threshold) as a function of time (Fig. 8). ATP wave velocity (measured 0–2 sec after stimulation) averaged 41.4 ± 0.6 μm/sec (n = 8). The propagation velocity of Ca2+ waves, measured in the same preparation and with the same stimulus, was somewhat slower, averaging 28.2 ± 0.9 μm/sec (n= 8). The leading edge of the ATP wave preceded that of the Ca2+ wave by ∼25 μm and 0.9 sec during the first 2 sec after stimulation (Fig. 8), as expected if ATP is serving as an extracellular messenger mediating Ca2+ wave propagation.
ATP ejections
If ATP is serving as an extracellular messenger, then application of ATP should evoke Ca2+ increases in retinal glial cells and trigger propagated Ca2+ waves. This proved to be the case (Table 4). Pressure ejection of ATP at concentrations of 1 μm or greater evoked Ca2+ increases in both astrocytes and Müller cells. Ejection of ATP at concentrations of 3 μm or greater evoked a propagated Ca2+ wave that traveled through both astrocytes and Müller cells.
Table 4.
Glial cell responses to ATP ejection
| ATP concentration (μm) | Number of trials | Fraction of trials evoking response | ||
|---|---|---|---|---|
| Astrocyte Ca2+response | Müller cell Ca2+response | Intercellular Ca2+ wave | ||
| 0.1 | 9 | 0 | 0 | 0 |
| 0.3 | 10 | 0 | 0 | 0 |
| 1 | 19 | 0.74 | 0.84 | 0 |
| 3 | 20 | 1 | 1 | 1 |
| 10 | 10 | 1 | 1 | 1 |
ATP in Ringer's solution was pressure-ejected from a pipette onto the surface of the retina. Data are expressed as the fraction of trials that evoked a positive response: a Ca2+ increase within astrocytes (third column), a Ca2+ increase within Müller cells (fourth column), or a propagated intercellular Ca2+ wave (fifth column).
DISCUSSION
In cultured astrocytes intercellular Ca2+ waves have been shown to be propagated in one of two ways: by the diffusion of an intracellular messenger between cells through gap junctions or by the release of ATP, which functions as an extracellular messenger. The results described in this study indicate that, in glial cells in acutely isolated CNS tissue, Ca2+ waves are propagated by both of these mechanisms.
Propagation by release of an extracellular messenger
The asymmetric wave propagation seen in superfused whole-mount retinas (see Fig. 3) clearly demonstrates that an extracellular messenger participates in wave propagation in retinal glial cells. The messenger is carried along by the flowing superfusate. The lack of an effect of octanol (see Table 1), which uncouples astrocytes from Müller cells (Zahs and Newman, 1997), also highlights the importance of an extracellular messenger for wave propagation between these two types of retinal glial cells.
Additional experiments reveal the nature of the extracellular messenger. Agents that block ATP signaling (suramin, PPADS, apyrase) substantially reduce propagation from astrocytes to Müller cells and from Müller cells to other Müller cells (see Table 1). In many cases these agents block propagation from astrocytes to Müller cells entirely. These results indicate that the release of ATP is the principal mechanism of wave propagation between these two types of glial cells.
The delay observed in wave propagation from astrocytes to Müller cells (see Table 1; Fig. 2) is consistent with an extracellular mechanism of propagation. The delay may represent the latency between the arrival of a Ca2+ wave in an astrocyte and the release of ATP from that cell as well as the latency to the release of Ca2+ from internal stores after the activation of purinergic receptors on Müller cells. The delay in wave propagation is increased substantially by purinergic antagonists (see Table 1; Fig. 2), as expected if ATP serves as the extracellular messenger.
The detection of ATP release during Ca2+wave propagation (see Fig. 6) by the highly selective luciferin–luciferase assay also supports its role as an extracellular messenger. Stimuli that evoke Ca2+ waves in retinal glial cells also trigger ATP release. In addition, the propagation velocity of ATP waves is similar to that of Ca2+ waves. The wave of ATP release precedes the Ca2+ wave by ∼1 sec (see Fig. 8), as is expected if it contributes to Ca2+ wave propagation. Finally, astrocytes in culture have been shown to release ATP during the propagation of Ca2+ waves (Cotrina et al., 1998a; Guthrie et al., 1999; Wang et al., 2000). Although not demonstrated directly in this study, the experiments described here suggest that ATP is released by the retinal glial cells conducting the Ca2+ wave.
ATP release results in ATP concentrations at the retinal surface sufficient to trigger increases in glial Ca2+. At 100 μm from the stimulation site, ATP concentration reached 6.8 μm (see Table 3). ATP ejection experiments (see Table 4) demonstrate that ATP concentrations as low as 3 μm reliably elicit glial Ca2+ increases. A similar threshold sensitivity to ATP has been reported for cultured spinal cord astrocytes (Scemes et al., 2000). These responses to ATP are mediated by purinergic receptors, which have been described in both astrocytes (Walz et al., 1994; King et al., 1996; Ralevic and Burnstock, 1998; Fam et al., 2000) and Müller cells (Jabs et al., 2000; Pannicke et al., 2000).
Other extracellular messengers
The experiments described above demonstrate that ATP functions as an extracellular messenger in Ca2+ wave propagation, but do other extracellular messengers also contribute to wave propagation in retinal glial cells? Most likely not. When suramin is added to the superfusate, blocking the action of ATP, Ca2+ wave propagation becomes completely symmetric, although the superfusate continues to flow (see Table 2; Fig. 4). If another agent is functioning as an extracellular messenger for wave propagation, it must function by activating purinergic receptors.
Glutamate, which is released during Ca2+wave propagation (Parpura et al., 1994; Bezzi et al., 1998; Innocenti et al., 2000) and can evoke Ca2+ increases in some glial cells (Finkbeiner, 1993; Verkhratsky et al., 1998), may function as a second extracellular messenger in some glial systems. Retinal glial cells are insensitive to glutamate (Newman and Zahs, 1997), however, and the transmitter does not mediate Ca2+ wave propagation in the retina, nor does glutamate function as an extracellular messenger in some cultured astrocyte preparations (Hassinger et al., 1996).
Propagation by diffusion of an internal messenger
Purinergic antagonists had much less of an effect on wave propagation between astrocytes than they did on propagation in Müller cells. Robust wave propagation through astrocytes continued in the presence of suramin and apyrase, even in trials when these agents completely blocked propagation into Müller cells. These results indicate that the diffusion of an internal messenger is the principal mechanism of wave propagation between astrocytes. The messenger is presumably IP3, as it is in other systems (Sanderson et al., 1994; Sanderson, 1996).
Purinergic antagonists and apyrase did reduce propagation through astrocytes somewhat (see Table 1), suggesting that ATP, acting as an extracellular messenger, augments wave propagation in these cells. It was noted also that the maximal radius of Ca2+ waves was reduced somewhat in eyecups as compared with those in whole-mount retinas (see Tables 1, 2). This could arise if the vitreous humor, present in eyecups but absent in whole-mounts, contains ATPases that reduce the effectiveness of ATP as an extracellular messenger.
It is curious that IP3 can function as an internal messenger for wave propagation through astrocytes, but not from astrocytes to Müller cells, although astrocytes and Müller cells are coupled together extensively. An explanation may be found in the nature of the gap junctions linking retinal glial cells (Zahs and Newman, 1997). Astrocytes are coupled to other astrocytes by homotypic junctions that pass both Neurobiotin and Lucifer yellow. Astrocytes are coupled to Müller cells, in contrast, by heterotypic junctions that permit the diffusion of the small tracer Neurobiotin from astrocytes to Müller cells, but not from Müller cells to astrocytes. In addition, the larger, negatively charged tracer Lucifer yellow does not pass through these junctions in either direction. It is possible that IP3, which also is negatively charged, is not able to pass through the heterotypic junctions coupling astrocytes to Müller cells, although it can pass through the homotypic junctions coupling astrocytes to each other (Scemes et al., 2000).
There is no evidence that Müller cells are coupled directly to each other in the rat retina. It is not surprising, therefore, that Ca2+ wave propagation between Müller cells proceeds by the extracellular ATP pathway rather than by diffusion of an internal messenger.
Glial–neuronal signaling
Increases in Ca2+ within glial cells have been shown to lead to the modulation of neuronal activity in several acutely isolated preparations. In the retina the propagation of Ca2+ waves in glial cells can result in either the excitation or inhibition of light-evoked spike activity in adjacent neurons (Newman and Zahs, 1998). In acutely isolated hippocampal slices, glial Ca2+ increases potentiate inhibitory synaptic transmission onto CA1 pyramidal neurons (Kang et al., 1998). At the neuromuscular junction, Ca2+ increases within perisynaptic Schwann cells induced by the injection of GTPγS result in a profound reduction in transmitter release from the terminals of motor neuron axons (Robitaille, 1998).
This signaling from glial cells to neurons is believed to be mediated by the Ca2+-dependent release of glutamate from glia (Parpura et al., 1994; Hassinger et al., 1995; Araque et al., 1998b; Kang et al., 1998; Sanzgiri et al., 1999). The demonstration that ATP also is released from glial cells during wave propagation raises the possibility that ATP may contribute to glial modulation of neuronal activity. In the retina both ganglion cells (Greenwood et al., 1997; Taschenberger et al., 1999) and amacrine cells (Santos et al., 1998) express purinergic receptors and may respond to ATP that is released from glial cells.
Footnotes
This work was supported by National Institutes of Health Grant EY04077. I thank P. Ceelen for technical assistance and J. I. Gepner and K. R. Zahs for helpful comments on this manuscript.
Correspondence should be addressed to Dr. Eric A. Newman, Department of Neuroscience, University of Minnesota, 6-145 Jackson Hall, 321 Church Street SE, Minneapolis, MN 55455. E-mail: ean@tc.umn.edu.
REFERENCES
- 1.Araque A, Parpura V, Sanzgiri RP, Haydon PG. Glutamate-dependent astrocyte modulation of synaptic transmission between cultured hippocampal neurons. Eur J Neurosci. 1998a;10:2129–2142. doi: 10.1046/j.1460-9568.1998.00221.x. [DOI] [PubMed] [Google Scholar]
- 2.Araque A, Sanzgiri RP, Parpura V, Haydon PG. Calcium elevation in astrocytes causes an NMDA receptor-dependent increase in the frequency of miniature synaptic currents in cultured hippocampal neurons. J Neurosci. 1998b;18:6822–6829. doi: 10.1523/JNEUROSCI.18-17-06822.1998. [DOI] [PMC free article] [PubMed] [Google Scholar]
- 3.Bezzi P, Carmignoto G, Pasti L, Vesce S, Rossi D, Lodi Rizzini B, Pozzan T, Volterra A. Prostaglandins stimulate calcium-dependent glutamate release in astrocytes. Nature. 1998;391:281–285. doi: 10.1038/34651. [DOI] [PubMed] [Google Scholar]
- 4.Boitano S, Dirksen ER. Intercellular propagation of calcium waves mediated by inositol trisphosphate. Science. 1992;258:292–295. doi: 10.1126/science.1411526. [DOI] [PubMed] [Google Scholar]
- 5.Charles AC, Naus CCG, Zhu D, Kidder GM, Dirksen ER, Sanderson MJ. Intercellular calcium signaling via gap junctions in glioma cells. J Cell Biol. 1992;118:195–201. doi: 10.1083/jcb.118.1.195. [DOI] [PMC free article] [PubMed] [Google Scholar]
- 6.Charles AC, Dirksen ER, Merrill JE, Sanderson MJ. Mechanisms of intercellular calcium signaling in glial cells studied with dantrolene and thapsigargin. Glia. 1993;7:134–145. doi: 10.1002/glia.440070203. [DOI] [PubMed] [Google Scholar]
- 7.Cotrina ML, Lin JH-C, Alves-Rodriques A, Liu S, Li J, Azmi-Ghadimi H, Kang J, Naus CCG, Nedergaard M. Connexins regulate calcium signaling by controlling ATP release. Proc Natl Acad Sci USA. 1998a;95:15735–15740. doi: 10.1073/pnas.95.26.15735. [DOI] [PMC free article] [PubMed] [Google Scholar]
- 8.Cotrina ML, Lin JHC, Nedergaard M. Cytoskeletal assembly and ATP release regulate astrocytic calcium signaling. J Neurosci. 1998b;18:8794–8804. doi: 10.1523/JNEUROSCI.18-21-08794.1998. [DOI] [PMC free article] [PubMed] [Google Scholar]
- 9.Cotrina ML, Lin JH-C, Lopez-Garcia JC, Naus CCG, Nedergaard M. ATP-mediated glia signaling. J Neurosci. 2000;20:2835–2844. doi: 10.1523/JNEUROSCI.20-08-02835.2000. [DOI] [PMC free article] [PubMed] [Google Scholar]
- 10.Crank J. The mathematics of diffusion. Oxford UP; New York: 1985. [Google Scholar]
- 11.Dani JW, Chernjavsky A, Smith SJ. Neuronal activity triggers calcium waves in hippocampal astrocyte networks. Neuron. 1992;8:429–440. doi: 10.1016/0896-6273(92)90271-e. [DOI] [PubMed] [Google Scholar]
- 12.Enkvist MOK, McCarthy KD. Activation of protein kinase C blocks astroglial gap junction communication and inhibits the spread of calcium waves. J Neurochem. 1992;59:519–526. doi: 10.1111/j.1471-4159.1992.tb09401.x. [DOI] [PubMed] [Google Scholar]
- 13.Fam SR, Gallagher CJ, Salter MW. P2Y1 purinoceptor-mediated Ca2+ wave propagation in dorsal spinal cord astrocytes. J Neurosci. 2000;20:2800–2808. doi: 10.1523/JNEUROSCI.20-08-02800.2000. [DOI] [PMC free article] [PubMed] [Google Scholar]
- 14.Finkbeiner S. Calcium waves in astrocytes—filling in the gaps. Neuron. 1992;8:1101–1108. doi: 10.1016/0896-6273(92)90131-v. [DOI] [PubMed] [Google Scholar]
- 15.Finkbeiner SM. Glial calcium. Glia. 1993;9:83–104. doi: 10.1002/glia.440090202. [DOI] [PubMed] [Google Scholar]
- 16.Greenwood D, Yao WP, Housley GD. Expression of the P2X2 receptor subunit of the ATP-gated ion channel in the retina. NeuroReport. 1997;8:1083–1088. doi: 10.1097/00001756-199703240-00004. [DOI] [PubMed] [Google Scholar]
- 17.Guan X, Cravatt BF, Ehring GR, Hall JE, Boger DL, Lerner RA, Gilula NB. The sleep-inducing lipid oleamide deconvolutes gap junction communication and calcium wave transmission in glial cells. J Cell Biol. 1997;139:1785–1792. doi: 10.1083/jcb.139.7.1785. [DOI] [PMC free article] [PubMed] [Google Scholar]
- 18.Guthrie PB, Knappenberger J, Segal M, Bennet MVL, Charles AC, Kater SB. ATP released from astrocytes mediates glial calcium waves. J Neurosci. 1999;19:520–528. doi: 10.1523/JNEUROSCI.19-02-00520.1999. [DOI] [PMC free article] [PubMed] [Google Scholar]
- 19.Hassinger TD, Atkinson PB, Strecker GJ, Whalen LR, Dudek FE, Kossel AH, Kater SB. Evidence for glutamate-mediated activation of hippocampal neurons by glial calcium waves. J Neurobiol. 1995;28:159–170. doi: 10.1002/neu.480280204. [DOI] [PubMed] [Google Scholar]
- 20.Hassinger TD, Guthrie PB, Atkinson PB, Bennett MVL, Kater SB. An extracellular signaling component in propagation of astrocyte calcium waves. Proc Natl Acad Sci USA. 1996;93:13268–13273. doi: 10.1073/pnas.93.23.13268. [DOI] [PMC free article] [PubMed] [Google Scholar]
- 21.Hubley MJ, Locke BR, Moerland TS. The effects of temperature, pH, and magnesium on the diffusion coefficient of ATP in solutions of physiological ionic strength. Biochim Biophys Acta. 1996;1291:115–121. doi: 10.1016/0304-4165(96)00053-0. [DOI] [PubMed] [Google Scholar]
- 22.Innocenti B, Parpura V, Haydon PG. Imaging extracellular waves of glutamate during calcium signaling in cultured astrocytes. J Neurosci. 2000;20:1800–1808. doi: 10.1523/JNEUROSCI.20-05-01800.2000. [DOI] [PMC free article] [PubMed] [Google Scholar]
- 23.Jabs R, Guenther E, Marquordt K, Wheeler-Schilling TH. Evidence for P2X3, P2X4, P2X5 but not for P2X7 containing purinergic receptors in Müller cells of the rat retina. Mol Brain Res. 2000;76:205–210. doi: 10.1016/s0169-328x(99)00339-3. [DOI] [PubMed] [Google Scholar]
- 24.John GR, Scemes E, Suadicani SO, Liu JSH, Charles PC, Lee SC, Spray DC, Brosnan CF. IL-1β differentially regulates calcium wave propagation between primary human fetal astrocytes via pathways involving P2 receptors and gap junction channels. Proc Natl Acad Sci USA. 1999;96:11613–11618. doi: 10.1073/pnas.96.20.11613. [DOI] [PMC free article] [PubMed] [Google Scholar]
- 25.Kang J, Goldman SA, Nedergaard M. Astrocyte-mediated potentiation of inhibitory synaptic transmission. Nat Neurosci. 1998;1:683–692. doi: 10.1038/3684. [DOI] [PubMed] [Google Scholar]
- 26.King BF, Neary JT, Zhu Q, Wang S, Norenberg MD, Burnstock G. P2 purinoceptors in rat cortical astrocytes: expression, calcium-imaging, and signaling studies. Neuroscience. 1996;74:1187–1196. doi: 10.1016/0306-4522(96)00209-6. [DOI] [PubMed] [Google Scholar]
- 27.Newman EA. Membrane physiology of retinal glial (Müller) cells. J Neurosci. 1985;5:2225–2239. doi: 10.1523/JNEUROSCI.05-08-02225.1985. [DOI] [PMC free article] [PubMed] [Google Scholar]
- 28.Newman EA. Glia of the retina. In: Ryan SJ, editor. Retina. Mosby; St. Louis: 2001. pp. 89–103. [Google Scholar]
- 29.Newman EA, Bartosch R. An eyecup preparation for the rat and mouse. J Neurosci Methods. 1999;93:169–175. doi: 10.1016/s0165-0270(99)00138-7. [DOI] [PubMed] [Google Scholar]
- 30.Newman EA, Zahs KR. Calcium waves in retinal glial cells. Science. 1997;275:844–847. doi: 10.1126/science.275.5301.844. [DOI] [PMC free article] [PubMed] [Google Scholar]
- 31.Newman EA, Zahs KR. Modulation of neuronal activity by glial cells in the retina. J Neurosci. 1998;18:4022–4028. doi: 10.1523/JNEUROSCI.18-11-04022.1998. [DOI] [PMC free article] [PubMed] [Google Scholar]
- 32.Pannicke T, Fischer W, Biedermann B, Schädlich H, Grosche J, Faude F, Wiedemann P, Allgaier C, Illes P, Burnstock G, Reichenbach A. P2X7 receptors in Müller cells from the human retina. J Neurosci. 2000;20:5965–5972. doi: 10.1523/JNEUROSCI.20-16-05965.2000. [DOI] [PMC free article] [PubMed] [Google Scholar]
- 33.Parpura V, Basarsky TA, Liu F, Jeftinija K, Jeftinija S, Haydon PG. Glutamate-mediated astrocyte–neuron signaling. Nature. 1994;369:744–747. doi: 10.1038/369744a0. [DOI] [PubMed] [Google Scholar]
- 34.Ralevic V, Burnstock G. Receptors for purines and pyrimidines. Pharmacol Rev. 1998;50:413–492. [PubMed] [Google Scholar]
- 35.Ransom BR. Gap junctions. In: Kettenmann H, Ransom B, editors. Neuroglia. Oxford UP; New York: 1995. pp. 299–318. [Google Scholar]
- 36.Robitaille R. Modulation of synaptic efficacy and synaptic depression by glial cells at the frog neuromuscular junction. Neuron. 1998;21:847–855. doi: 10.1016/s0896-6273(00)80600-5. [DOI] [PubMed] [Google Scholar]
- 37.Sanderson MJ. Intercellular waves of communication. News Physiol Sci. 1996;11:262–269. [Google Scholar]
- 38.Sanderson MJ, Charles AC, Boitano S, Dirksen ER. Mechanisms and function of intercellular calcium signaling. Mol Cell Endocrinol. 1994;98:173–187. doi: 10.1016/0303-7207(94)90136-8. [DOI] [PubMed] [Google Scholar]
- 39.Santos PF, Santos MS, Carvalho AP, Duarte CB. Modulation of [3H] acetylcholine release from cultured amacrine-like neurons by adenosine A1 receptors. J Neurochem. 1998;71:1086–1094. doi: 10.1046/j.1471-4159.1998.71031086.x. [DOI] [PubMed] [Google Scholar]
- 40.Sanzgiri RP, Araque A, Haydon PG. Prostaglandin E2 stimulates glutamate receptor-dependent astrocyte neuromodulation in cultured hippocampal cells. J Neurobiol. 1999;41:221–229. [PubMed] [Google Scholar]
- 41.Scemes E, Suadicani SO, Spray DC. Intercellular communication in spinal cord astrocytes: fine tuning between gap junctions and P2 nucleotide receptors in calcium wave propagation. J Neurosci. 2000;20:1435–1445. doi: 10.1523/JNEUROSCI.20-04-01435.2000. [DOI] [PMC free article] [PubMed] [Google Scholar]
- 42.Taschenberger H, Juttner R, Grantyn R. Ca2+-permeable P2X receptor channels in cultured rat retinal ganglion cells. J Neurosci. 1999;19:3353–3366. doi: 10.1523/JNEUROSCI.19-09-03353.1999. [DOI] [PMC free article] [PubMed] [Google Scholar]
- 43.Verkhratsky A, Orkand RK, Kettenmann H. Glial calcium: homeostasis and signaling function. Physiol Rev. 1998;78:99–141. doi: 10.1152/physrev.1998.78.1.99. [DOI] [PubMed] [Google Scholar]
- 44.Walz W, Gimpl G, Ohlemyer C, Kettenmann H. Extracellular ATP-induced currents in astrocytes: involvement of a cation channel. J Neurosci Res. 1994;38:12–18. doi: 10.1002/jnr.490380104. [DOI] [PubMed] [Google Scholar]
- 45.Wang Z, Haydon PG, Yeung ES. Direct observation of calcium-independent intercellular ATP signaling in astrocytes. Anal Chem. 2000;72:2001–2007. doi: 10.1021/ac9912146. [DOI] [PubMed] [Google Scholar]
- 46.Zahs KR, Newman EA. Asymmetric gap junctional coupling between glial cells in the rat retina. Glia. 1997;20:10–22. [PubMed] [Google Scholar]