

Abstract
Adsorption of lysozyme (Lys), human serum albumin (HSA), and immunoglobulin G (IgG) to anion- and cation-exchange resins is dominated by electrostatic interactions between protein and adsorbent. The solution-depletion method of measuring adsorption shows, however, that these proteins do not irreversibly adsorb to ion-exchange surfaces, even when the charge disparity between adsorbent and protein inferred from protein pI is large. Net-positively-charged Lys (pI = 11) and net-negatively-charged HSA (pI = 5.5) adsorb so strongly to sulfopropyl sepharose (SP; a negatively-charged, strong cation exchange resin, −0.22 mmol/mL exchange capacity) that both resist displacement by net-neutral IgG (pI = 7.0) in simultaneous adsorption-competition experiments. By contrast, IgG readily displaces both Lys and HSA adsorbed either to quarternary-ammonium sepharose (Q; a positively-charged, strong anion exchanger, + 0.22 mmol/mL exchange capacity) or octadecyl sepharose (ODS, a neutral hydrophobic resin, 0 mmol/mL exchange capacity). Thus it is concluded that adsorption results do not sensibly correlate with protein pI and that pI is actually a rather poor predictor of affinity for ion-exchange surfaces. Adsorption of Lys, HSA, and IgG to ion-exchange resins from stagnant solution leads to adsorbed multi-layers, into-or-onto which IgG adsorbs in adsorption-competition experiments. Comparison of adsorption to ion-exchange resins and neutral ODS leads to the conclusion that the apparent standard free-energy-of-adsorption of Lys, HSA, and IgG is not large in comparison to thermal energy due to energy-compensating interactions between water, protein, and ion-exchange surfaces that leaves a small net . Thus water is found to control protein adsorption to a full range of substratum types spanning hydrophobic (poorly water wettable) surfaces, hydrophilic surfaces bearing relatively-weak Lewis acid/base functionalities that wet with (hydrogen bond to) water but do not exhibit ion-exchange properties, and surfaces with strong Lewis acid/base functional groups that exhibit ion-exchange properties in the conventional-chemistry sense of ion exchange.
Impact Statement: This work yields detailed insights into the physical chemistry of protein adsorption by elucidating relationships among adsorbent surface charge, capacity to adsorb proteins with different net charge inferred from pI, and the energy required to displace water at the solution-material interface.
Keywords: Protein adsorption, surface energy, HAS
1.0 Introduction
Mechanisms of protein adsorption to artificial materials remain an important and lively topic of research in biomaterials and biotechnology [1]. It is hoped that an improved understanding of the biophysical chemistry of adsorption that causes protein concentration and composition within the surface region to be different from that of the bulk solution from which protein adsorbs [2-5] will lead to improved surface-engineering routes to advanced biomaterials. This biophysical chemistry nominally includes interactions among the major system constituents – substratum surface, protein, and water (specifically the aqueous phase including ions). In turn, these obvious interactive constituents implicate protein/surface, protein/protein, protein/water, and water/surface as the primary pair-wise influences on the protein-adsorption process.
Protein/surface interactions have been a primary focus of modern theoretical work because the energetics involved are presumed to be large compared to thermal energy (see, for example, ref. [6] and citations therein; also theory underlying the popular Random Sequential Adsorption (RSA) model [7, 8]). Quantitatively, the phrase ‘large compared to thermal energy’ depends on the type of theory applied and specifics considered, and so considerable care must be exercised in comparing different expressions for interaction energetics used in the literature (e.g. free energies vs. potential energies). A limited survey of the literature suggests that typical protein/surface interactions contemplated by theory are of the order −20RT (free energy, −50 kJ/mol) and −80RT (potential energy, −200 kJ/mol) [9–13]; where R is the gas constant, T is Kelvin temperature, and the negative sign denotes attraction between protein and surface. Interestingly, in this regard, we and others find experimentally that the apparent free energy of protein adsorption is not large compared to thermal energy. Indeed, for the adsorption of disparate proteins spanning three decades of molecular weight to different hydrophobic surfaces (buffer-air interface, self-assembled monolayers, silanized glass, and octadecyl sepharose (ODS) chromatographic packing; see ref. [4] and citations therein for more discussion). This modest free energy is entirely consistent with the generic, weak “biosurfactancy” observed for different purified proteins and complex protein mixtures such as blood plasma/serum (see refs [1, 14–19] and citations therein), as well as the commensurately small quantity of protein that adsorbs to various materials (generally falling within the 2–3 mg/m2 range for hydrophobic surfaces [18]). It is also observed that protein adsorption decreases with increasing adsorbent hydrophilicity or, in other words, increases to zero with increasing hydrophilicity (see refs. [4, 20] and citations therein). Thus it appears that experimentally-measured standard free energies of protein adsorption are at least 4 × smaller than theoretical protein/surface interaction energies. Clearly, for both experiment and theory to be simultaneously correct, one-or-more of the other pair-wise influences mentioned above must involve compensating interaction energetics, leaving a small net-negative residual out of a presumably large negative protein/surface interaction-energy budget.
This paper examines adsorption of lysozyme (Lys, pI = 11), human serum albumin (HSA, pI = 5.5), and immunoglobulin G (IgG, pI = 7.0) to sepharose-based chromatographic resins bearing anion- and cation-exchange functionalities to which strong charge interactions between protein and adsorbent are anticipated [21–29]. The objective is to compare adsorption characteristics of ion-exchange surfaces to hydrophobic octadecyl sepharose (ODS) with similar physical properties to help rationalize theory and experiment. The venerable solution-depletion method of measuring protein adsorption [3] is used to measure adsorption isotherms and protein-adsorption competition [5] is applied to probe strength of protein adsorption and adsorption reversibility. Results show that water is an important moderating influence in protein adsorption to ion-exchange surfaces that cannot be ignored in theoretical treatments of protein adsorption.
2. Methods and Materials
Proteins and Adsorbent Particles
Proteins were used as received from the vendor without further purification. Table 1 lists relevant details. Protein solutions were prepared by 80:20 or 90:10 dilution in PBS. SDS-PAGE of protein solutions yielded single bands, although IgG and was characteristically broader than that of Lys or HSA. Octyl Sepharose™ 4 Fast Flow adsorbent, Q Sepharose™ Fast Flow adsorbent, DEAE Sepharose™ Fast Flow adsorbent, SP Sepharose™ Fast Flow adsorbent, and CM Sepharose™ Fast Flow adsorbent were obtained from Amersham Biosciences and ion exchange capacities provided by the vendor were accepted without additional analysis (see columns 2 and 3 of Table 2). These adsorbents were identical in all respects except for surface chemistry [29] (40% by volume of 90 μm nominal-diameter sepharose-based particles dispersed in 20% aqueous ethanol solution). Therefore, it was assumed in this work that dispensed surface area was also identical within precision limits imposed by dispensing particles from suspension by pipette. The actual surface area of these hydrogel particles was not measured because accurate knowledge of adsorbent surface area is not necessary in volumetric analysis of protein adsorption [3–5] and because analytical difficulties encountered in working with relatively low-nominal-surface-area, hydrated-hydrogel particles precluded accurate surface-area determinations at a size scale relevant to proteins. Unmeasured differences in dispensed surface area among different adsorbents would introduce systematic error in comparison of adsorption capacities listed in Table 2 (column 4). However, differences in adsorbent capacities among adsorbents were too large to be reasonably attributed to surface area alone. We therefore concluded that differences in measured adsorbent capacities among sepharose adsorbents were, in fact, substantially related to surface chemistry [29].
Table 1.
Purified Protein Source and Purity
| Name of protein (Origin) | Molecular weight (kDa) | As-received form | Purity (electrophoresis) or activity | Vendor |
|---|---|---|---|---|
| Lysozyme (Human Neutrophils) | 15 | powder | > 95% | Sigma Aldrich |
| Human serum Albumin (Human Blood) | 66.3 | powder | 96–99% | Sigma Aldrich |
| Human IgG (Human Blood) | 160 | powder | > 95% | Sigma Aldrich |
Table 2.
Characteristic protein adsorption parameters from depletion experiments using surface charged and uncharged sepharose
| Experimental | ||||||
|---|---|---|---|---|---|---|
| Protein (MW, pI) | Surface (Acronym) | Ion exchange capacity (Ave., mmol/mL) | (mg/mL) (N, R2) | (mg/mL) | (Si)n (N, R2) | |
| Lysozyme (14.5kDa, 11) | Sulfopropyl (SP) | − 0.22 ± 0.05 | 1.69 ± 0.09 (16, 0.99) | 1.86 ± 0.10 | 0.91 ± 0.01 (12, 0.99) | 6.26 ± 0.41 |
| Carboxy methyl (CM) | − 0.11 ± 0.03 | 1.11 ± 0.13 (13, 0.93) | 1.48 ± 0.18 | 0.75 ± 0.02 (13, 0.98) | 4.11 ± 0.50 | |
| Quaternary ammonium (Q) | 0.22 ± 0.06 | 0.74 ± 0.11 (16, 0.93) | 2.06 ± 0.33 | 0.36 ± 0.02 (12, 0.90) | 2.74 ± 0.42 | |
| Diethyl aminoethyl (DEAE) | 0.14 ± 0.04 | 0.68 ± 0.03 (14, 0.97) | 1.12 ± 0.08 | 0.61 ± 0.03 (10, 0.96) | 2.52 ± 0.15 | |
| Octadecyl Sepharose (Neutral) | 0 | 0.27 ± 0.01 (12, 0.97) | 0.86 ± 0.05 | 0.32 ± 0.02 (8, 0.92) | 1 | |
| Albumin (66.3kDa, 5.5) | Sulfopropyl (SP) | − 0.22 ± 0.05 | 2.98 ± 0.49 (30, 0.93) | 9.14 ± 1.58 | 0.33 ± 0.02 (16, 0.82) | 2.04 ± 0.34 |
| Carboxy methyl (CM) | − 0.11 ± 0.03 | 2.98 ± 0.30 (22, 0.84) | 7.74 ± 043 | 0.39 ± 0.02 (25, 0.83) | 2.04 ± 0.21 | |
| Quaternary ammonium (Q) | 0.22 ± 0.06 | 5.02 ± 0.47 (17, 0.94) | 8.78 ± 0.87 | 0.57 ± 0.02 (13, 0.91) | 3.44 ± 0.33 | |
| Diethyl aminoethyl (DEAE) | 0.14 ± 0.04 | 2.55 ± 0.14 (30, 0.95) | 6.99 ± 0.49 | 0.37 ± 0.02 (22, 0.88) | 1.75 ± 0.11 | |
| Octadecyl Sepharose (Neutral) | 0 | 1.46 ± 0.05 (30, 0.98) | 3.40 ± 0.16 | 0.46 ± 0.02 (15, 0.94) | 1 | |
| IgG (160kDa, 7) | Sulfopropyl (SP) | − 0.22 ± 0.05 | 4.53 ± 0.20 (14, 0.98) | 13.21 ± 0.70 | 0.34 ± 0.01 (10, 0.92) | 1.60 ± 0.19 |
| Carboxy methyl (CM) | − 0.11 ± 0.03 | 4.82 ± 0.64 (13, 0.86) | 12.34 ± 0.43 | 0.39 ± 0.03 (7, 0.87) | 1.70 ± 0.29 | |
| Quaternary ammonium (Q) | 0.22 ± 0.06 | 5.88 ± 0.60 (12, 0.94) | 13.03 ± 0.43 | 0.45 ± 0.02 (7, 0.97) | 2.07 ± 0.29 | |
| Diethyl aminoethyl (DEAE) | 0.14 ± 0.04 | 3.58 ± 1.10 (12, 0.93) | 9.68 ± 2.98 | 0.37 ± 0.01 (10, 0.92) | 1.26 ± 0.42 | |
| Octadecyl Sepharose (Neutral) | 0 | 2.84 ± 0.23 (15, 0.96) | 9.50 ± 0.16 | 0.30 ± 0.01 (10, 0.89) | 1 | |
Sepharose adsorbents were freshly prepared just before each depletion experiment by 3 × washing in PBS (to remove ethanol) using a sequential centrifugation/resuspension protocol (40 RPM for 1 min in a Hettick microtube fixed-rotor centrifuge, VWR) that processed 1 mL of as-received suspension (600 μL fluid, 400 μL beads). After each of 3 centrifugations, 500 μL of supernate was replaced with 500 μL PBS, ending with a 60:40 v/v stock suspension in PBS. For each depletion experiment, 50 μL stock (30 μL fluid, 20 μL beads) was pipetted into a 0.5 mL microtube from which 25 μL supernate was removed after centrifugation, leaving 5 μL PBS and 20 μL adsorbent beads (~ 65 cm2 adsorbent surface area or a 97:3 adsorbent-to-tube surface area ratio). Beads were re-suspended by gentle pipette aspiration in 25 μL protein solution prepared in advance to the desired protein composition or concentration so that the final depletion volume VB = 30 μL. In all depletion experiments, adsorbent settled to the bottom of the conical test tube, allowing particle-free supernate to be sampled without centrifugation. Control experiments performed using continuous mixing did not lead to statistically-different adsorption isotherms (see section 3.1 for details).
Depletion Measurements
Experimental methods for the SDS-electrophoresis implementation of the depletion method have been disclosed in detail elsewhere [3–5]. Briefly, protein solutions (25 μL) in phosphate-buffered-saline (PBS; Sigma; 0.14 M NaCl, 3mM KCL prepared in 18 MΩ water) at varying concentrations were mixed with a fixed amount (surface area) of washed sepharose particles (25 μL; see below) by gentle pipette aspiration and allowed to stand undisturbed in 0.5 mL conical microtubes (Safe-lock micro centrifuge tubes, Eppendorf; approximately 2 cm2 internal surface area) for at least 1 hr before analysis. No correction was made for the small-but-measurable adsorption to tube surfaces [4] (see further Computational Methods below).
This basic depletion method was adapted for measuring protein competition from binary solutions (see ref. [5] for more details). Two proteins were mixed in solution and brought into contact with adsorbent and allowed to simultaneously engage in adsorption competition from solution. Specifically, simultaneous competition brought 30 μL of a 3.3 mg/mL HSA solution,1.3 mg/mL Lys solution (octadecyl sepharose), 9.2 mg/mL HSA solution, or 2.1 mg/mL Lys solution (ion- exchange sepharose) containing variable concentrations of IgG into contact with adsorbent, whereupon HSA or Lys competed with IgG in simultaneous adsorption to the same surface for 1 hour.
SDS-PAGE Electrophoresis
26 lane NuPAGE® Novex Tris-Acetate precast gels (Invitrogen; 500 kDa capacity) were used to separate and quantify proteins. Electrophoresis was carried out for 1 hour at 150 V using an XCell SureLock™ Cell (Invitrogen). Gels were stained with SimplyBlue™ SafeStain (Invitrogen) for 1 hour and destained with de-ionized (18 MΩ) water for several hours while mixing on a standard hematology rocker. Band intensity was quantified using the Gel-doc system (Bio-Rad Laboratories) that employed a highly-sensitive CCD camera to read optical density (OD). A standard curve was prepared for each protein and each gel using the first 6–12 lanes by applying solutions of known concentration of the probe protein(s). Linear calibration curves were obtained (R2 > 98% ) within the concentration range mg/mL for gels of all proteins (single- and multi-component solutions) listed in Table 1. Each different protein required a separate calibration curve on the same gel to account for differences in staining density.
Computational Methods
Computational and statistical methods have been disclosed in detail in ref. [3]. Briefly reiterating essential details for the purposes of this paper, amount of the ith protein adsorbed to the nth particulate adsorbent was calculated by difference (Di)n in protein-solution concentrations before ( ) and after (WBi)n adsorption to particulates . In the absence of particulate adsorbent, (Di)n < 0.1 mg/mL for all proteins at surface-saturating bulk-solution concentrations and decreased in proportion to decreasing . This background adsorption, due to all sources of protein loss to tubes and pipette tips in handling procedures, represented less than 1–2% of experimental (Di)n measured in the presence of particulate adsorbent. Thus, it was concluded that background correction of depletion measurements was unnecessary within the range explored in this work. An empirical statistical-fitting procedure using the ‘Chapman equation’ described in [3] was applied to extract the important experimental parameters and with a measure of statistical confidence. Columns 4–5 of Table 2 collects and values obtained in this way for the test proteins listed in column 1, along with the total number of data points(N ) in the depletion curve and R2 of the Chapman fit.
3. Results
3.1 Solution-Depletion Method
Adsorption of Lys, HSA, and IgG to sepharose-based chromatographic resins was measured by solution depletion implemented using SDS-gel electrophoresis as a multiplexing, separation-and-quantification tool, as described in the section 2 and refs. [3–5]. Proteins of Table 1 were selected to span a range of isoelectric points 7 < pI < 12 (column 1 of Table 2), representing net positive, negative, and neutral classes of test proteins as inferred from pI. Five types of sepharose-based chromatographic packing resins were used in this work (column 2, Table 2) with variable surface density of either anionic or cationic ion-exchange functionalities measured in mmol/mL particles (column 3, Table 2). Octadecyl sepharose (ODS) was used a hydrophobic comparison surface bearing no ion-exchange functionalities assigned (but not measured) 0 mmol/mL. These adsorbents were identical in all respects (surface area, base material, preparation, vendor, etc.) except for surface chemistry [29] and thus represented a consistent set of materials to which the affect of surface chemistry on protein adsorption was compared.
The basic idea behind the depletion method was to measure the w/v concentration (mg/mL) of protein i in solution before ( ) and after (WBi) contact with test particulate adsorbents. Loss in solution concentration at steady state due to adsorption was calculated by difference (mass balance) as the depletion (mg/mL) for each of n adsorbents listed in column 2 of Table 2. The neutral ODS adsorbent was a reference surface identified with an r subscript (i.e. n = r ). As such, (Di)n was a purely experimental parameter calculated from measurable bulk-solution concentrations. Thus, the depletion method met the need for unambiguous interpretation in a manner that was largely free of experimental artifacts; such as solute labeling, rinsing/drying, or complicated instrumentation and was sensitive to about 0.2 mg/mL (estimated to be equivalent to 0.3 mg/m2 [4]). Separation by electrophoresis permitted use of multiple proteins in the adsorption experiment, thereby allowing adsorption competition among two proteins i, j to be efficiently measured.
According to the volumetric interpretation of protein adsorption, solution depletion was due to the fact that protein partitioned from bulk solution into a three-dimensional surface region (a.k.a. interphase, denoted with subscript I) that separated bulk solution from the physical surface (see refs. [3–5, 15] for more discussion of the interphase model). This interphase region had a discrete volume VI and concentration (WIi)n so that ; where VB was the volume of the bulk-solution phase. The maximum (saturation) interphase concentration was at steady-state. Protein partitioning between bulk-solution and interphase was controlled by a partition coefficient such that for the nth adsorbent under consideration. Previous work “certified” theory by first studying adsorption of a broad range of single proteins to hydrophobic [3] surfaces (ODS and silanized glass) from aqueous-buffer solution, showing that results comported with thermochemically-measured free energies of adsorption and interfacial energetics measured by tensiometry (contact angle and wettability methods). Subsequently, HSA adsorption to silanized-glass adsorbent particles with incrementally-increasing hydrophilicity was measured [4], showing here that mass and energy balances for HSA adsorption were in full agreement. Consistent mass-and-energy balance obtained using very different analytical methods engendered confidence that this gel-electrophoresis implementation of the depletion method provided internally-consistent and accurate results; at least for proteins adsorbing to surfaces from stagnant fluids at steady state. It is important to emphasize that control experiments in which tube contents were periodically mixed by agitating tube contents or continuously mixed on a hematology rocker did not yield statistically different results than unmixed experiments for any of the adsorbent particles studied in this work (at ≤ 2σ or ≤ 95% confidence interval; data not shown; see also ref. [3]). Furthermore, time-and-concentration interfacial energetics of a wide variety of blood proteins and mixtures shows that adsorption to stagnant buffer/air or buffer/solid surfaces comes to steady state within the 1 hour equilibration time utilized in depletion experiments [1, 14–20, 30]. Consequently, continuous mixing of low-volume solutions with adsorbent was abandoned as an unnecessary inconvenience that invited experimental error related to solution/particle hang-up within the plastic microtube. Adsorbent particles settled to the bottom of the conical test tube during the adsorption experiment, allowing particle-free supernate to be sampled without centrifugation, avoiding inadvertent loading of adsorbent particles onto electrophoresis gels (which causes spurious results). We have also demonstrated utility of the depletion method in studying protein-adsorption competition to the same adsorbent surface immersed in multi-component solutions [5].
3.2 Depletion of Purified Proteins
Fig. 1 summarizes depletion experiments obtained for i = HAS (Panel A) and Lys (Panel B) for strong anion (Q), strong cation (SP) and neutral (ODS) adsorbents by plotting (Di)n against initial solution concentration (hereafter referred to as “depletion curves”). Results for weak ion exchange resins CM and DEAE were intermediate to strong (Q) and neutral (depletion curves not shown). Results for IgG were qualitatively the same as HSA (also not shown). Depletion curves for all protein-adsorbent pairs, including silanized-glass adsorbents studied previously [3–5], were qualitatively similar in that each exhibited linear-like depletion trends with characteristic slope (Si)n over the concentration interval that was followed by a saturation at (see Fig. 1 annotations). The experimental parameters , and slope (Si)n were obtained from depletion curves using statistical-fitting procedures described section 2 and results compiled in columns 4–6 of Table 2.
Figure 1.

Depletion curves for purified human serum albumin (HSA, Panel A) and lysozyme (Lys, Panel B) adsorbing to quarternary-ammonium sepharose (Q; a positively-charged, strong anion exchanger, +0.22 mmol/mL exchange capacity), sulfopropyl sepharose (SP; a negatively-charged, strong cation exchange resin, −0.22 mmol/mL exchange capacity) or octadecyl sepharose (ODS; a neutral hydrophobic resin, 0 mmol/mL exchange capacity; see Table 2). Error bars on symbols represent estimated uncertainty calculated by propagation of error in calibration curves relating SDS gel electrophoresis band optical density to protein concentration (see section 2 and ref. [3] for more discussion of analytical methods). Open and closed symbols represent different trials with the same protein. Dashed vertical lines mark the initial protein-solution concentration of purified HSA or Lys required to saturate adsorbent surfaces. Dashed horizontal lines measure maximum depletions obtained at surface saturation of pure HSA or Lys. Lines through the data represent results of statistical fitting described in sections 2 and 3.
Column 7 of Table 2 computes the ratio of depletion parameters as a means of comparing adsorption to ion exchange resins (surfaces n ) to the neutral reference surface r. It follows from the definition of depletion that , the ratio of adsorbed protein mass. Notice that for all protein and ion-exchange adsorbent pairs, meaning that the ion-exchange adsorbent capacity for protein was greater than that of ODS. Fig. 2 plots as a function of nominal ion-exchange strength for IgG, HSA, and Lys (in back-to-front order along the pI axis), where the ODS was assumed to be neutral.
Figure 2.
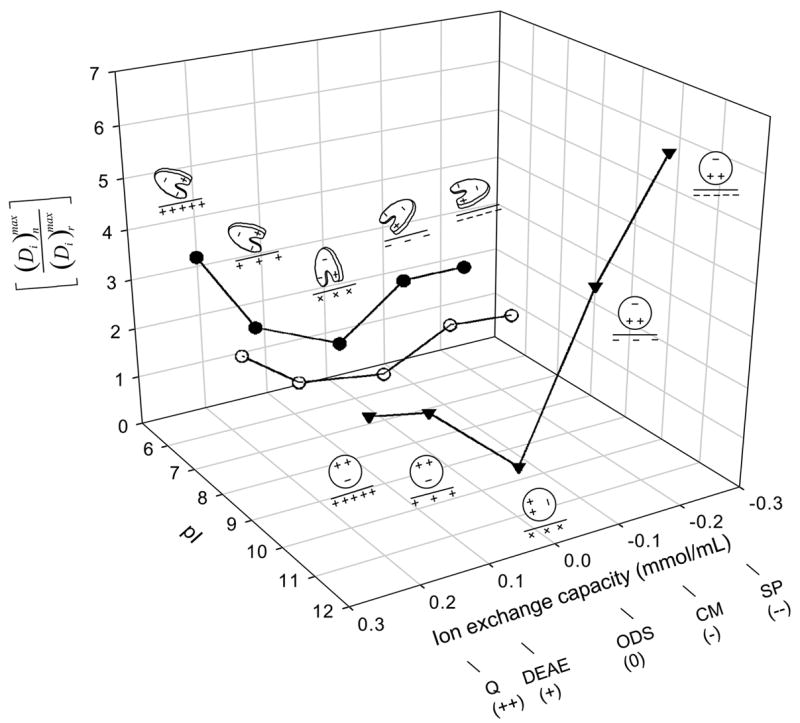
Relationship among protein pI (HSA, closed circles; IgG, open circles; Lys, inverted triangles), adsorbent ion-exchange capacity (++ = strong anion exchanger, + = weak anion exchanger, neutral = ODS, − = weak cation exchanger, −− = strong cation exchanger; see Table 2 for adsorbent identities), and adsorbent-capacity ratio that measures the excess amount of protein adsorbed to ion-exchange surfaces n over the neutral reference surface octadecyl sepharose (ODS, surface r). Notice that trends in were consistent with a simple electrostatic-interaction interpretation suggested by protein-cartoon insets shown for HSA and Lys (IgG not diagrammed for the sake of clarity). Lines through the data points are guides to the eye.
3.3 Protein Adsorption Competition
Figs. 3 and 4 compare outcomes of binary adsorption competition experiments in which increasing solution concentrations of IgG (protein j, , mg/mL, abscissa) competed with protein i (HSA, Fig. 3; Lys, Fig. 4) adsorbed to Q (Panel A, strong anion exchanger), SP (Panel B, strong cation exchanger), or ODS (Panel C, neutral). Data for IgG competition with HSA on ODS was taken from ref. [5]. Competing concentrations of HSA and Lys correspond to for ODS (3.3 mg/mL and 1.3 mg/mL, respectively; see Table 2). Competing concentrations of HSA for charged surfaces correspond to for SP (9.2 mg/mL; see Table 2). Competing concentrations of Lys for charged surfaces correspond to for Q (2.1 mg/mL; see Table 2). The basis for choosing competing-concentrations was to assure that protein i was at-or-above surface-saturating solution concentrations for each surface, bearing in mind that was considerably lower for ODS than for ion-exchange resins and was treated accordingly.
Figure 3.

Adsorption competition between HSA and IgG adsorbing to (Panel A) quarternary-ammonium sepharose (Q; a positively-charged, strong anion exchanger, + 0.22 mmol/mL exchange capacity), (Panel B) sulfopropyl sepharose (SP; a negatively-charged, strong cation exchange resin, −0.22 mmol/mL exchange capacity), or (Panel C) octadecyl sepharose (ODS, a neutral hydrophobic resin, 0 mmol/mL exchange capacity; see Table 2 for adsorbent identities). Ordinate simultaneously plots solution depletion of HSA (protein i, circles) and IgG (protein j, squares) with the parameter (Dij)n for each of the n surfaces at different IgG solution concentrations mg/mL in surface-saturating HSA solution concentrations = 3.3 mg/mL for ODS or = 9.2 mg/mL for Q and SP (see section 2 for details). Error bars on symbols represent estimated uncertainty calculated by propagation of error in calibration curves relating SDS gel electrophoresis band optical density to protein concentration (see section 2 and ref. [3] for more discussion of analytical methods). Dashed vertical lines and annotations note the solution concentration range when protein i exceeds that of protein j and solid lines through the data are guides to the eye. Notice that adsorption of net-neutral IgG was at the expense of HSA on all three surfaces.
Figure 4.

Adsorption competition between Lys and IgG adsorbing to (Panel A) quarternary-ammonium sepharose (Q; a positively-charged, strong anion exchanger, +0.22 mmol/mL exchange capacity), (Panel B) sulfopropyl sepharose (SP; a negatively-charged, strong cation exchange resin, −0.22 mmol/mL exchange capacity), or (Panel C) octadecyl sepharose (ODS; a neutral hydrophobic resin, 0 mmol/mL exchange capacity; see Table 2 for adsorbent identities). Ordinate simultaneously plots solution depletion of Lys (protein i, triangles) and IgG (protein j, squares) with the parameter (Dij)n for each of the n surfaces at different IgG solution concentrations mg/mL in surface-saturating Lys solution concentrations = 1.3 mg/mL for ODS or = 2.1 mg/mL for Q and SP (see section 2 for details). Open and closed symbols represent different trials with the same protein. Error bars on symbols represent estimated uncertainty calculated by propagation of error in calibration curves relating SDS gel electrophoresis band optical density to protein concentration (see section 2 and ref. [3] for more discussion of analytical methods). Dashed vertical lines and annotations note the solution concentration range when protein i exceeds that of protein j and solid lines through the data are guides to the eye. Notice that adsorption of net-neutral IgG was at the expense of Lys on Q and ODS but not SP. Trends in Lys adsorption on ODS are analytically difficult to discern because the surface capacity falls within technique sensitivity limits.
Depletion of HSA or Lys (protein i) and IgG are plotted on the same axis in Figs. 3 and 4 ((Di)n ordinate, mg/mL) so that trends between competing proteins can be readily compared (where the ij subscript emphasizes the mixed solution case). Adsorption competition between proteins i and j was simultaneous in that a solution of both proteins (at dissimilar concentrations) contacted the adsorbent surface, arriving at the steady-state depletion (Dij)n obtained after 1 hour equilibration (see ref. [5] for comparison to sequential adsorption competition and mass-balance analysis). Comparison of Figs. 3 to 4 shows that depletion of Lys was much smaller than HSA on all surfaces. This observation corresponded to the fact that depletion was directly proportional to interphase volume VIi, which is comparatively low for small proteins such as Lys (compare also of Lys to HSA and IgG in Table 2).
Inspection of Figs. 3 and 4 reveals that data trends were similar among adsorbents and proteins, except for Lys adsorption on SP (Fig. 4 Pane B). In particular, it is evident from Fig. 3 that increased IgG adsorption was at the expense of HSA on all surfaces. That is to say, (Di)n decreased (HSA adsorption decreased) while (Dj)n increased (IgG adsorption increased) as increased (solution concentration of IgG increased at fixed HSA concentration). This trend was repeated for Lys on Q (Fig. 4 Panel A) and ODS (Fig. 4 Panel C, see inset), although Lys depletion was relatively small, for the reason noted above. By contrast, little-or-no Lys was displaced from SP by increasing quantities of adsorbed IgG. That is to say, change in (Di)n was insignificant (measured solution depletion fell within 1σ of the average; see Fig. 4B annotations) while (Di)n increased slightly (IgG adsorption increased) as increased (solution concentration of IgG increased at fixed Lys concentration).
4.0 Discussion
Two basic categories of results are reported in this paper. The first is raw experimental data plotted in the form of “depletion curves” like those collected in Fig. 1 or “protein-adsorption-competition curves” represented in Fig. 3–4 that stand independent of any particular interpretive theory. It is evident from this experimental data that proteins adsorb to ion-exchange resins in a manner consistent with an ion-exchange-type mechanism, in basic accord with previous studies [23, 24, 26, 28, 29] and as discussed further below. The second category of results are experimental data interpreted in terms of a protein-adsorption model asserting that proteins reversibly partition into a 3D interphase separating the bulk solution from the adsorbent surface. Unlike previous work applying this so-called “volumetric interpretation” of protein adsorption [3–5], experimental evidence at hand is insufficient to allow estimation of either partition coefficients Pi that measure adsorption avidity to surfaces or the interphase volume VI occupied by adsorbed protein. However, relative values are readily accessible from experimental measurements, from which it is concluded that the overall free energy of protein adsorption to ion-exchange resins is not large in comparison to thermal energy. This section first discusses experimental depletion curves and binary-protein competition results. Adsorption results are then theoretically interpreted as a step toward understanding depletion curves in terms of partition coefficients and interphase volumes. Finally, results and interpretations are collected within the larger context of protein adsorption to various kinds of surfaces.
4.1 Depletion Curves
Depletion curves like those shown in Fig. 1 are a kind of adsorption isotherm in that the depletion ((Di)n, ordinate in mg/mL bulk solution) measures the amount of the ith protein adsorbed from solution at initial concentration (abscissa in mg/mL) to the nth adsorbent surface type. The same general form of depletion curve was observed for each combination of protein and surface listed in Table 2. In particular, it was observed that (Di)n increased in direct proportion to (with curve slope (Si)n within the range , up to a maximum value occurring at . Further increase in bulk concentration did not lead to continued adsorption from solution (see annotations on Fig. 1). We conclude that represents a saturation of the available interphase volume for the ith protein adsorbing to the nth adsorbent. Comparison of columns 3 and 4 of Table 2 shows there is no clear relationship between ion-exchange capacity and for anion- or cation-exchange resins, suggesting that the surface density of ion-exchange functionalities does not directly influence adsorbent capacity, except that any ion-exchange capacity of any charge always increases adsorbent capacity over ODS. Perhaps presence of an electric field surrounding the adsorbent particle with its commensurate affect on vicinal water structure/reactivity [2, 31] is the most significant factor for a particular protein and the absolute strength or sign of the electric field are secondary factors.
Depletion curves for each protein-surface pair of Table 2 are well described by a simple Henry isotherm (adsorbed amount increases in direct proportion to bulk-solution concentration). Adherence to a Henry-type isotherm suggests that Lys, HSA, and IgG adsorb to ion-exchange and neutral ODS surfaces as non-interacting particles, up to saturating-surface concentrations (i.e. no cooperativity among adsorbed proteins). Fractional depletion-curve slope ((Si)n < 1) indicates that protein distributes between solution and surface region in a manner consistent with reversible adsorption controlled by a modest partition coefficient (Pi)n over the concentration range . Otherwise, if protein adsorbed irreversibly or with very high avidity (i.e. (Pi)n → ∞), then the adsorbent would completely-or-substantially deplete the solution of protein, leading to (Si)n→ 1 because at each solution concentration up to surface saturation occurring at . Inspection of column 6 of Table 2 reveals that only Lys adsorption to SP with (Si)n = 0.91 ± 0.01 is consistent with high-avidity, but still not irreversible, adsorption. All other protein-surface combinations had a significantly lower (Si)n Importantly, (Si)n < 1 shows that, at any particular , a significant portion of protein remained in solution even though adsorbent was clearly not saturated ( ). It can be concluded from these observations alone that protein adsorption to the interphase surrounding ion-exchange resins is not irreversible, even when charge disparity between protein and adsorbent inferred from pI is large, as in the case of pI = 11 Lys adsorbing to strong-cation exchanger SP. Protein-adsorption competition experiments discussed subsequently corroborate this conclusion, from which it is further resolved that pI is a poor measure of protein charge that might otherwise be used to predict affinity of protein adsorption to ion-exchange surfaces.
It is interesting that the maximum surface capacity of ion-exchange adsorbents for all test proteins listed in Table 2 was greater than of the hydrophobic ODS reference surface. This fact can be readily verified by inspection of column 7 of Table 2 listing the capacity ratio (where m is the mass adsorbed to either n or r adsorbents), showing that (note that IgG adsorption to DEAE was exceptional and was not statistically greater than adsorption to ODS). Given that ion-exchange resins and ODS share the same sepharose-based polymer base chemistry and have the same nominal surface area (see section 2), it is reasonable to attribute the higher surface capacity of ion-exchange resins to charge interactions between protein and ion-exchange functional groups that do not occur between protein and ODS. Thus, protein adsorption to ion-exchange resins is a departure from the usually-observed trend that more protein adsorbs to hydrophobic surfaces than to hydrophilic surfaces such as oxidized polymers or glass (see, for example, refs. [2, 5, 32, 33]). We conclude, therefore, that ion-exchange-type interactions between protein and adsorbent become significant only when Lewis acid/base surface-functional groups exhibit authentic ion-exchange strength in the conventional-chemistry sense of ion exchange. Apparently, oxidized glass-and-polymer surfaces do not present such Lewis acid/base chemistry to proteins in buffer (high ionic strength) solution.
Although the capacity of ion-exchange adsorbents was greater than ODS, significantly higher-solution concentrations were required to achieve this increased level of protein adsorption (see Fig. 1 annotations and column 5 of Table 2). In other words, adsorption of more protein required a higher solution-phase chemical potential. It can be inferred from this observation that increased adsorbent capacity was not the sole result of higher protein affinity for ion-exchange surfaces (higher partition coefficients Pi than for ODS). If it were otherwise, higher capacity would have been achieved at bulk-solution concentrations equal-to-or-lower than the characteristic of the neutral ODS surface. Apparently factors such as protein-packing efficiency within the surface region [29] and/or greater interphase volume VIi also contribute to increased capacity. Theoretical interpretation of depletion curves confirms this qualitative assessment, as discussed in the following theory section.
Fig. 2 uses the parameter ratio to normalize depletion data to the reference ODS surface and more clearly resolve relationships among adsorption capacity, protein pI, and ion-exchange strength (where ODS is taken to have no ion-exchange strength). Notice that adsorbent capacity for HSA with pI = 5.5 is highest for the anion exchanger Q (strong positive charge) whereas the cation exchanger SP (strong negative charge) had the highest capacity for Lys with pI = 11. The neutral protein IgG with pI = 7 was relatively weakly influenced by the ion-exchange strength. We interpret these trends to be the fingerprints of an ion-exchange adsorption mechanism that apparently does not manifest itself on the oxidized glass-and-polymer surfaces immersed in buffer solution, as discussed above. Annotations on Fig. 2 cartoon possible protein/surface orientations that might be anticipated based on known protein-charge distribution (HSA is a roughly heart-shaped, oblate spheroid with a positive-charged domain located on one heart lobe [34, 35] whereas Lys is more spherical with a positive domain located at one end of the molecule [36]; IgG is not illustrated in Fig. 2 for the sake of clarity). However, such simplistic monolayer-packing considerations do not readily explain up to 6.3 × increase in adsorption capacity of ion-exchange resins over ODS because it is inconceivable that so much protein can pack into the same interphase volume as surrounding ODS particles. We conclude from considerations of Appendix A that proteins listed in Table 2 must adsorb to ion-exchange resins in multiple layers, as anticipated from independent experimental studies [21, 22, 25].
4.2 Protein-Adsorption Competition and Irreversible Adsorption
Adsorption ompetition between two proteins for the same adsorbent surface can be used to determine if adsorption is irreversible [5]. If protein i is irreversibly adsorbed, then a competing protein j cannot displace protein i from the adsorbent surface. We focus on irreversibility, rather than reversibility, because irreversibility can be directly disproved by competition experiments in which protein displacement is observed [20]. Also, because certain protein-adsorption theories (such as RSA, see Introduction) make the a priori assumption that protein adsorption is inherently irreversible, testing for irreversibility directly assesses the general utility of such models in biomaterials. We show in this section (and elsewhere [5, 16]) that irreversible adsorption is simply not always the case, even for protein adsorption to ion-exchange resins studied herein where charge interactions dominate the adsorption mechanism [29].
One particularly informative kind of competition experiment (of at least four possible basic types, see ref. [5] for more discussion) is to mix a surface-saturating concentration of a smaller protein with incrementally-increasing concentrations of a larger competing protein , and observe the outcome of simultaneous adsorption competition to the same nth adsorbent surface from this binary solution at steady-state using the solution depletion method. Figs. 3 and 4 document simultaneous adsorption competition between IgG (protein j) and either HSA or Lys (proteins i), respectively, for charged surfaces Q (Panel A), SP (Panel B), and neutral ODS (Panel C). Physical displacement of protein i from the interphase region surrounding surface n by protein j occurs in simultaneous adsorption competition when (far left concentration axis of Figs. 3 and 4). Under these conditions, first arrival of protein i to the adsorbent surface (relative to j) is kinetically assured because i is a smaller molecule with correspondingly faster mass transfer at a solution concentration overwhelmingly higher than protein j. Thus, at , if protein j is observed to adsorb at the expense of already-adsorbed protein i (i.e. (Di)n decreases as (Di)n increases with increasing ), it can be concluded that protein j displaced protein i and that i was not irreversibly adsorbed. Otherwise, if protein i was irreversibly adsorbed, then protein j molecules arriving relatively late at the adsorbent surface could not displace already-adsorbed protein i molecules (kinetic effect) and longer-term protein-exchange processes would favor protein i adsorption (equilibration effect).
With the above logic in mind, it is of interest to note from Fig. 3 that, when at (see Fig. 3 annotations), net-negatively-charged HSA was displaced by net-neutral IgG on Q (positively charged, Panel A) and ODS (neutral, Panel C) surfaces. But HSA was not displaced by IgG on SP (negatively charged, Panel B) when . Likewise, from Fig. 4, it is apparent that net-positively-charged Lys was displaced by net-neutral IgG on Q (Panel A) and ODS (Panel C) surfaces, but not displaced by on SP at any (Panel B). Thus, it is concluded that neither HSA nor Lys were irreversibly adsorbed to Q or ODS adsorbents, in basic agreement with the qualitative analysis of depletion curves of section 4.1. Co-adsorption of IgG with HSA or Lys implies that the interphase region is a mixture of these two proteins in some proportion related to solution concentration [5].
Turning attention now to adsorption competition between IgG (protein j) and HSA or Lys (protein i) on SP (Panel B, Figs. 3,4 respectively), it is quite apparent that j did not displace i when . Indeed, there was little detectable IgG adsorption to SP in competition with surface-saturating Lys at any . We conclude that Lys was so strongly bound to SP that IgG could not displace it at any competing concentrations and that the interphase region surrounding SP was nearly pure Lys. IgG competition with HSA on SP was more complex in that IgG adsorption was significant in the presence of adsorbed HSA up to about = 5 mg/mL, whereupon further IgG adsorption was at some expense of adsorbed HAS (Fig. 3B). Apparently the interphase region surrounding SP was a mixture of HSA and IgG.
4.3 Theoretical Interpretation of Depletion Curves
Column 3 of Table 3 collects values for the product (PiVIi)n computed from the relationship and experimentally-measured slope (Si)n of depletion curves (column 6 Table 2; see Eq. (6) of ref. [3] and discussion). This product is converted to the ratio using (PiVIi)n known from previous work [3] (column 4). With only the data at hand, (PiVIi)n cannot be interpreted in separate terms of Pi or VIi, as has been otherwise the case in previous work [3, 4], because it is clear from Fig. 2 and the preceding discussion that surface charge significantly influences protein packing within the interphase surrounding the adsorbent particle. That is to say, unlike previous work wherein it was concluded that adsorbent capacity was substantially controlled by water-surface interactions and not protein-surface interactions, it is apparent that protein-surface interactions are very important at ion-exchange adsorbents for which protein capacity is observed to vary for each protein-surface combination. However, consideration of boundary conditions on (PiVIi)n discussed below leads to the conclusion that P for ion-exchange resins was not remarkably greater than that for ODS, implying that the overall free energy of adsorption to ion-exchange resins was not significantly larger than for the hydrophobic ODS reference adsorbent.
Table 3.
Theoretical Protein Adsorption Parameters from Depletion Experiments
| Proteins and Surfaces | Theory | If (VI)n = (VI)r | ||||
|---|---|---|---|---|---|---|
| Protein (MW, pI) | Surface (Acronym) | (PiVI)n | (Pi)n | |||
| Lysozyme (14.5kDa, 11) | Sulfopropyl (SP) | 303255 ± 3333 | 21.49 ± 3.28 | 21.49 ± 3.28 | 11108 ± 1698 | 9.32 ± 0.15 |
| Carboxy methyl (CM) | 89977 ± 2400 | 6.38 ± 0.90 | 6.38 ± 0.90 | 3296 ± 464 | 8.10 ± 0.14 | |
| Quaternary ammonium (Q) | 16871 ± 938 | 1.20 ± 0.15 | 1.20 ± 0.15 | 618 ± 78 | 6.43 ± 0.13 | |
| Diethyl aminoethyl (DEAE) | 45937 ± 2278 | 3.25 ± 0.51 | 3.25 ± 0.51 | 1683 ± 262 | 7.43 ± 0.16 | |
| Octadecyl Sepharose (Neutral) | 14114 ± 882 | 1 | 1 | 517 | 6.25 | |
| Albumin (66.3kDa, 5.5) | Sulfopropyl (SP) | 14282 ± 757 | 0.57 ± 0.05 | 0.57 ± 0.05 | 93 ± 12 | 4.53 ± 0.13 |
| Carboxy methyl (CM) | 18484 ± 732 | 0.73 ± 0.06 | 0.73 ± 0.06 | 120 ± 15 | 4.79 ± 0.12 | |
| Quaternary ammonium (Q) | 39461 ± 1332 | 1.57 ± 0.14 | 1.57 ± 0.14 | 256 ± 34 | 5.54 ± 0.13 | |
| Diethyl aminoethyl (DEAE) | 16972 ± 756 | 0.67 ± 0.05 | 0.67 ± 0.05 | 110 ± 14 | 4.70 ± 0.13 | |
| Octadecyl Sepharose (Neutral) | 25153 ± 717 | 1 | 1 | 163 ± 16 | 5.09 ± 0.10 | |
| IgG (160kDa, 7) | Sulfopropyl (SP) | 15583 ± 457 | 1.22 ± 0.08 | 1.22 ± 0.08 | 55 ± 8 | 4.01 ± 0.15 |
| Carboxy methyl (CM) | 19123 ± 1477 | 1.49 ± 0.10 | 1.49 ± 0.10 | 68 ± 10 | 4.21 ± 0.15 | |
| Quaternary ammonium (Q) | 24530 ± 820 | 1.92 ± 0.07 | 1.92 ± 0.07 | 87 ± 12 | 4.46 ± 0.14 | |
| Diethyl aminoethyl (DEAE) | 17530 ± 476 | 1.37 ± 0.04 | 1.37 ± 0.04 | 62 ± 8 | 4.13 ± 0.14 | |
| Octadecyl Sepharose (Neutral) | 12792 ± 428 | 1 | 1 | 45 ± 6 | 3.81 ± 0.12 | |
Columns 5 to 7 of Table 3 compute outcomes of the arbitrary proposition that (VI)n = (VI)r Posed for the sake of argument, this proposition forces the 1.3 × to 6.3 × more protein adsorbed to ion-exchange-resin surfaces (section 4.1) into the same interphase volume occupied by protein adsorbed to ODS. This suggestion is highly unlikely according to Appendix A because it concentrates interphase protein into highly improbable densities. Hence, (VI)n = (VI)r may be securely regarded as a lower-bound estimate of interphase volume occupied by protein adsorbed to ion-exchange resins, even if wholesale structural rearrangement (denaturation) upon adsorption is contemplated. As such, (VI)n = (VI)r establishes an upper bound estimate for (column 5). Using this upper bound, a maximum estimate of (Pi)n can be calculated from using known values for (Pi)r [3]. Inspection of resulting values for listed in column 7 reveals that in all cases, including the extreme case of Lys adsorbed to SP (see section 4.2). Therefore, it is concluded that an upper-bound value for can be no more than half of the value anticipated from theory asserting that protein/surface interactions are large compared to thermal energy (see section 1).
4.4 Summary and Interpretation
Table 4 collects important experimental observations regarding Lys, HSA, and IgG adsorption to ion-exchange resins discussed in the preceding sections. It is evident from this summary that proteins do not adsorb irreversibly adsorb to ion-exchange resins, even though adsorbent capacity is high compared to ODS, and that the apparent free energy of adsorption is not large compared to thermal energy, at least as defined in section 1. Proteins adsorbed to ion-exchange resins are accommodated in multiple layers, where a layer is here defined by the thickness dimension of the adsorbed protein. It is not clear from data at hand that every protein molecule within the multi-layer interphase region of an ion-exchange resin is reversibly adsorbed or if the binding energy is the same for each layer of proteins within the interphase. But it is clear from adsorption-competition experiments with IgG that both HSA and Lys can be readily displaced from Q or ODS and, further, that depletion curves (an adsorption isotherm) show no evidence of a change in adsorption mechanism over the broad range of solution concentrations considered, up-to-and-in-excess-of surface saturation .
Table 4.
Summary of Experimental Observations and Interpretation for Protein Adsorption to Ion-Exchange Resins
| Observation | Experimental/Theoretical Evidence | Interpretation |
|---|---|---|
| Linear depletion curves similar to ODS and surfaces with increasing hydrophilicity. | Fig. 1, Table 1 | Henry-type isotherm, protein molecules adsorb independently within . |
| Surfaces saturate with protein. | Fig. 1, Table 1 | Adsorbent capacity unfilled between . |
| Protein partitions between bulk solution and surface | Depletion curve slope (Si)n < 1 Fig. 1, Table 1 | Protein adsorption is not irreversible. Modest partition coefficients Pi |
| Adsorbent capacity order: ion-exchange resin > ODS > surfaces with increasing hydrophilicity. | Fig. 3, Table 1, Refs. [3, 5] | Significant electrostatic interactions between surface and protein adsorbing from buffer solution occurs only when surface bears strong Lewis acid/base functional groups with authentic ion-exchange capacity. |
| Excess adsorption capacity of ion-exchange resins cannot be contained in a single layer. | Appendix A | Proteins adsorb to ion-exchange resins in multilayers. |
| Ion-exchange resin adsorbent capacity requires high solution concentration to fill. | Fig. 1, Table 1 | Modest partition coefficients Pi |
| IgG displaces HSA and Lys on Q and ODS but not SP | Fig. 3 | HSA and Lys not irreversibly adsorbed to Q and ODS. HSA and Lys more strongly adsorbed to SP than IgG. |
| Upper bound on Pi calculated from (PiVI)n assuming (VI)n = (VI)r | Table 2 | for protein adsorbing to ion-exchange resins. |
An important mechanistic question asks how turns out to be only a few multiples of thermal energy for a wide variety of proteins adsorbing from aqueous buffer to surfaces spanning the full range of observable water wettability (hydrophilicity) [3, 4], including ion-exchange surfaces studied herein that bear strong Lewis acid/base functionalities that clearly interact with proteins [21–28]. Two readily-apparent explanations are that (i) high-energy protein/surface interactions are compensated by other large and opposite-sign interactions, as discussed in section 1, or (ii) that modest protein-adsorption energetics result from the sum of a few free-energy components, each of which are small compared to thermal energy. The following evaluates these two irreconcilable alternatives and arrives at the conclusion that the first explanation adequately rationalizes experimental observations for ion-exchange surfaces but that the second prevails at hydrophobic surfaces or surfaces bearing Lewis acid/base functionalities that wet with (hydrogen bond to) water but do not exhibit ion-exchange properties in the conventional chemistry sense of the term.
We have made progress rationalizing mass and energy balance of protein adsorption with a simple three-component free-energy relationship that embraces protein/water, water/surface, protein/protein, and protein/surface interactions. The proposal is that the standard free energy of protein adsorption to any surface, , consists of three essential components [3]:
The free-energy (gain) of the hydrophobic effect operating on proteins, .
The free-energy (cost) of vicinal water displacement (surface dehydration), .
The free-energy (gain) of protein-protein and protein-surface interactions .
The first component (1) includes all protein/water interactions within bulk solution and interphase and is dominated by the hydrophobic effect [2, 37–40]. The hydrophobic effect expels protein from solution to recover hydrogen bonds among water molecules otherwise separated by proteins in solution. The second component (2) includes all water/surface interactions and is dominated by energetic cost of displacing interphase water by protein expelled from solution to the surface region. presumably increases with increasing adsorbent-surface water wettability ( , see Appendix B). The third component (3) subsumes protein/protein and protein/surface interactions that resist desorption or displacement back into the bulk-solution phase.
All of the above taken together suggests that the physical chemistry of protein adsorption from purified aqueous solution follows the basic rule , where the is a constant for any particular adsorbent. According to this view then, explanation (i) above has it that is modest for protein adsorbing to ion-exchange resins because energetics of water interactions with ion-exchange resins are nearly as large as the energetics of protein/surface interactions anticipated by theory. More succinctly stated, (see Table 3). The energy accounting of Appendix B supports this argument by showing that the energy cost of dehydrating a thick interphase region near a wettable surface can easily translate into very large , depending on the volume of interphase water that is displaced by adsorbing protein. Experiment indicates that protein adsorbed to ion-exchange resins resides in multiple layers, implying that the volume of water displaced upon adsorption is quite high (relative to the hydrophobic ODS surface) and that large should thus be anticipated. Therefore, we conclude that the large-compensating-interactions explanation (i) is both feasible and likely for protein adsorption to ion-exchange adsorbents.
However, explanation (i) does not fit the case of protein adsorption to hydrophobic surfaces because the energetics of wetting hydrophobic surfaces are small in comparison to wetting hydrophilic surfaces such as ion-exchange resins. Indeed, wetting energetics fall rapidly to near zero as water contact angles θ → 120o [41]. For a hydrophobic surface such as ODS, then, is small for any interphase volume created by adsorbing protein. But must likewise be small because proteins can interact with hydrophobic surfaces only through relatively weak dispersion forces [42]. So it is apparent that explanation (ii) above rationalizes protein adsorption to hydrophobic surfaces and that modest protein-adsorption energetics result from the sum of a few free-energy components, each of which are small compared to thermal energy. Indeed, we estimate from experiment that no less that half of the 5RT free energy of adsorption of HSA to ODS is due to [3, 4].
As adsorbent hydrophilicity increases and contact angles decrease θ→0o, wetting energetics increase in an exponential-like way [41]. Commensurately, must increase with decreasing water contact angle. For such surfaces bearing increasing Lewis acid/base functionalities that wet with (hydrogen bond to) water but do not exhibit ion-exchange properties, we observe that protein adsorption capacity monotonically decreases to immeasurably-small quantities near an adsorbent-particle water adhesion tension τo = 30 dyne/cm (nominal water contact angle θ = 65o) [2, 4, 32, 33, 43]. Clearly, must not be increasing in a manner that compensates for the increasing cost of . Otherwise protein adsorption capacity would not decrease with increasing hydrophilicity. Thus, we are inclined to conclude that explanation (ii) above prevails for hydrophobic surfaces or more hydrophilic analogs bearing Lewis acid/base functionalities that wet with (hydrogen bond to) water but do not exhibit ion-exchange properties.
Interestingly, explanations (i) and (ii) conspire to force to be a small multiple of thermal energy for any surface chemistry, except perhaps for bioengineered surfaces bearing specific ligands for adsorbing protein, because a surface chemistry that chemically interacts with proteins must also interact with water through hydrogen bonding. In this way, water moderates protein adsorption to any surface by competing with adsorbing protein molecules [4, 40, 44].
5.0 Conclusions
Lysozyme (Lys), human serum albumin (HSA), and immunoglobulin G (IgG) adsorb to ion-exchange surfaces at high capacity by an ion-exchange mechanism with characteristically high protein/surface interaction energetics but with relatively low overall free energy of adsorption . Low results from the energy-compensating cost of displacing bound water from a thick interphase region surrounding ion-exchange adsorbent that contains multiple protein layers. Thus water plays a significant moderating role in the adsorption of protein to ion-exchange surfaces. Protein is not irreversibly bound to ion-exchange resins and pI is a poor measure of charge that might otherwise be used to predict affinity of protein adsorption to ion-exchange surfaces, even when the charge disparity between adsorbent and protein inferred from protein pI is large.
Acknowledgments
This work was supported by grants from the American Chemical Society Petroleum Research Fund (#44523-AC5) and National Institute of Health PHS (2R01HL069965), as well as a gift from the Bausch & Lomb Corporation. Authors appreciate additional support from the Materials Research Institute and Departments of Bioengineering and Materials Science and Engineering, Penn State University.
Appendix A. Protein Packing, Multilayering, and Adsorbent Capacity
The number of layers occupied by adsorbed protein nominally depends on protein size, shape, and mass of protein adsorbed per-unit-area of adsorbent. These factors are not usually known with clarity in most experimental circumstances, including those described herein. As a consequence, calculation of the number of adsorbed layers cannot usually be unambiguously performed without some unproven assumptions. However, in the present case, it is possible to conclude from boundary-condition calculations that adsorbent capacities roughly double that observed for the hydrophobic ODS adsorbent must reside in multi-layers, as anticipated from independent experimental studies [21, 22, 25].
Globular proteins are oblate spheroids in solution with core-protein radius following r = 6.72 × 10⁻⁸ MW1/3 to a very good approximation (packing-volume radius in cm for molecular weight MW expressed in kDa; see refs. [45–51] for basic information regarding spherical dimensions and molecular packing of proteins). As a consequence, the partial specific volume vo of globular proteins falls within a surprisingly conserved range of 0.70 ≤ v0 ≤ 0.75 cm3/g protein [52]. If protein molecules adsorb to a surface and retain spheroidal dimensions, then the highest conceivable surface (interphase) concentration of protein corresponds to face-centered-cubic (FCC, or equivalently hexagonal) close packing of spheres with radius rv [15]. Such a close-packed unit cell contains eight⅛th spheres and six ½ spheres (total of 4 spheres) residing within a cubic volume (2rv√2)3. Hence the FCC protein concentration , corresponding to a weight concentration (g/cm3) ; where NA is the Avogadro number and MW is here expressed in kDa. Using the above definition of rv, it is evident that WFCC = 968 mg/mL for any spherical (or roughly spherical [53]) protein regardless of MW (the volume fraction occupied by FCC packed spheres is independent of size; see refs. [53–55] for more discussion of packing ellipsoids and spheroids). Thus, layer(s) of FCC-packed adsorbed globular protein cannot possibly exceed 968 mg/mL unless wholesale loss of molecular structure upon adsorption is contemplated.
Neutron reflectometry of HSA adsorbed to the aqueous buffer/vapor interface is consistent with a single layer of protein at surface-saturating solution concentrations [15, 56], which we interpret as an interphase concentration of about 436 mg/mL [4]. If adsorbed protein happen to pack in an FCC arrangement, then the volume fraction of interphase occupied by protein is approximately 1/3 and that proteins have an excluded volume quite close to the hydrodynamic radius ( ~ 1.3rv ) [15]. Less protein adsorbs to more hydrophilic surfaces and, commensurately, we find that the maximum protein capacity for the hydrophobic ODS surface is [3]. The ratio comparing a hypothetical (and highly improbable) FCC packed protein to the experimental ODS capacity ; where m is the adsorbed protein mass for FCC and ODS surfaces. Therefore, it can be concluded that any capacity ratio listed in column 7 of Table 2 (Lys on SP and CM; HSA on Q) would require impossibly large interphase concentrations if compacted into the same layer(s) occupied by protein adsorbed to ODS. Hence when .
If protein loses globular structure upon adsorption and occupies the entire available adsorbent surface area at a density equal to vo (the inherent protein density), then this hypothetical interphase concentration would fall between or 1,300 to1,400 mg/mL; where the superscript “SV” denotes packing to protein specific volume. Using the same arguments as above, it can be concluded that any capacity ratio (Lys on SP and CM) must be multilayered because packing so much protein into the same number of layers occupied on ODS exceeds the inherent protein density. Actually, the jamming limit for any shaped object is approximately 55% [57], meaning that the jammed limit of SV packing falls within the range , or 650 to 700 mg/mL; where the “SV, JL” superscript denotes packing to protein specific volume at the jammed limit. Therefore, it can be concluded that any capacity ratio (Lys on all ion-exchange resins, HSA on all ion-exchange resins except DEAE, and IgG on Q) must occupy more layers than on ODS. Hence when .
Appendix B. Energetics of Displacing Interphase Water by Adsorbing Protein
Theoretical considerations lead Extrand [41] to conclude that the free energy of wetting a surface exhibiting contact angles (θ → 0o is about (−10) kJ/mole of interactive surface sites (see ref. [58] for more discussion of the molar surface area concept). Extrand interprets this wetting energy as a measure of solid-liquid adhesion [41]. In other words, the energetic cost of dehydrating a wetted surface ΔGd ~ 10 kJ/mole. If α moles of water are involved in wetting each mole of surface sites (α moles HOH/mole interactive sites) then it follows that HOH. Generally speaking, α is not known because of the propagative effect of hydrogen bonding that can cause the structure and reactivity of water directly adjacent to the water-wetted surface (vicinal water) to be quite different than bulk water over a finite distance extending some unknown distance away from the surface (see refs. [2, 38, 40] for reviews). However, the small size of the water molecule, together with this propagative effect, all but assures that α > 1. If vicinal water has density ρυ and molecular weight of 18g/mole, then it is apparent that .
For the purpose of calculating an upper bound on , assume that a protein with specific volume υ cm3/g adsorbing form solution is required to displace an equivalent volume of vicinal water. Under this extreme circumstance, protein or, equivalently, protein adsorbed; where MW is the protein molecular weight in g/mole. Further assuming for the sake of argument that ρυ ≈ 1 and υ = 0.76 (a spherical protein), then it is apparent that . Thus, could easily be thousands of RT units even when α is a large number, because MW > 103 for most blood proteins. Of course, it is unlikely that all of the water displaced by an adsorbing protein is entirely vicinal water bound at the wetting energy, and this estimate of should be regarded as an extreme upper bound. Nevertheless, it is evident from this argument that energetic cost of dehydrating a surface can be large, especially if the vicinal water zone is thick. Again, the structure of water near wettable [59] or ionic surfaces [2] is a matter of continued investigation (and controversy), but it seems reasonable to suggest that the vicinal zone surrounding ion-exchange surfaces is thick due to the electric field that can cause long-range ordering of water dipoles. If so, could be much larger than for hydrophilic surfaces bearing Lewis acid/base functionalities that wet with (hydrogen bond to) water but do not exhibit ion-exchange properties.
Footnotes
Publisher's Disclaimer: This is a PDF file of an unedited manuscript that has been accepted for publication. As a service to our customers we are providing this early version of the manuscript. The manuscript will undergo copyediting, typesetting, and review of the resulting proof before it is published in its final citable form. Please note that during the production process errors may be discovered which could affect the content, and all legal disclaimers that apply to the journal pertain.
Citations
- 1.Krishnan A, Liu Y-H, Cha P, Allara DL, Vogler EA. Interfacial Energetics of Globular-Blood Protein Adsorption to a Hydrophobic Surface from Aqueous-Buffer Solution. Journal of the Royal Society Interface. 2006;3:283–301. doi: 10.1098/rsif.2005.0087. [DOI] [PMC free article] [PubMed] [Google Scholar]
- 2.Vogler EA. Structure and Reactivity of Water at Biomaterial Surfaces. Adv Colloid and Interface Sci. 1998;74(1–3):69–117. doi: 10.1016/s0001-8686(97)00040-7. [DOI] [PubMed] [Google Scholar]
- 3.Noh H, Vogler EA. Volumetric Interpretation of Protein Adsorption: Partition Coefficients, Interphase Volumes, and Free Energies of Adsorption to Hydrophobic Surfaces. Biomaterials. 2006;27:5780–93. doi: 10.1016/j.biomaterials.2006.07.038. [DOI] [PubMed] [Google Scholar]
- 4.Noh H, Vogler EA. Volumetric Interpretation of Protein Adsorption: Mass and Energy Balance for Albumin Adsorption to Particulate Adsorbents with Incrementally-Increasing Hydrophilicity. Biomaterials. 2006;27:5801–12. doi: 10.1016/j.biomaterials.2006.08.005. [DOI] [PubMed] [Google Scholar]
- 5.Noh H, Vogler EA. Volumetric Interpretation of Protein Adsorption: Competition from ixtures and the Vroman Effect. Biomaterials. 2007;28:405–22. doi: 10.1016/j.biomaterials.2006.09.006. [DOI] [PMC free article] [PubMed] [Google Scholar]
- 6.Fang F, Szleifer I. Competitive adsorption in model charged protein mixtures: Equilibrium isotherms and kinetics behavior. J Chem Phys. 2003;119(2):1053–65. [Google Scholar]
- 7.Sagvolden G, Glaever I, Feder J. Characteristic Protein Adhesion Forces on Glass and Polystyrene Substrates by Atomic Force Microscopy. Langmuir. 1998;14:5984–7. [Google Scholar]
- 8.Slomkowski S, Sosnowski S, Przerwa E. Reversible Adsorption of Spherical Particles from Binary Mixtures: Long-time Behavior. C R Chimie. 2003;6:1393–401. [Google Scholar]
- 9.Szleifer I. Protein Adsorption on Surfaces with Grafted Polymers: A Theoretical Approach. Biophysical Journal. 1997;72:595–612. doi: 10.1016/s0006-3495(97)78698-3. [DOI] [PMC free article] [PubMed] [Google Scholar]
- 10.Satulovsky J, Carignano MAIS. Kinetic and thermodynamic control of protein adsorption. Proc Natl Acad Sci. 2000;97:9037–41. doi: 10.1073/pnas.150236197. [DOI] [PMC free article] [PubMed] [Google Scholar]
- 11.Jeon SI, Lee JH, Andrade JD. Gennes aPGD. Protein-Surface Interactions in the Presence of Polyethylene Oxide: 1. Simplified Theory. J Colloid Interface Sci. 1990;142:149–58. [Google Scholar]
- 12.Gong P, Szleifer I. Competitive adsorption of model charged proteins: the effect of total charge and charge distribution. J Colloid Interface Sci. 2004;278:81–90. doi: 10.1016/j.jcis.2004.05.023. [DOI] [PubMed] [Google Scholar]
- 13.Latour RA. Thermodynamic perspectives on the molecular mechanisms providing protein adsorption resistance that include protein-surface interactions. J Biomed Mater Res. 2006;78A:843–54. doi: 10.1002/jbm.a.30818. [DOI] [PubMed] [Google Scholar]
- 14.Krishnan A, Sturgeon J, Siedlecki CA, Vogler EA. Scaled Interfacial Activity of Proteins at the Liquid-Vapor Interface. J Biomed Mat Res. 2004;68A:544–57. doi: 10.1002/jbm.a.20104. [DOI] [PubMed] [Google Scholar]
- 15.Krishnan A, Siedlecki C, Vogler EA. Traube-Rule Interpretation of Protein Adsorption to the Liquid-Vapor Interface. Langmuir. 2003;19:10342–52. [Google Scholar]
- 16.Krishnan A, Siedlecki CA, Vogler EA. Mixology of Protein Solutions and the Vroman Effect. Langmuir. 2004;20(12):5071–8. doi: 10.1021/la036218r. [DOI] [PubMed] [Google Scholar]
- 17.Krishnan A, Wilson A, Sturgeon J, Siedlecki CA, Vogler EA. Liquid-Vapor Interfacial Tension of Blood Plasma, Serum and Purified Protein Constituents Thereof. Biomaterials. 2005;26:3445–53. doi: 10.1016/j.biomaterials.2004.09.016. [DOI] [PubMed] [Google Scholar]
- 18.Krishnan A, Liu Y-H, Cha P, Allara DL, Vogler EA. Scaled Interfacial Activity of Proteins at a Hydrophobic Solid/Aqueous-Buffer Interface. J Biomed Mater Res. 2005;75A(2):445–57. doi: 10.1002/jbm.a.30444. [DOI] [PubMed] [Google Scholar]
- 19.Krishnan A, Liu Y-H, Cha P, Allara DL, Vogler EA. Interfacial Energetics of Blood Plasma and Serum Adsorption to a Hydrophobic Self-Assembled Monolayer Surface. Biomaterials. 2006;27:3187–94. doi: 10.1016/j.biomaterials.2005.12.032. [DOI] [PubMed] [Google Scholar]
- 20.Cha P, Krishnan A, Fiore VF, Vogler EA. Interfacial Energetics of Protein Adsorption from Aqueous Buffer to Surfaces with Varying Hydrophilicity. Langmuir. 2007 doi: 10.1021/la703310k. in press. [DOI] [PubMed] [Google Scholar]
- 21.Bo Lassen, Malmsten M. Competitive Protein Adsorption at Plasma Polymer Surfaces. J Col and Int Sci. 1997;186:9–16. doi: 10.1006/jcis.1996.4529. [DOI] [PubMed] [Google Scholar]
- 22.Guy Ladam, Gergely Csilla, Senger Bernard, Decher Gero, Voegel Jean-Claude, Schaaf Pierre, et al. Protein Interactions with Polyelectrolyte Multilayers: Interactions between Human Serum Albumin and Polystyrene Sulfonate/Polyallylamine Multilayers. Biomacromolecules. 2000;1:674–87. doi: 10.1021/bm005572q. [DOI] [PubMed] [Google Scholar]
- 23.Fraaije JGEM, Norde W, Lyklema J. Interfacial thermodynamics of protein adsorption ion co-adsorption and ion binding in solution: III. Electrochemistry of bovine serum albumin adsorption on silver iodide. Biophysical Chemistry. 1991;41:263–76. doi: 10.1016/0301-4622(91)85041-n. [DOI] [PubMed] [Google Scholar]
- 24.Fraaije JGEM, Norde W, Lyklema J. Interfacial thermodynamics of protein adsorption, ion co-adsorption and ion binding in solution: II. Model interpretation of ion exchange in lysozyme chromatography. Biophysical Chemistry. 1991;40:317–27. doi: 10.1016/0301-4622(91)80029-q. [DOI] [PubMed] [Google Scholar]
- 25.Lassen B, Malsten M. Structure of Protein Layers during Competitive Adsorption. J Col and Int Sci. 1996;180:339–49. [Google Scholar]
- 26.Maarten Biesheuvel P, van der Veen Marijin, Norde W. A Modified Poisson-Boltzmann Model Including Charge Regulation for the Adsorption of Ionizable Polyelectrolytes to Charged Interfaces, Applied to Lysozyme Adsorption on Silica. J Phys Chem B. 2005;109:4172–80. doi: 10.1021/jp0463823. [DOI] [PubMed] [Google Scholar]
- 27.Stephanie Pasche, Voros Janos, Hans J, Griesser Nicholas D, Spencer Textor M. Effects of Ionic Strength and Surface Charge on Protein Adsorption at PEGylated Surfaces. J Phys Chem B. 2005;109:17545–52. doi: 10.1021/jp050431+. [DOI] [PubMed] [Google Scholar]
- 28.Fraaije J, Norde W, Lyklema J. Interfacial Thermodynamics of Protein Adsorption Ion Co-adsorption and Ion Binding in Solution. II. Model Interpretation of Ion Exchange Lysozyme Chromatography. Biophysical Chemistry. 1991;40:317–27. doi: 10.1016/0301-4622(91)80029-q. [DOI] [PubMed] [Google Scholar]
- 29.Xu X, Lenhoff AM. A Predictive Approach to Correlating Protein Adsorption Isotherms on Ion-Exchange Media. J Phys Chem B. 2008 doi: 10.1021/jp0754233. [DOI] [PubMed] [Google Scholar]
- 30.Ariola F, Krishnan A, Vogler EA. Interfacial Rheology of Blood Proteins Adsorbed to the Aqueous-Buffer/Air Interface. Biomaterials. 2006;27:3404–12. doi: 10.1016/j.biomaterials.2006.02.005. [DOI] [PubMed] [Google Scholar]
- 31.Collins KD. Sticky Ions in Biological Systems. Proc Natl Acad Sci USA. 1995;92:5553–7. doi: 10.1073/pnas.92.12.5553. [DOI] [PMC free article] [PubMed] [Google Scholar]
- 32.Vogler EA. Practical Use of Concentration-Dependent Contact Angles as a Measure of Solid-Liquid Adsorption II: Experimental Aspects. Langmuir. 1992;8:2013–20. [Google Scholar]
- 33.Vogler EA, Martin DA, Montgomery DB, Graper JC, Sugg HW. A Graphical Method for Predicting Protein and Surfactant Adsorption Properties. Langmuir. 1993;9:497–507. [Google Scholar]
- 34.Carter D, Ho J. Structure of Serum Albumin. Adv Protein Chem. 1994;45:153–203. doi: 10.1016/s0065-3233(08)60640-3. [DOI] [PubMed] [Google Scholar]
- 35.Carter D, He X. Structure of Human Serum Albumin. Science. 1990;249:302–3. doi: 10.1126/science.2374930. [DOI] [PubMed] [Google Scholar]
- 36.Takashima S. Electric dipole moments of globular proteins: measurement and calculation with NMR and X-ray databases. J Non-C S. 2002;305:303–10. [Google Scholar]
- 37.Yaminsky VV, Vogler EA. Hydrophobic Hydration. Current Opinion in Colloid and Interface Sci. 2001;6:342–9. [Google Scholar]
- 38.Vogler EA. Water and the Acute Biological Response to Surfaces. J Biomat Sci Polym Edn. 1999;10(10):1015–45. doi: 10.1163/156856299x00667. [DOI] [PubMed] [Google Scholar]
- 39.Vogler EA. Biological Properties of Water. In: Morra M, editor. Water in Biomaterials Surface Science. New York: John Wiley and Sons; 2001. pp. 4–24. [Google Scholar]
- 40.Vogler EA. How Water Wets Biomaterials. In: Morra M, editor. Water in Biomaterials Surface Science. New York: John Wiley and Sons; 2001. pp. 269–90. [Google Scholar]
- 41.Extrand CW. A Thermodynamic Model for Wetting Free Energies from Contact Angles. Langmuir. 2003;19(3):646–9. [Google Scholar]
- 42.Vinogradov SN, Linnell RH. Hydrogen Bonding. New York: Van Nostrand Reinhold Co; 1971. [Google Scholar]
- 43.Vogler EA. Practical Use of Concentration-Dependent Contact Angles as a Measure of Solid-Liquid Adsorption I: Theoretical Aspects. Langmuir. 1992;8:2005–12. [Google Scholar]
- 44.Vogler EA. Interfacial Chemistry in Biomaterials Science. In: Berg J, editor. Wettability. New York: Marcel Dekker; 1993. pp. 184–250. [Google Scholar]
- 45.Richards FM. Areas, Volumes, Packing and Protein Structure. Ann Rev Biophys Bioeng. 1977;6:151–76. doi: 10.1146/annurev.bb.06.060177.001055. [DOI] [PubMed] [Google Scholar]
- 46.Chothia C. Structural Invariants in Protein Folding. Nature. 1975;254:304–8. doi: 10.1038/254304a0. [DOI] [PubMed] [Google Scholar]
- 47.Miller S, Lesk A, Janins J, Chothia C. The Accessible Surface Area and Stability of Oligomeric Proteins. Nature. 1987;328(27):834–6. doi: 10.1038/328834a0. [DOI] [PubMed] [Google Scholar]
- 48.Miller S, Janin J, Lesk A, Chothia C. Interior and Surface of Monomeric Proteins. J Mol Biol. 1987;196:641–56. doi: 10.1016/0022-2836(87)90038-6. [DOI] [PubMed] [Google Scholar]
- 49.Tsai J, Taylor R, Chothia C, Gerstin M. The Packing Density in Protiens: Standard Radii and Volumes. J Mol Bio. 1999;290:253–66. doi: 10.1006/jmbi.1999.2829. [DOI] [PubMed] [Google Scholar]
- 50.Gerstein M, Chothia C. Packing at the Protein-Water Interface. Proc Natl Acad Sci. 1996;93:10167–72. doi: 10.1073/pnas.93.19.10167. [DOI] [PMC free article] [PubMed] [Google Scholar]
- 51.Miller S, Janin J, Leak AM, Chothia C. Interior and Surface of Monomeric Proteins. J Mol Biol. 1987;196:641–56. doi: 10.1016/0022-2836(87)90038-6. [DOI] [PubMed] [Google Scholar]
- 52.Chalikian TV, Breslauer KJ. On Volume Changes Accompanying Conformational Transitions of Biopolymers. Biopolymers. 1996;39:619–26. doi: 10.1002/(sici)1097-0282(199611)39:5<619::aid-bip1>3.0.co;2-z. [DOI] [PubMed] [Google Scholar]
- 53.Donev A, Cisse I, Sachs D, Variano EA, Stillinger FH, Connelly R, et al. Improving the Density of Jammed Disordered Packings Using Ellipsoids. Science. 2004 February 13 2004;303(5660):990–3. doi: 10.1126/science.1093010. [DOI] [PubMed] [Google Scholar]
- 54.Aste T, Weaire DL. The pursuit of perfect packing. Bristol, PA: Institute of Physics Pub; 2000. [Google Scholar]
- 55.Downward J. The 24-Dimensional Greengrocer. Nature. 2003 August 26;:424–895. 6. doi: 10.1038/424895a. [DOI] [PubMed] [Google Scholar]
- 56.Lu JR, Su TJ, Penfold J. Adsorption of Serum Albumins at the Air/Water Interface. Langmuir. 1999;15(20):6975–83. [Google Scholar]
- 57.Feder J. Random Sequential Adsorption. J Theor Biol. 1980;87(2):237–54. [Google Scholar]
- 58.Extrand CW. A Thermodynamic Model for Contact Angle Hysteresis. J Colloid and Interface Sci. 1998;207(1):11–9. doi: 10.1006/jcis.1998.5743. [DOI] [PubMed] [Google Scholar]
- 59.Asay DB, Kim SH. Evolution of the Adsorbed Water Layer Structure on Silicon Oxide at Room Temperature. J Phys Chem B. 2005 September 8 2005;109(35):16760–3. doi: 10.1021/jp053042o. [DOI] [PubMed] [Google Scholar]