

Abstract
In yeast, ∼31 autophagy-related (Atg) proteins have been identified. Most of them reside at the phagophore assembly site (PAS), although the function of the PAS mostly remains unclear. One reason for the latter is the lack of stoichiometric information regarding the Atg proteins at this site. We report the application of fluorescence microscopy to study the amount of Atg proteins at the PAS. We find that an increase in the amount of Atg11 at the PAS enhances the recruitment of Atg8 and Atg9 to this site and facilitates the formation of more cytoplasm-to-vacuole targeting vesicles. In response to autophagy induction, the amount of most Atg proteins remains unchanged at the PAS, whereas we see an enhanced recruitment of Atg8 and 9 at this site. During autophagy, the amount of Atg8 at the PAS showed a periodic change, indicating the formation of autophagosomes. Application of this method and further analysis will provide more insight into the functions of Atg proteins.
Introduction
Autophagy is an intralysosomal degradation pathway conserved in various eukaryotic organisms. Increasing evidence has pointed out the connection between autophagy and various physiological processes in higher eukaryotes (Shintani and Klionsky, 2004a; Huang and Klionsky, 2007). One of the areas that have lagged, however, is a mechanistic understanding of autophagy and the function of the autophagy-related (Atg) proteins. This problem is exacerbated by the fact that only 7 of the 30 currently identified Atg proteins have clear functional motifs (Yorimitsu and Klionsky, 2005b). An additional issue is that there is essentially no quantitative information on the stoichiometries of the Atg proteins. In this paper, we report a method using fluorescence microscopy to study the quantitative behavior of Atg proteins during autophagy.
There are different types of autophagy, but the best characterized is macroautophagy, hereafter referred to as autophagy. During autophagy, a portion of the cytoplasm is sequestered, randomly in most cases, by an expanding membrane sac (called the phagophore). Upon completion, the phagophore generates a double-membrane vesicle termed an autophagosome. The autophagosome then fuses with the vacuole (lysosome analogue in yeast), releasing the inner vesicle, the autophagic body, into the lumen. The autophagic body, along with its cargo, is then degraded by vacuolar hydrolases, and the resulting macromolecules are released back into the cytosol for reuse.
Although originally identified as a nonselective degradative pathway, autophagy in yeast can also mediate a selective biosynthetic pathway called the cytoplasm-to-vacuole targeting (Cvt) pathway, which uses much of the same protein machinery to transport the resident vacuolar hydrolase aminopeptidase I (Ape1; Klionsky et al., 1992; Harding et al., 1995; Hutchins and Klionsky, 2001). The Cvt pathway has only been described in fungi; however, there are many examples of selective types of autophagy in higher eukaryotes (Dunn et al., 2005; Mizushima, 2005; Iwata et al., 2006; Huang and Klionsky, 2007).
For both autophagy and the Cvt pathway, the phagophore assembly site (PAS) is thought to be the organization center for the formation of the Cvt vesicle and autophagosome during growing and starvation conditions, respectively (Suzuki et al., 2001; Kim et al., 2002; Nice et al., 2002). As detected by fluorescence microscopy, most Atg proteins show a specific localization at this punctate perivacuolar structure. Although the function of the PAS is still not fully understood, it is known that the correct targeting of Atg proteins to this site is essential for their normal function. In the Cvt pathway, Atg11 is reported to play a predominant role in PAS formation because the absence of this protein results in no detectable PAS under vegetative conditions (Shintani et al., 2002). According to our current model, Atg11 acts as a scaffold protein and participates in several steps of the Cvt pathway. For example, Atg11 plays a role in cargo recognition by binding Atg19, the receptor of precursor Ape1 (prApe1; Scott et al., 2001; Shintani et al., 2002). Atg19 also interacts with Atg8, which is normally localized at the PAS (Kim et al., 2002; Shintani et al., 2002). In an atg11Δ mutant, however, the Atg19 and prApe1 proteins interact and form a complex, but this complex localizes away from the PAS. Similarly, Atg8 primarily shows a diffuse cytosolic localization in this mutant strain. Another interaction partner of Atg11 is Atg9, and the interaction between them mediates the movement of Atg9 from peripheral pools (potential membrane sources) to the PAS (He et al., 2006).
Although these studies have provided substantial information about the temporal order of action of components involved in cargo recognition and packaging, we are hampered in our attempt to understand the process at a molecular level because none of these data deal with quantitative properties. For example, the capacity of the Cvt pathway can be overwhelmed by overexpression of the cargo, prApe1 (Klionsky et al., 1992; Harding et al., 1995; Baba et al., 1997). In contrast, the elevated level of prApe1 can be accommodated by nonspecific autophagy (Scott et al., 1996). What are the alterations that provide the increased capacity for the autophagic machinery under starvation conditions? This question pertains to similar issues in higher eukaryotes, such as the sequestration of damaged organelles or invasive microbes within autophagosomes of the appropriate size (Huang and Klionsky, 2007).
We used the Cvt pathway as a model to investigate the stoichiometric changes in Atg proteins that allow adaptations to specific intracellular demands. Recently, a new method was reported to measure protein concentrations directly in living cells of the yeast Schizosaccharomyces pombe using fluorescence microscopy (Wu and Pollard, 2005). A linear relationship was observed between the protein amount and fluorescence intensity, which means that within a certain range, no matter what protein is tagged by the fluorophore or where the tagged protein is localized, the fluorescence intensity is determined only by the protein amount. In this paper, we used a similar strategy, measuring the amounts of various Atg proteins at the PAS in different conditions and examining the levels of proteins involved in specific cargo delivery.
Results
Overexpressed prApe1 exceeds the capacity of the Cvt pathway
In wild-type cells, most of the Ape1 is detected as mApe1 (the mature form) under steady-state conditions. In contrast, prApe1 accumulates when the protein is overexpressed (Klionsky et al., 1992; Harding et al., 1995). The accumulated prApe1 is rapidly matured when cells are shifted to starvation conditions (Scott et al., 1996), and further precursor accumulation does not occur. The machinery of specific autophagy clearly has a limited capacity for cargo delivery, and import via this pathway is saturated if the cargo amount exceeds this capacity. The nonspecific autophagy pathway utilizes sequestering vesicles with a much larger volume and thus delivers more cargo into the vacuole. We decided to determine whether the altered expression of particular Atg proteins that occurs during autophagy could account for the enhanced capacity of the nonspecific pathway with regard to the import of prApe1.
First, we replicated the accumulation of prApe1 induced by overexpression. In wild-type cells, the expression level of Ape1 could be induced upon starvation (Fig. 1 A, lanes 1 and 2). As expected, no prApe1 was detected under these conditions. In a prApe1 overexpression strain in which the CUP1 promoter drove prApe1 synthesis, the level of the protein was dramatically enhanced and >50% accumulated as the precursor form (Fig. 1 A, lane 3). When the cells were shifted to starvation conditions to induce nonspecific autophagy, the accumulated prApe1 was completely matured (Fig. 1 A, lane 4).
Figure 1.

The amount of Atg11 affects the capacity of the Cvt pathway. Strains were cultured in SMD and then starved for 2 h. Cells were harvested before or after starvation and analyzed by Western blotting with anti-Ape1 antiserum. (A) Overexpression of prApe1 overwhelms the Cvt pathway. The wild-type (SEY6210) or prApe1 overexpression (JGY069) strain was analyzed. (B) Overexpression of Atg8 and 19 could not restore the maturation of overexpressed prApe1. The prApe1 overexpression strain harboring pCuAtg19, pCuAtg8, or both was analyzed. (C) A higher level of Atg11 enhanced the processing of overexpressed prApe1. Cells expressing a combination of pHA-Atg11, pCuAtg8, and pCuAtg19 were examined. (D) The CC domains (CC2, CC3, and CC4 but not CC1) were required for the effect of Atg11 on Cvt pathway capacity. Besides Atg19 and 8, full-length (FL) or truncations of Atg11 were expressed in the prApe1 overexpressing strain and the maturation of prApe1 was examined.
Next, we compared the expression level of Atg proteins between growing and starvation conditions. Among those required for prApe1 import, Atg8 and 19 show an increased expression level during starvation (Kirisako et al., 1999; Scott et al., 2001). Atg19 is a specific receptor protein for prApe1, whereas Atg8 is involved in the expansion of the autophagosomal membrane (Nakatogawa et al., 2007), and the amount of Atg8 is correlated with the size of the autophagosome (Xie et al., 2008). We hypothesized that the basal level of Atg19 and 8 under growing conditions is not abundant enough to transport excess prApe1. Therefore, we tested whether it was possible to restore the maturation of excess prApe1 by overexpressing these two proteins. Cells were transformed with plasmids expressing Atg8, 19, or both, driven by the CUP1 promoter. When Atg19 was overexpressed along with prApe1, the precursor form of Ape1 still accumulated in rich medium conditions (Fig. 1 B). Induction of autophagy by starvation rescued the precursor accumulation phenotype, so the overexpressed Atg19 did not act in a dominant-negative manner. Similarly, overexpression of Atg8 did not prevent accumulation of prApe1 and did not interfere with maturation via nonspecific autophagy. Finally, overexpression of both Atg8 and 19 was also ineffective in allowing maturation of the elevated level of prApe1. This suggested the existence of other limiting factors besides Atg8 and 19 that can determine the capacity of cargo delivery in the Cvt pathway.
A higher level of Atg11 facilitates the import of excess prApe1 by the Cvt pathway
Because Atg11 is the key component involved in the recruitment of Atg8, 19, and other Atg proteins to the PAS (Kim et al., 2001b; Shintani et al., 2002; Yorimitsu and Klionsky, 2005a), we tested whether the Atg11 amount has an effect on Cvt pathway capacity. The Cvt pathway is sensitive to the dosage of Atg11. When expressed from a multicopy plasmid, Atg11 displays a dominant-negative phenotype, which results in ∼40–50% of prApe1 remaining in the unprocessed form (Kim et al., 2001b). To avoid the dominant-negative effect of excess Atg11, we decided to express the ATG11 gene under the control of the endogenous promoter on a centromeric (CEN) plasmid in addition to the chromosomal copy of ATG11, which resulted in a modulated increase of Atg11 amount (approximately three- to fourfold; unpublished data). With this level of Atg11, only a small amount of prApe1 accumulated in growing conditions (Fig. 1 C, lane 3). When Atg8 and/or 19 were coexpressed with Atg11, prApe1 was fully processed and no precursor could be detected (Fig. 1 C, lanes 5, 7, and 9). The maturation of prApe1 under starvation conditions was not affected in these overexpression strains (Fig. 1 C, lanes 4, 6, 8, and 10). It is known that Atg11 interacts with other Atg proteins via its coiled-coil (CC) domains (Yorimitsu and Klionsky, 2005a). When cells expressed a plasmid encoding Atg11ΔCC2, ΔCC3, or ΔCC4 in which the corresponding CC domain was deleted, there was no effect on prApe1 maturation, whereas full-length Atg11 expression reduced the accumulation of prApe1 (Fig. 1 D, lanes 3, 7, 9, and 11). The expression of Atg11ΔCC1, however, substantially facilitated the maturation of prApe1 although with a little bit less efficiency than the full-length protein (Fig. 1 D, lane 5). This observation is consistent with previous results that CC1 of Atg11 is not required for the Cvt pathway (Yorimitsu and Klionsky, 2005a). Therefore, the ability of Atg11 to rescue the prApe1 accumulation phenotype depends on its interaction with other Atg proteins.
More Cvt vesicles were synthesized in cells overexpressing Atg11
To address whether the higher amount of mApe1 in Atg11 overexpressing cells is caused by elevated vesicle formation or increased vesicle size, we performed a morphological analysis by transmission EM (TEM). During the Cvt pathway, the outer membrane of the Cvt vesicle fuses with the vacuolar membrane, releasing the single-membrane Cvt body. Within the vacuolar lumen, the Cvt body is broken down in a Pep4-dependent manner. Pep4 is a vacuolar protease required for the maturation of other vacuolar enzymes (Ammerer et al., 1986). In a pep4Δ strain, intact Cvt bodies accumulate in the vacuole and can be visualized by EM. In addition, we knocked out Vps4 to eliminate vesicles generated from the multivesicular body pathway (Babst et al., 1998, 2002). In pep4Δ vps4Δ CuApe1 (JGY089) cells harboring empty vectors as controls, Cvt bodies were observed inside the vacuole. The mean number was 3 ± 0.2 vesicles per vacuole (mean ± SEM; n = 50; Fig. 2, A and C). In pep4Δ vps4Δ CuApe1 cells simultaneously overexpressing Atg8, 11, and 19, numerous Cvt bodies appeared and the mean was 9.1 ± 0.8 per vacuole (mean ± SEM; n = 59), which was significantly higher than the number observed in the control (P < 0.01; Fig. 2, A and C). To determine whether overexpression of Atg8, 11, and 19 affected the size of the Cvt bodies, we quantified their diameter. In cells overexpressing these three proteins, the mean diameter was 252 ± 3.5 nm (mean ± SEM; n = 538), whereas that of control cells was 209 ± 5.4 nm (mean ± SEM; n = 151). This difference was also statistically significant (P < 0.01).
Figure 2.

More Cvt vesicles were formed in Atg11-overexpressing cells. Cells (pep4Δ vps4Δ CuApe1; JGY089) expressing either pAtg11, pCuAtg8, and pCuAtg19 or empty vectors were cultured in SMD medium to mid-log phase. Cells were harvested and prepared for EM as described in Materials and methods. Representative images of TEM and IEM are shown in A and B, respectively. Areas with typical Cvt vesicles are shown with higher magnification at the right. In A, the Cvt vesicles were drawn in black in the far right. Bars: (A) 500 nm; (B) 200 nm. (C and D) Quantification of Cvt body accumulation. The number was determined from cells with clearly defined Cvt bodies inside the vacuole.
In addition to TEM, we also performed immuno-EM (IEM) with Ape1 antibody to analyze the formation and verify the identity of Cvt vesicles in cells overexpressing Atg11. Cvt vesicles and Cvt bodies labeled with gold particles were detected outside and inside the vacuoles, respectively, in pep4Δ CuApe1 (JGY088) cells harboring pAtg11, pCuAtg8, and pCuAtg19 or empty vectors (Fig. 2 B). Occasionally, multiple Ape1 complexes were present within a single larger membrane in cells overexpressing Atg8, 11, and 19 (unpublished data) and we also counted them in the quantification. The mean number of Cvt bodies in cells overexpressing Atg8, 11, and 19 was 9.5 ± 0.7 (mean ± SEM; n = 65), whereas the number in control cells was 3.3 ± 0.3 (mean ± SEM; n = 55; P < 0.01). This result was consistent with our observation by TEM. However, the small increase in Cvt body diameter seen by TEM with Atg8, 11, and 19 overexpression was not observed by IEM (P = 0.39), which may be explained by the different sample preparation procedures needed for TEM versus IEM. Therefore, with the overexpression of Atg11, as well as Atg8 and 19, the number of Cvt bodies increased substantially by approximately threefold, resulting in the formation of more mApe1, which was detected by Western blot (Fig. 1). The size of Cvt vesicles may also be affected but was apparently less significant than the change in vesicle number.
What is the mechanism through which the Atg11 level can affect the efficiency of Cvt vesicle formation? Given the function of Atg11 in recruiting the prApe1 complex to the PAS via Atg11–Atg19 interaction, we speculated that the higher amount of Atg11 resulted in a higher efficiency of cargo recruitment. Another aspect of Atg11 function, however, is in the anterograde movement of Atg9 (from peripheral sites to the PAS). Recently, it was reported that defective anterograde movement of Atg9 in the atg27Δ mutant results in fewer but normal-sized autophagosomes produced in starvation conditions (Yen et al., 2006). In contrast, Atg9 localization is restricted to the PAS when Atg11 is overexpressed, which blocks prApe1 maturation (He et al., 2006), although the levels of Atg9 and 11 were not quantified. This suggests a relationship between cargo delivery and the proper targeting of Atg9 to the PAS. Accordingly it is also possible that the intermediate increase in Atg11 expression used in the present analysis caused an increase in the flux of Atg9 from the putative membrane source to the PAS, supplying extra lipid for the formation of more Cvt vesicles. Thus, to gain specific quantitative information on whether the increase in Atg11 affected the functional pool of other proteins that are bound to prApe1 or present at the PAS, we needed to establish a method to study the stoichiometry of the Atg proteins at the PAS.
A fluorescence-based method can be used to determine the stoichiometry of the Atg proteins
Recently, a method was established in S. pombe that demonstrates that within a certain range the fluorescence intensity of fusion proteins is proportional to the number of protein molecules (Wu and Pollard, 2005). This method has a clear utility for an analysis of the Cvt pathway and autophagy because most of the Atg proteins are partly restricted at a specific location: the PAS. If we can establish the linear relationship between protein amount and fluorescence intensity, then it will be easy to calculate the level of any Atg protein at the PAS via its PAS fluorescence intensity. Accordingly, we investigated the applicability of this strategy in Saccharomyces cerevisiae.
We began by testing the linearity between protein concentration and fluorescence intensity. We generated a series of strains harboring GFP-tagged fusion proteins expressed at different levels. In YZX247, YZX251, and YZX257, GFP-Atg8 expression was driven by the ATG8, ATG27, or ATG3 promoter, respectively. In YZX246, there are two copies of GFP-Atg8, which are independently expressed under the control of the VPS30 and ATG18 promoters. Upon starvation, GFP-Atg8 expression was induced to different levels depending on the particular promoter (unpublished data). In the wild-type background, GFP-Atg8 is delivered into the vacuole and degraded in a Pep4-dependent manner (Kirisako et al., 1999). Therefore, we generated four additional strains in which the PEP4 gene was deleted to block the degradation of GFP-Atg8. In these pep4Δ GFP-Atg8 strains, the amount of GFP-Atg8 was slightly higher than their counterparts in the PEP4 GFP-Atg8 background. In this way, we constructed a total of eight strains expressing GFP-Atg8 at different levels.
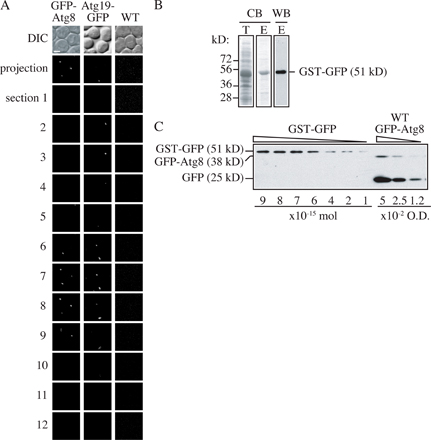
Using these GFP-Atg8 strains, we measured the fluorescence intensity and protein amount of the fusion proteins after 2 h of starvation by microscopy and immunoblotting, respectively. For fluorescence intensity, each sample was imaged at 12 focal planes. The interval between two adjacent sections was set to 0.5 μm to cover the depth of a yeast cell. Then these 12 sections were additively projected in a 2D image (Fig. S1 A, available at http://www.jcb.org/cgi/content/full/jcb.200711112/DC1), and the fluorescence intensity of the whole cell was measured by microscopy software (as described in Materials and methods). To quantify the protein amount, because all the fusion proteins we would study were tagged with GFP, we used purified GST-GFP (Fig. S1 B) as a standard protein with known concentration. When GFP-Atg8 is delivered into the vacuole, the GFP moiety is relatively stable, and free GFP accumulates within the vacuolar lumen (Shintani and Klionsky, 2004b). Because the free GFP in the vacuole also contributed to the fluorescence signal of the whole cell, we quantified both the GFP-Atg8 and free GFP bands by Western blot and calculated the sum (Fig. S1 C). However, in the pep4Δ GFP-Atg8 strains, no free GFP could be formed and only the GFP-Atg8 band was quantified. After determining the fluorescence intensity and protein level of GFP-Atg8 (or free GFP) in each strain, we plotted the intensity against the protein amount. A linear relationship was shown and linear regression was done to generate a formula describing this relationship (Fig. 3), R2 = 0.9765, suggesting that our data fit the formula reasonably well. The intercept was set to zero because when the protein concentration is zero, we expect the fluorescence intensity to theoretically be zero as well.
Figure 3.

Linear relationship between GFP-tagged protein amount and fluorescence intensity. The standard curve showed the relationship between protein amount and fluorescence intensity. Fluorescence intensity and GFP-tagged protein amount were quantified in the following strains: (a) PATG27GFP-Atg8; (b) Mlc2-GFP; (c) PATG27GFP-Atg8 pep4Δ; (d) PVPS30-ATG18GFP-Atg8; (e) PVPS30-ATG18GFP-Atg8 pep4Δ; (f) PATG3GFP-Atg8; (g) PATG3GFP-Atg8 pep4Δ; (h) PATG8GFP-Atg8; (i) Cdc12-GFP; and (j) PATG8GFP-Atg8 pep4Δ. Error bars indicate the SD of three independent experiments. For fluorescence intensity, >200 cells of each strain were analyzed by microscopy as described in Materials and methods. Linear regression was performed to generate the formula y = 11.029x.
Among Atg proteins, Atg8 is expressed at the relatively higher levels of ∼2,000 molecules per cell in growing conditions (Ghaemmaghami et al., 2003). To add additional data points to our analysis, in particular at lower expression levels, we analyzed two more proteins. Cdc12 and Mlc2 are two critical proteins involved in cytokinesis (Longtine et al., 1996; Luo et al., 2004). Their expression levels are ∼1,000 molecules per cell, which is close to the estimated values for most Atg proteins other than Atg8. Using the same methods, the fluorescence intensity and protein amount of Cdc12-GFP and Mlc2-GFP were measured. We found that these two proteins fit well into the linear relationship that we had calculated based on the various strains expressing GFP-Atg8 (Fig. 3). Therefore, the plot in Fig. 3 can theoretically be used as a standard curve to calculate protein amount from fluorescence intensity over a relatively wide range. To avoid the variance of fluorescence signal from experiment to experiment, we used the PATG27GFP-Atg8 and PATG8GFP-Atg8 pep4Δ strains (Fig. 3, a and j) to calibrate the standard curve for the subsequent experiments.
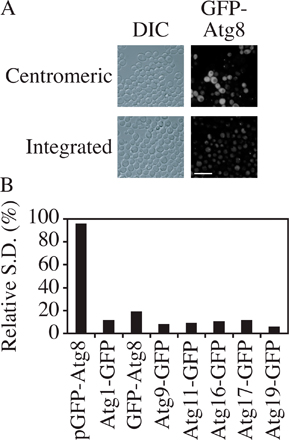
So far, all the GFP fusion proteins that we discussed were expressed by plasmid-based integration or chromosomal tagging and were not from CEN plasmids. The reason is that we found that the SD of fluorescence intensity of CEN plasmid-based fusion proteins was much higher than that of chromosomally expressed fusion proteins. For example, based on microscopy, the GFP-Atg8 (CEN) signal was extremely bright in some cells but very dim in others, whereas the intensity of chromosomally expressed GFP-Atg8 was relatively constant from cell to cell (Fig. S2 A, available at http://www.jcb.org/cgi/content/full/jcb.200711112/DC1). The relative SD (SD/mean) of the fluorescence signal among cells was calculated. All the chromosomally expressed proteins had a low relative SD, which was less than one-tenth of that for GFP-Atg8 expressed from a CEN plasmid (Fig. S2 B).
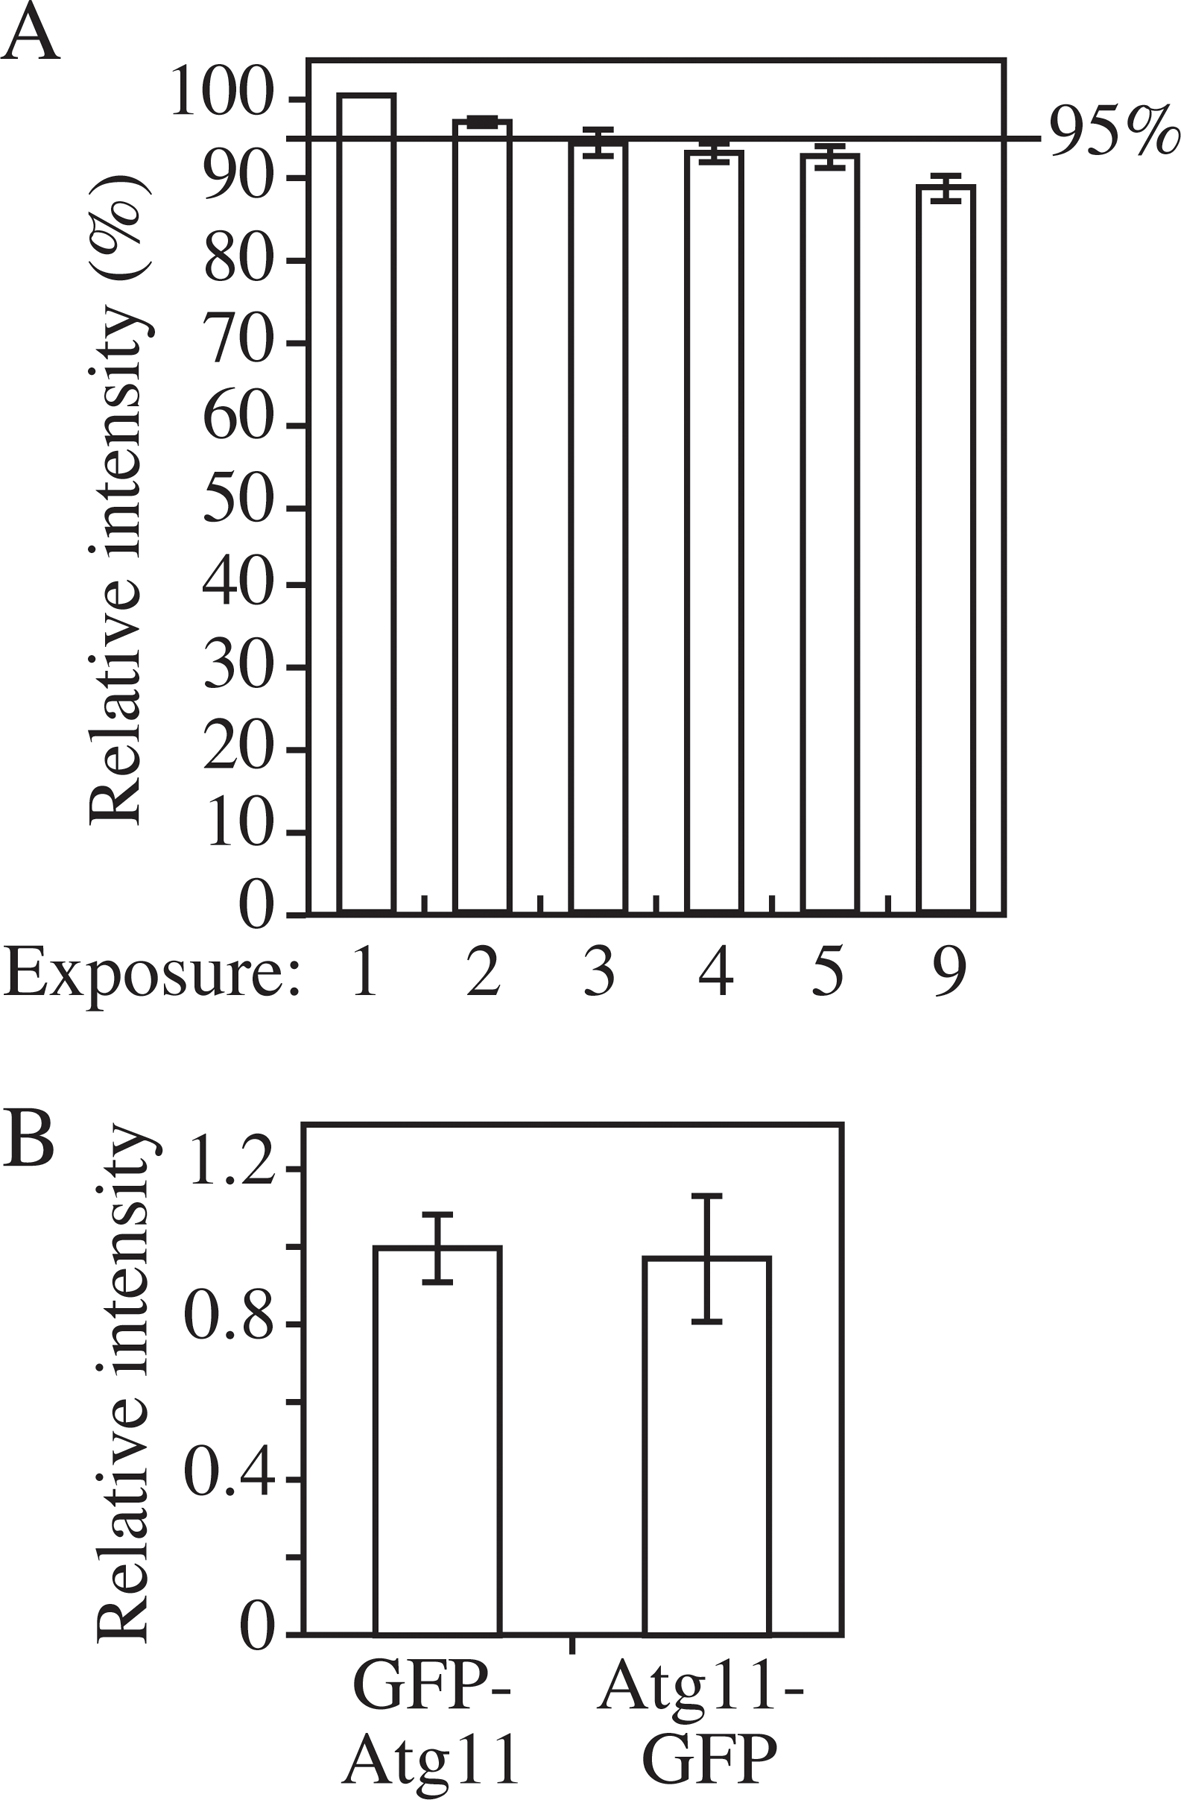
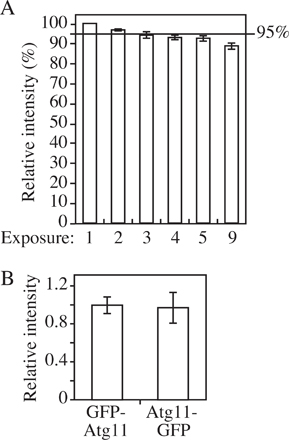
To test the reliability of the standard curve, we examined its accuracy under different parameters. First, a criterion was established in this study that no more than three pictures were taken on the same slide to minimize the effect of photobleaching (Fig. S3 A, available at http://www.jcb.org/cgi/content/full/jcb.200711112/DC1). Second, the quenching effect was examined. For most proteins, the subcellular distribution is not uniform. Therefore, the local concentration of a certain protein may be higher at some specific locations than at others. If the local concentration at a particular site is extremely high, it is possible that the fluorescent signal at that location may get saturated. To test this possibility, the intensities of GFP-Atg8 were measured in different genetic backgrounds. When GFP-Atg8 is exposed to vacuolar hydrolases, released free GFP will be evenly diffuse in the vacuole lumen. In a hydrolase-deficient mutant such as pep4Δ, autophagic bodies will not be broken down and tend to cluster together in the vacuole lumen (Takeshige et al., 1992; Kirisako et al., 1999) (Fig. 4 A). Atg5 is required for the recruitment of Atg8 to the PAS. In an atg5Δ mutant, GFP-Atg8 will be evenly diffuse in the cytosol but absent in the vacuole (Fig. 4 A; Suzuki et al., 2001). In contrast, in the atg2Δ mutant, GFP-Atg8 is constrained at the PAS, giving an extremely strong fluorescence signal at this small region (Fig. 4 A; Suzuki et al., 2007). Thus, in the background of pep4Δ, atg2Δ, or atg5Δ mutants, GFP-Atg8 has totally different localization patterns, ranging from diffuse to concentrated. Western blotting showed that the protein amount of GFP-Atg8 in these three strains was the same (Fig. 4 B). If a quenching effect was significant, the intensity of concentrated GFP-Atg8 would be lower than the diffuse GFP-Atg8. However, quantification of the fluorescence microscopy indicated that the total intensity per cell was essentially the same in all three strains (Fig. 4 C). This observation suggested that fluorescent signals that result from clustering within the vacuole or from being concentrated at the PAS will not dramatically affect the signal intensity. Because Atg8 has the highest concentration at the PAS among the Atg proteins, the lack of saturation for the Atg8 signal means that saturation should not be an issue for the other Atg proteins.
Figure 4.

Localization patterns do not affect the linearity of the fluorescent signal. (A) Representative images of GFP-Atg8 localization in pep4Δ, atg2Δ, and atg5Δ strains, which result in autophagic body, PAS, and diffuse cytosolic staining patterns, respectively. GFP-Atg8 pep4Δ (YZX254), GFP-Atg8 atg2Δ (JGY054), or GFP-Atg8 atg5Δ (JGY053) cells were starved for 2 h and examined by fluorescence microscopy. Bar, 2 μm. (B) The protein amount of GFP-Atg8 was the same in the pep4Δ, atg2Δ, or atg5Δ backgrounds. The amount of Pgk1 protein in each strain was used as a loading control. (C) Relative fluorescence intensity of GFP-Atg8 per cell in pep4Δ, atg2Δ, and atg5Δ strains (n = 60). Images of all of these strains were quantified as described in Materials and methods. The intensity of GFP-Atg8 in the atg5Δ strain was normalized to 1 as a reference. Error bars indicate the SEM of three independent experiments.
Finally, we tested the difference between N- and C-terminal tagging. To establish the standard curve, we used a series of N-terminally tagged GFP-Atg8 strains, because a GFP moiety at the C terminus of Atg8 will be cleaved off in the cytosol during the formation of Atg8-phosphatidylethanolamine (Ichimura et al., 2000). Most of the other Atg proteins in our analysis, however, are tagged at the C terminus because of the ease of construction via the PCR-based gene-tagging method (Longtine et al., 1998). Microscopy data showed that the difference between C- and N-terminal tagging was insignificant (Fig. S3 B). Therefore, the standard curve calibrated by tagging strains at the N terminus is applicable to C-terminally tagged strains.
The increased amount of Atg11 enhanced the recruitment of Atg8 and 9, but not Atg19, to the PAS
Given the linear relationship between protein amount and fluorescence intensity, we investigated the change in the local concentrations of Atg8 and 9 to test our hypothesis that higher amounts of Atg11 enhanced the recruitment of these proteins to the PAS. To measure the local protein concentration at the PAS, a small circle was drawn around the PAS dot. Another circle with the same size drawn at an adjacent cytosolic area was used as background and subtracted (Fig. 5 A). The difference between these two was recorded as the PAS intensity.
Figure 5.

Effect of Atg11 overexpression on the PAS intensity of Atg8 and 9. (A) On the 2D projection image, circles were drawn around the PAS (arrow) and the adjacent cytosolic region (arrowhead) as background. The difference between these two regions was recorded as the PAS intensity. Bar, 2 μm. (B) The CuApe1 Atg9-GFP strain (JGY072) expressing pHA-Atg11, pCuAtg8, or pCuAtg19 was cultured in SMD medium and examined by microscopy (n = 80). (C) CuApe1 atg8Δ cells (JGY071) harboring pGFP-Atg8 together with pHA-Atg11, pCuAtg19, or empty vector were cultured in SMD medium and examined by microscopy (n = 80). (D) Increase of Atg11-GFP intensity at the PAS in Atg11 overexpression cells. The CuApe1 Atg11-GFP strain (JGY087) transformed with empty vector or pAtg11-GFP was grown in SMD media and the PAS intensity of Atg11-GFP was analyzed by microscopy (n = 80). (E) Overexpression of Ape1 or Atg11 did not induce lipidation of Atg8. Wild-type (SEY6210) cells or the CuApe1 strain (JGY069) expressing pHA-Atg11 or pCuAtg19 were cultured in nutrient-rich medium, and a protein extract was resolved by SDS-PAGE and examined by Western blot with anti-Atg8 antiserum. The asterisk marks a nonspecific band. (F) The total GFP-Atg8 signal was not affected by the increase of Atg11. The same strains as in C were used, but instead of measuring the signal at the PAS, the GFP-Atg8 intensity of the whole cell was measured (n = 60). The relative intensity of cells expressing empty vector was set to 1 as reference, and error bars indicate the SEM of three independent experiments.
Atg9-GFP cells with overexpressed Atg11 were subjected to fluorescence microscopy. The PAS intensity of Atg9-GFP increased by 45% when Atg11 was overexpressed (Fig. 5 B). However, when Atg8 or 19 were overexpressed, the intensity of Atg9-GFP was still the same as in the control strain expressing the empty vector (Fig. 5 B). Because the intensity of the fluorescent signal indicated the amount of the corresponding protein, this result suggested that in the strain overexpressing Atg11, more Atg9 molecules were located at the PAS. This observation agrees with our previous data, which show Atg9 restricted at the PAS in the presence of dominant-negative levels of Atg11 (He et al., 2006). Thus, the elevated Atg9 at the PAS in the present analysis may have resulted from an enhanced movement of Atg9 from the peripheral pool to the PAS. We also used this approach to examine the intensity of GFP-Atg8. We found that overexpression of Atg11 increased the localized amount of Atg8 at the PAS by ∼50%, whereas Atg19 overexpression had essentially no effect (Fig. 5 C). In contrast, the PAS intensity of Atg19-GFP was not significantly changed when Atg11 was overexpressed (unpublished data), which suggests that an extra amount of specific cargo receptor may not be critical at this stage.
The amount of Atg11 at the PAS when overexpressed was also evaluated. In previous experiments (Fig. 1), chromosomal Atg11 plus another copy on a CEN plasmid were considered to provide modulated overexpression. Therefore, a chromosome-tagged Atg11-GFP strain (JGY087) expressing a pAtg11-GFP (CEN) plasmid was used here. Analyzed by our microscopy assay, the PAS intensity of Atg11 in the strain expressing pAtg11-GFP (CEN) was ∼50% higher than the same strain expressing an empty vector (Fig. 5 D). Thus, there was a clear correlation between Atg11 PAS intensity and that of both Atg8 and 9.
We also tested whether Atg11 overexpression changed the expression level or lipidation status of Atg8. We found that the amount of Atg8 and Atg8–PE remained unchanged either when Atg11 or 19 was expressed alone or when both proteins were expressed together (Fig. 5 E). This result was supported by our microscopy assay, which is more sensitive. The total GFP-Atg8 signal of cells expressing Atg11 did not show any substantial difference from cells expressing an empty vector or Atg19 (Fig. 5 F). This suggested that Atg11 only changed the distribution pattern of Atg8 and not its expression or stability. Thus, it was clear that the recruitment of Atg8 and 9 to the PAS was substantially up-regulated when Atg11 was overexpressed. Considering the role of the former two proteins in sequestering vesicle formation, higher levels of Atg8 and 9 at the PAS may provide the capacity to form a larger number of vesicles, which could explain the EM data (Fig. 2) and the enhanced capacity for import of overexpressed prApe1 even under growing conditions.
Stoichiometries of Atg proteins at the PAS
After establishing a method to measure local protein amount, we extended our analysis to additional components involved in either the Cvt or autophagy pathway. Altogether, we analyzed Atg1, 8, 9, 11, 16, 17, and 19. We chromosomally fused the GFP tag at either the N (Atg8) or C (others) terminus and used the corresponding strains to investigate the respective stoichiometries.
We first fit the whole cell fluorescence intensity of these strains into the standard curve established previously. The total fluorescence intensity per cell in each strain was measured in nutrient-rich conditions, and then for each Atg protein the molecular number per cell was calculated via the standard curve. The expression levels of GFP-Atg proteins range from ∼400 to 2,000 molecules per cell (Table I). Recently, a large-scale analysis of protein expression was performed in yeast (Ghaemmaghami et al., 2003). Comparison between our fluorescence-based molecular number and the previous Western-based number showed a good correlation between these two groups of data (Table I), which again confirmed the correlation between the fluorescent signal and the protein concentration.
Table I. Local and global amount of Atg proteins in growing conditions.
| Protein | Number of molecules per cell (database)a |
Number of molecules per cell (present study; mean ± SEM.; n = 80) |
Number of molecules at the PAS (mean ± SEM; n = 100) |
|---|---|---|---|
| Atg1 | 1,070 | 1,780 ± 144 | 49 ± 7 |
| Atg8 | 2,010 | 2,244 ± 156b | 272 ± 9 |
| Atg9 | ND | 906 ± 88 | 70 ± 3 |
| Atg11 | ND | 1,162 ± 121 | 40 ± 2 |
| Atg16 | 573 | 421 ± 31 | 34 ± 2 |
| Atg17 | 358 | 469 ± 41 | 56 ± 6 |
| Atg19 | 1,250 | 1,290 ± 137 | 110 ± 4 |
Ghaemmaghami et al. (2003).
n = 200.
Next, we examined the PAS intensity of these GFP-tagged Atg proteins in growing conditions. For all the Atg proteins we tested, only a small portion of the protein pool was located at the PAS. Atg8 had the highest concentration at the PAS, whereas Atg16 had the lowest (Fig. 6 A and Table I). For Atg1, 8, 11, 16, and 17, the non-PAS population was evenly diffuse in the cytosol, whereas the integral membrane protein Atg9 showed multiple punctate non-PAS structures as reported previously (Reggiori et al., 2005).
Figure 6.

Amount of Atg proteins at the PAS during either the Cvt pathway or autophagy. (A) Boxplot of the amount of Atg proteins at the PAS in growing conditions. The local protein amount was calculated as described in Materials and methods and graphed into a boxplot (n = 100). (B) Difference in the PAS intensity between the Cvt pathway and autophagy. GFP-tagged strains were cultured in nutrient-rich conditions (YPD medium; n = 100) and then shifted to starvation conditions (SD-N medium; n = 60) for 2 h. Microscopy was done before and after starvation. Error bars indicate the SEM of three independent experiments.
The ability to rapidly switch from the Cvt pathway to bulk autophagy is necessary for yeast cells to respond to the stress of starvation. The Atg1 complex is critical for the switch between these two pathways (Kamada et al., 2000), but it is still unclear as to how this transition occurs. In addition, even for those Atg proteins required for both autophagy and the Cvt pathway, their quantitative behavior at the PAS is unknown. To understand more about the mechanism involved in converting cells from the vegetative Cvt pathway to nonspecific autophagy, we measured the PAS fluorescence intensity of GFP-tagged Atg proteins in either growing or starvation conditions (Fig. 6 B). In Atg1-, Atg11-, Atg16-, Atg17-, and Atg19-GFP strains, the PAS intensity did not change after cells were starved for 2 h. In contrast, the PAS intensity of GFP-Atg8 increased by 130% and that of Atg9 by 90%. Similar to the change of Atg8 and Atg9 PAS intensity seen in Atg11 overexpression conditions, an increase in the amount of Atg8 and Atg9 at the PAS correlated with the delivery capacity of either the Cvt pathway or nonspecific autophagy.
Kinetics of Atg proteins at the PAS
Most Atg proteins involved in vesicle formation are primarily detected at the PAS (Suzuki et al., 2001). Our current understanding is that the PAS plays a role in the initiation and expansion of the phagophore by concentrating Atg proteins to this confined small region. Thus, this structure can be considered as a hybrid of autophagy machinery and forming vesicles. Most Atg proteins recruited to the forming vesicle will dissociate from this structure before or upon completion of the vesicle. However, the relationship between the PAS and the forming vesicle is still not clear. Therefore, we decided to investigate the kinetics of Atg proteins at the PAS during the process of autophagy.
To address this issue, we examined the amount of Atg proteins at the PAS over time during autophagy. Cells expressing different GFP-tagged Atg proteins were incubated in SD-N medium for 2 h to induce autophagy and subjected to microscopy. Among the Atg proteins we tested (Atg1, 8, 9, 11, 16, 17, and 19), all of them except Atg8 showed a relatively constant PAS intensity over a 30-min time course (Fig. 7 A). Atg8, however, showed a periodic change of PAS intensity (Fig. 7, B and C). This observation agrees with recent published results on Atg8 kinetics at the PAS (Cheong et al., 2007). After 2 h in starvation conditions, a substantial amount of free GFP had accumulated in the vacuole so that the vacuolar region was much brighter than the cytosolic region when viewed by fluorescence microscopy (Fig. 7 C); however, we could detect a GFP-Atg8 punctate structure germinating adjacent to the vacuole. The GFP-Atg8 dot became brighter over 4–5 min (Fig. 7 B). After reaching its peak intensity, the dot became dimmer and finally disappeared. With an interval of 0–4 min, another cycle started and each cycle lasted for ∼7–9 min (Fig. 7 C). In some cells, a new cycle started before the initial cycle was completely finished, so that we saw two GFP-Atg8 dots in one cell at a particular time point.
Figure 7.

Kinetics of Atg proteins at the PAS during autophagy. GFP-tagged strains were starved for 2 h and analyzed by microscopy. (A) For Atg9-GFP, the PAS intensity remained as a relative constant for 30 min, but only nine time points are shown. Fluorescence intensity at time 0 was normalized to 1 (n = 9). Essentially the same results were seen for Atg1-, Atg11-, Atg16-, Atg17-, and Atg19-GFP. (B) For GFP-Atg8, the PAS intensity changed over time. The time point at which the punctate structure could first be seen was set as time 0 and fluorescence intensity at this time point was set to 1 (n = 11). In A and B, all data points came from three independent experiments and error bars indicate the SEM. (C) Representative images of GFP-Atg8 showing the change of PAS (arrow) intensity. Bar, 2 μm.
Discussion
In this study, we used the strategy established by the Pollard laboratory to determine protein concentration by fluorescence microscopy and applied this method to the analysis of autophagy. This approach provided information that is inaccessible by traditional methods. In this paper, we succeeded in using fluorescence microscopy to show that overexpression of Atg11 increased the amount of Atg8 and 9 at the PAS, which enhanced vesicle formation, and to study the stoichiometry of Atg proteins under different conditions.
Several lines of evidence have suggested that a proper control of the amounts of Atg8 and 9, or the kinetics of their transport, is essential for nonspecific autophagy (Yen et al., 2006; Xie et al., 2008). Our observation that an increased amount of Atg8 and 9 at the PAS led to the formation of more Cvt vesicles in growing conditions suggested that the quantity control of these two proteins is also critical for specific autophagy and represents a nontranscriptional means of regulation. For Atg9, although we did not directly quantify its anterograde flux, the increased Atg9 PAS amount at steady state may reflect an increased amount of lipid transported from the membrane source to the vesicle formation site, which is necessary for synthesizing more vesicles. When Atg11 overexpression exceeds a certain limit, such as CUP1-driven expression (He et al., 2006), the balance between anterograde and retrograde movement of Atg9 is completely disrupted. This results in a dominant-negative phenotype. Atg8 is hypothesized to be a scaffold protein that supports the expansion of the phagophore membrane. Therefore more Atg8 recruited to the PAS may facilitate the formation of a bigger scaffold or allow the assembly of the same-sized scaffold in a more efficient manner. Interestingly, in starvation conditions an attenuated amount of Atg8 reduced the size of the autophagosome and thus limited the magnitude of nonspecific autophagy (Xie et al., 2008). However, in our assay of specific autophagy, the increased amount of Atg8 affected primarily the number of vesicles instead of the size. One explanation is that in specific autophagy the cargo determines the size of the vesicle. Given the unchanged concentration of the cargo receptor Atg19 at the PAS, it is possible that cargo recruitment is not significantly increased by Atg11 overexpression.
Atg11 and 17 are believed to play critical roles at the organization center during either the Cvt pathway or autophagy, respectively, but neither is required for the other pathway (Kim et al., 2001b; Cheong et al., 2005; Yorimitsu and Klionsky, 2005a; Suzuki et al., 2007). However, our data showed that the amounts of these two proteins at the PAS remained constant during either the Cvt pathway or nonspecific autophagy. This observation suggested that these two proteins do not leave the PAS even when their functionality is not required. This stable PAS localization of Atg11 and 17 may contribute to the cell's ability to quickly switch between specific and nonspecific autophagy. Upon environmental change, such as a shift in the nutrient conditions, the Cvt or autophagy machinery is physically ready at the functional site, the PAS, and rapid changes in phosphorylation status and/or protein–protein interaction can be done within a relatively short period of time to complete the switch from one pathway to another.
In vesicle-trafficking pathways in eukaryotic cells, a coat protein complex is required to initiate the budding process. However, coat proteins in the autophagy pathway have not been clearly identified. Among the known Atg proteins, the Atg12–Atg5-Atg16 complex has been suggested as a candidate for coatomer-type proteins that cover the forming autophagosomes or Cvt vesicles and dissociate from the completed vesicle (Kuma et al., 2002), although direct evidence in support of this hypothesis is missing. Our analysis of Atg protein stoichiometry casts some doubt upon this hypothesis. In the microscopy conditions we used, the PAS signal of Atg5- and Atg12-GFP could hardly be detected. The GFP-Atg16 signal was also weak compared with other Atg proteins. Translated into a molecular number, the amount of Atg16-GFP at the PAS is 34 ± 2 molecules. A recent study showed that the mean radius of an autophagosome was ∼162 nm (Xie et al., 2008). Assuming that all the Atg16-GFP molecules at the PAS are distributed evenly on the outer surface of a forming autophagosome, then 34 molecules per PAS can be translated into one Atg16-GFP molecule per 9.7 × 10³ nm2 of surface area. This calculation suggests that the amount of Atg16 at the PAS is too low to allow the Atg12–Atg5-Atg16 complexes to cover the entire surface of an autophagosome. It is possible that the main function of the Atg12–Atg5-Atg16 complex is to facilitate the formation of Atg8–PE and recruit it to the PAS (Fujita et al., 2008) rather than to act as a conventional coatomer complex.
The microscopy method described in this paper makes it possible to quantitatively elucidate the kinetics of Atg proteins during the progression of autophagy. Interestingly, our real-time data on Atg8 fluorescence intensity changes suggest a possibility to explain the function of Atg8 in a temporal manner. Combined with our previous understanding of Atg8, one cycle of Atg8 fluorescence at the PAS can be translated into the formation of one autophagosome (Xie et al., 2008). That is, the number of GFP-Atg8 signal peaks can indicate the number of autophagosomes formed. Compared with conventional methods, which rely on EM to count the number of autophagic bodies accumulated in the vacuole in a pep4Δ background, this new method can measure the autophagosome number in a real-time manner. Furthermore, this approach may even be more sensitive when the smaller size of abnormal autophagosomes makes the conventional method problematic.
Materials and methods
Media and growth conditions
Yeast cells were grown in YPD (rich [1% yeast extract, 2% peptone, and 2% glucose]) or SMD (synthetic minimal [0.67% yeast nitrogen base, 2% glucose, and auxotrophic amino acids and vitamins as needed]) media. For starvation conditions, SD-N medium (0.17% yeast nitrogen base, without ammonium sulfate or amino acids, and 2% glucose) was used.
Plasmids
pGFP-Atg11(414) and plasmids lacking the Atg11 CC domains, pCuAtg8(416), pHA-Atg11(313), pGFP-Atg11(414), pGFP-Atg8(416), and pCuGFP-Atg8(416), have been described previously (Huang et al., 2000; Kim et al., 2001a,b; Yorimitsu and Klionsky, 2005a). The plasmid pGFP-Atg11(404) was made by cloning the GFP-Atg11 fragment together with the endogenous promoter of ATG11 from pGFP-Atg11(416) (He et al., 2006) into pRS404. Plasmid pCuApe1(405) was made by cloning the CuApe1 fragment from pCuApe1(414) (Budovskaya et al., 2004) into pRS405. For Atg19 overexpression, the ORF of ATG19 was amplified from yeast genomic DNA, digested with XmaI–XhoI, and cloned into pCu(414) (Labbé and Thiele, 1999) to generate the pCuAtg19(414) plasmid. To make the pGEX-GST-GFP construct for protein purification, the ORF of GFP was amplified from pKT128 (Sheff and Thorn, 2004) by PCR. The PCR product was digested with EcoRI and XhoI and cloned into the pGEX-4T-1 plasmid (GE Healthcare).
Strains
The yeast strains used in this study are listed in Table II. The prApe1 overexpression strain (JGY069) was made by digesting the pCuApe1(405) plasmid with AflII and integrating the fragment into the genome of strain SEY6210 at the LEU2 locus. Tagging of genes by integration of GFP at the corresponding chromosomal loci was performed by a PCR-based procedure (Longtine et al., 1998). The functionality of each tagged protein was confirmed by examining prApe1 maturation. For gene disruption, the entire coding region was replaced with the Escherichia coli kanr, S. cerevisiae TRP1, S. pombe HIS5, Kluyveromyces lactis URA3, Saccharomyces kluyveri HIS3, or S. cerevisiae TRP1, LEU2, or URA3 gene using PCR primers containing ∼40 bases of identity to the regions flanking the ORF. Western blotting, PCR, or both verified putative gene knockout and tagged strains. The GFP-Atg11 strain (JGY075) was constructed by integrating pGFP-Atg11(404) into the genome of the atg11Δ mutant (Kim et al., 2001b).
Table II. Yeast strains used in this study.
| Name | Genotype | Reference |
|---|---|---|
| CWY241 | SEY6210 ATG17-GFP∷HIS3 | Cheong et al. (2005) |
| JGY018 | SEY6210 ATG19-GFP∷TRP1 | This study |
| JGY053 | TN124 atg8Δ∷KAN PATG8GFP-ATG8∷URA3 atg5Δ∷TRP1 | This study |
| JGY054 | TN124 atg8Δ∷KAN PATG8GFP-ATG8∷URA3 atg2Δ∷TRP1 | This study |
| JGY056 | TN124 atg8Δ∷KAN PATG3GFP-ATG8∷URA3 pep4Δ∷TRP1 | This study |
| JGY057 | TN124 atg8Δ∷KAN PVPS30-ATG18GFP-ATG8∷URA3 pep4Δ∷TRP1 | This study |
| JGY058 | TN124 atg8Δ∷KAN PATG27GFP-ATG8∷URA3 pep4Δ∷TRP1 | This study |
| JGY059 | SEY6210 MLC2-GFP∷TRP1 | This study |
| JGY060 | SEY6210 CDC12-GFP∷TRP1 | This study |
| JGY069 | SEY6210 PCUP1APE1∷LEU2 | This study |
| JGY070 | JGY069 ATG19-GFP∷KAN | This study |
| JGY071 | JGY069 atg8Δ∷KAN | This study |
| JGY072 | JGY069 ATG9-GFP∷KAN | This study |
| JGY075 | SEY6210 atg11Δ∷HIS3 GFP-ATG11∷TRP1 | This study |
| JGY087 | JGY069 Atg11-GFP∷KAN | This study |
| JGY088 | JGY069 pep4Δ∷ KAN | This study |
| JGY089 | JGY088 vps4Δ∷ble | This study |
| KTY97 | SEY6210 ATG9-GFP∷TRP1 | Xie et al. (2008) |
| KTY148 | SEY6210 ATG16-GFP∷KAN | Xie et al. (2008) |
| PSY101 | SEY6210 ATG11-GFP∷HIS3 | He et al. (2006) |
| PSY143 | SEY6210 ATG1-GFP∷HIS3 | Reggiori et al. (2004) |
| SEY6210 | MATα ura3-52 leu2-3,112 his3-Δ200 trp1-Δ901 lys2-801 suc2-Δ9 mel GAL | Robinson et al. (1988) |
| TN124 | MATa leu2-3,112 trp1 ura3-52 pho8∷pho8Δ60 pho13∷LEU2 | Noda et al. (1995) |
| YZX246 | TN124 atg8Δ∷KAN PVPS30-ATG18GFP-ATG8∷URA3 TRP1 | This study |
| YZX247 | TN124 atg8Δ∷KAN PATG8GFP-ATG8∷URA3 TRP1 | Xie et al. (2008) |
| YZX251 | TN124 atg8Δ∷KAN PATG27GFP-ATG8∷URA3 TRP1 | Xie et al. (2008) |
| YZX254 | TN124 atg8Δ∷KAN PATG8GFP-ATG8∷URA3 pep4Δ∷TRP1 | Xie et al. (2008) |
| YZX257 | TN124 atg8Δ∷KAN PATG3GFP-ATG8∷URA3 TRP1 | Xie et al. (2008) |
P, promoter.
Protein purification
To express GST-GFP, E. coli strain BL-21 harboring pGEX-GST-GFP was cultured to OD600 = 0.6 at 37°C and induced with 1 mM IPTG at 18°C for 12 h. The protein was purified on glutathione-Sepharose beads (GE Healthcare). The purification was confirmed by Coomassie Blue staining and Western blotting. The concentration of the purified protein was measured by the bicinchoninic acid assay.
Western blot and quantitative immunoblotting
Protein samples for immunoblotting were extracted by trichloroacetic acid precipitation, and Western blotting was performed as described previously (Cheong et al., 2005). For quantitative immunoblotting, purified GST-GFP was used as the standard sample with known concentration (in mol). The cell lysates corresponding to a certain amount of GFP-tagged cells (based on OD600) were loaded on the same gel with the standard protein and detected with anti-YFP antibody (Clontech Laboratories, Inc.), which recognizes GFP with a high specificity. The intensity of the band was quantified with ImageJ software (National Institutes of Health), and the concentrations of GFP-tagged proteins (mol per OD600) were calculated. Then the numbers in mol per OD600 were converted into molecules per cell by multiplying by Avogadro's number and dividing by the number of cells per OD600. In PEP4 GFP-Atg8 strains, we quantified both the GFP-Atg8 and free GFP bands and calculated the sum. However, in the pep4Δ GFP-Atg8 strains, no free GFP band could be detected and only the GFP-Atg8 band was quantified.
Fluorescence microscopy
Cells were cultured in YPD or SMD without auxotrophic amino acids to mid-log phase. For experiments under growing conditions, cells were pelleted and resuspended in fresh SMD without vitamins. For starvation experiments, cells were shifted to SD-N, incubated for 2 h and pelleted, and then resuspended in SD-N. The samples were then examined with a microscope (DeltaVision Spectris; Applied Precision, LLC) and pictures were captured with a camera (CoolSnap HQ; Photometrics). For each microscopy image at a certain region, 12 Z-section images were collected and stacked into one 2D image by sum projection. The interval between each Z-section was 0.5 μm and the depth of each stack was 5.5 μm, which is the approximate diameter of a normal yeast cell. Projections were analyzed and quantified using softWoRx software (Applied Precision, LLC).
EM
TEM was performed as described previously (Cheong et al., 2007). Images of vacuoles with visible vesicles were collected. The number and area of vesicles with clear membrane boundary was measured. Then the area was converted into diameter. The preparation of samples for IEM was done according to the procedures described previously (Baba et al., 1997) with slight modification. The Cvt body number was quantified as for TEM images. The size of the Cvt body was defined as the mean of the long and short axes of the Cvt body.
Online supplemental material
Fig. S1 shows the procedure used to quantify the amount of GFP-tagged protein and the fluorescence intensity. Fig. S2 compares the protein level from plasmid-based versus chromosomal expression. Fig. S3 shows the effect of photobleaching and compares the fluorescence intensity of Atg11 tagged with GFP at either ther N or C terminus. Online supplemental material is available at http://www.jcb.org/cgi/content/full/jcb.200711112/DC1.
Supplementary Material
Acknowledgments
We thank Dr. Noriko Nagata (Japan Women's University) for the use of the EM facilities and Dr. Tom Pollard for helpful advice.
This work was supported by National Institutes of Health Public Health Service grant GM53396 to D.J. Klionsky.
Abbreviations used in this paper: Ape1, aminopeptidase I; Atg, autophagy related; CC, coiled coil; CEN, centromeric; Cvt, cytoplasm-to-vacuole targeting; IEM, immuno-EM; PAS, phagophore assembly site; prApe1, precursor Ape1; TEM, transmission EM.
References
- Ammerer, G., C.P. Hunter, J.H. Rothman, G.C. Saari, L.A. Valls, and T.H. Stevens. 1986. PEP4 gene of Saccharomyces cerevisiae encodes proteinase A, a vacuolar enzyme required for processing of vacuolar precursors. Mol. Cell. Biol. 6:2490–2499. [DOI] [PMC free article] [PubMed] [Google Scholar]
- Baba, M., M. Osumi, S.V. Scott, D.J. Klionsky, and Y. Ohsumi. 1997. Two distinct pathways for targeting proteins from the cytoplasm to the vacuole/lysosome. J. Cell Biol. 139:1687–1695. [DOI] [PMC free article] [PubMed] [Google Scholar]
- Babst, M., B. Wendland, E.J. Estepa, and S.D. Emr. 1998. The Vps4p AAA ATPase regulates membrane association of a Vps protein complex required for normal endosome function. EMBO J. 17:2982–2993. [DOI] [PMC free article] [PubMed] [Google Scholar]
- Babst, M., D.J. Katzmann, E.J. Estepa-Sabal, T. Meerloo, and S.D. Emr. 2002. Escrt-III: an endosome-associated heterooligomeric protein complex required for mvb sorting. Dev. Cell. 3:271–282. [DOI] [PubMed] [Google Scholar]
- Budovskaya, Y.V., J.S. Stephan, F. Reggiori, D.J. Klionsky, and P.K. Herman. 2004. The Ras/cAMP-dependent protein kinase signaling pathway regulates an early step of the autophagy process in Saccharomyces cerevisiae.J. Biol. Chem. 279:20663–20671. [DOI] [PMC free article] [PubMed] [Google Scholar]
- Cheong, H., T. Yorimitsu, F. Reggiori, J.E. Legakis, C.-W. Wang, and D.J. Klionsky. 2005. Atg17 regulates the magnitude of the autophagic response. Mol. Biol. Cell. 16:3438–3453. [DOI] [PMC free article] [PubMed] [Google Scholar]
- Cheong, H., U. Nair, J. Geng, and D.J. Klionsky. 2007. The Atg1 kinase complex is involved in the regulation of protein recruitment to initiate sequestering vesicle formation for nonspecific autophagy in Saccharomyces cerevisiae. Mol. Biol. Cell. 19:668–681. [DOI] [PMC free article] [PubMed] [Google Scholar]
- Dunn, W.A. Jr., J.M. Cregg, J.A.K.W. Kiel, I.J. van der Klei, M. Oku, Y. Sakai, A.A. Sibirny, O.V. Stasyk, and M. Veenhuis. 2005. Pexophagy: The selective autophagy of peroxisomes. Autophagy. 1:75–83. [DOI] [PubMed] [Google Scholar]
- Fujita, N., T. Itoh, M. Fukuda, T. Noda, and T. Yoshimori. 2008. The Atg16L complex specifies the site of LC3 lipidation for membrane biogenesis in autophagy. Mol. Biol. Cell. 19:2092–2100. [DOI] [PMC free article] [PubMed] [Google Scholar]
- Ghaemmaghami, S., W.K. Huh, K. Bower, R.W. Howson, A. Belle, N. Dephoure, E.K. O'Shea, and J.S. Weissman. 2003. Global analysis of protein expression in yeast. Nature. 425:737–741. [DOI] [PubMed] [Google Scholar]
- Harding, T.M., K.A. Morano, S.V. Scott, and D.J. Klionsky. 1995. Isolation and characterization of yeast mutants in the cytoplasm to vacuole protein targeting pathway. J. Cell Biol. 131:591–602. [DOI] [PMC free article] [PubMed] [Google Scholar]
- He, C., H. Song, T. Yorimitsu, I. Monastyrska, W.-L. Yen, J.E. Legakis, and D.J. Klionsky. 2006. Recruitment of Atg9 to the preautophagosomal structure by Atg11 is essential for selective autophagy in budding yeast. J. Cell Biol. 175:925–935. [DOI] [PMC free article] [PubMed] [Google Scholar]
- Huang, J., and D.J. Klionsky. 2007. Autophagy and human disease. Cell Cycle. 6:1837–1849. [DOI] [PubMed] [Google Scholar]
- Huang, W.-P., S.V. Scott, J. Kim, and D.J. Klionsky. 2000. The itinerary of a vesicle component, Aut7p/Cvt5p, terminates in the yeast vacuole via the autophagy/Cvt pathways. J. Biol. Chem. 275:5845–5851. [DOI] [PubMed] [Google Scholar]
- Hutchins, M.U., and D.J. Klionsky. 2001. Vacuolar localization of oligomeric α-mannosidase requires the cytoplasm to vacuole targeting and autophagy pathway components in Saccharomyces cerevisiae.J. Biol. Chem. 276:20491–20498. [DOI] [PMC free article] [PubMed] [Google Scholar]
- Ichimura, Y., T. Kirisako, T. Takao, Y. Satomi, Y. Shimonishi, N. Ishihara, N. Mizushima, I. Tanida, E. Kominami, M. Ohsumi, et al. 2000. A ubiquitin-like system mediates protein lipidation. Nature. 408:488–492. [DOI] [PubMed] [Google Scholar]
- Iwata, J., J. Ezaki, M. Komatsu, S. Yokota, T. Ueno, I. Tanida, T. Chiba, K. Tanaka, and E. Kominami. 2006. Excess peroxisomes are degraded by autophagic machinery in mammals. J. Biol. Chem. 281:4035–4041. [DOI] [PubMed] [Google Scholar]
- Kamada, Y., T. Funakoshi, T. Shintani, K. Nagano, M. Ohsumi, and Y. Ohsumi. 2000. Tor-mediated induction of autophagy via an Apg1 protein kinase complex. J. Cell Biol. 150:1507–1513. [DOI] [PMC free article] [PubMed] [Google Scholar]
- Kim, J., W.-P. Huang, and D.J. Klionsky. 2001. a. Membrane recruitment of Aut7p in the autophagy and cytoplasm to vacuole targeting pathways requires Aut1p, Aut2p, and the autophagy conjugation complex. J. Cell Biol. 152:51–64. [DOI] [PMC free article] [PubMed] [Google Scholar]
- Kim, J., Y. Kamada, P.E. Stromhaug, J. Guan, A. Hefner-Gravink, M. Baba, S.V. Scott, Y. Ohsumi, W.A. Dunn, and D.J. Klionsky. 2001. b. Cvt9/Gsa9 functions in sequestering selective cytosolic cargo destined for the vacuole. J. Cell Biol. 153:381–396. [DOI] [PMC free article] [PubMed] [Google Scholar]
- Kim, J., W.-P. Huang, P.E. Stromhaug, and D.J. Klionsky. 2002. Convergence of multiple autophagy and cytoplasm to vacuole targeting components to a perivacuolar membrane compartment prior to de novo vesicle formation. J. Biol. Chem. 277:763–773. [DOI] [PMC free article] [PubMed] [Google Scholar]
- Kirisako, T., M. Baba, N. Ishihara, K. Miyazawa, M. Ohsumi, T. Yoshimori, T. Noda, and Y. Ohsumi. 1999. Formation process of autophagosome is traced with Apg8/Aut7p in yeast. J. Cell Biol. 147:435–446. [DOI] [PMC free article] [PubMed] [Google Scholar]
- Klionsky, D.J., R. Cueva, and D.S. Yaver. 1992. Aminopeptidase I of Saccharomyces cerevisiae is localized to the vacuole independent of the secretory pathway. J. Cell Biol. 119:287–299. [DOI] [PMC free article] [PubMed] [Google Scholar]
- Kuma, A., N. Mizushima, N. Ishihara, and Y. Ohsumi. 2002. Formation of the approximately 350-kDa Apg12-Apg5·Apg16 multimeric complex, mediated by Apg16 oligomerization, is essential for autophagy in yeast. J. Biol. Chem. 277:18619–18625. [DOI] [PubMed] [Google Scholar]
- Labbé, S., and D.J. Thiele. 1999. Copper ion inducible and repressible promoter systems in yeast. Methods Enzymol. 306:145–153. [DOI] [PubMed] [Google Scholar]
- Longtine, M.S., D.J. DeMarini, M.L. Valencik, O.S. Al-Awar, H. Fares, C. De Virgilio, and J.R. Pringle. 1996. The septins: roles in cytokinesis and other processes. Curr. Opin. Cell Biol. 8:106–119. [DOI] [PubMed] [Google Scholar]
- Longtine, M.S., A. McKenzie III, D.J. Demarini, N.G. Shah, A. Wach, A. Brachat, P. Philippsen, and J.R. Pringle. 1998. Additional modules for versatile and economical PCR-based gene deletion and modification in Saccharomyces cerevisiae.Yeast. 14:953–961. [DOI] [PubMed] [Google Scholar]
- Luo, J., E.A. Vallen, C. Dravis, S.E. Tcheperegine, B. Drees, and E. Bi. 2004. Identification and functional analysis of the essential and regulatory light chains of the only type II myosin Myo1p in Saccharomyces cerevisiae.J. Cell Biol. 165:843–855. [DOI] [PMC free article] [PubMed] [Google Scholar]
- Mizushima, N. 2005. The pleiotropic role of autophagy: from protein metabolism to bactericide. Cell Death Differ. 12:1535–1541. [DOI] [PubMed] [Google Scholar]
- Nakatogawa, H., Y. Ichimura, and Y. Ohsumi. 2007. Atg8, a ubiquitin-like protein required for autophagosome formation, mediates membrane tethering and hemifusion. Cell. 130:165–178. [DOI] [PubMed] [Google Scholar]
- Nice, D.C., T.K. Sato, P.E. Stromhaug, S.D. Emr, and D.J. Klionsky. 2002. Cooperative binding of the cytoplasm to vacuole targeting pathway proteins, Cvt13 and Cvt20, to phosphatidylinositol 3-phosphate at the pre-autophagosomal structure is required for selective autophagy. J. Biol. Chem. 277:30198–30207. [DOI] [PMC free article] [PubMed] [Google Scholar]
- Noda, T., A. Matsuura, Y. Wada, and Y. Ohsumi. 1995. Novel system for monitoring autophagy in the yeast Saccharomyces cerevisiae.Biochem. Biophys. Res. Commun. 210:126–132. [DOI] [PubMed] [Google Scholar]
- Reggiori, F., K.A. Tucker, P.E. Stromhaug, and D.J. Klionsky. 2004. The Atg1-Atg13 complex regulates Atg9 and Atg23 retrieval transport from the pre-autophagosomal structure. Dev. Cell. 6:79–90. [DOI] [PubMed] [Google Scholar]
- Reggiori, F., T. Shintani, U. Nair, and D. Klionsky. 2005. Atg9 cycles between mitochondria and the pre-autophagosomal structure in yeasts. Autophagy. 1:101–109. [DOI] [PMC free article] [PubMed] [Google Scholar]
- Robinson, J.S., D.J. Klionsky, L.M. Banta, and S.D. Emr. 1988. Protein sorting in Saccharomyces cerevisiae: isolation of mutants defective in the delivery and processing of multiple vacuolar hydrolases. Mol. Cell. Biol. 8:4936–4948. [DOI] [PMC free article] [PubMed] [Google Scholar]
- Scott, S.V., A. Hefner-Gravink, K.A. Morano, T. Noda, Y. Ohsumi, and D.J. Klionsky. 1996. Cytoplasm-to-vacuole targeting and autophagy employ the same machinery to deliver proteins to the yeast vacuole. Proc. Natl. Acad. Sci. USA. 93:12304–12308. [DOI] [PMC free article] [PubMed] [Google Scholar]
- Scott, S.V., J. Guan, M.U. Hutchins, J. Kim, and D.J. Klionsky. 2001. Cvt19 is a receptor for the cytoplasm-to-vacuole targeting pathway. Mol. Cell. 7:1131–1141. [DOI] [PMC free article] [PubMed] [Google Scholar]
- Sheff, M.A., and K.S. Thorn. 2004. Optimized cassettes for fluorescent protein tagging in Saccharomyces cerevisiae. Yeast. 21:661–670. [DOI] [PubMed] [Google Scholar]
- Shintani, T., and D.J. Klionsky. 2004. a. Autophagy in health and disease: a double-edged sword. Science. 306:990–995. [DOI] [PMC free article] [PubMed] [Google Scholar]
- Shintani, T., and D.J. Klionsky. 2004. b. Cargo proteins facilitate the formation of transport vesicles in the cytoplasm to vacuole targeting pathway. J. Biol. Chem. 279:29889–29894. [DOI] [PMC free article] [PubMed] [Google Scholar]
- Shintani, T., W.-P. Huang, P.E. Stromhaug, and D.J. Klionsky. 2002. Mechanism of cargo selection in the cytoplasm to vacuole targeting pathway. Dev. Cell. 3:825–837. [DOI] [PMC free article] [PubMed] [Google Scholar]
- Suzuki, K., T. Kirisako, Y. Kamada, N. Mizushima, T. Noda, and Y. Ohsumi. 2001. The pre-autophagosomal structure organized by concerted functions of APG genes is essential for autophagosome formation. EMBO J. 20:5971–5981. [DOI] [PMC free article] [PubMed] [Google Scholar]
- Suzuki, K., Y. Kubota, T. Sekito, and Y. Ohsumi. 2007. Hierarchy of Atg proteins in pre-autophagosomal structure organization. Genes Cells. 12:209–218. [DOI] [PubMed] [Google Scholar]
- Takeshige, K., M. Baba, S. Tsuboi, T. Noda, and Y. Ohsumi. 1992. Autophagy in yeast demonstrated with proteinase-deficient mutants and conditions for its induction. J. Cell Biol. 119:301–311. [DOI] [PMC free article] [PubMed] [Google Scholar]
- Wu, J.Q., and T.D. Pollard. 2005. Counting cytokinesis proteins globally and locally in fission yeast. Science. 310:310–314. [DOI] [PubMed] [Google Scholar]
- Xie, Z., U. Nair, and D.J. Klionsky. 2008. Atg8 controls phagophore expansion during autophagosome formation. Mol. Biol. Cell. DOI: 10.1091/mbc.E07-12-1292. [DOI] [PMC free article] [PubMed]
- Yen, W.-L., J.E. Legakis, U. Nair, and D.J. Klionsky. 2006. Atg27 is required for autophagy-dependent cycling of Atg9. Mol. Biol. Cell. 18:581–593. [DOI] [PMC free article] [PubMed] [Google Scholar]
- Yorimitsu, T., and D. Klionsky. 2005. a. Atg11 links cargo to the vesicle-forming machinery in the cytoplasm to vacuole targeting pathway. Mol. Biol. Cell. 16:1593–1605. [DOI] [PMC free article] [PubMed] [Google Scholar]
- Yorimitsu, T., and D. Klionsky. 2005. b. Autophagy: molecular machinery for self-eating. Cell Death Differ. 12:1542–1552. [DOI] [PMC free article] [PubMed] [Google Scholar]
Associated Data
This section collects any data citations, data availability statements, or supplementary materials included in this article.