

Abstract
The MDM2 N-terminal domain can bind to the transactivation domain of p53 and downregulate its ability to activate transcription. It was found that binding with p53 stabilizes the MDM2 Nterminal domain. Thus the coupling between binding and folding is essential in the normal functional interactions between p53 and MDM2. We have performed explicit-solvent molecular dynamics simulations (MD) for both bound and apo-MDM2 to study the interdependence of binding and folding in the p53-MDM2 complex. Kinetic analysis of high-temperature MD simulations shows that both bound and apo-MDM2 unfold via a two-state process. Both kinetics and free energy landscape analyses indicate that bound MDM2 unfolds in the order of p53 unbinding, tertiary unfolding, and finally secondary structure unfolding. Our data show that the unfolding pathways are different between bound and apo-MDM2: the unfolding order of unstable helices and tertiary contacts is reversed. Transition state analysis shows that the transition state of bound MDM2 is more native-like and more heterogeneous than that of apo- MDM2. The predicted Φ-values suggest that the stable helices are more native-like than other regions in both bound and apo-MDM2. Within the stable helices, helix II in bound MDM2 is more native-like than that in apo-MDM2. However, helix I and IV in bound MDM2 are less native-like than those in apo-MDM2.
Keywords: folding, binding, protein-protein interactions, p53, MDM2
Introduction
The human version of mouse double minute protein 2 (MDM2) has 491 residues. Its best known biological role is to negatively regulate the tumor-suppressor activity of p53 when its N-terminal domain (MDM2N) binds to the transactivation domain of p53.1-4 Because of its importance in cancer development, the MDM2N-p53 complex is a target for anticancer drug design5,6 to restore normal p53 function in tumor cells and to induce growth suppression and apoptosis.7,8
The crystal structure for the MDM2N-p53 complex was reported in 1996 (pdb code: 1YCR).3 The complex has five α-helices and two strands of anti-parallel β-sheet. MDM2N consists of helix I from Pro32 to Val41, helix II from Met50 to Lys64, helix III from Leu81 to Phe86, helix IV from His96 to Asn106, strand I from Ile74 to Tyr76, and strand II from Ser90 to Ser92. p53 consists of helix V from Phe18 to Leu25. Two longer helices (helix II and IV) and two shorter helices (helix I and III) form a deep hydrophobic cleft for p53 binding in MDM2N (see Figure 1).
Figure 1.

Ribbon representation of the x-ray structure of p53-MDM2N (pdb code: 1YCR). Blue represents helix I, green represents helix II, yellow represents helix III, orange represents helix IV, and red represents helix V.
NMR experiment indicates that MDM2N is unstable.9 There are evidences of partial unfolding and multiple conformations.9 MDM2N becomes several-fold more stable in the presence of peptide or small-molecule ligands.9 When MDM2N interacts with p53, chemical shifts are changed not only in the binding pocket of the protein, but also over other parts of the protein, suggesting global conformational change in MDM2N.10 These experimental observations raise a series of interesting questions. 1) How does the folded state of MDM2N change upon p53 binding? 2) How does p53 binding influence the folding pathway of MDM2N? 3) How does p53 binding influences the unfolded state of MDM2N? To answer these questions, we utilize molecular dynamics (MD) simulations in explicit solvent to analyze the coupling between binding and folding11,12 in the MDM2N-p53 complex.
However the folding time scales of most single-domain proteins, 10-1000 ¼s as recent ultrafast spectroscopy experiments have shown,13-15 are much longer than that of MD simulations. The longest single simulation trajectory performed so far is about 1 ¼s on the ab initio folding of villin headpiece, a small protein domain of only 36 residues.16 In order to study protein folding within reasonable time, simulations of protein unfolding have been widely used.17-25 This is because the rate of unfolding increases at high temperatures, for example at as high as 498K, so that most single-domain proteins unfold in the ns time scale.26 Although hightemperature simulations could favor uncharacteristic and/or “fast-track” pathways,27 they have been found to yield room-temperature folding pathways consistent with experimental measurements.26 Indeed, a number of interesting observations have emerged from MD unfolding simulations of many small globular proteins.17-25 Ideally, room-temperature folding simulations would be used to study the coupling between binding and folding in the MDM2N-p53 complex. However, it is impossible to accumulate long enough trajectories to draw any meaningful conclusions. Therefore, unfolding simulations at high temperature have been used in the current study.
In the following, we will discuss the unfolding kinetics, unfolding landscapes, transition states, unfolded states, and folded states for both bound and apo-MDM2N to understand the influence of binding in the folding of MDM2N.
Results and Discussion
Unfolding kinetics
Native tertiary contacts (Qf) and native binding contacts (Qb) are used to monitor unfolding and unbinding kinetics. Time evolutions of Qb and Qf for bound MDM2N are shown inFigure 2. Overall, the tertiary unfolding and unbinding kinetics can be represented well by single exponential functions, indicating that they are first order kinetics in the NVT ensemble at 498K but with the room-temperature water density. The fitted kinetics data are shown in Table 1. Our kinetics analysis shows that the unbinding half-time is 0.21ns, and the unfolding half-time is 1.27ns, indicating that unbinding is much faster than tertiary unfolding. The time evolution of Qf for apo-MDM2N is also shown inFigure 2. It is found that tertiary unfolding of apo-MDM2N also obeys first order kinetics, with a half-time of 1.36ns, which is very similar to that of bound MDM2N.
Figure 2.

Kinetics fitting of Qb and Qf for bound and apo-MDM2N.
Table 1.
Unfolding kinetics constants. All curves are fitted by A exp(-t/τ)+B.
| τ (ns) | A | B | R2 | ||
|---|---|---|---|---|---|
| Bound MDM2 |
Qb | 0.21 | 0.56 | 0.0011 | 0.94 |
| Qf | 1.27 | 0.41 | 0.41 | 0.98 | |
| Helix I, II & IV | 3.58 | 0.36 | 0.53 | 0.86 | |
| Helix III & V | 1.70 | 0.29 | 0.29 | 0.67 | |
| Apo- MDM2 |
Qf | 1.36 | 0.42 | 0.38 | 0.98 |
| Helix I, II & IV | 2.36 | 0.51 | 0.49 | 0.90 | |
| Helix III | 0.34 | 0.56 | 0.25 | 0.86 |
Unfolding kinetics of all five helices is also analyzed and presented inFigure 3. It was found that the five helices can be grouped into two categories: stable helices: I, II & IV; and unstable helices: III & V. Time evolution curves for both stable and unstable helices in both bound and apo-MDM2N, respectively, are shown inFigure 4. Our analysis shows that helix unfolding also obeys first order kinetics under the high-temperature simulation condition. Unfolding half time is 1.70ns for unstable helices and 3.58ns for stable helices, respectively, in bound MDM2N. Unfolding half time is 2.36ns for stable helices and about 0.39ns for unstable helices (III only), respectively, in apo-MDM2N. Not surprisingly, helical unfolding is slower than tertiary unfolding and unbinding. This is consistent with other unfolding simulations of helical proteins, for example chymotrypsin inhibitor 2.28 Note also that the helical unfolding half times of the bound MDM2N are longer than those of apo-MDM2N, suggesting that binding to p53 stabilizes the helices in MDM2N.29 Finally, since the two short beta strands are too weak, they are not monitored during unfolding.
Figure 3.

Unfolding of five helices in bound MDM2N. H is fractional native helical content.
Figure 4.

Kinetics fitting for stable helices (I, II & IV) and unstable helices (III & V) or helix III for bound and apo-MDM2N, respectively.
Unfolding landscapes
To further understand the coupling between unfolding and unbinding, the unfolding landscape of bound MDM2N was analyzed with the progress variables Qf and Qb, as shown inFigure 5. The unfolding landscape shows that unbinding proceeds first while tertiary contacts are held stable. This is followed by tertiary unfolding. This is in agreement with the unfolding kinetics analysis for the bound MDM2N. Note also that even if the time scale of unbinding is much shorter than that of tertiary unfolding, there is no rapid transition between binding and unbinding during tertiary unfolding. This suggests the formation of binding interface depends on formation of overall tertiary contacts, different from the coupling between secondary unfolding and tertiary unfolding to be shown below.
Figure 5.

Unfolding landscapes with respect to Qb and Qf for bound MDM2N.
The coupling between secondary and tertiary unfolding is studied for both bound and apo- MDM2N, and is shown inFigure 6. Since the two short beta strands are too weak, only helical structures were monitored during unfolding. The coupling between stable helices and tertiary contacts in unfolding is shown inFigure 6A. It is found that Qf decreases first while stable helical content does not change. This is followed by simultaneous decrease of tertiary contacts and stable helical content. This suggests that the tertiary unfolding is followed by secondary and tertiary unfolding. This is also consistent with the above unfolding kinetics analysis. The coupling between unstable helical content and tertiary contacts is also monitored as shown inFigure 6B. We found that unstable helices (III and V) are in rapid transition between folding and unfolding during tertiary unfolding due to their fast folding/unfolding rates. This is different from binding, even if its time scale is similar to that of unstable helix in apo-MDM2N.
Figure 6.

Unfolding landscapes with H and Qf for bound and apo-MDM2N, respectively.
Transition state
Our kinetics analysis shows that tertiary unfolding of both bound and apo-MDM2N obey first order kinetics. This suggests that bound and apo-MDM2N unfold via a two-state process. Therefore, there is a transition state corresponds to the free energy maximum along each of their unfolding pathways. The structures at the free energy-maxima comprise the transition state ensemble (TSE). TSE structures can either fold or unfold, and the transition probability (P) will be 50%. We have scanned MD snapshots for TSE structures in all 10 unfolding trajectories for each of bound and apo-MDM2N, respectively.30 Transition probabilities versus candidate snapshot are shown inFigure 7. The transition probability curves are further fitted by the Boltzmann equation, P = 1/(1 + exp((t-τTS)/τtrans)),, where τTS is the time when P = 50% and τtrans sets the period when P is between 0.4 and 0.6.30-32 Our analysis yields 382 snapshots for bound MDM2N TSE, and 271 snapshots for apo-MDM2N TSE, respectively.
Figure 7.

A representative transition probability P calculated at 498K for the F⇔U transition for snapshot in the transition region for one of trajectories for bound and apo-MDM2N, respectively. The red line is the fit to P = 1/{1+ exp[(τ-τTS)/τtrans]}. See text for more information on the fit.
Figure 8 illustrates the average structures for all TSE snapshots for bound and apo-MDM2N, respectively. Apparently fromFigure 8, TSE of apo-MDM2N is less-structured than that of bound MDM2N. Indeed, there are 50% native hydrophobic contacts, 70.5% stable helical content, and 23.9% unstable native helical content for apo-MDM2N TSE, while there are 57% native hydrophobic contacts, 84.6% stable native helical content, and 37.0% unstable native helical content for bound MDM2N. Overall, it can be concluded that the TSE of bound MDM2N is more native-like than that of apo-MDM2N. This indicates that the folding activation free energy for bound MDM2N is probably smaller than that for apo-MDM2N, leading to a relatively faster folding rate for bound MDM2N. Combining with the above analysis that the unfolding rates for bound and apo-MDM2N are virtually the same, this leads to the conclusion that bound MDM2N is more stable than apo-MDM2N, based on the following relationship for two-state folding systems,33 K=kf/ku, where K is folding equilibrium constant, kf and ku are folding and unfolding rates, respectively. This conclusion on the relative stability between bound and apo-MDM2N is consistent with the previous experimental observation.9
Figure 8.

Average TSE structures for bound and apo-MDM2N, respectively.
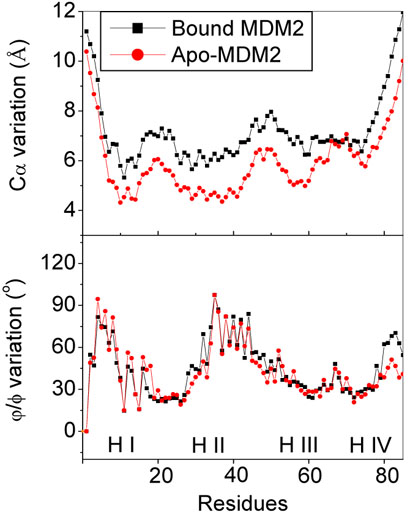
Figure 9 illustrates structural variations of TSE structures for bound and apo-MDM2N, respectively. The Cα fluctuation of bound MDM2N is larger than that of apo-MDM2N, suggesting that bound MDM2N is more heterogeneous than that of apo-MDM2N at the transition state. Thus TSE for bound MDM2N is more native-like and more heterogeneous than that for apo-MDM2N. However, the Φ/ψ fluctuation of bound MDM2N is similar to that of apo-MDM2N: there are three stable helices with low fluctuation in both states.
Figure 9.

Ca and Ψ/Φ variations at TSE for bound and apo-MDM2N, respectively.
Finally, all TSE snapshots were used to predict Φ-values of bound and apo-MDM2N as shown inFigure 10. The sequence distribution of Φ-values suggests that the three stable helices identified in the above structural variation analysis (Figure 9) are more native-like than other regions for both bound and apo-MDM2N. Within the three stable helices, the F-values of helix II for bound MDM2N are larger than those of apo-MDM2N. However the Φ-values of helix I and IV for bound MDM2N are smaller than those of apo-MDM2N.
Figure 10.

Predicted Φ-values for bound and apo-MDM2N, respectively.
Unfolded state
All unfolding simulations eventually reach the unfolded equilibrium state under the high-temperature unfolding condition. For the unfolded state of bound-MDM2N, there are 41.2% native hydrophobic contacts, 67.8% stable helical content, and 36.5% unstable helical content remaining. Worth noting is the fact that the hydrophobic intra-helix contacts on the unstable helix III all disappear. There is still a well-defined hydrophobic cluster among the three stable helices. This is very different from that of the apo-MDM2N, for which the hydrophobic contacts are divided into two clusters. One is located between helix I and II, the other is on helix IV. There are 35.3% native hydrophobic contacts, 59.6% stable helical content, and 41.5% unstable helical content remaining.
Conformational fluctuation was also analyzed using structural variation from the average structures for the unfolded state (Figure 11). The Cα fluctuation of bound MDM2N is larger than that of apo-MDM2N, indicating that bound molecules are more heterogeneous. This is similar to the transition state structures analyzed above. Also similar to the transition state, there is little difference in the Φ/ψ fluctuation between bound and apo-MDM2N.
Figure 11.
Cα and Ψ/Φ variations at unfolded state for bound and apo-MDM2N, respectively.
Folded state
As a reference for the above unfolding simulations and to further compare with experiment by structures and dynamics, 10 trajectories of 10.0 ns each were simulated at 298 K to analyze the folded state of apo-MDM2N, apo-p53, and their complex, respectively. Here, the structural influence of p53 binding on the folded MDM2N is first analyzed. It has been observed in experiment that MDM2N must undergo an expansion upon p53 binding, achieved through a rearrangement and outward expansion of the helices surrounding the binding cleft.9 To make the statement quantitative for easy comparison, the distance between the centers of helix II and IV at the cleft opening in the experimental structures is measured and is found to increase by 0.5Å upon p53 binding.9 In simulation, the average distance between the centers of the same helices increases by about 0.7Å upon p53 binding, in qualitative agreement with experiment. In addition, the distance between the centers of helix I and III at the cleft bottom in the experimental structures increases by 0.8 Å upon p53 binding. In simulation, the average distance between the centers of the same helices increases by 0.5Å, also in qualitative agreement with experiment.9
To study the influence of p53 binding on the dynamics of the folded MDM2N, Cα and Φ/ψ variations for bound and apo-MDM2N are analyzed and shown inFigure 12. The Cα variation of bound MDM2N is smaller than that of apo-MDM2N, especially in the loop connecting helix II and III, and the loop connecting helix III and IV at the p53 binding site. This suggests that bound MDM2N become less flexible and more stable upon p53 binding, consistent with experiment.9 The Φ/ψ variation of bound MDM2N is similar to that of apo-MDM2N, suggesting that secondary structure stabilities have no significant change upon p53 binding. Indeed, helices I, III and IV are already very stable in apo-MDM2N. Helix II undergoes large fluctuating motions in both bound and apo-MDM2N as observed in experiment.9 Main-chain based clustering analysis is also performed to investigate conformational fluctuation and stability in bound and apo-MDM2N. There are 9 main-chain clusters for bound MDM2N and 16 main-chain clusters for apo- MDM2N. This is also consistent with the experimental observation that bound-MDM2N is more rigid and less disordered.9
Figure 12.

Cα and Ψ/Φ variations at folded state for bound and apo-MDM2N, respectively.
To understand the causes for binding induced change in the folded state, interactions between p53 and MDM2N were analyzed. All possible hydrophobic and hydrogen-bonding contacts in the crystal structure were identified with Ligplot,34 as shown inFigure 13. The populations of eight hydrophobic contacts in simulation are shown inFigure 14A. Five stable hydrophobic interactions can be found: Phe19/Ile61, Trp23/Ile61, Leu22/Val93, Phe19/Met62, and Phe19/Val75, with populations higher than 60%. The other three hydrophobic interactions are rather unstable. The structural analysis by Kussie et al shows that Phe19 and Trp23 are in van der Waals contact with Ile61.3 Besides hydrophobic interactions, four possible hydrogen bonds were also identified with Ligplot.34 Figure 14B shows their populations in simulation. However, only one stable hydrogen bond (Trp23/Leu54) exists, with population higher than 60%. There is also one marginally stable hydrogen bond (Phe19/Gln72) with population around 30%. The other two hydrogen bonds are very weak. This is consistent with the structural analysis by Kussie et al.3 Comparing hydrophobic and hydrogen-bonding interactions, hydrophobic interactions play a key role in stabilizing the protein-protein interface as in most protein-protein interactions.29 In summary, p53 binding introduced more hydrophobic contacts at the interface and within MDM2N which are responsible for the higher stability in MDM2N.
Figure 13.

Two-dimensional representation for the interactions between p53 and MDM2N.
Figure 14.

Interactions between p53 and MDM2N. A: hydrophobic contacts. 1 is for Phe19/Ile61, 2 for Trp23/Ile61, 3 for Leu22/Val93, 4 for Phe19/Met62, 5 for Phe19/Val75, 6 for Pro27/Tyr100, 7 for Trp23/Met62, and 8 for Pro27/Met50. B: Hydrogen bonds. 1 is for NE1(Trp23)/O(Leu54), 2 for N(Phe19)/OE1(Gln72), 3 for O(Asn29)/OH(Tyr100), and 4 for OD1(Asn29)/OG1(Thr26).
Unfolding pathways and likely folding pathways
Based on the unfolding kinetics, landscape analysis, and transition state analysis, unfolding pathways for bound MDM2N can now be constructed as shown inFigure 15. 1) At the unbinding half time, there are 23 out of 34 (folded state) native hydrophobic contacts within MDM2N. Most lost hydrophobic contacts are with Helix I. The native hydrophobic contacts between p53 and MDM2N also start to disappear: only 1 out of 5 exists. There are 90.1% stable helical content and 57.2% unstable helical content remaining. The two short beta strands have disappeared. 2) At the half time of tertiary unfolding, there are 20 native hydrophobic contacts within MDM2N. The hydrophobic core is located mostly among the stable helices. All native hydrophobic contacts between p53 (one of the unstable helix) and MDM2N have disappeared. There are 83.2% stable helical content and 48.4% unstable helical content remaining. 3) At the half time of unstable helix (III and V) unfolding, there are 19 native hydrophobic contacts, and they are located among the stable helices only. There are 82.4% native stable helical content and 47.7% unstable helical content remaining. 4) At the half time of stable helix (I, II and IV) unfolding, there are 16 native hydrophobic contacts among the three stable helices. The hydrophobic core is broken into two clusters, one centered on helix I, and the other between helix II and helix IV. There are 78.3% native stable helical content and 36.5% native unstable helical content remaining. The average time for visiting the transition state is between the half times of unstable helical unfolding and stable helical unfolding.
Figure 15.

Unfolding pathway of bound MDM2N. A: <0ns (F), B: 0.21ns (τQb), C: 1.27ns (τQf), D: 1.70ns (τH3/5), E: 3.58ns (τH1/2/4) and F: > 6ns (U).
Similarly, the unfolding pathway of apo-MDM2N is constructed and shown inFigure 16. 1) At the half time of unstable helix (III) unfolding, there are 21 out of 32 (folded state) native hydrophobic contacts. Most lost hydrophobic contacts are with helix II. There are 85.9% stable helical content and 42.4% unstable helical content remaining. 2) At the half time of tertiary unfolding, there are 16 native hydrophobic contacts. The hydrophobic core is located mostly among the stable helices. There are 82.0% stable helical content and 41.6% unstable helical content remaining. 3) At the half time of stable helix (I, II and IV) unfolding, there are 17 native hydrophobic contacts. The hydrophobic core among the stable helices has significantly unpacked into multiple clusters. There are 82.3% stable helical content and 21.6% unstable helical content remaining. The average time for visiting the transition state is between the half times of tertiary unfolding and stable helical unfolding.
Figure 16.

Unfolding pathway of apo-MDM2N. A: <0ns (F), B: 0.39ns (τH3), C: 1.36ns (τQf), D: 2.36ns (τH1/2/4) and E: > 6ns (U).
If we assume that folding is the reverse of unfolding, the proposed folding/binding pathway of bound MDM2N is stable helix (I, II and IV) folding, unstable helix (III and V) folding, tertiary folding, and finally p53 binding. The folding order for apo-MDM2N is stable helix (I, II and IV) folding, tertiary folding, and finally unstable helix (III) folding. The difference between the folding pathways of bound and apo-MDM2N is the reverse of unstable helix folding and tertiary folding, indicating that the unstable helix is stabilized by p53 binding in bound MDM2N. Note that the extra stability of helix III is offered by unspecific (nonnative) p53 binding contacts because specific (native) binding contacts only occur after tertiary folding.
Entropy effect in the binding/folding coupling
In the folded state, bound MDM2N is less heterogeneous than apo-MDM2N, indicating that the entropy decreases in the presence of p53. This results from specific binding interactions between MDM2N and p53. The strong and specific binding interactions make the specific binding favorable thermodynamically. In the unfolded state, however, there is no specific binding interaction between the two molecules. Nevertheless, bound MDM2N is more heterogeneous than that of apo-MDM2N, so that the entropy of increases in the presence of p53. Thus the nonspecific binding of the two molecules is also favorable thermodynamically.Figure 17 presents the thermodynamic circle of entropy changes between bound and apo-MDM2N and between the folded and unfolded states. Apparently, the entropic effect is highly unfavorable in the coupled folding and binding in the MDM2N-p53 complex. This unfavorable entropy effect partly weakens the contribution of hydrophobic interactions between p53 and MDM2N. Therefore bound MDM2N is only moderately more stable upon p53 binding as observed in both experiment and simulation.9
Figure 17.

Entropy effect in the folding/binding coupling between p53 and MDM2N.
Conclusion
We have performed explicit-solvent molecular dynamics simulations (MD) for both bound and apo-MDM2N to study the interdependence of binding and folding in the p53-MDM2N complex. Our folded state simulation shows that the MDM2N binding cleft has to expand upon p53 binding through a rearrangement of the surrounding helices, consistent with the experimental observation.9 Our folded state simulation further shows that bound-MDM2N is more rigid and less disordered, also in agreement with experimental structural comparison.9 Kinetics analysis of high-temperature MD simulations shows that both bound and apo-MDM2N unfold via a two-state process with very similar unfolding rates. Combining unfolding kinetics analysis with transition state analysis for bound and apo-MDM2N leads to the conclusion that bound MDM2N is more stable than apo-MDM2N, in agreement with the previous experimental observation on the relative stabilities between bound and apo-MDM2N.9 The entropic effect in the coupled folding and binding in the MDM2N-p53 complex is found to be highly unfavorable. The unfavorable entropy effect partly weakens the contribution of hydrophobic interactions between p53 and MDM2N upon the complex stability, resulting in only moderately more stable bound MDM2N as observed in both experiment and simulation.9
Both kinetics and free energy landscape analyses indicate that bound MDM2N unfolds in the order of p53 unbinding, tertiary unfolding, and finally secondary structure unfolding. Our data show that the unfolding pathways are different between bound and apo-MDM2N: the unfolding order of unstable helices and tertiary contacts is reversed.
Transition state analysis shows that the transition state of bound MDM2N is more native-like and more heterogeneous than that of apo-MDM2N. Finally we have predicted the Φ-values in both bound and apo-MDM2N. This experimentally testable prediction suggests that the stable helices (I, II and IV) are more native-like than other regions. Within the stable helices, helix II in bound MDM2N is more native-like than that in apo-MDM2N. However, helix I and IV in bound MDM2N are less native-like than those in apo-MDM2N.
Materials and Method
Room-temperature and high-temperature molecular dynamics simulations
The atomic coordinates of the MDM2N-p53 complex were obtained from the X-ray structure 1YCR.3 Hydrogen atoms were added using the LEAP module of AMBER8.35 Counter-ions were used to maintain system neutrality. All systems were solvated in a truncated octahedron box of TIP3P36 waters with a buffer of 10 Ǻ. Particle Mesh Ewald (PME)37 was employed to treat longrange electrostatic interactions with the default setting in AMBER8.35 A revised parm99 force field was used for intramolecular interactions.38,39 The SHAKE algorithm40 was used to constrain bonds involving hydrogen atoms. 1000-step steepest descent minimization was performed to relieve any structural clash in the solvated systems. This was followed by heating up and brief equilibration for 20 ps in the NVT ensemble at 298 K with SANDER of AMBER8. Langevin dynamics with a time step of 2fs was used in the heating and equilibration runs with a friction constant of 1ps−1.
To study the folded state of each solvated system, ten independent trajectories of 10.0 ns each in the NPT ensemble41 at 298K were then simulated with PMEMD of AMBER8. Here molecular dynamics with a time step of 2fs was used for all production dynamics runs. To study unfolding pathways of each solvated system, ten independent unfolding trajectories of 10ns each were performed in the NVT ensemble at 498K but with the water density at 298K (i.e. all hightemperature simulations were started from the end of the 10ns 298K trajectories). A total of 600ns trajectories were collected for three solvated systems (bound-MDM2N, apo-MDM2N, and p53) at both 298K and 498K, respectively, taking about 26,400 CPU hours on the in-house Xeon (3.0GHz) cluster.
Native contacts for the bound and apo-MDM2N were monitored to detect the beginning of unfolded state simulations. It was found that 6ns at 498K were needed to reach the equilibrium stage for both bound and apo-MDM2N, so that the first 6ns (a total of 60ns for each system) were used to study unfolding kinetics and the remaining 4ns (a total of 40ns for each system) were used for equilibrium simulations at unfolded state for each system. The p53 peptide is far less stable, it was found that only 2ns at 498K was enough to reach the unfolded state, so that the first 2ns (a total of 20ns) were used to study unfolding kinetics and the remaining 8ns (a total of 80ns) were used to study the unfolded equilibrium state.
Transition state simulations
According to the definition of transition state (TS), 40 test MD runs for each candidate snapshot were performed to calculate the transition probability (P).30-32 All test simulations have the same initial conformation for protein and solvent atoms, but differing initial velocities. Because transition state structures agree with experiment under varying simulation temperatures,28 TS simulations were done at 498K in order to accelerate simulated folding/unfolding rate. Each test trajectory is terminated when a conformation has reached the folded or unfolded state, as determined by Ca-RMSD. The folded state defines as the Ca-RMSD within 3.0Å from the average structure at folded state at 298K. Up to 1ns simulation at 498K was found to be sufficient for each test trajectory, i.e. P values for tested snapshots were no longer changing when longer trajectories were run.
Data Analysis
Tertiary contact assignment was handled with in-house software. Two non-adjacent residues are in contact when their Cα atoms are closer than 6.5 Å. Secondary structure assignment was performed with DSSP.42 All RMSD calculations were performed with PTRAJ in AMBER8.35 The unfolding kinetics was fitted in Origin 6.1. The unfolding landscapes were determined by calculating normalized probability from a histogram analysis.30 Here we used fraction of native tertiary contacts Qf, fraction of native binding contacts Qb, and fraction of native helical content H, to map the unfolding landscape. Representative structures at folding half times were used to construct unfolding pathways. Each representative structure is the closest snapshot to the average of all chosen snapshots at a given half time (within +/− its standard deviation).
Φ-values were computed with a strategy similar to those used in other studies:31,43,44 (equation) where NiTS is the number of native contacts of residue i at transition state, NiF and NiU is the number of native contacts of residue i at folded and unfolded states, respectively. As defined by Calfisch and coworkers, contacts were counted when the side chain heavy atoms of two nonadjacent residues are closer than 6 Å.31 This method has been validated in previous comparative studies of different proteins and found to yield Φ-values in good agreement with experiment.31,43,44
Supplementary Material
Acknowledgements
This work is supported in part by NIH (GM069620).
Footnotes
Supporting Information Available
Complete Ref. 35. This material is available free of charge via the Internet at http://pubs.acs.org.
References
- 1.Juven-Gershon T, Oren M. Mol Med. 1999;5:71–83. [PMC free article] [PubMed] [Google Scholar]
- 2.Oliner JD, Kinzler KW, Meltzer PS, George DL, Vogelstein B. Nature. 1992;358:80–83. doi: 10.1038/358080a0. [DOI] [PubMed] [Google Scholar]
- 3.Kussie PH, Gorina S, Marechal V, Elenbaas B, Moreau J, Levine AJ, Pavletich NP. Science. 1996;274:948–953. doi: 10.1126/science.274.5289.948. [DOI] [PubMed] [Google Scholar]
- 4.Momand J, Jung D, Wilczynski S, Niland J. Nucleic Acids Res. 1998;26:3453–3459. doi: 10.1093/nar/26.15.3453. [DOI] [PMC free article] [PubMed] [Google Scholar]
- 5.Vassilev LT, Vu BT, Graves B, Carvajal D, Podlaski F, Filipovic Z, Kong N, Kammlott U, Lukacs C, Klein C, Fotouhi N, Liu EA. Science. 2004;303:844–848. doi: 10.1126/science.1092472. [DOI] [PubMed] [Google Scholar]
- 6.Zhong H, Carlson HA. Proteins. 2005;58:222–234. doi: 10.1002/prot.20275. [DOI] [PubMed] [Google Scholar]
- 7.Bullock AN, Fersht AR. Nat Rev Cancer. 2001;1:68–76. doi: 10.1038/35094077. [DOI] [PubMed] [Google Scholar]
- 8.Zhang R, Mayhood T, Lipari P, Wang Y, Durkin J, Syto R, Gesell J, McNemar C, Windsor W. Anal Biochem. 2004;331:138–146. doi: 10.1016/j.ab.2004.03.009. [DOI] [PubMed] [Google Scholar]
- 9.Uhrinova S, Uhrin D, Powers H, Watt K, Zheleva D, Fischer P, McInnes C, Barlow PN. J Mol Biol. 2005;350:587–598. doi: 10.1016/j.jmb.2005.05.010. [DOI] [PubMed] [Google Scholar]
- 10.Schon O, Friedler A, Bycroft M, Freund SM, Fersht AR. J Mol Biol. 2002;323:491–501. doi: 10.1016/s0022-2836(02)00852-5. [DOI] [PubMed] [Google Scholar]
- 11.Henkels CH, Kurz JC, Fierke CA, Oas TG. Biochemistry. 2001;40:2777–2789. doi: 10.1021/bi002078y. [DOI] [PubMed] [Google Scholar]
- 12.Henkels CH, Oas TG. J Am Chem Soc. 2006;128:7772–7781. doi: 10.1021/ja057279+. [DOI] [PubMed] [Google Scholar]
- 13.Williams S, Causgrove TP, Gilmanshin R, Fang KS, Callender RH, Woodruff WH, Dyer RB. Biochemistry. 1996;35:691–697. doi: 10.1021/bi952217p. [DOI] [PubMed] [Google Scholar]
- 14.Munoz V, Thompson PA, Hofrichter J, Eaton WA. Nature. 1997;390:196–199. doi: 10.1038/36626. [DOI] [PubMed] [Google Scholar]
- 15.Lapidus LJ, Eaton WA, Hofrichter J. Proc Natl Acad Sci U S A. 2000;97:7220–7225. doi: 10.1073/pnas.97.13.7220. [DOI] [PMC free article] [PubMed] [Google Scholar]
- 16.Duan Y, Kollman PA. Science. 1998;282:740–744. doi: 10.1126/science.282.5389.740. [DOI] [PubMed] [Google Scholar]
- 17.Caflisch A, Karplus M. Proc Natl Acad Sci U S A. 1994;91:1746–1750. doi: 10.1073/pnas.91.5.1746. [DOI] [PMC free article] [PubMed] [Google Scholar]
- 18.Caflisch A, Karplus M. J Mol Biol. 1995;252:672–708. doi: 10.1006/jmbi.1995.0528. [DOI] [PubMed] [Google Scholar]
- 19.Daggett V, Li AJ, Itzhaki LS, Otzen DE, Fersht AR. J Mol Biol. 1996;257:430–440. doi: 10.1006/jmbi.1996.0173. [DOI] [PubMed] [Google Scholar]
- 20.Ladurner AG, Itzhaki LS, Daggett V, Fersht AR. Proc Natl Acad Sci U S A. 1998;95:8473–8478. doi: 10.1073/pnas.95.15.8473. [DOI] [PMC free article] [PubMed] [Google Scholar]
- 21.Tsai J, Levitt M, Baker D. J Mol Biol. 1999;291:215–225. doi: 10.1006/jmbi.1999.2949. [DOI] [PubMed] [Google Scholar]
- 22.Mayor U, Johnson CM, Daggett V, Fersht AR. Proc Natl Acad Sci U S A. 2000;97:13518–13522. doi: 10.1073/pnas.250473497. [DOI] [PMC free article] [PubMed] [Google Scholar]
- 23.Gsponer J, Caflisch A. J Mol Biol. 2001;309:285–298. doi: 10.1006/jmbi.2001.4552. [DOI] [PubMed] [Google Scholar]
- 24.Mayor U, Guydosh NR, Johnson CM, Grossmann JG, Sato S, Jas GS, Freund SMV, Alonso DOV, Daggett V, Fersht AR. Nature. 2003;421:863–867. doi: 10.1038/nature01428. [DOI] [PubMed] [Google Scholar]
- 25.Scott KA, Randles LG, Moran SJ, Daggett V, Clarke J. J Mol Biol. 2006;359:159–173. doi: 10.1016/j.jmb.2006.03.011. [DOI] [PubMed] [Google Scholar]
- 26.Fersht AR, Daggett V. Cell. 2002;108:573–582. doi: 10.1016/s0092-8674(02)00620-7. [DOI] [PubMed] [Google Scholar]
- 27.Dinner AR, Karplus M. J Mol Biol. 1999;292:403–419. doi: 10.1006/jmbi.1999.3051. [DOI] [PubMed] [Google Scholar]
- 28.Day R, Daggett V. Protein Sci. 2005;14:1242–1252. doi: 10.1110/ps.041226005. [DOI] [PMC free article] [PubMed] [Google Scholar]
- 29.Petsko GA, Ringe D. Protein Structure and Function. New Science Press; London: 2003. [Google Scholar]
- 30.Pande VS, Rokhsar DS. Proc Natl Acad Sci U S A. 1999;96:9062–9067. doi: 10.1073/pnas.96.16.9062. [DOI] [PMC free article] [PubMed] [Google Scholar]
- 31.Gsponer J, Caflisch A. Proc Natl Acad Sci U S A. 2002;99:6719–6724. doi: 10.1073/pnas.092686399. [DOI] [PMC free article] [PubMed] [Google Scholar]
- 32.Chong LT, Snow CD, Rhee YM, Pande VS. J Mol Biol. 2005;345:869–878. doi: 10.1016/j.jmb.2004.10.083. [DOI] [PubMed] [Google Scholar]
- 33.Nolting B. Protein Folding Kinetics, Biophysical Methods. Springer; Berlin: 1999. [Google Scholar]
- 34.Wallace AC, Laskowski RA, Thornton JM. Protein Eng. 1995;8:127–134. doi: 10.1093/protein/8.2.127. [DOI] [PubMed] [Google Scholar]
- 35.Case DA, et al. University of California; San Francisco: 2004. [Google Scholar]
- 36.Jorgensen WL, Chandrasekhar J, Madura JD, Impey RW, Klein ML. J. Chem. Phys. 1983;79:926–935. [Google Scholar]
- 37.Darden T, York D, Pedersen L. J. Chem. Phys. 1993;98:10089–10092. [Google Scholar]
- 38.Wang JM, Cieplak P, Kollman PA. J Comput Chem. 2000;21:1049–1074. [Google Scholar]
- 39.Lwin TZ, Lu Q, Luo R. Protein Sci. 2006;15:2642–2655. doi: 10.1110/ps.062438006. [DOI] [PMC free article] [PubMed] [Google Scholar]
- 40.Rychaert JP, Ciccotti G, Berendsen HJC. Comput. Phys. 1977;23:327–341. [Google Scholar]
- 41.Berendsen HJC, Postma JPM, van Gunsteren WF, DiNola A, Haak JR. J. Chem. Phys. 1984;81:3684–3690. [Google Scholar]
- 42.Kabsch WS, C. Biopolymers. 1983;22:2577–2637. doi: 10.1002/bip.360221211. [DOI] [PubMed] [Google Scholar]
- 43.Li A, Daggett V. Proc Natl Acad Sci U S A. 1994;91:10430–10434. doi: 10.1073/pnas.91.22.10430. [DOI] [PMC free article] [PubMed] [Google Scholar]
- 44.Vendruscolo M, Paci E, Dobson CM, Karplus M. Nature. 2001;409:641–645. doi: 10.1038/35054591. [DOI] [PubMed] [Google Scholar]
Associated Data
This section collects any data citations, data availability statements, or supplementary materials included in this article.