

Abstract
A549 cells were briefly exposed to Thioglo −1 which converts thiols to fluorescent adducts. The fluorescent cells were exposed to short (50 − 300 ms) electric field pulses (500 V across a 15 cm capillary) created at the tip of an electrolyte - filled capillary. Fluorescence microscopy revealed varying degrees of cell permeabilization depending on conditions. Longer pulses and shorter cell - capillary tip distance led to a greater decrease in a cell's fluorescence. Live/dead (calcein AM and propidium iodide) testing revealed that a certain fraction of cells died. Longer pulses and shorter cell – capillary tip distances were more deadly. An optimum condition exists at a cell – capillary tip distance of 3.5 μm − 4.5 μm and a pulse duration of 120 ms - 150 ms. At these conditions > 90 % of the cells are permeabilized and 80 − 90% survive.
INTRODUCTION
Electroporation uses electric field pulses to temporarily permeabilize the cell membrane 1-3. When the membrane potential reaches a critical value which is around 0.2 − 1.5 V 4 dielectric membrane breakdown occurs resulting in the formation of transient pores5-7. Electroporation is most frequently used to introduce charged, polar molecules such as DNA, dyes, drugs or proteins into the interior of the cell. This technique is now used in many fields such as in cellular biology and biotechnology for gene transfer8-11, and in medical applications for gene therapy12, 13, cancer chemotherapy14, and transdermal drug delivery15, 16.
Traditionally, electroporation has been done in batch or bulk mode on cells in suspension4, 6, 17-22. In the bulk mode, a whole population of cells is subjected to homogeneous fields of a few kilovolts per centimeter which results in permeabilization of numerous cells at the same time. Data collected from such bulk electroporation gives a statistical distribution of cellular states23. In other areas of research, single cell analysis is now gaining considerable significance as it allows an understanding of complex cellular heterogeneity within a population of cells. Data collected from single cells generates unique information about cell - to - cell variations and avoids information loss due to averaging across the population of cells24-27.
Lundqvist et al. (1998) developed the first single cell electroporation method by using carbon fiber microelectrodes28 to produce highly localized fields on single adherent cells in confluent cultures. Since then, other single cell electroporation techniques have been developed such as electrolyte-filled capillaries29 and micropipettes30, and microfabricated chip systems31-34. These techniques require either an isolation of a cell or a fine focus of the electric field to target a particular cell35. A few other high resolution techniques such as optoporation36, 37, micro-electroinjection38, and microinjection39 exist to control and manipulate the biochemical machinery of single cells.
The efficiency of electroporation for a given molecule depends on controlling and optimizing the parameters that lead to cell permeabilization. For example, electric field parameters such as pulse amplitude, pulse duration, number of delivered pulses, and conditions such as temperature, osmotic pressure, and the presence of co-factors such as facilitators of nuclear transfer, edge-actants and cellular characteristics all play a part in electroporation 40-45. With proper values of electric field parameters, electroporation can be made reversible so that the cells can return to their normal physiological state following permeabilization. However, if these experimental conditions exceed certain values, e.g., amplitude of pulses is too high or pulse duration is too long, cells can be irreversibly electroporated which leads to cell death46.
Ultimately, the influence of the electrical parameters is on the transmembrane potential. The transmembrane potential is easily predicted for spherical cells in the homogeneous electric field of bulk electroporation4, 47. Electrolyte filled capillaries produce highly focused and inhomogeneous electric fields. The shape of the electric field in solution depends on the geometry. Olofsson et al. has developed a method to create highly focused electric field gradients in the washer-shaped layer of solution existing between the wall of a capillary's butt end and the surface of the cell-containing dish 48. By using finite element method simulations, they demonstrated that the field and its distribution could be controlled by varying the inner and outer diameters of the capillary, the height between the capillary end and the surface, or the applied current density. For the pulled capillaries used in this work, in which the capillary-substrate distance is greater than the lumen opening, and in which the tip is cone-like, the same sort of distribution does not exist. Rather, the field decays away from the tip with a characteristic distance related to the diameter of the lumen29. In this technique, therefore, the cell – tip distance is a simple way to control the field at the membrane. The electrolyte-filled capillary is fairly resistive, thus the electrical response time is not as short as in bulk electroporation, so another important parameter, pulse length, needs to be longer than is normally used in bulk electroporation. Therefore, the range of useful pulse lengths is somewhat different than the range used in bulk electroporation. For these reasons, we have explored the influence of pulse length and tip – cell distance on electroporation and cell death.
In this study, we developed an assay based on diffusion of fluorescently labeled thiol adducts from preloaded cells through pores induced by transient electric fields. The diffusion of these fluorescently labeled thiol adducts was monitored in real time. In contrast to assays that rely on internalization of dyes, the escape of dyes allows for direct quantification of translocated species by fluorescence microscopy. Direct observation has many advantages, only some of which are realized in this report, namely: observation of mass transport dynamics both inside and outside the cell, immediate feedback to the experimenter on success/failure, it is less demanding than using, e.g., transfection in that there is no need to keep track of where individual cells are on a plate (though assay of live/dead requires this). Furthermore, watching the effect of electroporation in real time does not preclude transfection being done at the same time. Single-cell electroporation was performed using small-sized electrolyte-filled capillaries. Due to the small size of these electrolyte-filled capillaries, high spatial resolution could be achieved with this technique. Furthermore, variability in electroporation led to cell death to some extent in almost all experimental conditions. However, in spite of variability, there are optimal conditions that lead to cell permeabilization and cell survivability.
EXPERIMENTAL SECTION
Materials
The chemicals used for buffer preparations were all analytical grade and were purchased from Sigma (St. Louis, MO). Thioglo-1 was purchased from Covalent Associates (Woburn, MA). Propidium iodide and calcein AM were purchased from Invitogen/Molecular probes (Eugene, OR). A549 cell lines were obtained from American Type Culture Association (Manassas, VA). Basal medium Eagle (BME), Trypsin-EDTA, fetal bovine serum (FBS), L-glutamine and penicillin were all obtained from Gibco-BRL (Carlsbad, CA). Milli-Q (Millipore Synthesis A 10, Billerica, MA) water was used. Intracellular buffer consisted of NaCl, 5 mM; KCl, 140 mM; MgCl2, 1.5 mM; D-glucose, 10 mM; HEPES, 20 mM; pH adjusted to 7.4.
Cell culture
Basal medium Eagle, supplemented with 10 % fetal bovine serum, and 1 % antibiotic was used to culture human lung cancer A549 cells. Cells were grown in 75 ml cell culture flasks in a CO2 cell culture incubator (HERA cell incubator, Newtown, CT) at 37° C and 5 % CO2 to about 80 % confluency. Before the experiments, cells were plated on 35 mm glass bottom cell-culture dishes (MatTek Corporation, Ashland, MA) and were grown for 1−3 days. Experiments were performed on the 2nd and 3rd day following the cell plating.
Cell staining
Prior to the experiments, the cells were stained with the dye Thioglo-1 (2 μM in intracellular buffer) for 30 seconds at room temperature. Thioglo-1 is a cell permeable maleimide-based reagent which gives a highly fluorescent product upon its reaction with active –SH groups in proteins, enzymes, and small peptides49, 50. To remove excess uncaptured dye, the cells were washed in intracellular buffer. Cells were bathed in the buffer and mounted on the cell chamber (DH 35i culture dish incubator, Warner Instruments, Holliston, MA) and transferred to the stage of the microscope.
Probe preparation
To perform electroporation experiments, fused-silica capillaries from Polymicro Technology (Phoenix, AZ) were used as a probe. The dimensions of the fused-silica capillary were: outer diameter (o.d.): 367 μm, inner diameter (i.d.): 100 μm. Capillaries were pulled at one end by using a CO2 laser puller (Sutter Instruments Co. P-2000, Novato, CA). Before pulling the capillaries, 40 cm long capillaries were flushed with filtered Milli-Q water followed by burning of a 2 cm center section of the capillary to remove the protective coating. These capillaries were pulled using a one line program i.e. Heat: 260; Filament: 0; Velocity: 30; Delay: 128; Pull: 0. This one line program created reproducible capillaries with a short pulled tip with an inner diameter of 5 μm. The final length of the capillaries was 15 cm. Before experiments, capillaries were filled with the intracellular buffer.
Electroporation Setup
Single cell electroporation was performed using the electrolyte filled fused-silica capillaries. The experimental setup is depicted in Figure 1. A high-graduation micromanipulator (Narishige, NMN-21, Tokyo, Japan) was used to position the capillary close to the cell. The capillary was first positioned at about a 45° angle with respect to the cell dish normal a few micrometers above the surface (h=5 μm) A single fluorescent cell was brought into focus by observing the cells under the microscope. The capillary tip was placed at a desired distance from the cell. The observed distance between the capillary tip and the cell (dm) was the projection of the capillary image in the horizontal imaging plane (cell dish surface). These distances (dm) were 2.0 μm, 3.5 μm, 5.0 μm, 7.0 μm, and 10.0 μm. The actual tip-cell distances are somewhat longer. The other end of the capillary was placed in a vial filled with intracellular buffer. The height of the vial was adjusted to avoid siphoning of the solution. A platinum electrode placed in this vial was connected to the electroporator (ECM 830, BTX Instruments, San Diego, CA) and the electrical circuit was completed with a grounded platinum electrode placed in the cell dish.
Figure 1.

Schematic picture of the experimental setup. (A) Cultured cells were mounted in a chamber on the microscope stage. The tapered outlet end of the capillary was positioned close to a fluorescent cell with the help of a micromanipulator. The inlet end of the capillary was placed in a buffer-filled vial. The setup was connected to a high voltage power supply. (B) Single pulse of varying pulse durations (50 ms −300 ms) were applied at 500 V. This resulted in the release of fluorescent thiols from the cell interior.
Fluorescence Imaging
Cells were observed using an inverted microscope (Olympus, IX 71, Melville, NY) with the Olympus 40 × 1.3 NA oil immersion objective. The HBO 100 W mercury lamp in the microscope was used as the excitation source. For Thioglo-1, an Omega fluorescence cube (especially built, Omega, Brattleboro, VT) was used with filters for excitation at 378 nm and emission at 480 nm. For live/dead imaging, DA/FI/TX-3X-A, a triple band pinkel filter set from Semrock (Rochester, NY) was used (Exciter 1: 387 ≤ λex, Exciter 2: 494≤ λex, Exciter 3: 572 ≤ λex, Emission: 457, 530, 628 ≤ λem ) . A 12 bit digital output charged couple device (CCD) camera (Hamamatsu, ORCA-285, Bridgewater, NJ) imaged cells. The image collection frequency was one frame per second. The gain and exposure times were set manually. Image processing was performed by the image acquisition software from Compix (Simple PCI). All the data were corrected for bleaching by extrapolating the first 25 points (time before pulse was applied) for each cell into a straight line and adding to the data, at each time point, the difference between the baseline of the cell and the extrapolated line.
Electroporation
Cells were exposed to single pulses of 500 V of various pulse durations ranging from 50 ms-300 ms. This will be referred as ‘pulsing’ of the cells. The pulse shape was monitored by differentially connecting a high voltage differential probe (Tektronix, P-5205, Richardson, TX) and a 2 channel digital oscilloscope (Tektronix, P-3052, Richardson, TX) to the output of the power supply. For all these pulsing conditions the distance between the tip of the capillary and the cell varied from 5.4 μm-11 μm. The pulse was applied at 25.0 seconds from the start of the acquisition. Diffusive loss of fluorescent thiol adducts from the cell interior was determined quantitatively with Simple PCI software (Compix). The smallest distinguishable intensity change was about 4% of the signal. This was chosen as a threshold value for determination of electroporation success. For a cell to be considered permeabilized it had to loose 4% or more of its fluorescence intensity within 90 s of electroporation.
Cell Viability Assay
Following electroporation experiments, the buffer in the cell dish was replaced by 2 mL of fresh growth medium. The cells were allowed 5−6 hours of recovery in the 37° C incubator with 5% CO2. Following the recovery period, the growth medium was replaced by 2 μM calcein AM and 2 μM propidium iodide. The cells were incubated for 30 min at 37° C and washed in intracellular buffer. Fluorescence microscopy was used for cell imaging. Cell survival percentage was calculated for each experimental condition based on this live/dead assay. It is important to note that a a measurement of cell viability was made on each cell that was electroporated.
RESULTS
Visualization of electroporation
Table 1 summarizes the total number of cells tested in different cell dishes at each condition of pulse duration and cell-capillary tip distance. Figure 2A is an overlay of fluorescence and differential interference contrast image. The scale bar shows that the capillary is positioned at a distance dm=5 μm from the cell. This cell was pulsed for 200 ms. A sequence of fluorescence micrographs obtained before and after the application of the pulse can be seen in Figure 2B. The images demonstrate that the cell becomes darker with time due to the release of fluorescent thiol adducts from the cell interior to the surrounding medium through the nano-scale pores4 formed upon electroporation. Figure 2D illustrates analysis of the change in average fluorescence intensity with time for the region selected inside the cell (Figure 2C, region 1). The analysis shows that application of the pulse results in a decrease in fluorescence intensity inside the cell.
Table 1.
Number of cells (n) and separate cultures (m) used
| |
Distance between cell and the capillary tip (μm) |
||||
|---|---|---|---|---|---|
| Pulse Duration (ms) |
2.0 |
3.5 |
5.0 |
7.0 |
10.0 |
| 50 |
n=18 | n=15 | n=15 | n=15 | n=15 |
|
m=3 |
m=2 |
m=2 |
m=3 |
m=2 |
|
| 100 |
n=23 | n=20 | n=36 | n=15 | n=15 |
|
m=3 |
m=2 |
m=4 |
m=2 |
m=2 |
|
| 200 |
n=18 | n=15 | n=20 | n=15 | n=15 |
|
m=2 |
m=2 |
m=2 |
m=2 |
m=2 |
|
| 300 | n=15 | n=16 | n=22 | n=15 | n=15 |
| m=2 | m=2 | m=3 | m=2 | m=2 | |
Figure 2.
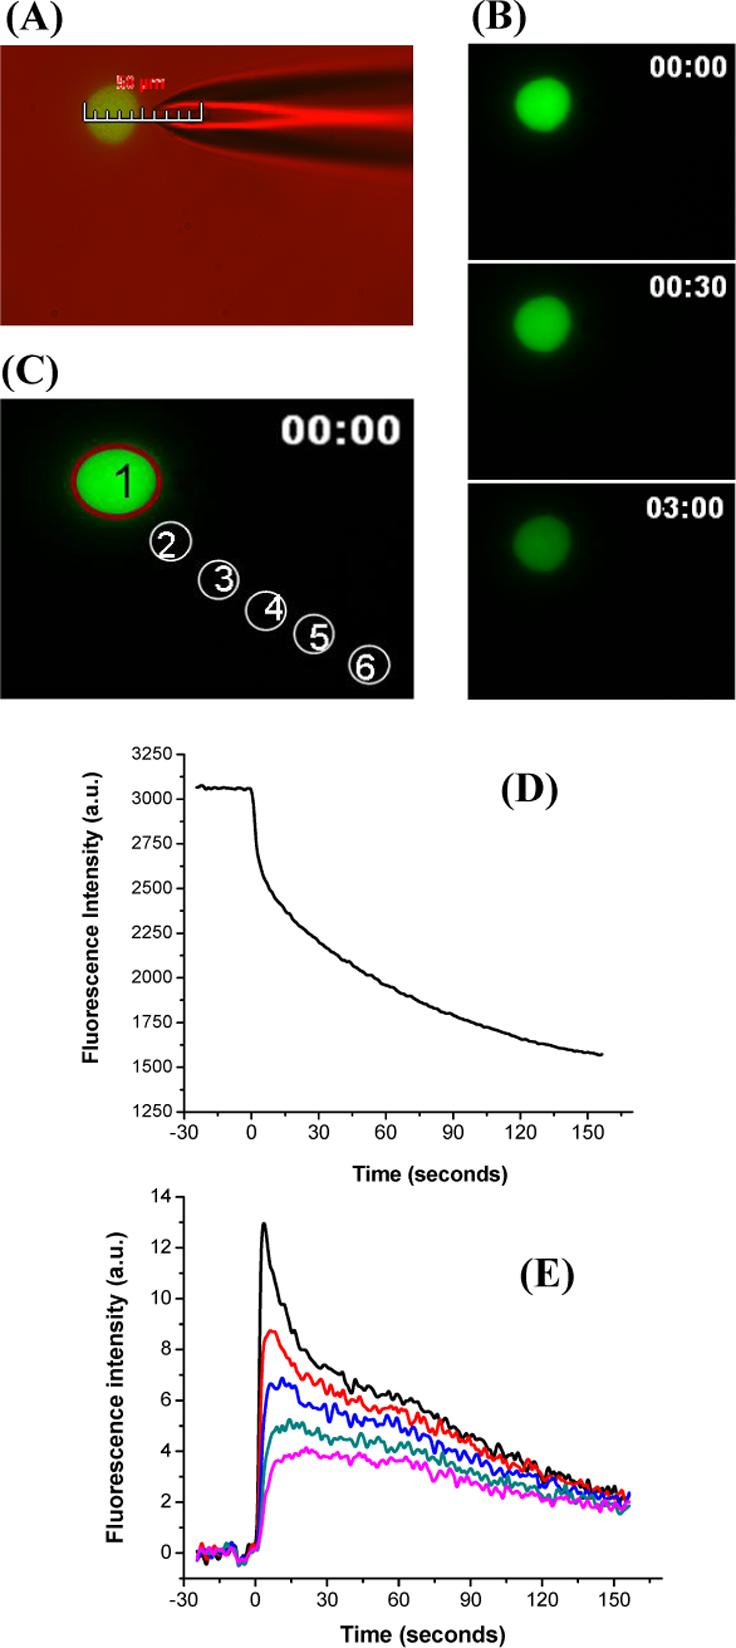
Visualization of single cell electroporation. Plated cells were incubated with 2 μM Thioglo-1 in the intracellular buffer. A single pulse of 200 ms at a cell-capillary tip distance 5.0 μm was applied at 500 V. Images were collected at a frequency of one frame per second. (A) Photomicrograph produced by an overlay of fluorescence and differential interference contrast image. The image shows the placement of the capillary at a distance of 5 μm from the cell. (B) Fluorescence images before pulsation (0 s), and after pulsation (30 s and 3 min from the start of acquisition). (D) Change in average fluorescence intensity for region 1 (C) against time. (E) Change in average fluorescence intensity for regions 2−6 (C) outside the cell against time. All the data were corrected for bleaching.
Figure 2E is a plot of change with time of the average fluorescence intensity for the five regions outside the cell (Figure 2C, regions 2 to 6). The plot demonstrates that at the time of application of the pulse, region 2, which is closest to the cell, shows a sharp increase in fluorescence intensity followed by a gradual decrease. Regions 3 to 6 show a delay in the change of the fluorescence intensity, the delay increasing with the distance from the cell. Furthermore, peak of the fluorescence intensity decreases as the distance from the cell increases. These results are consistent with the previous graphs that fluorescent thiol adducts are being released upon permeabilization of the cell membrane and rapidly diffusing away from the cell into the surrounding medium.
Spatial resolution
Spatial resolution, or the ability to permeabilize selectively a targeted cell without affecting neighboring cells, can be demonstrated by placing the electrolyte-filled capillary closer to one cell than the others in a group. Figure 3A shows two adjacent cells before and after the application of the pulse. In this example, the distance between cells is 10 μm, the probe is 2.0 μm away from cell A (about 24 μm from cell B), and a 200 ms pulse was applied. Upon application of the pulse, Cell A becomes darker as is evidenced by micrographs at 30 s and 2 min. On the other hand, no apparent change in fluorescence intensity other than from photobleaching is seen for cell B. Measurement of average fluorescence intensity presented in Figure 3B supports these observations.
Figure 3.

High spatial resolution achieved with single cell electroporation. Plated cells were incubated with 2 μM Thioglo-1 in the intracellular buffer. A single pulse of 200 ms at a cell-capillary tip distance of 2.0 μm was applied at 500 V. Images were collected at a frequency of one frame per second. (A) Fluorescence micrograph of 2 fluorescent cells ∼ 10 μm from each other. The arrow shows the approximate position of the capillary. The images were taken before pulsation (0 s), and after pulsation (30 s, and 2 min after the start of the acquisition). (C) Normalized average fluorescence intensity for cells A and B (B) against time. All the data were corrected for bleaching.
Cell-capillary tip distance
Experiments were carried out by controlling the distance between the cell and the capillary tip. Figure 4A shows change in the average fluorescence intensity with time for all cells pulsed for 200 ms, and cell-capillary tip distance ranging from 2.0 μm to 10 μm. As the cell-to-tip distance increases, the fluorescence decreases to a smaller degree suggesting less permeabilization.
Figure 4.

Effect of cell-capillary tip distance and pulse duration. (A) Average fluorescence intensity (normalized) vs. time plotted for all cells electroporated with a single pulse of 200 ms and cell-capillary tip distance of 2.0 μm − 10.0 μm at 500 V. The pink, green, blue, red and black curves correspond to 10.0, 7.0, 5.0, 3.5, and 2.0 μm cell-capillary tip distances respectively. (B) Average fluorescence intensity (normalized) vs. time plotted for all cell electroporated with a single pulse of varying pulse durations (50 ms to 300 ms), and cell-capillary tip distance of 3.5 μm at 500 V. Black, red, blue, and green curves correspond to 50, 100, 200, and 300 ms pulse durations respectively. All the data were corrected for bleaching.
Pulse duration
Electroporation experiments were also conducted at various pulse durations (50 ms to 300 ms). Figure 4B shows the change in average fluorescence intensity with time for all cells pulsed for various durations and at a constant cell-capillary tip distance of 3.5 μm. The data show that longer pulse duration results in a larger change in the fluorescence intensity thereby implying greater permeabilization of the cell membrane.
Contour Plots
Figure 5 is a contour plot of cell survival percentage as a function of pulse duration and cell-capillary tip distance. In this contour plot, lighter shades delineate areas with a larger fraction of live cells whereas darker shades represent a larger fraction of dead cells. Not only is it important to know what fraction of cells survived in these experimental conditions, but also the fraction of cells that were electroporated. A contour plot of the fraction of cells electroporated is superimposed on the contour plot of cell survivability in Figure 5. From this figure it can be seen that both the fraction of electroporated cells and the fraction of dead cells increases with a decrease in cell-capillary tip distance and increases with an increase in pulse duration.
Figure 5.

Determination of optimal parameters to achieve maximum cell survivability and electroporation. Contour plot of fraction of electroporated cells (solid contour lines) superimposed on contour plot of cell survivability (shaded contour). Contour plot of cell survivability percentage was plotted as a function of pulse duration and cell-capillary tip distance. Contour plots were made by Renka-Cline method of interpolation.
DISCUSSION
In this work, we varied conditions for single cell electroporation using an electrolyte filled capillary. The diffusion of fluorescent thiol adducts from the cell interior revealed the permeabilization of the membrane by the decrease in fluorescence intensity with time. Permeabilization of the cell membrane is also confirmed by the sharp increase in fluorescence intensity at the time of application of the pulse for the regions outside the cell (Figure 2E). Electroporation has been quantified in previous research by studying the uptake and release of molecules and factors that influence this transport in bulk electroporation51, 52. Quantitation of ATP by bioluminescence from a cell suspension has also been studied previously.53. Our results differ from these observations as we monitor directly the real time release of fluorescent thiol adducts from the single cells. In contrast to transfection done via electroporation, which takes hours to produce proteins by expressing transfected genes 54, we were able to visualize electroporation within seconds after the application of the pulse.
Electroporation of the cell membrane can be split into two different phases. One is the permeabilization phase that takes place during the pulse and the other is the resealing phase that takes place after the pulse4, 43. There are three mechanisms by which molecules can be transported through the pores: electrophoresis, electroosmosis, and diffusion. During the pulse application, the pulse length, amplitude, and molecular properties contribute to the transport rate of molecules. After the end of the pulse application, transport can take place by diffusion and migration until the membrane reseals completely. Migration may occur from the establishment of local diffusion potential gradients within the solution55. To minimize diffusion potentials arising from ion concentration gradients, we have used an intracellular buffer. Thus, our results primarily reflect diffusion. During this post-shock period pores are gradually resealing. This process causes the average permeability of the membrane to decrease over time. The characteristic intensity decay curve with time thus is a combination of the diffusion and pore resealing processes. Various models have been developed to quantitatively describe these processes. For example, Miklavcič et al. developed an analytical expression (called a pharmacokinetic model) relating pulse parameters to uptake (or release) of small molecules from a cell. In this model pore resealing is an exponential (first order) process with a rate constant α = 0.0038 s−1. When our results are analyzed with this model, the pore resealing constant is comparable to this value.
One of the major advantages of single cell electroporation is that high spatial resolution can be achieved. The resolution can be controlled by controlling the tip diameter of the capillary. Previous studies from Orwar using electrolyte filled capillaries achieved a resolution of > 15 μm29. In our experiments capillary tips were typically smaller than 5 μm in diameter and because A 549 cells are on average 10 − 15 μm in diameter we easily achieved single cell electroporation. In fact, a resolution of 10 μm (see Figure 3) or better (data not shown) was achieved with this technique.
A number of electric field parameters such as field strength, pulse duration, number of pulses and delay between the pulses can be controlled simultaneously. All these parameters control the extent of electroporation in a certain way. In our experiments, we studied the effect of field strength and pulse duration on electroporation keeping other parameters constant.
Experiments were performed where the electric field was controlled by changing the cell to capillary tip distance. The results in Figure 4A show that an increase in the cell-capillary tip distance results in a decrease in the fluorescence intensity indicating less permeabilization of the cell membrane. This suggests that increasing cell-capillary tip distance decreases the field strength experienced by the cell. Previous research has proven that the field strength controls the area of the cell that is electroporated 53. The higher the field strength applied, the greater the electroporated area of the cell surface. Therefore it can be hypothesized that increasing the cell-capillary tip distance results in decrease of electric field strength which thus results in a smaller area of the cell being permeabilized.
Experiments were also performed where cells were pulsed for various durations keeping other parameters constant. Results, in Figure 4B, exhibit that increasing pulse duration results in an increase in the fluorescence intensity change indicating in greater permeabilization. This could be because the pulse duration controls the increase in size of these pores41.
As seen in the standard deviation values of fluorescence intensity at 90 seconds in Table 2, a large variability exists in cell response at particular conditions. This diverse response in fluorescence intensity and cell viability has been observed before in single cells, both electroporated in a chip33, and with an electrolyte-filled capillary29. Variability has also been observed in bulk electroporation. An example of this can be seen in Teissie et. al. 46. They showed that there was a significant variability in cell permeation under constant conditions and even larger variability in long term cell survival abilities at the same conditions. For bulk electroporation the variability has been attributed to the cell size distribution around the mean43. We assume that this is in part true also for single cell experiments. In bulk electroporation all cells are pulsed simultaneously and therefore experience very similar conditions. In single cell electroporation, the electric field strength variation from experiment to experiment is possible due to cell shape uncertainties (they are rarely perfectly hemispherical) and capillary-to-cell distance measurements. We considered variations of the capillary resistance but variation in the permeabilization level was large even among experiments performed with the same capillary and therefore we ruled out this as significant factor.
Table 2.
Mean and population standard deviation of relative fluorescence at t = 90 s
| Distance between cell and the capillary tip (μm) | |||||
|---|---|---|---|---|---|
| Pulse Duration (ms) | 2.0 | 3.5 | 5.0 | 7.0 | 10.0 |
| 50 | 0.55 ± 0.29 | 0.96 ± 0.06 | 0.98 ± 0.01 | 0.99 ± 0.01 | 1.00 ± 0.00 |
| 100 | 0.68 ± 0.26 | 0.67 ± 0.24 | 0.77 ± 0.17 | 0.99 ± 0.01 | 1.00 ± 0.00 |
| 200 | 0.35 ± 0.12 | 0.45 ± 0.22 | 0.76 ± 0.16 | 0.99 ± 0.01 | 1.00 ± 0.00 |
| 300 | 0.34 ± 0.23 | 0.38 ± 0.27 | 0.48 ± 0.21 | 1.00 ± 0.00 | 1.00 ± 0.00 |
Even though a large variability exists in the response of individual cells, we were able to find optimum conditions for electroporation and cell viability. The contour plot (Figure 5) shows two surfaces. One is the percentage of cells, while the other is the percent of cells of surviving electroporation. It can be deduced from this plot that at fixed pulse duration, cell survivability increases as the cell-capillary tip distance increases, and at fixed cell-capillary tip distance cell survivability increases as the pulse duration decreases. The superimposition shows that when the cell-capillary tip distance is between 3.5 μm and 5.0 μm and the pulse duration is between 120 ms to 150 ms, 80 − 90% of cells survive and > 90% of the cells are electroporated. While optimum conditions may differ with different cells, recent work on single-cell electroporation has indicated the similarity of four different sort of cells54. We anticipate at least that these optimum conditions are a very good starting point for other cell types. Therefore, even with the variability of single cells, our results provide guidance to experimental conditions to achieve maximum probability of electroporation with minimal probability of cell death.
ACKNOWLEDGMENT
This work was financially supported by the National Institutes of Health (GM R01 66018 ). We are thankful to Prof John Lazo and John Skoko for their help in teaching us cell culturing.
REFERENCES
- 1.Teissie J, Eynard N, Gabriel B, Rols MP. Advanced Drug Delivery Reviews. 1999;35:3–19. doi: 10.1016/s0169-409x(98)00060-x. [DOI] [PubMed] [Google Scholar]
- 2.Phez E, Faurie C, Golzio M, Teissie J, Rols M-P. Biochimica et Biophysica Acta, General Subjects. 2005;1724:248–254. doi: 10.1016/j.bbagen.2005.04.005. [DOI] [PubMed] [Google Scholar]
- 3.Teissie J, Golzio M, Rols MP. Biochimica et Biophysica Acta, General Subjects. 2005;1724:270–280. doi: 10.1016/j.bbagen.2005.05.006. [DOI] [PubMed] [Google Scholar]
- 4.Weaver JC, Chizmadzhev YA. Bioelectrochemistry and Bioenergetics. 1996;41:135–160. [Google Scholar]
- 5.Weaver JC, Vaughan TE, Chizmadzhev Y. Advanced Drug Delivery Reviews. 1999;35:21–39. doi: 10.1016/s0169-409x(98)00061-1. [DOI] [PubMed] [Google Scholar]
- 6.Weaver JC. IEEE Transactions on Plasma Science. 2000;28:24–33. [Google Scholar]
- 7.Tsong TY. Biophysical journal. 1991;60:297–306. doi: 10.1016/S0006-3495(91)82054-9. [DOI] [PMC free article] [PubMed] [Google Scholar]
- 8.Neumann E, Schaefer-Ridder M, Wang Y, Hofschneider PH. EMBO Journal. 1982;1:841–845. doi: 10.1002/j.1460-2075.1982.tb01257.x. [DOI] [PMC free article] [PubMed] [Google Scholar]
- 9.Neumann E. Bioelectrochemistry and Bioenergetics. 1992;28:247–267. [Google Scholar]
- 10.Zimmermann U, Riemann F, Pilwat G. Biochimica et Biophysica Acta, Biomembranes. 1976;436:460–474. doi: 10.1016/0005-2736(76)90208-x. [DOI] [PubMed] [Google Scholar]
- 11.Faurie C, Golzio M, Phez E, Teissie J, Rols MP. Engineering in Life Sciences. 2005;5:179–186. [Google Scholar]
- 12.Xie TD, Tsong TY. Biophysical journal. 1990;58:897–903. doi: 10.1016/S0006-3495(90)82434-6. [DOI] [PMC free article] [PubMed] [Google Scholar]
- 13.Xie TD, Sun L, Tsong TY. Biophysical journal. 1990;58:13–19. doi: 10.1016/S0006-3495(90)82349-3. [DOI] [PMC free article] [PubMed] [Google Scholar]
- 14.Mir LM, Orlowski S, Belehradek J, Jr., Paoletti C. European journal of cancer (Oxford, England : 1990) 1991;27:68–72. doi: 10.1016/0277-5379(91)90064-k. [DOI] [PubMed] [Google Scholar]
- 15.Prausnitz MR, Lau BS, Milano CD, Conner S, Langer R, Weaver JC. Biophysical Journal. 1993;65:414–422. doi: 10.1016/S0006-3495(93)81081-6. [DOI] [PMC free article] [PubMed] [Google Scholar]
- 16.Prausnitz MR, Bose VG, Langer R, Weaver JC. Proceedings of the National Academy of Sciences of the United States of America. 1993;90:10504–10508. doi: 10.1073/pnas.90.22.10504. [DOI] [PMC free article] [PubMed] [Google Scholar]
- 17.Bliss JG, Harrison GI, Mourant JR, Powell KT, Weaver JC. Bioelectrochemistry and Bioenergetics. 1988;20:57–71. [Google Scholar]
- 18.Golzio M, Teissie J, Rols M-P. Proceedings of the National Academy of Sciences of the United States of America. 2002;99:1292–1297. doi: 10.1073/pnas.022646499. [DOI] [PMC free article] [PubMed] [Google Scholar]
- 19.Gabriel B, Teissie J. Biophysical Journal. 1999;76:2158–2165. doi: 10.1016/S0006-3495(99)77370-4. [DOI] [PMC free article] [PubMed] [Google Scholar]
- 20.Hibino M, Itoh H, Kinosita K., Jr. Biophysical journal. 1993;64:1789–1800. doi: 10.1016/S0006-3495(93)81550-9. [DOI] [PMC free article] [PubMed] [Google Scholar]
- 21.Kotnik T, Mir LM, Flisar K, Puc M, Miklavcic D. Bioelectrochemistry (Amsterdam, Netherlands) 2001;54:83–90. doi: 10.1016/s1567-5394(01)00114-1. [DOI] [PubMed] [Google Scholar]
- 22.Kotnik T, Miklavcic D, Mir LM. Bioelectrochemistry (Amsterdam, Netherlands) 2001;54:91–95. doi: 10.1016/s1567-5394(01)00115-3. [DOI] [PubMed] [Google Scholar]
- 23.Pliquett U, Weaver JC. Bioelectrochemistry and Bioenergetics. 1996;39:1–12. doi: 10.1016/s0302-4598(99)00056-2. [DOI] [PubMed] [Google Scholar]
- 24.Olson KJ, Ahmadzadeh H, Arriaga EA. Analytical and Bioanalytical Chemistry. 2005;382:906–917. doi: 10.1007/s00216-005-3135-2. [DOI] [PubMed] [Google Scholar]
- 25.Lu X, Huang W-H, Wang Z-L, Cheng J-K. Analytica Chimica Acta. 2004;510:127–138. [Google Scholar]
- 26.Brady G. Yeast. 2000;17:211–217. doi: 10.1002/1097-0061(20000930)17:3<211::AID-YEA26>3.0.CO;2-7. [DOI] [PMC free article] [PubMed] [Google Scholar]
- 27.Anderson AB, Gergen J, Arriaga EA. Journal of Chromatography, B: Analytical Technologies in the Biomedical and Life Sciences. 2002;769:97–106. doi: 10.1016/s1570-0232(01)00633-x. [DOI] [PubMed] [Google Scholar]
- 28.Lundqvist JA, Sahlin F, Aberg MAI, Stromberg A, Eriksson PS, Orwar O. Proceedings of the National Academy of Sciences of the United States of America. 1998;95:10356–10360. doi: 10.1073/pnas.95.18.10356. [DOI] [PMC free article] [PubMed] [Google Scholar]
- 29.Nolkrantz K, Farre C, Brederlau A, Karlsson RID, Brennan C, Eriksson PS, Weber SG, Sandberg M, Orwar O. Analytical Chemistry. 2001;73:4469–4477. doi: 10.1021/ac010403x. [DOI] [PubMed] [Google Scholar]
- 30.Ryttsen F, Farre C, Brennan C, Weber SG, Nolkrantz K, Jardemark K, Chiu DT, Orwar O. Biophysical Journal. 2000;79:1993–2001. doi: 10.1016/S0006-3495(00)76447-2. [DOI] [PMC free article] [PubMed] [Google Scholar]
- 31.Huang Y, Rubinsky B. Sensors and Actuators, A: Physical. 2003;A104:205–212. [Google Scholar]
- 32.Khine M, Lau A, Ionescu-Zanetti C, Seo J, Lee LP. Lab on a Chip. 2005;5:38–43. doi: 10.1039/b408352k. [DOI] [PubMed] [Google Scholar]
- 33.He H, Chang DC, Lee Y-K. Bioelectrochemistry. 2006;68:89–97. doi: 10.1016/j.bioelechem.2005.05.005. [DOI] [PubMed] [Google Scholar]
- 34.Huang Y, Rubinsky B. Sensors and Actuators, A: Physical. 2001;A89:242–249. [Google Scholar]
- 35.Olofsson J, Nolkrantz K, Ryttsen F, Lambie BA, Weber SG, Orwar O. Current Opinion in Biotechnology. 2003;14:29–34. doi: 10.1016/s0958-1669(02)00003-4. [DOI] [PubMed] [Google Scholar]
- 36.Tao W, Wilkinson J, Stanbridge EJ, Berns MW. Proceedings of the National Academy of Sciences of the United States of America. 1987;84:4180–4184. doi: 10.1073/pnas.84.12.4180. [DOI] [PMC free article] [PubMed] [Google Scholar]
- 37.Soughayer JS, Krasieva T, Jacobson SC, Ramsey JM, Tromberg BJ, Allbritton NL. Analytical Chemistry. 2000;72:1342–1347. doi: 10.1021/ac990982u. [DOI] [PubMed] [Google Scholar]
- 38.Orwar O, Karlsson M, Chiu D. 2002. p. 30.
- 39.Capecchi MR. Cell. 1980;22:479–488. doi: 10.1016/0092-8674(80)90358-x. [DOI] [PubMed] [Google Scholar]
- 40.Valic B, Golzio M, Pavlin M, Schatz A, Faurie C, Gabriel B, Teissie J, Rols M-P, Miklavcic D. European biophysics journal : EBJ. 2003;32:519–528. doi: 10.1007/s00249-003-0296-9. [DOI] [PubMed] [Google Scholar]
- 41.Rols M-P, Teissie J. Biophysical Journal. 1998;75:1415–1423. doi: 10.1016/S0006-3495(98)74060-3. [DOI] [PMC free article] [PubMed] [Google Scholar]
- 42.Loste F, Eynard N, Teissie J. Bioelectrochemistry and Bioenergetics. 1998;47:119–127. [Google Scholar]
- 43.Puc M, Kotnik T, Mir LM, Miklavcic D. Bioelectrochemistry. 2003;60:1–10. doi: 10.1016/s1567-5394(03)00021-5. [DOI] [PubMed] [Google Scholar]
- 44.Kotnik T, Pucihar G, Rebersek M, Miklavcic D, Mir LM. Biochimica et Biophysica Acta, Biomembranes. 2003;1614:193–200. doi: 10.1016/s0005-2736(03)00173-1. [DOI] [PubMed] [Google Scholar]
- 45.Valic B, Pavlin M, Miklavcic D. Bioelectrochemistry. 2004;63:311–315. doi: 10.1016/j.bioelechem.2003.12.006. [DOI] [PubMed] [Google Scholar]
- 46.Gabriel B, Teissie J. Biochimica et Biophysica Acta, Molecular Cell Research. 1995;1266:171–178. doi: 10.1016/0167-4889(95)00021-j. [DOI] [PubMed] [Google Scholar]
- 47.Teissie J, Tsong TY. Biochemistry. 1981;20:1548–1554. doi: 10.1021/bi00509a022. [DOI] [PubMed] [Google Scholar]
- 48.Olofsson J, Levin M, Stroemberg A, Weber SG, Ryttsen F, Orwar O. Analytical Chemistry. 2005;77:4667–4672. doi: 10.1021/ac0502302. [DOI] [PMC free article] [PubMed] [Google Scholar]
- 49.Fabisiak JP, Sedlov A, Kagan VE. Antioxidants & Redox Signaling. 2002;4:855–865. doi: 10.1089/152308602760599016. [DOI] [PubMed] [Google Scholar]
- 50.Kagan VE, Kuzmenko AI, Tyurina YY, Shvedova AA, Matsura T, Yalowich JC. Cancer Research. 2001;61:7777–7784. [PubMed] [Google Scholar]
- 51.Prausnitz MR, Corbett JD, Gimm JA, Golan DE, Langer R, Weaver JC. Biophysical Journal. 1995;68:1864–1870. doi: 10.1016/S0006-3495(95)80363-2. [DOI] [PMC free article] [PubMed] [Google Scholar]
- 52.Tekle E, Astumian RD, Chock PB. Biochemical and Biophysical Research Communications. 1990;172:282–287. doi: 10.1016/s0006-291x(05)80206-2. [DOI] [PubMed] [Google Scholar]
- 53.Rols MP, Teissie J. Biophysical Journal. 1990;58:1089–1098. doi: 10.1016/S0006-3495(90)82451-6. [DOI] [PMC free article] [PubMed] [Google Scholar]
- 54.Rae JL, Levis RA. Pfluegers Archiv. 2002;443:664–670. doi: 10.1007/s00424-001-0753-1. [DOI] [PubMed] [Google Scholar]
- 55.Newman J, Tomas-Alyea KE. 2004. pp. 149–168.