

Abstract
Cytochrome oxidase catalyzes the reduction of O2 to water and conserves the considerable free energy available from this reaction in the form of a proton motive force. For each electron, one proton is electrogenically pumped across the membrane. Of particular interest is the mechanism by which the proton pump operates. Previous studies of the oxidase from Rhodobacter sphaeroides have shown that all the pumped protons enter the enzyme through the D channel, and that a point mutant, N139D, in the D channel completely eliminates proton pumping without reducing the oxidase activity. N139 is one of three asparagines near the entrance of the D channel where there is a narrowing or neck, through which a single file of water molecules pass. In the current work, it is shown that replacement of a second asparagine in this region by an asparate, N207D, also decouples the proton pump without altering the oxidase activity of the enzyme. Previous studies demonstrated that the N139D mutant results in an increase in the apparent pKa of E286, a functionally critical residue which is located 20 Å away from N139 at the opposite end of the D channel. In the current work, it is shown that the N207 mutation also increases the apparent pKa of E286. This finding re-enforces the proposal that the elimination of proton pumping is the result of an increase of the apparent proton affinity of E286 which, in turn, prevents the timely proton transfer to a proton accepter group within the exit channel of the proton pump.
During each turnover of cytochrome c oxidase, eight protons are taken up from the N-side of the membrane; four protons are used for chemistry (water formation) and four protons are pumped across the membrane(1–6). Recently, a mutation in the D-channel of the aa3-type oxidase from Rhodobacter sphaeroides, N139D (see Figure 1), was shown to completely eliminate proton pumping, but without reducing the oxidase activity of the enzyme (7–9). Indeed, the mutant oxidase has a turnover number that is twice that of the wild type enzyme. A similar mutation has also been reported at the equivalent position (N131D) in the oxidase from Paracoccus denitrificans (10). The N139D mutant of theR. sphaeroides oxidase has been further characterized and shown to form the same transient intermediates as observed with the wild type oxidase (8). In this reaction, O2 binds to the reduced heme a3-CuB active site and the O-O bond is split yielding hydroxide associated with CuB2+ and an oxoferryl form (Fe4+=O2−) of heme a3. This reaction involves the transfer of one electron from nearby heme a, which leaves the active site with excess negative charge. This intermediate is called the PR state of the oxidase, and it is shortlived (τ< 100 μs). The PR state is rapidly converted to the F state upon the transfer of a proton from E286 to the active site. Hence, the pH-dependence of the rate of the PR→F transition reflects the extent of protonation of E286. With the wild type oxidase, the pH-dependence of the PR→F transition indicates that E286 has a pKa of about 9.4 whereas, with the N139D mutation, the apparent pKa of E286 is higher by at least 1.5 pH-units (8). The correlation of the decoupling of the proton pump and the increase in the apparent pKa of E286 suggest a possible mechanism of the decoupling by the N139D mutation (8). It was speculated that either by an electrostatic effect or by a conformational change, the newly placed D139 mutation makes it more difficult to deprotonate E286. If the putative proton acceptor group in the proton pumping pathway is about pH 11, then the influence of the N139D mutation would effectively prevent rapid proton transfer from E286 to the pump exit channel. Since the proton affinity of the reaction intermediates at the active site is presumably very high, the modest increase in the pKa of E286 will have no influence on the rate of proton transfer to the active site.
Figure 1.
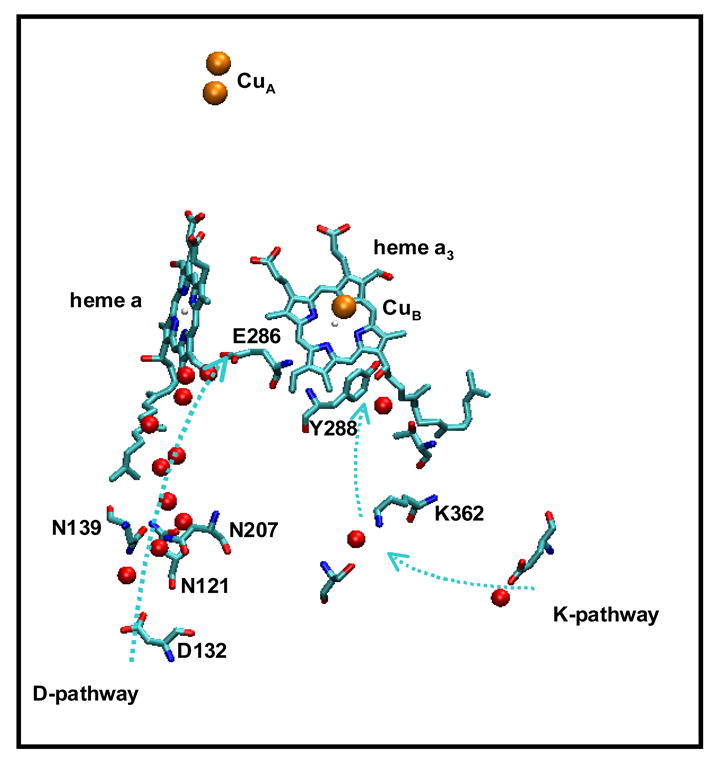
Structure of the aa3-type oxidase from R. sphaeroides, illustrating the relationship of the two proton-conducting pathways (D channel and K channel) and the redox centers in subunit I. Water molecules in each pathway are shown in red spheres. The “neck” region of the pump is formed by three asparagines, N121, N139 and N207. Note the water chain leading from this region to E286. The figure was prepared using VMD (Visual Molecular Dynamics)(38) from the structure reported in (39).
The significance of the increase of the pKa of E286, measured by the pH-dependence of the PR→F transition, was given further support by the subsequent study of the double mutant N139D/D132N, in which it was shown that replacing the aspartic acid at position D132 by an asparagine restores the proton pumping abolished by the N139D mutation (11). Of particular interest is that the pH-dependence of the PR→F transition is also restored to a value near that of the wild type oxidase. Hence, the correlation between the increase of the apparent pKa of E286 and the loss of proton pumping is observed again. The mechanism by which the apparent pKa of E286 is increased by changes near the entrance of the D channel is not known. Electrostatics calculations suggest that a direct electrostatic effect by placing a deprotonated acid group at the start of the D channel is not likely to have a significant influence on the proton affinity of E286 (12). Recent FTIR difference spectroscopy does show a small perturbation in the environment of E286 in the oxidized state of the enzyme caused by the N139D mutant(13). However, it has not been demonstrated that a conformational perturbation is responsible for the altered apparent pKa of E286, nor has it been proven that the increased pKa is responsible for the decoupling of the proton pump.
N139 is one of three highly conserved asparagines that form a constriction or neck in the D channel just above the entrance residue, D132 (Figure 1). The other two are N207, and N121. The question being addressed in the current work is whether mutating N207 to aspartate has a similar effect on the enzyme as does the N139N mutation. It has been shown that the equivalent mutation in the oxidase from P. denitrificans (N199D) results in decoupling the proton pump (10), but no additional characterization of this mutant has been reported. It is confirmed in the current work that the N207D mutant oxidase from R. sphaeroides also does not pump protons, similar to the behavior of N139D. Furthermore, study of the pH-dependence of the PR→F transition shows that the apparent pKa of E286 is shifted to a higher value compared to the wild type oxidase. The data suggest that the perturbation of E286 by either N139D or N207D may be the primary cause of the decoupling of the proton pump.
Materials and Methods
Site-Directed Mutagenesis
The N207D mutant was constructed using the Quikchange site-directed mutagenesis kit from Stratagene. Primers were synthesized at the University of Illinois Biotechnology Center, Urbana. Restriction enzymes were from New England Biolabs or Invitrogen. The gene was partially sequenced by the UIUC Biotechnology Center to verify the mutation.
The expression plasmid harboring the mutated gene encoding subunit I was transferred into R. sphaeroides JS100 strain by conjugation. The expression plasmid was first transferred into E. coli S-17-1 cells by electroporation. Then both S-17-1 and JS100 cells were grown to early log phase. Cells were spun down and washed with LB to remove antibiotics. The resuspended cells were mixed at 1:1 ratio, and 100μL of the mix was pipetted onto the center of a sterile, 13mm, 0.45μm cellulose filter paper lying on a plain LB plate. After overnight incubation at 30°C the filter paper was carefully transferred into a sterile tube. The cells on the filter paper were washed off with Sistrom’s medium and plated with Sistrom’s medium (14) plus the antibiotics. Colonies from the plate were picked and grown to test for expression of the oxidase.
Protein Purification
His-tagged wild type and mutant enzymes were purified from R. sphaeroides using histidine affinity chromatography as described previously (15). Cells were grown in Sistrom’s minimum media (14) with 50μg/ml spectinomycin, 50μg/ml streptomycin, and 1 μg/ml tetracycline at 30°C until early stationary phase and then harvested by centrifugation at 8,000 rpm for 10min. At this point, the cells can be stored at −80°C. Cell pellets were homogenized and suspended in 50mM potassium phosphate buffer, pH 8.0, then were broken by passing through microfluidizer 4–5 times at 20,000psi. DNase I and a cocktail of protein inhibitors were added to digest released DNA and to prevent protein hydrolysis. Cell debris was spun down at 8000 rpm for 20 min and the supernatant was ultracentrifuged at 40,000 rpm for at least 6 hr to pellet the cell membrane. The membrane appears as a dark brown pellet. At this point, one can freeze the membrane at −80°C for later use or proceed to the next step. The membrane was homogenized with 50mM potassium phosphate buffer, pH8.0, and solubilized with 2% dodecyl maltoside (DM). The detergent (20% stock) was added drop by drop after homogenization and the mixture was stirred at 4°C for 2hr. The solubilized membrane was ultracentrifuged at 40,000rpm for 1.5hr and the supernatant was collected. Ni-NTA resin was added to the supernatant at a ratio of 1ml resin/mg aa3 protein and the mixture was stirred in the presence of 10 mM imidazole for 1.5hr before loading the resin into column. The column was washed consecutively with 1) 50mM potassium phosphate buffer, pH8.0, 10mM imidazole 0.1 %DM; 2) 50mM potassium phosphate buffer, pH8.0, 20mM imidazole 0.1 %DM; and 3) 50mM potassium phosphate buffer, pH 8.0,0.1 %DM. Buffer containing 50mM potassium phosphate, pH 8.0, 0.1% DM plus 100 mM histidine was used to elute the oxidase. The enzyme was concentrated using a 50 kD-cutoff concentrator from Millipore and exchanged into 50 mM potassium phosphate buffer, pH 8.0, 0.1% DM by passing through a PD-10 desalting column (Amersham). The enzyme was further concentrated if necessary. The protein was then aliquoted and fast frozen in liquid nitrogen, and stored at −80°C. Typically, from 24 L of bacterial culture, ~20 mg of oxidase is purified.
Enzyme used for the proton pumping assay needs further purification by anion exchange chromatography (16). About 5–10 mg of affinity-purified oxidase was diluted to 2 mL with buffer A (10mM potassium phosphate buffer, 1mM EDTA, 0.2% DM, pH 7.2), and loaded onto tandem DEAE-5PW columns (Toso-HaaS) attached to an FPLC system (Amersham, model ÄKTA Basic). The columns were washed with buffer A, and the oxidase was eluted at a flow rate of 0.5mL/min with a gradient of buffer B (buffer A with 1 M KCl). For “standard” programmed conditions, the gradient was rapidly increased from 0 to 15% buffer B over 0.5 column volume, and then the oxidase was eluted as the gradient was slowly increased from 15% to 45% buffer B over 4 column volumes. Typically, three peaks are resolved with the first peak free of oxidase. The second and third peaks were collected and concentrated for the proton pumping experiments.
Steady-State Activity
Steady-state oxidase activity was measured polarographically using a YSI model 53 oxygen meter equipped with a water-jacketed and stirred glass measuring vessel. The reaction mixture contains 1.8 ml of 50 mM potassium phosphate buffer, 0.1% DM, pH 6.5, 10 mM ascorbate, 0.5 mM TMPD, and 30 μM horse heart cytochrome c. The enzyme turnover (mol electrons per second per mol enzyme) was calculated from the slope of the oxygen consumption traces and corrected for background in the absence of the enzyme.
Redox Phototitration
Redox phototitration(17) was used to determine the redox behavior of wild-type and mutant enzymes, N207D and D132N. 14–18 μM Cytochrome c was used as a redox potential indicator and saturated riboflavin was used as the photoreductant. The solution was buffered with 50 mM Tris, 10 mM EDTA with 0.1% Dodecyl -D-maltoside pH 7. The EDTA acts as a sacrificial donor of electrons. Different concentrations were used for the cytochrome c oxidase in the experiments, 8 μM for the D132N mutant, 11 μM for N207D, and 9 μM for the wild type oxidase. Samples were prepared and placed in a cuvette which could be connected to a vacuum line. To the sample (~2 mL volume), 25 μL of saturated riboflavin was added, and all subsequent steps were performed in the dark, with the aid of a safe-light. The contents of the cuvette were made anaerobic by being degassed carefully on the vacuum line, and the headspace was exchanged with argon. Before the start of measurements, enough ferricyanide was added to a final concentration of 100 μM to ensure that the titration began with the enzyme in its fully oxidized state. The cuvette was then placed into the sample holder equipped with a magnetic stirrer. After the recording of the original fully oxidized spectrum, the system was incrementally reduced by shining light from a slide projector (5–20 second exposure) through a side window in the sample compartment of the spectrophotometer. After the exposure, the sample was allowed to reach redox equilibrium (typically 1–2 min) after which a spectrum was recorded. A final, fully reduced spectrum was recorded after dithionite was added to the sample.
The series of spectra thus obtained represent the transition from fully oxidized to fully reduced oxidase plus cytochrome c. Since the redox midpoint potential (Em) of cytochrome c is known to be 260 mV vs. NHE, the redox potential of the state of the system represented by any individual spectrum can be calculated and, thus, used to study the redox behavior of hemes a and a3.
Data analysis of redox titrations
MATLAB 6.1 (MathWorks Inc.) was used for data analysis. Difference spectra were obtained after each photoreduction step. The potential of the system at each step was determined by determining the fractional reduction of cytochrome c by monitoring the absorbance at 550 nm. Assuming that equilibrium is established at each potential, the ratio of concentrations of oxidized to reduced forms is related to the solution potential by the Nernst equation as follows. E = Eo + 2.303RT/nF log10 (ox/red) where n is the number of electrons involved in the redox reaction of interest (1 for cytochrome c), F is the Faraday constant, and Eo is the midpoint potential 260 mV vs SHE for cytochrome c). This allows the solution potential to be determined at each step in the photoreduction. This set of potentials was used to plot the dependence of absorbance at 605 nm and 445 nm. In order to compensate for any changes in the spectral base line, the absorbance at reference wavelengths were subtracted from each measurement, A550–540nm, A605–630nm, and A445–450 nm.
In order to deconvolute the data to reveal the behavior of heme a and heme as it is necessary to take into account the different spectroscopic contributions at 445 nm and 605 nm, and also take into account the anti-cooperativity of the redox properties of the two hemes. The contribution of each heme to the reduced-minus-oxidized absorbencies at 605 nm and 445 nm has been estimated by various methods, and the consensus from such studies is that heme a is the primary contributor to the a band at 605 nm (72–80%) while cytochrome a3 makes the larger contribution to the Soret band at 445 nm (~65%) (18) The fit was performed with the assumption of a neoclassical model (19), where interactions only between heme a and heme a3 are incorporated.
Re constitution of Oxidase into Vesicles
Cytochrome oxidase vesicles (COVs) were made by using Bio-beads to remove detergent, as described (20, 21). Asolectin (80mg/ml) was mixed with 2% cholic acid and 100 mM HEPES-KOH, pH 7.4 and then sonicated using a model W-375 sonicator (Heat System-Ultrasonics, Inc, now Mixonix, Inc., Farmingdale, NY) using 10–12 30-second cycles, at 50% duty, with a break of ~60 seconds between cycles. The mixture was kept on ice under a stream of Argon gas during sonication. The oxidase was added to the lipid/cholate mixture to yield a concentration of ~1.2 μM (the same protein-to-lipid ratio was used for both wild type and mutant enzyme). The mixture was stirred at 4°C with 66 mg Bio-beads/ml added every 30min. After 4 hours, 100mM HEPES-KOH buffer was added (0.5 mL per mL of mix) and the mixture was brought to room temperature. Bio-beads were added every 30 minutes for another 3 hours (133mg/mL during the first two hours and 266 mg/mL during the last hour). The proteolipososmes were pipetted so as to remove the Bio-beads, and then dialyzed overnight against 60mM KCl.
Proton Pumping Assays
Prior to proton pumping measurements, the RCR (respiratory control ratio) of the COVs was measured. Oxidase activity of the COVs was determined using a YSI model 53 oxygen electrode in 100mM Hepes-KOH buffer, pH 7.4. Activity was first determined in the absence of ionophores and then after the addition of ionophores valinomycin and CCCP. The RCR was calculated by dividing the activity measured in the presence of both valinomycin and CCCP by the initial activity measured in the absence of the ionophores.
Proton pumping was measured by two methods: a) direct measurement using a pH electrode and a stirred-cell, and b) measurement using a stopped-flow apparatus and monitoring the pH change with a pH-sensitive dye. The results were the same using each method.
With the stirred-cell method, proton pumping was measured for the COVs in a 1.5 mL reaction mixture containing 60 mM KCl, 40 μM cytochrome c, 300 μM ascorbate, 10 μM valinomycin, and ~0.4 μM oxidase (in liposomes). After all of the components were added except ascorbate, the headspace of the cell was flushed with a constant stream of water-saturated argon. Stirring under this argon atomosphere for several minutes removed the O2 from the sample. Ascorbate was then added. After equilibration, the reaction was initiated by injecting into the reaction mixture a small volume (e.g., 10 μL) of air-saturated H2O equilibrated at 25°C. Calibration was performed by adding the same volume of a solution of 1 mM HCl. The experiment was repeated in the presence of 10 μM protonophore CCCP to equilibrate the protons on the inside and outside of the COVs.
The proton pumping efficiency (H+/e−) of the oxidase was calculated as the ratio of the pH change induced by H2O over the pH change induced by the same volume of 1 mM HCl. Note that the total buffering capacity of the system is increased after adding CCCP due to the contribution of the internal vesicle medium and the phospholipids in the internal leaflet of the bilayer(22). The buffering capacity was determined to increase by a factor of about 1.6 in the presence of CCCP.
Proton pumping measured by the stopped-flow method was performed with a SX.17-MV model stopped-flow spectrophotometer from Applied Photophysics equipped with a diode array detector. The stopped-flow method has the advantage of a rapid response to pH changes and minimizes artifacts due to proton backflow into the vesicles. In this method, the absorption changes of phenol red (ΔA557nm) were monitored when COVs and cytochrome c2+ were mixed together. The decrease and subsequent increase of phenol red absorption (ΔA557nm) indicate the decrease and subsequent increase of pH outside of the COVs, respectively.
The detailed procedure used to measure proton pumping by the stopped-flow method follows. A solution containing 60 mM KCl, 5 μM valinomycin, 40 μM phenol red (pH-sensitive dye), 0.4 μM oxidase (in liposomes) was loaded into one of the driving syringes. The other driving syringe was loaded with 60 mM KCL solution containing 10 μM cytochrome c2+ and 40 μM phenol red. Each solution was adjusted to pH 7.4 with KOH and HCl before loading. After mixing, the absorbance changes from 400nm to 800nm were monitored. The absorbance change of phenol red was monitored at 557nm because this is the isosbestic point of reduced and oxidized cytochrome c. The absorbance at this wavelength must be obtained by interpolation using the data from the diode array, and this was done using the SPLINE function of Matlab (The MathWork, Inc.). The experiment was repeated with 10 μM CCCP in the same syringe as COVs.
Calibration of proton pumping with the stopped-flow method was achieved by monitoring the pH change as a known amount of TAME is hydrolyzed. One proton is released upon the hydrolysis of TAME at pH 7.4 (23). A solution containing 60 mM KCl, 5 μM valinomycin, 40 μM phenol red, and 6 μM trypsin was loaded into one of the driving syringes. COVs were also added with the same volume as in the pumping measurement The other syringe was loaded with a solution containing 60 mM KCl, 40 μM phenol red and TAME at a concentration ranging from 0 μM to 50 μM. CCCP was added to the syringe containing COVs to estimate the buffer capacity when the solution inside and outside of the COVs are equilibrated.
Stopped-flow Kinetics
The kinetics of the reduction and oxidation of hemes a and a3 were studied using the same stopped-flow apparatus as described above.
To study the oxidation kinetics, a solution containing the enzyme (5 μM oxidase and ~100μg/mL catalase in 50mM Tricine, pH 8.0 and 0.1 %DM) was placed in a reservoir made from a syringe barrel at the loading position of the stopped-flow unit. The solution was made oxygen-free by directing a gentle jet of water-saturated argon gas onto the surface of the sample. About 400 μ,M dithionite was added to reduce the enzyme, and then the sample was loaded into one of the driving syringes. The presence of catalase eliminates any hydrogen peroxide that might be generated by the dithionite and, thus, prevents formation of P and F intermediates of the oxidase. Oxygen-saturated Tricine buffer was loaded into the other driving syringe. Upon mixing the dithionite was rapidly eliminated by reaction with O2, and the reduced enzyme was subsequently oxidized by excess O2.
The reduction kinetics was measured immediately following oxidation of the enzymes using ruthenium (II) hexamine as electron donor(24). The wild type or N207D oxidase was added to 50mM Tricine, pH 8.0, 0.1 %DM, and the mixture was placed in a reservoir made from a syringe barrel at the loading position of the stopped-flow unit. The solution was made oxygen free by purging argon gas on the surface of it. Ruthenium(III) hexamine (10mM) was added together with 30mM dithionite to fully reduced the enzyme. Air-saturated buffer containing 0.1 %DM was placed in the second driving syringe. Upon mixing, the oxidation of the enzyme and then the reduction of heme a were both essentially complete within the dead time of the instrument. The excess dithionite rapidly removed any oxygen remaining in the solution. This makes it possible to measure the reduction of heme a3 by ruthenium(II).
Flow-flash Assay
The flow-flash assay monitors the reaction between fully reduced oxidase and oxygen. The rate constants of PR-to F and F-to-O transitions can be extracted by examining the absorption changes at 580nm. Details of the methods are given in (25)).
Sample Preparation for ATR-FTIR experiments
The FTIR difference spectra were obtained using the techniques previously described (26, 27). An Attenuated Total Reflectance (ATR) attachment with a 3 mm diamond prism (3-bounce, SensIR) was used with a BioRad (now Varian, Inc.) FTS 6000 FTIR spectrophotometer equipped with a liquid nitrogen cooled MCT detector. A thin film containing the enzyme was adhered to the surface of the diamond prism. The initial step is to remove the detergent from the purified enzyme and pellet the enzyme. 10μl of 150 μM enzyme solution was diluted 300-fold with water. The solution was concentrated using an Amicon 50K membrane concentrator to a final volume of 500 μl. This dilution and concentration was repeated. The final suspension of enzyme was pelleted using a bench-top centrifuge. The pellet was re-suspended in 10μl of water and could be stored at −80°C.
To prepare the protein film, 6μl of this sample was pipetted onto the ATR diamond prism and air-dried for a few minutes. This caused the protein to stick firmly to the crystal surface. The presence of residual phospholipids in the preparation appears to help stabilize the enzyme and assist in the adherence to the surface. The protein film was rehydrated by first humidifying the air around the film until a stable FTIR spectrum is recorded. Then a 1ml solution of the perfusion buffer (30 mM Hepes, 20 mM KCl, 5 mM MgCl2, pH 8.5) was put on the film in order to re-wet the sample. The sample was sealed in a compartment of a device allowing one to continuously flow buffer of any composition across the surface. In this way the redox status of the enzyme was altered, as previously described, to obtain the fully reduced, fully oxidized and Pm intermediates. Upon changing the buffer composition, the state of the enzyme in the film was monitored by visible spectroscopy using a home-built apparatus with an Ocean Optics USB2000 spectrometer, similar to that described (28). The absorption spectrum in the visible was obtained by reflectance off the surface of the sample on the diamond ATR crystal. Thus, one can record the visible spectrum simultaneously with the infrared spectrum as the buffer composition is changed. In general, the sample was equilibrated with a buffer by flowing the solution over the sample for about 1 h. A peristaltic pump (Cole-Parmer, Masterflex C/L) and a valve controller (Hamilton) are used for the flow and exchange of buffers. All experiments were performed at 22° C with a flow speed of 0.33ml/min.
The PM-minus-oxidized difference spectrum (PM-O)
To assure that the enzyme was fully oxidized, the sample was first fully reduced with perfusion buffer (30 mM Hepes, 20 mM KCl, 5 mM MgCl2, pH 8.5) containing 3 mM dithionite (step 1) and then oxidized with perfusion buffer containing 1mM potassium ferricyanide (step 2). After recording a background spectrum of the protein in this state (O), the same buffer (with 1 mM ferricyanide) which had been bubbled with a 1:1 mixture of CO2:O2 was flowed over the sample (step 3) to generate the Pm state. The UV-visible spectrum confirmed the formation of the PM state. Infrared spectra (averaged from 1024 interferograms) were recorded after reaching a stable state. Steps (1) through (3) were repeated 40 to 60 times and the results were then averaged for 4 to 6 different samples to improve the signal-to-noise ratio. To check the sample quality, at the end of the experiment, the R4-O difference spectra (FTIR and UV-vis) were recorded and compared to the spectra taken at the beginning of the experiment.
Results
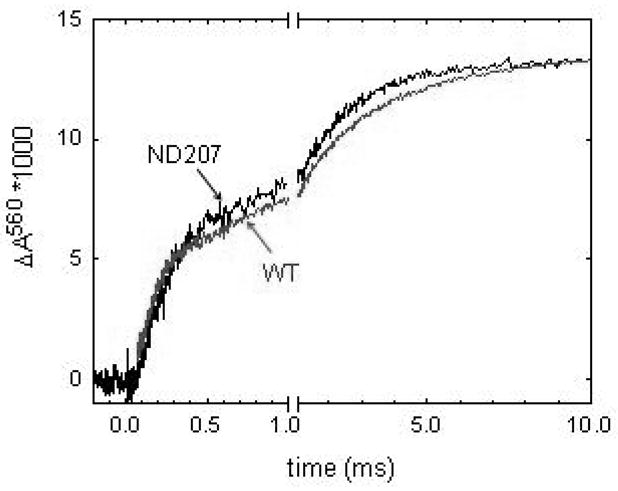
The reduced-minus-oxidized UV-vis spectrum and the SDS-PAGE of the purified N207D mutant oxidase appear identical to those of the wild type oxidase (not shown). The steady state turnover of the N207D mutant oxidase is also comparable to that of the wild type oxidase at pH 7.4 (see Table 1), about 1300 electrons/s. The pH-dependence of the steady state activity is also identical to that of the wild type oxidase (data not shown). Clearly, the N207D mutation does not inhibit oxidase activity. Therefore, no perturbation by the mutation is expected in the rate of reduction of the hemes. This is shown to be the case in Figure 2, which compares the rate of reduction of the hemes for the wild type and N207D mutant oxidases, monitoring the Soret absorbance at 445 nm. Under the conditions used, the rates of reduction of heme a and heme a3 are both rapid and not resolved for either oxidase. The data are analyzed in both cases by a two exponential fit, where 95% of the changes are in the fast phase (193 s−1 for the wild type, and 172 s−1 for the N207D mutant).
Table 1.
Activity of wild type and N207D mutant enyzmes (pH 7.4) in detergent and in reconstituted vesicles, along with proton pumping stoichiometry.
| Activity (e−1s−1aa3−1) | RCRe | H+/e− | |||
|---|---|---|---|---|---|
| Solublized | Reconstituted vesiclesb | ||||
| proteina | controlledc | uncontrolledd | |||
| Wild-type | 1300 ±110 | 80 | 409 | 5.1 | 0.7 |
| N207D | 1220 ± 88 | 72 | 347 | 4.8 | 0 |
The reaction was initiated by adding 2nM of the wild type or N207D mutant enzyme to the reaction mixture. The rates of nonenzymatic reduction of O2 by ascorbate/TMPD/cytc2+ were subtracted. The buffer used for testing the reconstituted enzyme was 100 mM Hepes, pH 7.4.
Purified protein solublized in dodecyl maltoside.
Purifed protein reconstituted into phospholipids vesicles. It was assumed that all the enzyme added was reconstituted into the vesicles and were in the correct orientation.
Activity with no ionophores added.
Activity with valinomycin and CCCP added.
RCR: respiratory control ratio (see text).
Figure 2.

The time course of the absorbance changes at 445nm, monitoring the reduction of heme a + heme a3. See text for details. Both traces give a fast phase (193 s−1 for wild type and 172 s−1 for N207D mutant enzyme) with amplitudes accounting for 95% of the total change.
The rate of the reaction of the fully reduced oxidase with O2 was also very rapid for both the mutant and wild type oxidases, with most of the changes within the dead time of the stopped flow instrument. Analysis of this reaction required the use of the flow-flash technique in order to measure the progression of spectroscopically distinct intermediate species. In this experiment, the fully reduced enzyme is complexed anaerobically to CO. After mixing the anaerobic solution containing the oxidase-CO adduct with buffer saturated with O2, the reaction is initiated by flash photolysis, which expells the CO and opens the active site to react with the O2 in solution. Monitoring this reaction at different wavelengths (not shown) at pH 7.5 shows that the reaction intermediates are spectroscopically identical for both the wild type and mutant oxidases and that the rate constants are also comparable. Not surprisingly, the N207D mutant does not influence the rate of steady state turnover, or the single turnover kinetics at pH 7.5.
The wild type oxidase in detergent solution takes up a net of 1 proton coincident with each the PR→F and the F →O transitions. During each of these transitions, one proton is released (pumped) and two are taken up (29), resulting in the observed net of 1 proton per transition. The N207D mutant also takes up one proton coincident with the PR→F transition and another proton during the F →O transition. In this case, no proton is pumped, so the protons taken up are both used in the chemistry of forming water. Figure 3 shows the rate proton uptake, measured with a pH-sensitive dye (phenol red) during the reaction of O2 with the fully reduced enzyme (flow-flash reaction). The data show that the rate of proton uptake through the D channel is not delayed in the N207D mutant but is identical to the rate of proton uptake observed with the wild type oxidase.
Figure 3.
Proton uptake during the flow-flash reaction at pH 7.8, measured using the absorbance of phenol red at 560 nm. The two phases of proton uptake correspond to the PR→F and the F→O transitions, with approximately 1 proton taken up coincident with each transition. The rate of proton uptake through the D channel is virtually identical for both the wild type and the N207D mutant oxidases.
Figure 4 shows the results of the photoredox titration of the wild type and N207D mutant oxidases to determine if the mutation has altered the electrochemical properties of either heme a or heme a3 Also shown is the phototitration of the D132N mutant. The data have been analyzed using a model which contains the midpoint potentials of each heme as well as a cooperativity factor which quantifies the extent of anticoopertivity between the two hemes. For the wild type oxidase, the potential dependence of the absorbance at 605 nm can be fit to a model in which heme a has a midpoint potential of +382 mV (vs SHE) and has a −160 mV interaction with a component with a midpoint potential of +369 mV. Furthermore, the electrochemical behavior of the N207D and D132N mutants are virtually identical to that of the wild type. It can be concluded that neither of these mutants has a significant effect on the midpoint potentials of either heme a, heme a3 or CuB.
Figure 4.
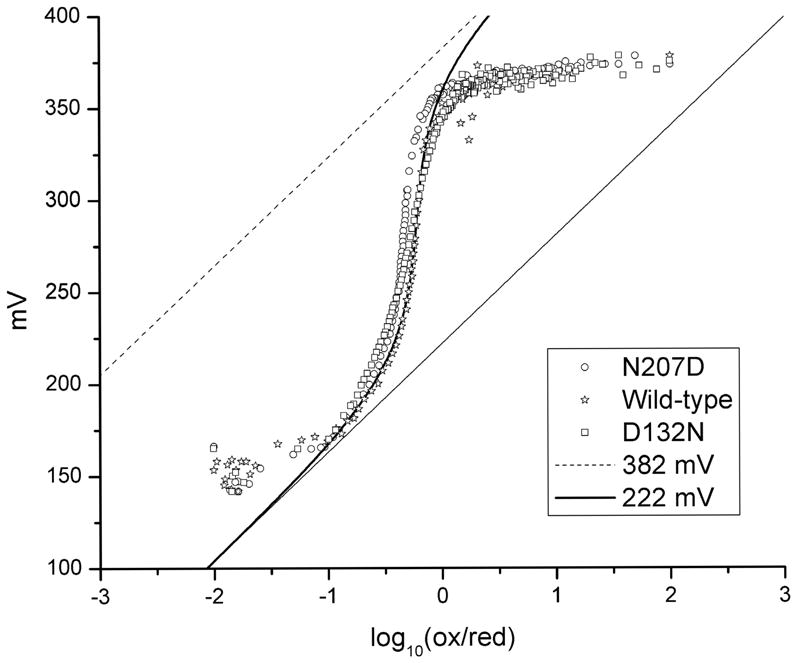
Reductive phototitration of the wild type, D132N, and N207D mutant oxidases from Rhodobacter sphaeroides. The theoretical curve for the titration of heme a is shown with a midpoint potential of 382 mV and a −160 mV interaction potential with a center with a midpoint potential of 369 mV. Similar behavior is observed for both the N207D and N132N mutants as well as the wild type oxidase.
Both the wild type and N207D oxidases were reconstituted into vesicles. The turnover of the reconstituted enzymes were measured both in the presence and absence of the ionophores CCCP and valinomycin. The data are summarized in Table 1. In the absence of the ionophores, the enzyme turnover is limited by the proton motive force that rapidly builds up across the liposome membrane. This is referred to as the “controlled” activity. The proton motive force is dissipated by adding the ionophores, which relieves the inhibition of the oxidase activity, thus leading to an increase in enzyme turnover. The ratio of the uncontrolled to the controlled activity is called the respiratory control ratio or RCR. If the vesicles are well sealed and do not rapidly leak protons, this ratio will be significantly larger than 1. For the samples of oxidases studied in the current work, the RCR is approximately 5 for both the wild type and the mutant oxidases (Table 1). This is a necessary condition to proceed to measure proton pumping. Figure 5 shows the changes in pH of a solution containing oxidase reconstituted in liposomes, after initiating the reaction by the addition of O2. The only way protons can appear on the outside of the vesicles under these conditions is by the active transport of protons during enzyme turnover, i.e., proton pumping. As previously demonstrated, the data show that the wild type oxidase pumps protons. Rapid acidification of the external medium is observed following the addition of oxygen-containing buffer. In the presence of the protonophore CCCP, which equilibrates the pH inside and outside the vesicles, the same addition of oxygen-containing buffer results in rapid alkalinization of the external medium since the net reaction consumes protons.
Figure 5.

Proton pumping assays of oxidase reconstituted in phospholipid vesicles (COVs). Panels A and B show the data obtained using the stirred-cell method with a pH-sensitive electrode. After adding 2.5nmol O2 (10 μl H2O), rapid acidification is seen outside the wild type COVs (A), but not the N207D mutant COVs (B). The upper trace in each case is the result obtained in the absence of ionophores, and the lower trace shows the alkalinization observed in each case in the presence of ionophores (valinomycin and CCCP). The calibrations denoted as indicate the pH changes upon the addition of 2.5 nmol HCl to the vesicles in the absence of CCCP (H0+), and with CCCP present (Hc+). Panels C and D show the results obtained using the stopped-flow method, monitoring the pH changes by the absorption of phenol red at 557 nm. See text for details.
The situation is very different for the N207D mutant oxidase. The data show that there is no rapid acidification observed upon initiating the oxidase reaction in the absence of the ionophores. The addition of the ionophores results in a large alkalinization of the external medium, as observed with the wild type enzyme. These data show that the N207D mutant does not pump protons. Similar results were obtained using the stopped-flow method. It should be noted that even though the N207D mutant oxidase does not pump protons, the turnover still generates a proton motive force and has a relatively high RCR by virtue of the fact that the protons and electrons used to form reduce O2 to water at the active site originate from opposite sides of the membrane.
The vesicle-reconstituted oxidases were also used to measure proton uptake from the inside of the vesicles during a single turnover in which the fully reduced enzyme reacts with O2 (data not shown). Monitoring the pH of the internal solution shows that the rate of proton uptake during the PR→F and the F→O transitions is identical to that observed with the wild type oxidase. There is no delay observed for proton uptake through the D channel.
It was previously observed that the pH-dependence of the PR→F transition in the flow-flash reaction was substantially altered by the N139D mutation (8), which also decouples the proton pump from the oxidase activity (7). Hence, the flow-flash reaction was measured at a series of pH values ranging from 6.5 to 12. Representative traces in Figure 6 show the absorbance changes at 580 nm for the N207D mutant at pH 10.4 and at pH 7.4. The absorbance of 580 nm monitors the F intermediate, whish is observed in each case to increase at short times, and then decay at longer times. These data yield the rates of the PR→F and the F→O transitions. It is noted that the amplitude of the absorbance change at 580 nm is similar for the N207D and wild type oxidase. This amplitude is also very sensitive to the extent of reduction of heme a. Hence, these data imply that the equilibrium distribution of the electron between CuA and heme a is the same in both the N207D and the wild type oxidases.
Figure 6.
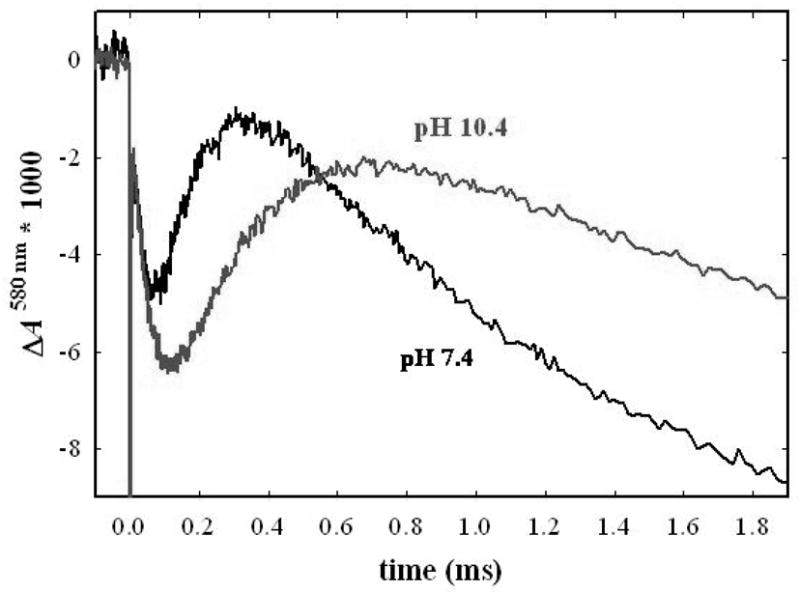
Row-flash kinetics of the N207D mutant at pH 7 and at pH 10.4. In each case, the CO adduct of the fully reduced enzyme was mixed with O2-saturated buffer and the reaction was initiated by laser photolysis. The absorption changes at 580 nm are shown, monitoring the formation (increase) and subsequent decay (downward) of the F intermediate. These kinetics are fit to give the rates of the PR→F and F→O transitions.
Figure 7A shows the plot of the rates of the PR→F and the F→ O transitions for both the wild type and mutant oxidases as a function of pH. As previously shown, the PR→transition of the wild type oxidase has an apparent pKa of about 9.4 (30). The pH-profile of the N207D mutant shows an apparent pKa between pH 8 and pH 9 which does not appear in the wild type oxidase. Above pH 9, the rate of the PR→F transition appears virtually independent of pH. This is qualitatively similar to the behavior of the N139D mutant oxidase, which also has a high rate of the PR→F transition even at pH 11, where the rate for the wild type PR→F transition is negligible (Figure 7A). The data for N139D and the wild type have been interpreted in terms of a single pKa of E286 controlling the rate of the PR→F transition. In the case of the N207D mutant, it appears that the apparent pKa of E286 is shifted to a pH value > 12.5, and that the rate is also now partially dependent on the titration of a second group whose pKa is about 8.5.
Figure 7.

pH-dependence of the PR→F transition (Panel A, left) and the F→O transition (Panel B, right) of the wild type and N207D mutant oxidases. In both cases, the N207D oxidase deviates from the pattern observed for the wild type oxidase at high pH values. This is ascribed to an increase of the apparent pKa of E286.
Figure 7B shows the pH-dependence of the F →O transition for the wild type and N207D mutant oxidases. The F →O transition requires the delivery of a proton through the D channel to reprotonate E286 prior to the transfer of the proton from E286 to the active site. The pH profile of the wild type oxidase exhibits inflection points near pH 6.3 and pH 9.4. The inflection at pH 6.3 has been speculated to be due to the titration of the heme a3 D-ring propionate (31), and this is not altered by the N207D mutation. The apparent pKa at pH 9.4 is interpreted as being due to E286, and this is clearly perturbed by the N207D mutation. The data from the F →O transition indicate that the pKa of E286 is increased, consistent with the conclusion from the pH profile of the PR→F transition (Figure 7A). The rate of the F →O transition remains near 300 s−1 between pH 11 and pH 12. It is shown in Figure 8 that the alteration of the pH profile of the F→O transition is also observed with the N139D decoupling mutant oxidase. In this case, the F→O transition is essentially independent of pH up to at least pH 11, and is near 1000 s−1. Hence, the decoupling of the proton pump that is observed with both the N207D and N139D mutant oxidases, correlates with the high rates of both the PR→F and the F→O transitions at alkaline pH values, observed with both mutants. The increased rates of both the PR→F and the F→O transitions can be ascribed to an increase in the apparent pKa of E286.
Figure 8.
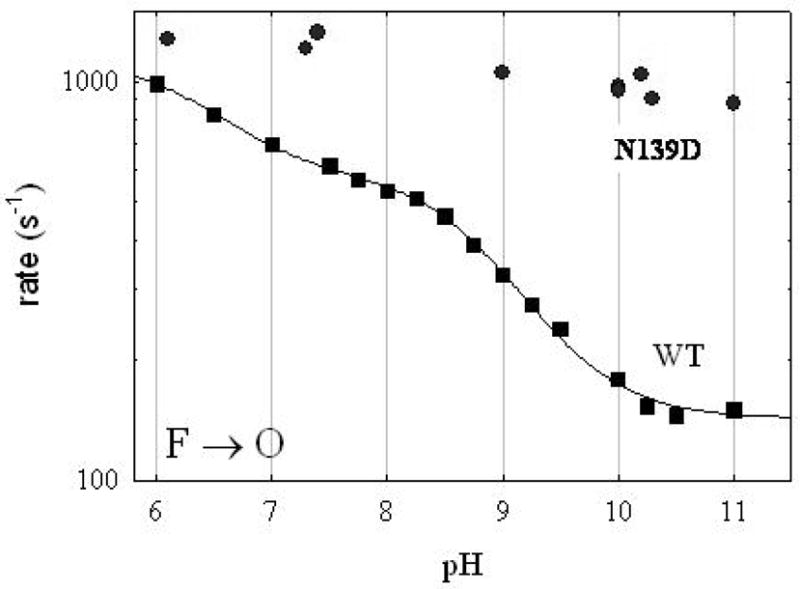
pH-dependence of the F→O transition of the wild type oxidase compared to that of the N139D mutant oxidase. The rate of the F→O transition of the N139D mutant oxidase is virtually independent of pH from pH 6.5 to 11.
One possible explanation of the shift in the apparent pKa of E286 is that there is a conformational change induced by the mutations and propogated through the chain of water molecules that connect both N139 and N207 to E286, which is 20 Å away. This can be directly addressed by FTIR difference spectroscopy, by monitoring changes in the carbonyl stretching frequency of protonated E286 due to redox changes in the protein. Recently, it was shown that the fully reduced-minus-oxidized FTIR difference spectrum of the N139D mutant oxidase exhibits a shift of 2 cm−1 in the trough due to the absorbance of the E286 protonated carboxyl group in the fully oxidized state of the enzyme, and this was confirmed by observation of the same shift in the N207D mutant(73). Figure 9 shows the PM-minus-fully oxidized (PM-O) FTIR difference spectrum of the wild type and the N207D mutant oxidases. The inset shows the region containing the C=O stretch of E286. The absorption differences are considerably smaller than observed in the R4-O difference spectra (13) and, consequently, it is not possible to definitively demonstrate the small shift of the spectrum of the oxidized enzyme that is observed in the fully reduced-minus-oxidized difference spectrum. The PM-O difference spectra each show a peak/trough at about 1735 cm−1/l745 cm−1. These spectroscopic features are identical to those previously reported for the PM-O difference spectrum of the wild type oxidase from Paracoccus denitrificans (32, 33), but are different from the PM-O difference spectrum previously reported for the R. sphaeroides oxidase (27). The spectrum previously obtained for the R. sphaeroides enzyme showed only the prominent trough at 1745 cm−1 and not the positive feature that is apparent in the spectra in Figure 9. Nevertheless, for all the enzyme preparations used in the current work, the peak/trough of 1735 cm−1/l745 cm−1 was reproducible for both the wild type and N207D oxidases. The data indicate that the carboxyl group of E286 in both the wild type and N207D oxidases remains protonated in both the fully oxidized and in the PM states.
Figure 9.

The PM-minus-O ATR-FTIR difference spectra of wild type cytochrome oxidase from R. sphaeroides and of the N207D mutant oxidase. Inset shows the carboxylic acid region of the spectra where the C=O stretching vibration of protonated carboxyls is typically observed. These difference spectra were obtained using perfusion buffers containing 1 mM ferricyanide (oxidized state of the enzyme) and a 1:1 mixture of CO/O2 bubbled into this buffer (PM state of the enzyme). Between each transition, the enzyme was reduced by perfusion with buffer containing 3 mM dithionite. Each spectrum is an average of 12–24 spectra, each constructed by co-addition of 1024 interferograms from 2–4 different samples.
Discussion
It is shown in this work that the N207D mutation of the R. sphaeroides oxidase completely eliminates proton pumping. Hence, the same phenotype is observed by replacing either N139 or N207 by an aspartic acid. This confirms the observation initially reported for the equivalent mutants in the oxidase from P. denitrificans. As shown in Figure 1, N139 and N207 are both part of a constricted region of the D channel, just above the entrance residue, D132. Crystallographically observed water molecules trace the proton-conducting pathway from D132 up to the D286, at the other end of the D channel. This water chain passes through the neck region consisting of N139, N207 and N121. Preliminary studies have shown that replacing the third asparagine by an aspartate also decouples the proton pump (Zhu et al, unpublished). Whether the decoupling of the proton pump requires an acidic or ionizable group at this location is not yet known.
Studies of the N139D mutant demonstrated that the pH profile of the PR→F transition, observed in the reaction of the fully reduced oxidase with O2 is perturbed compared to the wild type. The PR→F transition is a pure proton transfer from E286 to the oxygenated heme a3/CuB active site of the enzyme. The pH-dependence of this proton transfer rate is proportional to the degree of protonation of E286. In the wild type oxidase, the pH profile of the PR→F transition indicates an apparent pKa of 9.4, and in the N139D mutant, this is shifted to a value > 11. The increase in the proton affinity of E286 was suggested as the direct cause for the lack of proton pumping. If the putative proton acceptor in the exit channel of the proton pump has a pKa of about 11, then raising the pKa of the proton donor (E286) would reduce the driving force and, hence, the rate, of proton transfer of the pumped proton. This idea gained support by the examination of the double mutant, N139D/D132N, in which a second mutation (D132N) has been introduced in the N139D background. The introduction of this second mutant restores proton pumping and also restores the pH profile of the PR→F transition to that observed with the wild type oxidase (11).
The major contribution of the current work is to demonstrate that the N207D mutation also results in increasing the apparent pKa of E286, as judged by the pH profile of the PR→F transition. The pH profile is more complicated than observed for N139D, but the main point is that between pH 9 and pH 12, the rate of the PR→F transition does not significantly change (about 3500 s−1) (Figure 7A). This is clearly very different from the behavior of the wild type, where the rate is limited by the degree of protonation of E286, which exhibits an apparent pKa of 9.4. These data lend further support for the proposal that the decoupling mutations influence proton pumping by altering the apparent pKa of a residue that is 20 Å distant.
The increase in the apparent pKa of E286 is also reflected in the pH profile of the rate of the F→O transition (Figure 7B). The F→O transition of the wild type oxidase has been analyzed as reflecting the titrations of two residues, the D-ring propionate of heme a3 with a pKa of 6.3 (31) and E286, with a pKa of 9.4(30). The pH profile of the rate of the F→O transition of the N207D mutant exhibits the same inflection at pH 6.3, but the apparent pKa at 9.4 is not observed. This is explained as an increase of the proton affinity of E286.
The pH profile of the rate of the F→O transition of the N139D mutant was also measured (Figure 8), and the data exhibit little or no pH-dependence observed from pH 6 to pH 11, remaining at about 1000 s−1 throughout this pH range. The apparent pKa of E286 must be > 11 in the N139D mutant to be consistent with these data. The N139D mutant clearly also eliminates the pH-dependence of the F→O transition observed below pH 8 which was previously speculated to be due to the titration of one of the heme propionates(31). The cause of this effect by the N139D mutation is not clear, nor is it known why this is not observed with the N207D mutation.
The PR→F and the F→O transitions each require the delivery of a proton to the active site from E286. The fact that the rate of the F→O transition is 1000 s−1 at pH 11 in the N139D mutant, means that the reaction is not limited by the simple diffusion of a proton from the bulk medium to the entrance of the D channel. This would require a second order rate of proton transfer to the enzyme of about 1014 M−1S−1, which is far higher than the rate constant for diffusion of protons in bulk solution, about 1010 M−1S−1. In both the N139D and N207D mutants, an aspartate is introduced near D132. Simultaneous deprotonation of both D132 and D139 would be very unfavorable, perhaps leaving a proton within the D channel even at very high pH. The same would be true of D132 and D207, though perhaps to a lesser extent since these residues are not as close to each other. The presence of a second proton within the D channel, in addition to that on E286, could explain the rapid rate of the F→O transition at pH 11 or pH 12. In addition, the network of protonatable residues on the protein surface, a proton antenna, can provide a source for rapidly delivered protons to the entrance of the D channel. Strong evidence supporting the presence of a proton antenna surrounding the entrance of the D channel has been presented previously (34, 35).
The rate of proton uptake from solution was directly measured for the PR→F and the F→O transitions for the N207D mutant at pH 7.8 (Figure 3). The time-course of proton uptake is identical to that of the wild type oxidase. Hence, the decoupling effect of the N207D mutation is not due to a defect in proton uptake from solution into the D channel.
The fact that both the N207D and N139D mutations result in increasing the apparent pKa of E286 leaves open the question of the mechanism by which this occurs. The mutations are each located about 20 Å away from E286, making an electrostatic effect dubious. Electrostatic calculations on the equivalent of the N139D mutation in the oxidase from P. denitrificans indicate that the introduced aspartate will have little influence on the pKa of E286 (E278 in the P. denitrificans oxidase)(12). The electrochemical data (Figure 4) show that the N207D mutant does not alter the midpoint potentials of either of the hemes, so an effect mediated by the metal centers can be ruled out. It is interesting that the D132N mutant also does not alter the electrochemical behavior of the hemes. There is one report(36) that the equivalent mutant in the oxidase from P. denitrificans causes the midpoint potential of heme a to shift higher by 150 mV. This is likely in error, since there is no effect observed in the R. sphaeroides oxidase.
There is recent evidence showing a change in the immediate environment of E286 caused by the introduction of either the N139D or the N207D mutations. Each of these mutations perturbs the FTIR absorbance of the protonated carboxyl group of E286 in the fully oxidized enzyme, made apparent in the FTIR difference spectrum between the fully reduced and fully oxidized states of the enzyme(37). It is most likely that this represents a structural perturbation propagated through the chain of water molecules than define the D channel and connect both N139 and N207 to E286. However, the small wavelength shift observed represents a change in the energy of the carbonyl bond vibration that is much smaller than the free energy required to shift the pKa of E286 by 1.5 or more pH units. It remains to be demonstrated that the shift in the apparent pKa of E286 is the cause of the decoupling of the proton pump. At this time, all that can be stated definitely is that the pKa-shift and the decoupling of the proton pump are correlated.
In the current work, an effort was made to examine whether any structural change could also be detected in the FTIR difference spectrum between the PM and fully oxidized states of the enzyme. The data in Figure 9 show no discernable differences between the spectra of the wild type and the N207D mutant oxidases. The magnitude of the FTIR absorption changes in the PM-minus-O difference spectra are more than 10-fold less than those observed in the reduced-minus-oxidized FTIR difference spectra. For this reason, any differences between the wild type and mutant will be much more difficult to resolve in the PM-minus-O difference spectra than in the reduced-minus-oxidized FTIR difference spectra.
Surprisingly, in the current work, the PM-O difference spectra exhibit a positive band at 1738 cm−1. This is different from the previously published spectra of the R. sphaeroides oxidase, in which this positive band was absent (27). The reason for the discrepancy is not known and it could be dependent on the enzyme preparation. However, the PM-minus-O difference spectrum (Figure 9) is virtually identical to those reported for the closely related oxidase from P. denitrificans (32, 33). The spectra in the current work, as well as those presented for the P. denitrificans oxidase, indicate that E286 remains protonated in the PM state.
Summary
The N207D mutant oxidase has properties much like the previously reported N139D oxidase. These mutants do not pump protons. In addition, in the reaction of the fully reduced enzyme with O2, the rates of both the PR→F and F→O transitions suggest that the apparent pKa of E286 is shifted substantially higher than in the wild type oxidase. The data support the proposal that the decoupling of the proton pump is likely the direct result of the increased proton affinity of E286 resulting from a perturbation of the structure in the immediate vicinity of E286, perhaps caused by a perturbation of the location and or orientation of water molecules within the D channel that lie between the site of the mutations and E286. Studies with additional decoupling mutants will be required to further test this proposal.
Footnotes
Abbreviations: CCCP, carbonyl cyanide p-(trifluromethoxy) phenylhydrazone; TMPD, N,N,N′,N′-tetramethyl-p-phenylenediamine; DM, n-dodecyl β-D-maltoside; Ni-NTA, nickel nitrilotriacetic acid; HEPES, 4-(2-hydroxyethyl)piperazine-1-ethanesulfonic acid; COV, cytochrome oxidase vesicles.
References
- 1.Wikström M, Verkhovsky MI. Towards the Mechanism of Proton Pumping by the Haem-copper Oxidases. Biochim Biophys Acta. 2006 doi: 10.1016/j.bbabio.2006.01.010. in press. [DOI] [PubMed] [Google Scholar]
- 2.Wikström M. Cytochrome c Oxidase: 25 Years of the Elusive Proton Pump. Biochim Biophys Acta. 2004;1655:241–247. doi: 10.1016/j.bbabio.2003.07.013. [DOI] [PubMed] [Google Scholar]
- 3.Verkhovsky MI, Belevich I, Bloch DA, Wikstrom M. Elementary steps of proton translocation in the catalytic cycle of cytochrome oxidase. Biochim Biophys Acta. 2006;1757:401–7. doi: 10.1016/j.bbabio.2006.05.026. [DOI] [PubMed] [Google Scholar]
- 4.Branden G, Gennis RB, Brzezinski P. Transmembrane proton translocation by cytochrome c oxidase. Biochim Biophys Acta. 2006 doi: 10.1016/j.bbabio.2006.05.020. [DOI] [PubMed] [Google Scholar]
- 5.Michel H. Cytochrome c Oxidase: Catalytic Cycle and Mechanisms of Proton Pumping - A Discussion. Biochemistry. 1999;38:15129–15140. doi: 10.1021/bi9910934. [DOI] [PubMed] [Google Scholar]
- 6.Yoshikawa S. A Cytochrome c Oxidase Proton Pumping Mechanism that Excludes the O2 Reduction Site. FEBS Letters. 2003;555:8–12. doi: 10.1016/s0014-5793(03)01098-6. [DOI] [PubMed] [Google Scholar]
- 7.Pawate ASJM, Namslauer A, Mills DA, Brzezinski P, Ferguson-Miller S, Gennis RB. A Mutation in Subunit I of Cytochrome Oxidase from Rhodobacter sphaeroides Results in an Increase in Steady-State Activity But Completely Eliminates PRoton Pumping. 2002 doi: 10.1021/bi026582+. [DOI] [PubMed] [Google Scholar]
- 8.Namslauer A, Pawate A, Gennis RB, Brzezinski P. Redox-Coupled Proton Translocation in Biological Systems: Proton Shuttling in Cytochrome c Oxidase. Proc Natl Acad Sci USA. 2003;100:15543–15547. doi: 10.1073/pnas.2432106100. [DOI] [PMC free article] [PubMed] [Google Scholar]
- 9.Siletsky SA, Pawate AS, Weiss K, Gennis RB, Konstantinov AA. Transmembrane Charge Separation During the Ferryl-oxo Ø Oxidized Transition in a Nonpumping Mutant of Cytochrome c Oxidase. J Biol Chem. 2004;279:52558–52565. doi: 10.1074/jbc.M407549200. [DOI] [PubMed] [Google Scholar]
- 10.Pfitzner U, Hoffmeier K, Harrenga A, Kannt A, Michel H, Bamberg E, Richter O-MH, Ludwig B. Tracing the D-Pathway in Reconstituted Site-Directed Mutants of Cytochrome c Oxidase fromParacoccus denitrificans. Biochemistry. 2000;39:6756–6762. doi: 10.1021/bi992235x. [DOI] [PubMed] [Google Scholar]
- 11.Brändén G, Pawate AS, Gennis RB, Brzezinski P. Controlled Uncoupling and Recoupling of Proton Pumping in Cytochrome c Oxidase. Proc Natl Acad Sci U S A. 2006;103:317–22. doi: 10.1073/pnas.0507734103. [DOI] [PMC free article] [PubMed] [Google Scholar]
- 12.Olkhova E, Helms V, Michel H. Titration Behavior of Residues at the entrance of the D-Pathway of Cytochromec Oxidase from Paracoccus denitrificans Investigated by Continuum Electrostatic Calculations. Biophysical Journal. 2005;89:2324–2331. doi: 10.1529/biophysj.105.062091. [DOI] [PMC free article] [PubMed] [Google Scholar]
- 13.Vakkasoglu AS, Morgan JE, Han D, Pawate AS, Gennis RB. Mutations which decouple the proton pump of the Cytochrome c oxidase from Rhodobacter sphaeroides perturb the environment of glutamate 286. FEBS Lett. 2006;580:4613–7. doi: 10.1016/j.febslet.2006.07.036. [DOI] [PubMed] [Google Scholar]
- 14.Sistrom WR. The Kinetics of the Synthesis of Photopigments in Rhodopseudomonas sphaeroides. J Gen Microbiol. 1962;28:607–616. doi: 10.1099/00221287-28-4-607. [DOI] [PubMed] [Google Scholar]
- 15.Mitchell DM, Gennis RB. Rapid Purification of Wildtype and Mutant Cytochrome c Oxidase from Rhodobacter sphaeroides by Ni2+-NTA Affinity Chromatography. FEBS Lett. 1995;368:148–150. doi: 10.1016/0014-5793(95)00626-k. [DOI] [PubMed] [Google Scholar]
- 16.Hiser C, Mills DA, Schall M, Ferguson-Miller S. C-Terminal Truncation and Histidine-tagging of Cytochrome c Oxidase Subunit II Reveals the Native Processing Site, Shows Involvement of the C-terminus in Cytochrome c Binding, and Improves the Assay for Proton Pumping. Biochemistry. 2001;40:1606–1615. doi: 10.1021/bi0018988. [DOI] [PubMed] [Google Scholar]
- 17.Zickermann V, Verkhovsky M, Morgan J, Wikström M, Anemüller S, Bill E, Steffens GCM, Ludwig B. Perturbation of the CuA Site in Cytochrome-c Oxidase of Paracoccus denitrificans by Replacement of Met227 With Isoleucine. Eur J Biochem. 1995;234:686–693. doi: 10.1111/j.1432-1033.1995.686_b.x. [DOI] [PubMed] [Google Scholar]
- 18.Blair DR, Ellis J, Walther R, Wang H, Gray HB, Chan SI. Spectroelectrochemical Study of Cytochrome c Oxidase: pH and Temperature Dependences of the Cytochrome Potentials. J Biol Chem. 1986;261:11524–11537. [PubMed] [Google Scholar]
- 19.Nicholls P, Wrigglesworth JM. Routes of Cytochrome a3 Reduction. The Neoclassical Model Revisited. Annals of the N Y Acad Sci. 1988;550:59–67. doi: 10.1111/j.1749-6632.1988.tb35323.x. [DOI] [PubMed] [Google Scholar]
- 20.Jasaitis A, Verkhovsky ML, Morgan JE, Verkhovskaya ML, Wikström M. Assignment and Charge Translocation Stoichiometries of the Major Electrogenic Phases in the Reaction of Cytochrome c Oxidase with Dioxygen. Biochemistry. 1999;38:2697–2706. doi: 10.1021/bi982275l. [DOI] [PubMed] [Google Scholar]
- 21.Rigaud J-L, Mosser G, Lacapere J-J, Olofsson A, Levy D, Ranck J-L. Bio-Beads: An Efficient Strategy for Two-Dimensional Crystallization of Membrane Proteins. J Struct Biol. 1997;118:226–235. doi: 10.1006/jsbi.1997.3848. [DOI] [PubMed] [Google Scholar]
- 22.Sarti P, Jones MG, Antonini G, Malatesta F, Colosimo A, Wilson MT, Brunori M. Kinetics of Redox-linked Proton Pumping Activity of Native and Subunit III-depleted Cytochrome c Oxidase: A Stopped-flow Investigation. Proc Natl Acad Sci USA. 1985;82:4876–4880. doi: 10.1073/pnas.82.15.4876. [DOI] [PMC free article] [PubMed] [Google Scholar]
- 23.Hummel BC. A modified spectrophotometric determination of chymotrypsin, trypsin, and thrombin. Can J Biochem Physiol. 1959;37:1393–9. [PubMed] [Google Scholar]
- 24.Verkhovsky MI, Morgan JE, Wikström M. Control of Electron Delivery to the Oxygen Reduction Site of Cytochrome c Oxidase: A Role for Protons. Biochemistry. 1995;34:7483–7491. doi: 10.1021/bi00022a023. [DOI] [PubMed] [Google Scholar]
- 25.Brändén M, Sigurdson H, Namslauer A, Gennis RB, Ädelroth P, Brzezinski P. On the Role of the K-proton Transfer Pathway in Cytochrome c Oxidase. PNAS. 2001;98:5013–5018. doi: 10.1073/pnas.081088398. [DOI] [PMC free article] [PubMed] [Google Scholar]
- 26.Nyquist RM, Heitbrink D, Bolwien C, Wells TA, Gennis RB, Heberle J. Perfusion-induced Redox Differences in Cytochrome c Oxidase: ATR/FT-IR Spectroscopy. FEBS Letters. 2001;505:63–67. doi: 10.1016/s0014-5793(01)02769-7. [DOI] [PubMed] [Google Scholar]
- 27.Nyquist RM, Heitbrink D, Bolwien C, Gennis RB, Heberle J. Direct Observation of Protonation Reactions During the Catalytic Cycle of Cytochrome c Oxidase. Proc Natl Acad Sci USA. 2003;100:8715–8720. doi: 10.1073/pnas.1530408100. [DOI] [PMC free article] [PubMed] [Google Scholar]
- 28.Iwaki M, Breton J, Rich PR. ATR-FTIR Difference Spectroscopy of the PM Intermediate of Bovine Cytochrome c Oxidase. Biochim Biophys Acta. 2002;1555:116–121. doi: 10.1016/s0005-2728(02)00265-7. [DOI] [PubMed] [Google Scholar]
- 29.Salomonsson L, Faxen K, Adelroth P, Brzezinski P. The timing of proton migration in membrane-reconstituted cytochrome c oxidase. Proc Natl Acad Sci U S A. 2005;102:17624–9. doi: 10.1073/pnas.0505431102. [DOI] [PMC free article] [PubMed] [Google Scholar]
- 30.Namslauer A, Aagaard A, Katsonouri A, Brzezinski P. Intramolecular Proton-Transfer Reactions in a Membrane-Bound Proton Pump: The Effect of pH on the Peroxy to Ferryl Transition in Cytochrome c Oxidase. Bichemistry. 2003;42:1488–1498. doi: 10.1021/bi026524o. [DOI] [PubMed] [Google Scholar]
- 31.Brädén G, Brädén M, Schmidt B, Mills DA, Ferguson-Miller S, Brzezinski P. The Protonation State of a Heme Propionate Controls Electron Transfer in Cytochrome c Oxidase. Biochemistry. 2005;44:10466–10474. doi: 10.1021/bi0502745. [DOI] [PubMed] [Google Scholar]
- 32.Iwaki M, Puustinen A, Wikström M, Rich PR. ATR-FTIR Spectroscopy of the PM and F Intermediates of Bovine and Paracoccus denitrificans Cytochrome c Oxidase. Biochemistry. 2003;42:8809–8817. doi: 10.1021/bi034522d. [DOI] [PubMed] [Google Scholar]
- 33.Iwaki M, Puustinen A, Wikstrom M, Rich PR. ATR-FTIR Spectroscopy and isotope labeling of the PM intermediate of Paracoccus denitrificans cytochrome c oxidase. Biochemistry. 2004;43:14370–8. doi: 10.1021/bi048545j. [DOI] [PubMed] [Google Scholar]
- 34.Marantz Y, Nachliel E, Aagaard A, Brzezinski P, Gutman M. The Proton Collecting Function of the Inner Surface of Cytochrome c Oxidase from Rhodobacter sphaeroides. Proc Natl Acad Sci USA. 1998;95:8590–8595. doi: 10.1073/pnas.95.15.8590. [DOI] [PMC free article] [PubMed] [Google Scholar]
- 35.Marantz Y, Einarsdóttir Ó, Nachliel E, Gutman M. Proton-collecting Properties of Bovine Heart Cytochrome c Oxidase: Kinetic and Electrostatic Analysis. Biochemistry. 2001;40:15086–15097. doi: 10.1021/bi010453w. [DOI] [PubMed] [Google Scholar]
- 36.Ruitenberg M, Kannt A, Bamberg E, Fendler K, Michel H. Reduction of Cytochrome c Oxidase by a Second Electron Leads to Proton Translocation. Nature. 2002;417:99–102. doi: 10.1038/417099a. [DOI] [PubMed] [Google Scholar]
- 37.Vakkasoglu A, Morgan JE, Han D, Pawate A, Gennis RB. ATR-FTIR Investigation of a Possible Conformational Change in the Vicinity of Glu286 Resulting from the Asn139Asp Mutation which Decouples the Proton Pump of the Cytochrome c Oxidase from Rhodobacter shpaeroides. FEBS Lett. 2006 doi: 10.1016/j.febslet.2006.07.036. in press. [DOI] [PubMed] [Google Scholar]
- 38.Humphrey W, Dalke A, Schulten K. VMD: Visual Molecular Dynamics. J Mol Graph. 1996;14:33–38. doi: 10.1016/0263-7855(96)00018-5. [DOI] [PubMed] [Google Scholar]
- 39.Svensson-Ek M, Abramson J, Larsson G, Tornroth S, Brzezinski P, Iwata S. The X-ray Crystal Structures of Wild-type and EQ(I-286) Mutant Cytochrome c Oxidases from Rhodobacter sphaeroides. J Mol Biol. 2002;321:329–339. doi: 10.1016/s0022-2836(02)00619-8. [DOI] [PubMed] [Google Scholar]