Abstract
The genomic era has seen a remarkable increase in the number of genomes being sequenced and annotated. Nonetheless, annotation remains a serious challenge for compositionally biased genomes. For the preliminary annotation, popular nucleotide and protein comparison methods such as BLAST are widely employed. These methods make use of matrices to score alignments such as the amino acid substitution matrices. Since a nucleotide bias leads to an overall bias in the amino acid composition of proteins, it is possible that a genome with nucleotide bias may have introduced atypical amino acid substitutions in its proteome. Consequently, standard matrices fail to perform well in sequence analysis of these genomes. To address this issue, we examined the amino acid substitution in the AT-rich genome of Plasmodium falciparum, chosen as a reference and reconstituted a substitution matrix in the genome's context. The matrix was used to generate protein sequence alignments for the parasite proteins that improved across the functional regions. We attribute this to the consistency that may have been achieved amid the target and background frequencies calculated exclusively in our study. This study has important implications on annotation of proteins that are of experimental interest but give poor sequence alignments with standard conventional matrices.
INTRODUCTION
The success of the genome project in sequencing the Plasmodium falciparum genome in the year 2002 (1) has given a tremendous boost to malaria research to tackle this insidious microbe. The parasite is relatively distant to other eukaryotes with most of its encoded proteins lacking any notable sequence similarity to other organisms. Due to its extreme genome bias (>80% AT-rich), annotation was cumbersome, with 60% of the postulated 5279 genes left unannotated as these failed to show sequence match to known genes (2). Mass spectrometry studies have identified authentic peptides corresponding to many of these unannotated genes (2), raising the possibility of either a sequence divergence in P. falciparum or the presence of exceptional genes with novel functions.
The preliminary analysis in the process of gene annotation is purely alignment based, weighed both at nucleotide and amino acid levels. Mutations within the DNA are often synonymous that lead to an over-estimation of divergence when nucleotide alignment methods are used. Alignments involving protein are thus more preferable. FASTA (3) and BLAST (4), the two most widely used alignment tools make use of amino acid substitution matrices to score protein alignments, e.g. PAM (5, 6) and BLOSUM (7). The matrix consists of log-likelihood scores that reflect how likely one amino acid is substituted over the other. These matrices are constructed from sequence data having standard background frequencies and are thus not appropriate for the comparison of compositionally drifted proteins. The use of standard matrices for comparison of proteins with nonstandard compositions was thus argued for a long time, though no appropriate solution was immediately available to tackle this issue (8–10). However, a new rationale for the compositional adjustment of amino acid substitution matrices was proposed (9, 10), where the target frequencies of the standard matrices were transformed to frequencies appropriate in a nonstandard context. There was yet another article in the course of our present work, where the authors had proposed a method for the construction of nonsymmetric matrices for proteins with biased amino acid distribution, where they have basically compared sequence pairs from two different genomes (11). These asymmetric matrices are considered superior to symmetric matrices in the light of evolution.
Considering the scoring system for proteins, usually identical residues and conservative substitutions have positive values in the matrix. Rare substitutions are given a negative score and are penalized by alignment programs (12). Since P. falciparum has apparently diverged from other organisms, rare substitutions are expected in this organism. This may be one of the reasons why alignment programs fail to show good homology for majority of the parasite's proteins with the standard matrices. In the light of the fact that a nucleotide bias causes a genome wide bias in the amino acid composition of proteins (13), we initially studied how the amino acid composition is driven by a nucleotide bias in the two diverse genomes, i.e. P. falciparum and Mycobacterium tuberculosis. We further explored what amino acids are substituted in ortholog proteins of the parasite compared to its distant relatives and how these changes affect P. falciparum specific substitution matrices.
In this article, we have shown that for biased genomes, substitution matrices derived from a unique ortholog set of proteins is more appropriate for organism-related sequence searches, as it is expected to resolve the enigma of inconsistent background and target frequencies. This we have demonstrated for P. falciparum with the PfSSM (Plasmodium falciparum specific substitution matrix) series of symmetric and nonsymmetric matrices. The performance of these matrices is validated and reported in terms of the alignment quality and statistics obtained for some of the P. falciparum proteins.
METHODS
Amino acid composition and codon usage studies
To understand the role of nucleotide bias on the amino acid and codon usage of an organism, we selected the GC- and AT-rich genomes of M. tuberculosis and P. falciparum, respectively for comparison. A complete list of P. falciparum proteins was obtained from the ftp site (ftp://ftp.ncbi.nih.gov/genomes/Plasmodium_falciparum/) at NCBI (http://www.ncbi.nlm.nih.gov/). The incomplete annotations (putative, predicted and hypothetical) were filtered out to give a final set of 302 proteins. A protein BLAST (version 2.2.10) was performed with this set of annotated proteins as query against the M. tuberculosis proteins at an E-value of 10−5. An exclusive set of 88 protein hits was achieved for which the amino acid composition was calculated per protein using a Perl code. The statistical t-test for correlated samples was performed for each amino acid fraction obtained from this set for these organisms. A simple Perl script was written for calculating codon frequencies coding each amino acid. The corresponding coding regions of the 88 protein orthologs were used for the purpose. The ptt and ffn files at NCBI's ftp site were used to retrieve the same for both the genomes.
Correlation studies of AT-rich codons across genomes
The protein files for the seven organisms used in this study namely, M. tuberculosis, Treponema pallidum, Escherchia coli K12, Helicobacter pylori, Lactobacillus johnsonii, Mycoplasma mycoides and P. falciparum were downloaded from NCBI's ftp site (ftp://ftp.ncbi.nih.gov/genomes/). A protein blast was performed for the 302 completely annotated proteins (proteins that were not putative, hypothetical or predicted) of P. falciparum versus the rest of the organisms. A set of 36 proteins common to all organisms were picked, that had similar annotations. The corresponding coding sequences were downloaded for all genomes through ftp. These nucleotide sequences were used to calculate the AT-rich codon compositions with respect to different codon positions. A Perl script was written for the same.
Statistical tests
All the statistical tests used here like ANOVA and t-test was performed using VassarStats, a website for statistical computation (http://faculty.vassar.edu/lowry/VassarStats.html).
The dataset of protein orthologs
Our approach was to use a fully annotated protein set from P. falciparum and its orthologs (mostly BLAST hits having similar annotation were picked up) for the study of amino acid substitutions. For this, a complete list of P. falciparum proteins was obtained from the ftp site (ftp://ftp.ncbi.nih.gov/genomes/Plasmodium_falciparum/) of NCBI (http://www.ncbi.nlm.nih.gov/). The incomplete annotations like ‘hypothetical’, ‘probable’ and ‘predicted’ were filtered out and a set of 302 proteins was obtained. Distantly related orthologs were picked manually for this set using the genomic BLAST (blastp search against both microbial and eukaryotic genomes) at NCBI (E < 1) from 10–20 taxa representing all three domains of life. Organisms chosen as subjects were distantly related to P. falciparum.
For manual selection of the orthologs, first, only those proteins were selected that had annotation similar to the query sequence. Second, annotated hits were picked up irrespective of the order of their E-values, to get distant orthologs. Third, overrepresentation of subject hits to a particular taxonomic group was avoided, and, lastly, in case of hypothetical hits that were picked up (to represent a particular taxa that lacked an annotated hit), E-value near to zero (<10−5) and length similar to the query was considered. However, the third option was rarely used and the total hypothetical proteins constituted only 6–7% of the total sequences used to build the matrices.
Clustering was performed to remove redundancy in the ortholog protein set with BLASTCLUST program from the blast-2.2.10 package. Sequences were clustered at 90% identity over 80% of the sequence length. Proteins that showed few (proteins that gave ortholog hits to less than 10 organisms) or biased representation (proteins that gave hits to a biased group of organisms only, e.g. proteins showing hits to only Plasmodium genus) of orthologs to a particular kingdom were eliminated, reducing the working set to only 265.
Generation of blocks
Substitution matrices derived from the highly conserved regions of the protein are known to perform better in alignments and homology searches (7). We thus derived protein blocks from 265 annotated proteins of P. falciparum and their orthologs (a total of 4696 sequences) using the protomat program from the BLIMPS package obtained by anonymous ftp at the NCBI site (ftp://ftp.ncbi.nih.gov/repository/blocks/unix/blimps). This program takes a group of related proteins and produces a set of blocks (ungapped alignments) representing the group. In order to reduce the overrepresentation of amino acid pair frequencies from closely related members of a group of sequences, segment clustering within the block was performed at different clustering percentages, over the entire block width. Approximately 1500 blocks were obtained that were processed for the calculation of a substitution matrix.
Compilation of the substitution matrix
The substitution matrices were computed using a Perl script, developed by us based on Henikoff 's formalism (7). The code was slightly modified for calculating the asymmetric Pf fixed substitution matrices.
Calculating a symmetric matrix
A symmetric matrix was calculated initially where the value for the substitution pair Ai Bj (where i ≠ j) was given the same as the pair Aj Bi. E.g., if the observation count for A to L substitution is ‘x’ and that of L to A substitution is ‘y’ then it is assumed that AL = LA = (x + y) and thus the observation frequency for the pair AL or LA is (x + y/N), where N is the total number of pair observations. Consequently, all possible pair-wise substitutions have been tabulated across protein blocks in this case.
Calculating a one-way substitution matrix
Our program modified for this purpose, places the P. falciparum protein sequence as the first sequence in every block that PROTOMAT generates and then the substitutions tabulated one against all. In case of a tie between more than two sequences in eliminating sequences at block/sequence level clustering, P. falciparum sequence was retained as the cluster representative.
These matrices were generated at varying block clustering percentages of 50, 60, 70, 80 and 90; scaled to half-bit values, rounded off and named as the Smat (Symmetric matrix) series and the PfFmat (Plasmodium falciparum Fixed matrix) series, respectively. A scaled version of these matrices was also calculated by adding a constant positive number (+1 for symmetric; and, +3 for the asymmetric P. falciparum fixed substitution matrices) to all the matrix values (14). These were termed as the SSmat (symmetric scaled matrix) and the PfFSmat (Plasmodium falciparum fixed scaled matrix) series, respectively.
RESULTS AND DISCUSSION
Amino acid composition and codon usage across diverse genomes
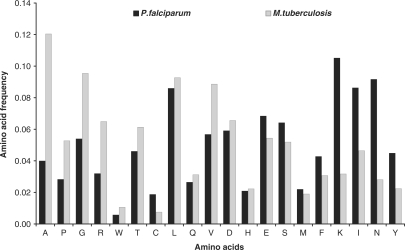
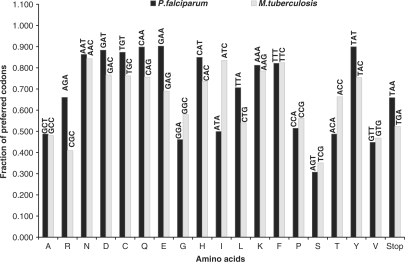
To study the role of nucleotide bias on amino acid and codon choices within a genome, we computed and compared the amino acid composition and the codon preferences of the AT-rich P. falciparum with the GC-rich M. tuberculosis genome. The average amino acid fractions were calculated for a set of 88 redundant protein orthologs from both the genomes. The amino acid fractions obtained are shown in Figure 1. Next, to study the difference in the codon choices the coding sequences for the same set of 88 proteins were retrieved and the fraction of codons coding for each individual amino acid were calculated. Henceforth, the highest represented codons for each amino acid were plotted for P. falciparum and M. tuberculosis (Figure 2). As is evident from Figure 1, the fraction of F, Y, M, I, N, K amino acids was found to be higher in P. falciparum as suggested earlier for AT-rich genomes (13). Further, the organism showed a significant increase in the fractions of E, S and C amino acids compared to the corresponding M. tuberculosis fractions. ‘E’ is one of the six most ancient amino acids that has been observed to be universally lost during evolution, which the organism seems to retain. However, it loses the other three amino acids i.e. P, A and G that are also known to be consistently lost in all three domains of life (15). This may imply that ‘E’ codons, not being GC-rich, are retained by the parasite. Moreover, the most preferred codon for ‘E’ is GAA which is AT-rich (considering all codon positions) (Figure 2). The amino acids C, M, H, S and F are acquired with time (15) and P. falciparum seems to have gained four of these amino acids in the course of evolution, as is evident from the increased fractions of C, M, S and F as compared to proteins of M. tuberculosis that branches early in evolution. Much cannot be said about the ‘H’ fractions as we fail to get a significant difference in our case. The ‘Y’ amino acid fractions are also high in P. falciparum that are commonly held to be late additions to the genetic code (16). Considering all three codon positions, P. falciparum seems to have a greater preference for possible AT-rich codons (Figure 2).
Figure 1.
Differences in the amino acid frequencies of an AT-rich and a GC-rich genome. The amino acids along the x-axis are arranged in the increasing order of the AT-richness of their respective codons. The y-axis shows the average amino acid frequencies for 88 protein orthologs from ‘P. falciparum’ and ‘M. tuberculosis’. The differences were highly significant for 75% of the amino acids viz. A, C, E, F, G, I, K, N, P, R, S, T, V, W and Y (P < 0.0001 for a two tailed t-test), quiet significant for the amino acids D, L, M, Q (P-value of 0.001–0.004) with the exception of H. The fractions of A, P, G, R, W, T and V are less in P. falciparum whereas the F, Y, I, N, K, S, E and C fractions are high compared to M. tuberculosis.
Figure 2.
Amino acid codon preferences for an AT-rich (P. falciparum) versus a GC-rich (M. tuberculosis) genome. The amino acids Met and Trp were not used for the analysis as these are coded by a single codon. The stop codons have been included though they do not code for any amino acids. Only the highly preferred codons for each amino acid have been represented for the respective organisms. The codon preferences clearly show the bias towards AT and GC codons for P. falciparum and M. tuberculosis, respectively.
Correlation studies of AT-rich codons across genomes
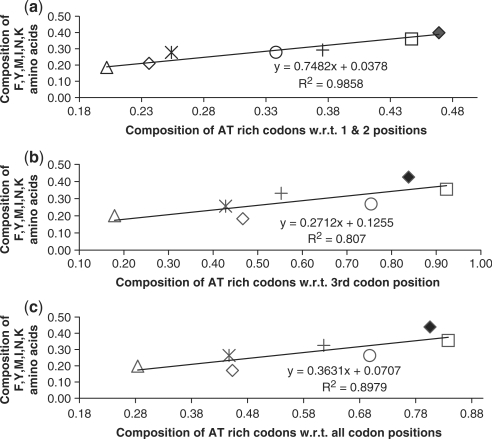
As protein evolution follows a universal trend of amino acid loss and gain, the composition of proteins is expected to vary substantially between taxa. Nucleotide bias in turn seems to cause an amino acid change (13). Acknowledging the divergence of P. falciparum, we studied the effect of AT-codon content (considering different codon positions) and its impact on the F, Y, M, I, N, K amino acid composition, known to be overrepresented in AT-rich genomes. An analysis was carried out on a set of 36 ortholog proteins and their corresponding coding regions across seven genomes (Table 1) varying in AT content. The protein dataset was used to estimate the F, Y, M, I, N, K amino acid composition. The AT-rich codon compositions with respect to the 1 and 2 codon position, i.e. AT12 (nonsynonymous), the third position, i.e. AT3 (synonymous) and all three codon positions, i.e. AT123 was calculated from the corresponding coding sequences. A correlation was calculated for the AT-rich codon fractions so obtained and the F, Y, M, I, N, K amino acid composition (Figure 3). We found that the response of the F, Y, M, I, N, K amino acid composition to AT content at the 1 and 2 codon positions was the highest (slope 0.748). Moreover, the co-efficient was maximum for AT12 (Figure 3a) indicating that the degree of variation in the F, Y, M, I, N, K amino acid usage could be well understood in terms of AT content at the 1 and 2 codon positions (R2 = 0.98), compared to AT3 (R2 = 0.80) (Figure 3b). This implies that a bias at the nonsynonymous position of a codon has affected the amino acid composition of the protein leading to a protein evolution. Conclusively, nucleotide bias in P. falciparum directs the amino acid substitution in a protein largely. However, when the total fraction of AT3 and AT12 were compared in P. falciparum, the fraction of AT3 was found to be more than 1.5 times that of AT12. This implies that though the organism allows for changes which may lead to a substitution; it still maintains a balance by having a high fraction of AT3 that would lead to only synonymous mutations.
Table 1.
List of organisms and the AT content of their respective genomes
| Organism | AT content of genome (%) |
|---|---|
| Mycobacterium tuberculosis | 34 |
| Treponema pallidum | 46 |
| Escherichia coli K12 | 48 |
| Helicobacter pylori | 60 |
| Lactobacillus johnsonii | 65 |
| Mycoplasma mycoides | 76 |
| Plasmodium falciparum | 80 |
Figure 3.
Correlation of AT-rich codon composition and F, Y, M, I, N, K amino acid frequencies. (a) A graph showing the correlation between AT12 fraction and the composition of F, Y, M, I, N, K amino acids. (b) A graph showing the correlation between AT3 fraction and the composition of F, Y, M, I, N, K amino acids. (c) A graph showing the correlation between AT123 fraction and F, Y, M, I, N, K amino acid composition. Note: the symbols used here are; M. tuberculosis (triangle), E.coliK12 (asterisk), T. pallidum (diamond), H. pylori (cross), L. johnsonii (circle), P. falciparum (solid diamond), M. mycoides (square).
Amino acid substitution in protein blocks
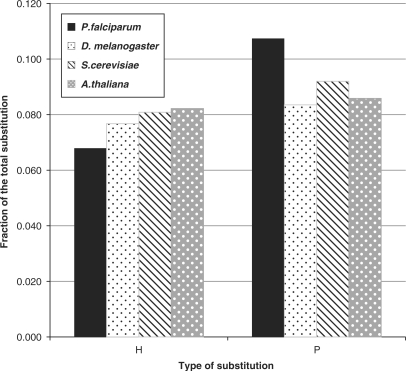
Having shown that the AT bias of the genome has important influence on amino acid choices in a biased genome, it was interesting to study what amino acid substitutions are observed for protein coding genes of P. falciparum as compared to other model genomes viz Drosophila melanogaster, Arabidopsis thaliana and Saccharomyces cerevisiae. To address this issue, we first identified 79 proteins (a subset of 265-protein ortholog set used for matrix construction) that were common across P. falciparum and the three model genomes. The protein blocks obtained from this subset was used for this study. Though there were more proteins in common, we restricted our working set to only 79, to ensure that a representative sequence was present from all four genomes at the block level and the absence of even one, eliminated the protein from our analysis. While calculating substitutions for a particular organism, the sequence depictive of that organism was made the first sequence of each block and the substitutions tabulated column wise with respect to the other sequences following it. Substitutions across different classes of amino acids, i.e. polar (S, T, Y, H, C, N, Q), hydrophobic (G, A,V, L, I, F, M, P, W) and charged amino acids (D, E, K, R), as well as substitutions within each class of the amino acids was computed and statistical tests were performed to weigh its relevance. We found that in P. falciparum, the hydrophobic amino acid fractions substituted for polar and charged amino acids were less as compared to A. thaliana, S. cerevisiae and D. melanogaster, whereas the polar amino acids substituted for the hydrophobic and charged amino acids were higher compared to the other three organisms (Figure 4).
Figure 4.
Differences in substitution across four genomes for hydrophobic and polar amino acid fraction of proteins. ‘H’ along the x-axis stands for hydrophobic residues substituted to, in the organism, for polar or charged residues. A two-tailed paired sample t-test values of P for these fractions are, P < 0.0001 for P. falciparum versus A. thaliana; P < 0.0001 for P. falciparum versus S. cerevisiae; and, P = 0.001 for P. falciparum versus D. melanogaster. ‘P’ stands for polar residues substituted to, in the organism, for charged or hydrophobic residues. The P-values for these fractions are as follows: P < 0.0001 for P. falciparum versus A. thaliana; P = 0.0006 for P. falciparum versus S. cerevisiae; P < 0.0001 for P. falciparum versus D. melanogaster.
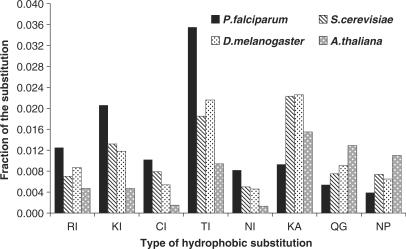
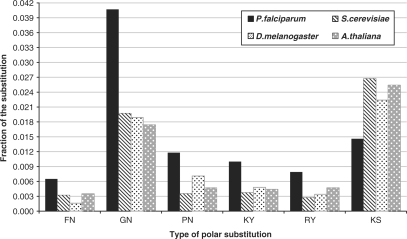
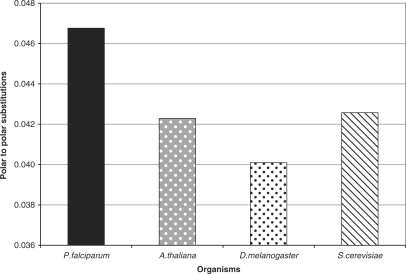
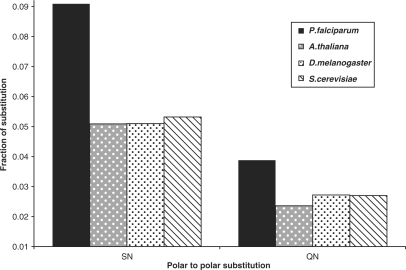
In order to understand the individual substitutions which were actually significant among these groups, we tabulated the fractions of each type of substitution for all the four organisms. Among the hydrophobic substitutions, the fractions of ‘I’ substituted for R, K, C, T and N was high in P. falciparum. On the other hand, the fractions of ‘A’ substituted for K; ‘G’ substituted for Q; and ‘P’ substituted for N was less (Figure 5). In case of the polar substitutions, the fractions of ‘N’ substituted for F, G, P; and the fractions of ‘Y’ substituted for K and R was high in P. falciparum, whereas the fractions of ‘S’ substituted for K was less (Figure 6). Among the substitutions occurring within the same class of amino acids, only the polar to polar fractions were significant (Figure 7). Among these, only the SN (N in P. falciparum substituted for S in others) and QN (N in P. falciparum substituted for Q in others) fractions were high in P. falciparum (Figure 8). All these differences were statistically significant.
Figure 5.
Type of hydrophobic substitutions significant in P. falciparum compared to other organisms. The type of hydrophobic substitutions are represented along the x-axis where, the first alphabet represents the amino acid substituted for and the second alphabet is the one substituted to in the representative organism. A one-way analysis of variance, ANOVA, for correlated samples gave a Tukey's HSD post hoc test value of P as follows; P < 0.05 for RI, CI, NI, QG, NP and P < 0.01 for KI, TI, KA, for P. falciparum versus other three organisms.
Figure 6.
Type of polar substitutions significant in P. falciparum compared to the other organisms. The type of polar substitutions are shown along the x-axis where, the first alphabet represents the amino acid substituted for and the second alphabet is the one substituted to in the representative organism. Post hoc test values of P being <0.05 for FN, PN, KY, RY and P < 0.01 for GN and KS for P. falciparum versus others.
Figure 7.
The difference in the total fraction of polar to polar substitutions across four genomes. A post hoc test P < 0.05 was obtained with ANOVA, for P. falciparum versus other organisms.
Figure 8.
Significant polar to polar substitutions across four genomes. The type of polar to polar substitutions are represented along the x-axis where, the first alphabet represents the amino acid substituted for and the second alphabet is the one substituted to, in the representative organism. A post hoc test P < 0.01 was obtained when ANOVA was performed.
Calculating a substitution matrix
Having shown that the amino acid substitution in the AT-biased P. falciparum genome could differ from other model organisms; we were interested in computing P. falciparum specific amino acid substitution matrices and study its performance. A new set of amino acid substitution matrices were constructed using protein blocks generated by PROTOMAT program (17) from 265 annotated protein sequences of P. falciparum and its orthologs based on Henikoff 's method of substitution matrix compilation (7). We generated two sets of matrices (symmetric, and, the one-way substitution/P. falciparum fixed) each of which was again a series of matrices with different clustering percentages. The symmetric matrix series follows a general BLOSUM approach of compilation wherein, an all versus all substitution was tabulated. The one-way substitution matrix on the other hand, reflects substitutions that have occurred in P. falciparum over time compared to its other orthologs. For this, P. falciparum sequence was made the first sequence of every protein block and the substitutions studied only with respect to it (one versus all). Hence, we describe it as P. falciparum fixed substitution matrix which is nonsymmetric in nature. The construction of this asymmetric matrix series is thus unique compared to earlier methods (10, 11). The overall effect of such a calculation was that only those substitutions would be counted that are observed with respect to this organism. As a result, the matrix would perform better in pair-wise alignments where P. falciparum sequence is taken as query. Bastien et al. (11) suggested a nonsymmetric matrix for comparing a pair of genomes that apparently improved the sensitivity and specificity of searches. It is also known that substitution matrices used for studying local similarities have no essential effect with the addition of a constant to all matrix values (14). We thus calculated a scaled version of the matrices as described in the methods section, such that the lowest negative value was in the range of BLOSUM and the overall average of the matrix was negative. The choice of a negative matrix average was to ensure that the alignments fell in the logarithmic region of a phase transition curve such that the alignment statistics were better understood (12).
Comparison of PfSSM and the BLOSUM series of matrices
To understand the substitution preferences of BLOSUM and PfSSM, we compared BLOSUM90 and Smat80 (symmetric matrix calculated at 80% clustering that performed best for database search) matrices having relative entropies of 1.18 and 1.16 bits, respectively. We sorted the substituting pairs in the decreasing order of their lodscore values and studied their substitution preferences as represented in Supplementary Material (Supplementary Figure S1). Noticeably, the pattern of substitution was different for both the matrices and was more evident for the rows R, N, D, C, H and K. Next, due to similar scaling of Smat80 and BLOSUM90 matrices, the lodscore values were directly compared as a difference (see Supplementary Figure S2), where the lower half-diagonal represents the BLOSUM90 lodscore values and the upper half-diagonal represents the difference in the BLOSUM90 and Smat80 matrix values. The large number of positive values in the difference matrix (upper half-diagonal of Supplementary Figure S2) shows that most of the Smat80 values are less than the corresponding values of BLOSUM90. More than half of the values along row ‘C’ which are negative, e.g. CS, CT, CA, etc. imply to the Cysteine substitutions that are more frequent in Smat80. Few of the W substitutions like WN, WH and WF are also more frequent in Smat80 matrix. To understand the difference between the best performing matrix for pairwise alignments, i.e. PfFSmat60 (Plasmodium falciparum fixed scaled matrix calculated at 60% clustering) and the BLOSUM50 matrix; the odd-ratios calculated from their respective observation frequencies were compared. Since the scaling of PfFSmat60 and BLOSUM50 matrix was not similar, lodscores could not be quantitatively compared. A similarity index was computed as a ratio of the odd-ratio of PfFSmat60 and the odd-ratio of BLOSUM50 matrix (8). The values obtained are tabulated in Supplementary Table S1, where the vertically displayed amino acids are those substituted in P. falciparum. The low ratios obtained indicate that most of the BLOSUM50 values are more than that of PfFSmat60, possibly an overrepresentation of the substitutions with respect to a biased genome like P. falciparum, except for CA and SA (row versus column), the ratios of which are greater than one. Among the least frequent substitutions, W is rarely substituted for E and P; and G for I, W and Y as compared to BLOSUM50. However, the disparity could have been better understood if PfFSmat60 was compared to a nonsymmetric matrix, which is not the case with BLOSUM50.
Comparative performance of BLOSUM and PfSSM series of matrices
To arrive at more qualitative differences, we tested the performance of the PfSSM series with alignment programs from the FASTA package (version3). We used SSEARCH (18) that uses William Pearson's implementation of the method of Smith and Waterman (19), to search the Uniprot/Swiss-Prot protein database obtained from the EBI ftp site (http://www.ebi.ac.uk/FTP/) for relevant hits to P. falciparum queries and the FASTA program for pair-wise alignments. All the alignments reported here, were performed at a gap opening and extension penalty of 12 and 2, respectively, since FASTA programs are known to work best at these parameters. The score for the best performing BLOSUM series has been reported here for comparison. For the comparison of similar entropy matrices, PAM2 (H = 3.97) and BLOSUM90 (H = 1.18) scores have been included as they have entropies close to PfFSmat60 (H = 4.67) and Smat80 (H = 1.16) matrices, respectively.
Alignment of experimentally characterized P. falciparum cyclin-3
Recently, Cyclin-3 protein of P. falciparum, PFE0920c, was experimentally characterized by a research group (20) that showed low sequence match to known cyclins. SSEARCH was performed for PFE0920c against the Uniprot/Swiss-Prot database with BLOSUM and PfSSM series. The scores for the first hit obtained with PfSSM series are given in Table 2. While BLOSUM100 (the best performing BLOSUM) gave a score of 113.3 bits at an E-value of 1.3e-24, Smat80 gave an alignment score equal to 117.8 bits for the same length of alignment overlap (124 residues) at an improved E-value of 6.1e-26. BLOSUM90 (H = 1.18) matrix with similar entropy values to Smat80 (H = 1.16) gave a score of 112.6 bits at an E-value of 2.1e-24 for a 128 amino acid overlap. The performance of Smat80 was thus better.
Table 2.
Alignment scores for PFE0920c protein of P. falciparum and yeast cyclin, P40186, with PfSSM series
| Clustering (%) | Smat | SSmat | PfFmat | PfFSmat |
|---|---|---|---|---|
| 50 | 116.4 (124) | 74.4 (128) | 106.3 (124) | 37.0a, 35.6 |
| 60 | 116.0 (124) | 75.2 (128) | 107.7 (124) | 36.7a, 35.3 |
| 70 | 116.2 (124) | 75.3 (128) | 108.2b (124) | 37.7a, 36.1 |
| 80 | 117.8b,c (124) | 79.6 (128) | 103.2 (122) | 37.9 (190) |
| 90 | 114.2 (124) | 90.1b (128) | 98.9 (124) | 39.4b (190) |
aThe scores of the first hit from a different organism.
bThe highest obtained scores for the respective columns.
cThe score for the best performing matrix series.
The first column of the table represents the clustering percentage at which the matrices (represented in the subsequent columns along the first row) were calculated. Columns 2–5 represent the alignment scores obtained for each matrix series at different clustering percentages. The value in the closed bracket is the amino acid overlap for the alignment. The values represented with ‘a’ are the cyclin family first hits obtained from a different organism and the values following it are the yeast cyclin hits which take up a second position. We did not mention the overlap lengths for these instances. The standard equivalent matrix values for each corresponding ‘b’ marked cells from column 2–5 are 112.4 (128), 96.1 (124), 101.9 (124) and 54.7(55), respectively. Smat = Symmetric matrix; SSmat = Symmetric Scaled matrix; PfFmat = Plasmodium falciparum Fixed matrix; PfFSmat =Plasmodium falciparum Fixed Scaled matrix.
A pair-wise local alignment of PFE0920c and the first hit from SSEARCH gave the best alignment score equal to 239.8 bits with PfFSmat60 at an E-value of 4.4e-68 for a 190 amino acid overlap. This spanned the entire cyclin domain of both the sequences. The alignment score with the best performing standard matrix BLOSUM50 was 119.8 bits at an E-value of 5.6e-32 (128 amino acid overlap) that failed to span the entire domain region. The score was very poor with PAM2 (H = 3.97) compared to PfFSmat60 (H = 4.67) and was equal to 16.2 bits at an E-value of 0.57. Table 3 shows the bit scores obtained for the PfSSM series with the FASTA local alignment program.
Table 3.
FASTA alignment scores for P. falciparum Cyclin, PFE0920c and yeast Cyclin protein, with PfSSM series
| Clustering (%) | Smat | SSmat | PfFmat | PfFSmat |
|---|---|---|---|---|
| 50 | 101.1 (124) | 136.8 (128) | 98.7 (124) | 238.0 (190) |
| 60 | 98.7 (124) | 135.0 (128) | 100.5a (124) | 239.8a,b (190) |
| 70 | 98.7 (124) | 135.0 (128) | 100.5a (124) | 238.0 (190) |
| 80 | 101.7a (124) | 137.9a (128) | 97.0 (122) | 226.3 (190) |
| 90 | 99.9 (124) | 136.2 (128) | 97.6 (124) | 221.6 (190) |
aThe highest obtained scores for the respective columns.
bThe score for the best performing matrix series.
The first column of the table represents the clustering (%) at which the matrices (represented in the subsequent columns along the first row) were calculated. Columns 2–5 represent the alignment scores obtained for each matrix series at different clustering percentages. The values in the closed brackets are the amino acid overlap for the alignment. The standard equivalent matrix values for each corresponding ‘a’ marked cells from columns 2–5 are 99.3 (128), 97 (124), 94.1 (124), 16.2 (11), respectively. Smat = Symmetric matrix; SSmat = Symmetric Scaled matrix; PfFmat = Plasmodium falciparum Fixed matrix; PfFSmat =Plasmodium falciparum Fixed Scaled matrix.
Alignment of a hypothetical protein, a probable DnaJ ortholog
The P. falciparum protein, PFB0090c, annotated as a hypothetical protein in PlasmoDB (http://www.plasmodb.org/plasmo/), has a weak DnaJ motif forming a part of the heat shock protein machinery (21). HMMer, an implementation of profile HMM methods for database searches (22) gave DnaJ profile hits for the protein. We used PFB0090c as a query in our search against the Uniprot/Swiss-Prot database to look for best hits, probably a DnaJ protein. The bit scores obtained against the first hit (human DnaJ) with the PfSSM series is tabulated in Supplementary Table S2. Smat80 (H = 1.16) gave the highest score equal to 238.9 bits at an E-value of 4.3e-62 for a 348 amino acid overlap, while the best performing similar entropy matrix, BLOSUM90 (H = 1.18) scored 234.7 bits for a 338 amino acid overlap (E = 7.8e-61). Smat80 which was symmetric thus seemed to work best for database searches.
Pair-wise alignment of PFB0090c and human DnaJ (Q9UDY4), gave an alignment score of 810.7 bits (E = 0; 343 residue overlap) with PfFSmat60. The alignment spanned the DnaJ domain regions of both the sequences. PAM2 (H = 3.97) compared to PfFSmat60 (H = 4.67) gave a score of 57.7 bits and E-value of 5.9e-13 for only an 83 amino acid overlap that failed to span the entire domain region. The best performing BLOSUM50 aligned these regions but gave a score and E-value worse than PfFSmat60 (score in bits 428.6 and E-value of 1.3e-124 for a 339-residue overlap). Supplementary Table S3 shows the FASTA results for the DnaJ protein (bit score values) with the PfSSM series. The nonsymmetric, PfFSmat60 matrix thus seemed to perform best for pair wise local alignments.
Other interesting pair-wise alignments
With the aim to assess the performance of PfFSmat60 in generating accurate alignments in the twilight zone of protein pairs, we analyzed some proteins that fell in this zone. FASTA was used to generate the pair-wise alignments. The alignments were tested for, firstly, supposedly missing genes of P. falciparum metabolic pathway that had other lines of their existence and secondly, hypothetical proteins with a suspected clue of functional homology based on various bio-informatics’ approaches, e.g. profile based-methods, functional clusters in a network, etc. These proteins otherwise gave poor alignments with likely orthologs when the standard matrices were used. We achieved an improvement in the number of aligned amino acids with PfFSmat60. Further, we have proved the authenticity of these alignments in terms of the motifs, domains, and secondary structure elements that were initially identified for these proteins. It was noteworthy to find that PfFSmat60 could align domains and functional motifs with a good conservation. However, for such instances BLOSUM gave shorter alignments that mostly did not fall within these regions. Some of the additional examples of alignment extension with PfFSmat60, for known proteins of P. falciparum are provided as Supplementary material; Figure S3, Figure S4 and Figure S5.
Example of a P. falciparum bi-functional enzyme of the shikimate pathway
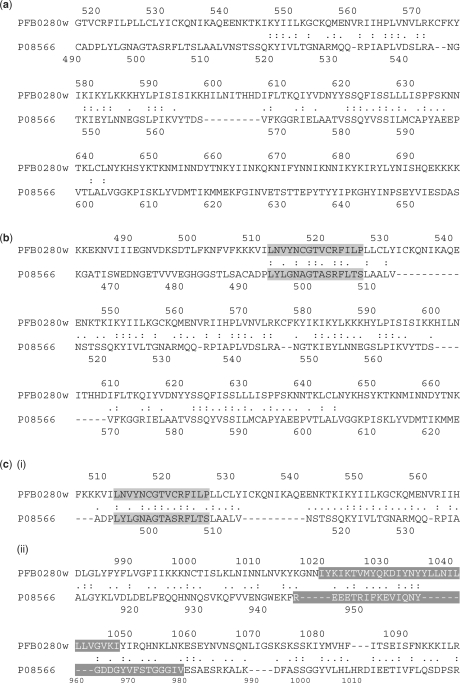
The shikimate kinase pathway plays a vital role in the survival of Apicomplexans. Moreover, the absence of this pathway in mammals makes it an attractive target for the development of antiparasitic drugs. The first six enzymes of the shikimate pathway were missing in the initial genome annotation of P. falciparum. However, the presence of these enzyme activities were detected in the crude extracts of the parasite (23). Recently, a hypothetical protein, PFB0280w was identified, presumably a bi-functional protein with EPSP (5-enolpyruvylshikimate-3-phosphate) and SK (shikimate kinase) activities (fifth and sixth enzymes of this pathway). The predictions were based on a bioinformatics’ approach with a moderate level of confidence (23). Here, we have used this example to test the sensitivity of our matrix. A local alignment was generated for PFB0280w and the yeast AROM complex, P08566; known to have the EPSP and SK activities. The signature motifs for EPSP and SK were obtained for P08566, identical to the PROSITE pattern and for PFB0280w with a mismatch of 2 and 5, respectively. Motifs were detected with fuzzpro, a program of the EMBOSS package (24). While BLOSUM100 gave insignificant alignment (23.4 bits score at an E-value of 0.31 for a 95 amino acid overlap), BLOSUM50 aligned only the EPSP motif region of these proteins (60.8 bits score at an E-value of 2e-12 for a 131 amino acid overlap). On the other hand, PfFSmat60 successfully extended the alignment spanning the SK motif of the yeast AROM complex. The region of overlap was the probable SK motif of P. falciparum obtained with a score equal to 1065.5 bits and E-value of 0, for a 1781 amino acid overlap (Figure 9). The equivalent PAM2 matrix gave an insignificant alignment with a score of 12.2 bits and E-value of 1.0 for an overlap of 5 amino acids. We would like to mention that though we achieved an alignment overlap for what we suppose as the SK motif, we observe gaps in the motif alignment. A multiple sequence alignment of yeast AROM complex and the well-characterized SK's from other organisms having known crystal structures reveal that gaps are not uncommon in the SK motif.
Figure 9.
Alignment extension with PfFSmat60 for P. falciparum bi-functional enzyme of the shikimate pathway. The sequences compared here are the P. falciparum hypothetical protein, PFB0280w and yeast multifunctional protein, P08566. (a) The alignment yielded with BLOSUM100, showing no alignment overlap for the motif regions, EPSP synthase I and shikimate kinase. (b) The alignment with BLOSUM50 showing the aligned motif regions for only EPSP synthase I motif (gray shading). (c) The alignment extended by PfFSmat60 for both the EPSP synthase I and shikimate kinase motifs represented as (i) and (ii), respectively. The text shaded in gray corresponds to the EPSP synthase I motif. The text in white with dark gray shading represents the shikimate kinase motif. PFB0280w gave only hypothetical hits with BLASTp at the default parameters.
Example of a missing metabolic enzyme—thiamine pyrophosphokinase
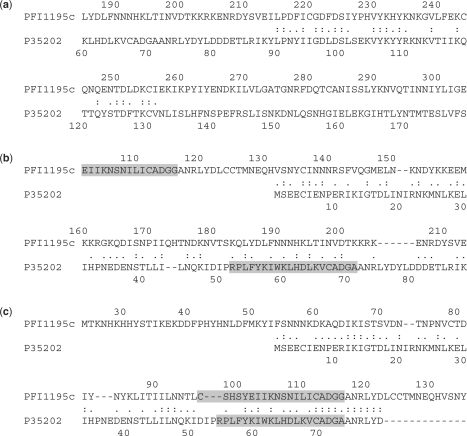
In an attempt to reconstruct the malaria metabolic pathway for P. falciparum, Limviphuvadh et al. (25) have attempted to identify some missing enzymes from the parasites genome, using the virtual enzyme system and KEGG ortholog clusters. One of them was a hypothetical protein, PFI1195c, which formed an ortholog cluster with proteins annotated as thiamine pyrophosphokinase (TPK). We analyzed the pair-wise alignment of PFI1195c and S. cerevisiae TPK, P35202 with PfFSmat60. A possible TPK motif was obtained for PFI1195c, at position 97-116 with a mismatch 3 and for P35202 with a mismatch of 4, spanning the residues 52-71. HMMer analysis identified PFI1195c as a likely TPK, agreeing with the article. Surprisingly, while neither BLOSUM50 (bit score: 75.1; E-value: 3.1e-18 for a 293 amino acid overlap) nor BLOSUM100 (bit score: 40.6; E-value: 7.6e-08 for a 42 amino acid overlap) gave meaningful alignments within the motif region, PfFSmat60 gave a biologically significant and lengthier alignment, spanning the TPK motif. The bit score achieved was 250.6 at an E-value of 4.4e-71 (Figure 10). On the other hand, PAM2 aligned one-fourth of the motif region with a bit score of 32.4 and E-value equal to 2.2e-05 for 11 amino acid overlap.
Figure 10.
Alignment of PFI1195c protein of P. falciparum with the yeast TPK protein, P35202. (a) Alignment with BLOSUM100 showing an insignificant overlap. (b) A portion of the alignment with BLOSUM50 showing unaligned motif regions (c) Alignment with PfFSmat60 that has successfully aligned the predicted motif regions. The alignment is further extended across the entire domain region with a good amount of conservation (data not shown). The text shaded in gray indicates the motif regions of both the sequences.
Asparagine synthetase of P. falciparum
The compositional adjustment substitution matrix of Yi- Kuo Yu et al. (9) was shown to increase the bit score and length of alignments that was significant. The sequences tested, were the putative asparagine synthetase from P. falciparum and the PurF protein from M. tuberculosis that share a common domain, glutamine amidotransferase (GATase). Since we could not compare our matrix with Yi- Kuo Yu's new adjusted matrix directly (as we could not use the matrix for standalone programs) to examine the difference, we attempted to compare the results indirectly. Here, we have used the same sequence pair to test our matrix performance. It was interesting to find that, in spite of the differences in the AT content of these genomes; good consistency was achieved with PfFSmat60 in terms of the secondary structure elements of the proteins compared. The results were similar to the compositionally adjusted substitution matrix of this group (Supplementary Figure S6), though the improvement in score and alignment length achieved in our case was much better over the standard (369.6 bits at an E-value of 1.7e-106 for a 539 amino acid overlap). The comparable PAM2 matrix gave a poor score of 10.9 bits at a high E-value of 1 for only a seven amino acid overlap while the best performing BLOSUM matrix (BLOSUM50) gave a bit score of 42.5 at an E-value of 5.1e-08 (78 amino acid overlap). The secondary structure elements were obtained by comparing known crystal structures of the ortholog proteins, predicted using FUGUE server (26). This is consistent with our earlier observation for the GntR family of proteins which show secondary structure conservation despite high degree of sequence variation in the effector binding region of these proteins (27, 28).
Global performance of Smat80 and PfFSmat60 matrices
Database search with Smat80
A database search (SSEARCH) was performed against the nonredundant database, for a set of 4410 proteins (hypothetical/putative) of P. falciparum with Smat80 and BLOSUM90 matrices. We observed that 4165 (94%) of these proteins gave similar hits (best nonself hits were compared) with Smat80 and BLOSUM90 matrices, while 245 (6%) proteins gave nonidentical hits (either different proteins or similar proteins from different organisms). The identical hits were compared for the improvement in E-values and scores, provided as Supplementary Table S4. It was observed that for 72% of these identical cases, both the E-values and scores were improved (Supplementary Table S4; section A) with Smat80, while 22% of them showed either, an improved E-value and similar score or vice versa (Supplementary Table S4; section B). Hence, those that performed poor with respect to both E-values and scores or at least with respect to one, was only 6% (Supplementary Table S4; section D & E). The nonidentical hits showed a difference in subject hit ranking (Supplementary Table S5) and the subject annotation improved with Smat80 in some instances (Supplementary Table S6).
Pair-wise alignments with PfFSmat60
Since PfFSmat60 matrix performed well in pair-wise alignments of known ortholog pairs, we extended our analysis on the annotated proteins (excluding hypothetical) of P. falciparum. An ortholog set of proteins was generated, using the common best nonself hits obtained for 1340 annotated proteins with the BLOSUM90 and Smat80 matrices, against the Uniprot/Swiss-Prot database. A pair-wise alignment was performed with FASTA, using the PfFSmat60, PAM2, BLOSUM100 and the BLOSUM50 matrices. We observed that the E-values, bit-scores and the alignment overlap obtained for these alignments was better with PfFSmat60, compared to other standard matrices. Compared to the similar entropy PAM2 matrix, the E-values with PfFSmat60 were better for 92% of the cases studied, while the remaining 8% showed similar E-values. The bit-scores improved for 99.9% cases while 0.1% of them showed scores similar to that obtained with PAM2. The alignment extension obtained with PfFSmat60 was improved for 90% of the alignments compared to PAM2. About 6% performed similarly, while 4% gave poor alignment extensions, compared to PAM2. The E-values, bit-scores and alignment extension (along with the query coordinates) obtained with the PfFSmat60, PAM2, BLOSUM100 and BLOSUM50 matrices are provided as Supplementary Material; Table S7, Table S8 and Table S9, respectively.
The high alignment score with our matrix compared to BLOSUM raised several important issues that we could reason. One of the possibilities of an increase in score may be attributed to the optimized alignment parameters. In our case, we had tested alignments at various parameters, and observed that even at the best-optimized parameter for BLOSUM; the alignment score with PfSSM was higher. Second, alignment score would increase linearly for a positive matrix where all the matrix values are greater than zero (12). Our scaling for PfFSmat60 was however stringent; the matrix values were scaled only to the range of BLOSUM values and it was not a positive matrix. Third, one may argue that the alignment extension achieved might be due to low gap penalties. Nevertheless, we have used moderate gap opening and extension penalties of 12 and 2, respectively. The only considerable reason we could see is the dataset of annotated orthologs used for matrix generation. Our choice of this unique dataset was to capture the substitutions in the known proteins of P. falciparum, hypothesizing that the uncharacterized proteins would have similar substitutions. The background frequencies calculated in this manner were probably more consistent with the target frequencies thus solving the problem of twilight regions (29). Lastly, most of our matrices comparatively have higher entropies and thus real alignments can be distinguished easily from chance alignments. In addition, matrices with high entropy are better at detecting short regions of strong similarity (14). This might be a possible reason for the alignments achieved in the motif regions with our matrix. In our present study, the matrix comparisons were mainly carried out with BLOSUM50, BLOSUM90 and BLOSUM100. While BLOSUM50 was chosen due to its popularity with FASTA programs, BLOSUM90, BLOSUM100 and PAM2 were used for their entropy considerations.
In this article, we have shown the significance of computing novel substitution matrices for genomes with nonstandard amino acid compositions that would aid in a better sequence level annotation. The novelty of our work lies in the unique protein dataset that was generated to compute symmetric and asymmetric matrices that are P. falciparum biased. Unlike earlier methods for overcoming compositional bias (9), we had recalculated substitutions from conserved blocks of this new dataset that represented both the P. falciparum sequence and its distant orthologs for matrix construction. The method employed by Altschul et al. (30) is indirect, i.e. while the basic matrix used for searches is the same; the compositional adjustment is made only as a final step to improve the E-values and scores. As a result, this method rarely alters the matching sequences that appear in the output. In our case, since we have constructed a new matrix in the context of this genome, the database hits also seem to change, which we believe are more reliable as potential P. falciparum orthologs. Our results are more pronounced for the hypothetical proteins of P. falciparum, where we see a difference in the subject hit annotation (Supplementary Table S6). Moreover, our Pf fixed substitution matrices are novel asymmetric matrices, calculated unlike other nonsymmetric matrices (10, 11). In this article, we have cited examples where we achieved an improvement in the alignment quality for some of the P. falciparum proteins that had evident functional roles, yet aligned poorly with their orthologs. An increase in the alignment score and an improvement in the alignment length spanning important motifs of known proteins were some of the attributes observed for the alignments tested with PfSSM. We thus believe that matrices scaled and optimized for specific searches would work better under some circumstances. It would be interesting to apply this approach genome wide to identify novel P. falciparum proteins of pharmacological interest. Investigating into our results, we thus conclude that our present approach of substitution matrix calculation to tackle a genome bias may supersede the general method of matrix calculation for an organism-specific search.
SUPPLEMENTARY DATA
Supplementary data are available at NAR Online.
FUNDING
CSIR-NMITLI (to A.R.); DBT (to A.R.); ICMR (to A.R.). CSIR fellowship (to U.P.); R.K. is supported by the CSIR-NMITLI grant to A.R. Funding for open access charge: Centre for DNA Fingerprinting and Diagnostics (CDFD), Hyderabad.
Conflict of interest statement. None declared.
NOTE IN PROOF
While this article was being considered for publication, a related paper appeared in BMC Bioinformatics entitled “A novel series of compositionally biased substitution matrices for comparing Plasmodium proteins” by Brick et al. The complete reference of this article is given below.
Brick,K. and Pizzi,E. (2008) A novel series of compositionally biased substitution matrices for comparing Plasmodium proteins. BMC Bioinformatics, 9, 236.
Supplementary Material
ACKNOWLEDGEMENT
U.P. greatly acknowledges Jorja Henikoff for patiently replying to her endless e-mails.
REFERENCES
- 1.Gardner MJ, Hall N, Fung E, White O, Berriman M, Hyman RW, Carlton JM, Pain A, Nelson KE, Bowman S, et al. Genome sequence of the human malaria parasite Plasmodium falciparum. Nature. 2002;419:498–511. doi: 10.1038/nature01097. [DOI] [PMC free article] [PubMed] [Google Scholar]
- 2.Doolittle RF. The grand assault. Nature. 2002;419:493–494. doi: 10.1038/419493a. [DOI] [PubMed] [Google Scholar]
- 3.Pearson WR, Lipman DJ. Improved tools for biological sequence comparison. Proc. Natl Acad. Sci. USA. 1988;85:2444–2448. doi: 10.1073/pnas.85.8.2444. [DOI] [PMC free article] [PubMed] [Google Scholar]
- 4.Altschul SF, Gish W, Miller W, Myers EW, Lipman DJ. Basic local alignment search tool. J. Mol. Biol. 1990;215:403–410. doi: 10.1016/S0022-2836(05)80360-2. [DOI] [PubMed] [Google Scholar]
- 5.Dayhoff MO, Schwartz RM, Orcutt BC. In: Atlas of Protein Sequence and Structure. Suppl. 3. Dayhoff MO, editor. vol. 5. Washington, DC: National Biomedical Research Foundation; 1978. pp. 345–352. [Google Scholar]
- 6.Schwartz RM, Dayhoff MO. In: Atlas of Protein Sequence and Structure. Suppl. 3. Dayhoff MO, editor. vol. 5. Washington, DC: National Biomedical Research Foundation; 1978. pp. 353–358. [Google Scholar]
- 7.Henikoff S, Henikoff JG. Amino acid substitution matrices from protein blocks. Proc. Natl Acad. Sci. USA. 1992;89:10915–10919. doi: 10.1073/pnas.89.22.10915. [DOI] [PMC free article] [PubMed] [Google Scholar]
- 8.Sutormin RA, Rakhmaninova AB, Gelfand MS. BATMAS30: amino acid substitution matrix for alignment of bacterial transporters. Proteins. 2003;51:85–95. doi: 10.1002/prot.10308. [DOI] [PubMed] [Google Scholar]
- 9.Yu YK, Wootton JC, Altschul SF. The compositional adjustment of amino acid substitution matrices. Proc. Natl Acad. Sci. USA. 2003;100:15688–15693. doi: 10.1073/pnas.2533904100. [DOI] [PMC free article] [PubMed] [Google Scholar]
- 10.Yu YK, Altschul SF. The construction of amino acid substitution matrices for the comparison of proteins with non-standard compositions. Bioinformatics. 2005;21:902–911. doi: 10.1093/bioinformatics/bti070. [DOI] [PubMed] [Google Scholar]
- 11.Bastien O, Roy S, Marechal E. Construction of non-symmetric substitution matrices derived from proteomes with biased amino acid distributions. C. R. Biol. 2005;328:445–453. doi: 10.1016/j.crvi.2005.02.002. [DOI] [PubMed] [Google Scholar]
- 12.Vingron M, Waterman MS. Sequence alignment and penalty choice. Review of concepts, case studies and implications. J. Mol. Biol. 1994;235:1–12. doi: 10.1016/s0022-2836(05)80006-3. [DOI] [PubMed] [Google Scholar]
- 13.Singer GA, Hickey DA. Nucleotide bias causes a genomewide bias in the amino acid composition of proteins. Mol. Biol. Evol. 2000;17:1581–1588. doi: 10.1093/oxfordjournals.molbev.a026257. [DOI] [PubMed] [Google Scholar]
- 14.Altschul SF. Amino acid substitution matrices from an information theoretic perspective. J. Mol. Biol. 1991;219:555–565. doi: 10.1016/0022-2836(91)90193-A. [DOI] [PMC free article] [PubMed] [Google Scholar]
- 15.Jordan IK, Kondrashov FA, Adzhubei IA, Wolf YI, Koonin EV, Kondrashov AS, Sunyaev S. A universal trend of amino acid gain and loss in protein evolution. Nature. 2005;433:633–638. doi: 10.1038/nature03306. [DOI] [PubMed] [Google Scholar]
- 16.Brooks DJ, Fresco JR. Increased frequency of cysteine, tyrosine, and phenylalanine residues since the last universal ancestor. Mol. Cell Proteomics. 2002;1:125–131. doi: 10.1074/mcp.m100001-mcp200. [DOI] [PubMed] [Google Scholar]
- 17.Henikoff S, Henikoff JG. Automated assembly of protein blocks for database searching. Nucleic Acids Res. 1991;19:6565–6572. doi: 10.1093/nar/19.23.6565. [DOI] [PMC free article] [PubMed] [Google Scholar]
- 18.Smith TF, Waterman MS. Identification of common molecular subsequences. J. Mol. Biol. 1981;147:195–197. doi: 10.1016/0022-2836(81)90087-5. [DOI] [PubMed] [Google Scholar]
- 19.Smith TF, Waterman MS. Comparison of biosequences. Advances in Applied Mathematics. 1981;2:482–489. [Google Scholar]
- 20.Merckx A, Le Roch K, Nivez MP, Dorin D, Alano P, Gutierrez GJ, Nebreda AR, Goldring D, Whittle C, Patterson S, et al. Identification and initial characterization of three novel cyclin-related proteins of the human malaria parasite Plasmodium falciparum. J. Biol. Chem. 2003;278:39839–39850. doi: 10.1074/jbc.M301625200. [DOI] [PubMed] [Google Scholar]
- 21.Date SV, Stoeckert CJJr. Computational modeling of the Plasmodium falciparum interactome reveals protein function on a genome-wide scale. Genome Res. 2006;16:542–549. doi: 10.1101/gr.4573206. [DOI] [PMC free article] [PubMed] [Google Scholar]
- 22.Eddy SR. Profile hidden Markov models. Bioinformatics. 1998;14:755–763. doi: 10.1093/bioinformatics/14.9.755. [DOI] [PubMed] [Google Scholar]
- 23.McConkey GA, Pinney JW, Westhead DR, Plueckhahn K, Fitzpatrick TB, Macheroux P, Kappes B. Annotating the Plasmodium genome and the enigma of the shikimate pathway. Trends Parasitol. 2004;20:60–65. doi: 10.1016/j.pt.2003.11.001. [DOI] [PubMed] [Google Scholar]
- 24.Rice P, Longden I, Bleasby A. EMBOSS: the European Molecular Biology Open Software Suite. Trends Genet. 2000;16:276–277. doi: 10.1016/s0168-9525(00)02024-2. [DOI] [PubMed] [Google Scholar]
- 25.Limviphuvadh V, Okuno Y, Katayama T, Goto S, Yoshizawa AC, Kanehisa M. Metabolic pathway reconstruction for malaria parasite Plasmodium falciparum. Genome Informatics. 2003;14:368–369. [Google Scholar]
- 26.Shi J, Blundell TL, Mizuguchi K. FUGUE: sequence-structure homology recognition using environment-specific substitution tables and structure-dependent gap penalties. J. Mol. Biol. 2001;310:243–257. doi: 10.1006/jmbi.2001.4762. [DOI] [PubMed] [Google Scholar]
- 27.Vindal V, Ranjan S, Ranjan A. In silico analysis and characterization of GntR family of regulators from Mycobacterium tuberculosis. Tuberculosis. 2007;87:242–247. doi: 10.1016/j.tube.2006.11.002. [DOI] [PubMed] [Google Scholar]
- 28.Vindal V, Suma K, Ranjan A. GntR family of regulators in Mycobacterium smegmatis: a sequence and structure based characterization. BMC Genomics. 2007;8:289. doi: 10.1186/1471-2164-8-289. [DOI] [PMC free article] [PubMed] [Google Scholar]
- 29.Rost B. Twilight zone of protein sequence alignments. Protein Eng. 1999;12:85–94. doi: 10.1093/protein/12.2.85. [DOI] [PubMed] [Google Scholar]
- 30.Altschul SF, Wootton JC, Gertz EM, Agarwala R, Morgulis A, Schaffer AA, Yu YK. Protein database searches using compositionally adjusted substitution matrices. FEBS J. 2005;272:5101–5109. doi: 10.1111/j.1742-4658.2005.04945.x. [DOI] [PMC free article] [PubMed] [Google Scholar]
Associated Data
This section collects any data citations, data availability statements, or supplementary materials included in this article.


