Abstract
A master equation approach is developed to find the rate-limiting steps in biopolymer folding, where the folding kinetics is described as a linear combination of basic kinetic modes determined from the eigenvalues and eigenvectors of the rate matrix. Because the passage of a rate-limiting step is intrinsically related to the folding speed, it is possible to probe and to identify the rate-limiting steps through the folding from different unfolded initial conformations. In a master equation approach, slow and fast folding speeds are directly correlated to the large and small contributions of the (rate-limiting) slow kinetic modes. Because the contributions from the slow modes can be computed from the corresponding eigenvectors, the rate-limiting steps can be identified from the eigenvectors of the slow modes. Our rate-limiting searching method has been tested for a simplified hairpin folding kinetics model, and it may provide a general transition state searching method for biopolymer folding.
I. INTRODUCTION
A central problem in biopolymer folding kinetics is to understand the transition states, or, the rate-limiting steps. Efficient computational methods have been developed to search for the transition states (as saddle points on the potential energy surface)1–4 for small molecule chemical kinetics, where well defined molecular structures of the reactant, product, and the transition state can be specified. For a macromolecule, like a protein and an RNA molecule, however, the molecule moves over a large region on the energy landscape, and there are many parallel pathways that lead to the final equilibrium state of the system. As a result, the transition state consists of an ensemble of rate-determining chain conformations. Such rate-determining chain conformations often contain certain critical structural elements whose formation or disruption would be rate-limiting. In this paper we present a method to search for the rate limiting steps.
To identify the rate-limiting steps has been a long standing problem in biopolymer folding kinetics. Several remarkable computational methods have been developed to search for the transition states,5–29 mostly based on Monte Carlo and molecular dynamics simulations for the folding from randomly chosen unfolded initial conformations. The approach reported in this paper is motivated by several recent master equation based statistical mechanical models for protein30–39 and RNA40,41 folding. The method reported here can account for the complete ensemble of chain conformations, and thus enables rigorous and deterministic searching for the rate-limiting steps.
II. MASTER EQUATION APPROACH TO THE FOLDING KINETICS
In a master equation description, the kinetics for the fractional population (or the probability) pi(t) for the ith state (i=0,1,..,Ω − 1, where Ω is the total number of chain conformations) is described as the difference between the rates for transitions entering and leaving the state
where kj→i and ki→j are the rate constants for the respective transitions. The above master equation has an equivalent matrix form: dp(t)/dt=M·p(t), where p(t) is the fractional populational vector col (p0(t), p1(t), …, pΩ−1(t)), M is the rate matrix defined as Mi j=ki→j for i ≠ j and Mi j =− Σi ≠ikil for i= j.
For a given initial folding condition c at t=0, the master equation solution yields the following populational kinetics p(t) for t>0:
| (1) |
where −λm and nm are the mth eigenvalue and eigenvector of the rate matrix M.42 The eigenmodes are labeled according to the monotonically decreasing order of the eigenvalues (−λm): 0=λ0<λ1≤λ2≤ … ≤λΩ − 1. The eigenvector n0 for the equilibrium mode m=0 gives the equilibrium populational distribution.
According to Eq. 1, the overall folding kinetics is a linear combination of the Ω kinetic modes weighted by the coefficient . Therefore, the coefficient represents the contribution from the mth mode to the overall kinetics. Each kinetic mode m in Eq. (1) represents an elementary concerted kinetic process (of rate λm) in which the populational variation of each state is proportional to the respective component in the eigenvector nm.
If there exists a large gap between the eigenvalues of a group of slow modes of small λm values and the eigenvalues of the fast modes of large λm values (see Fig. 1), the overall folding would be rate limited by the slow modes, and the folding reaction would show multiple time scales kinetics: the molecule undergoes a fast initial relaxation due to the fast kinetic modes, followed by a slow rate-determining process due to the slow kinetic modes at a later stage. Especially, if there exists a single distinctive slow kinetic mode ms, the single slow kinetic mode ms gives the bottleneck kinetic step and the overall folding time is given by .
FIG. 1.
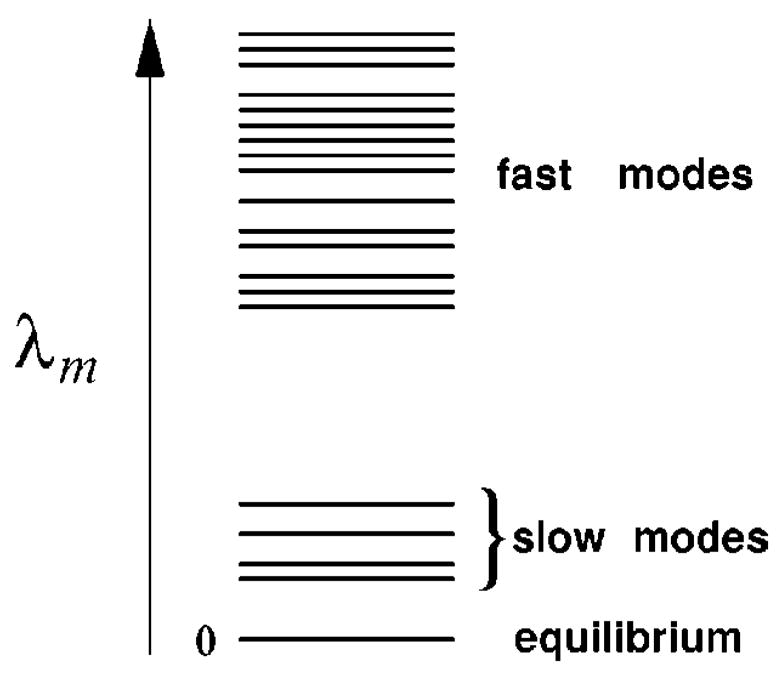
A large gap between the eigenvalues of the (rate-determining) slow modes and those of the fast modes.
For an initial state c defined by the populational distribution p(0) at t=0, according to the orthogonality condition of the eigenvectors, the weighting coefficients in Eq. 1 can be determined by the following equation:
where , and pi(0) are the ith components of vectors nm, n0, and p(0), respectively. Especially, for a folding process starting from a specific conformation c (c =0,1,2, …,Ω − 1) such that the initial populational state p(0) is given by vector (0, …,0, 1 (the cth component), 0, … 0), the weighting coefficient can be conveniently computed from the eigenvectors: .
III. MODEL AND METHODS
A rate-limiting step can be the formation or breaking of a critical structure (e.g., a specific base pair in RNA folding) such that the folding will proceed quickly once such a critical structure is formed or disrupted. A folding process can involve multiple rate-limiting steps. In the following, we use a single rate-limiting step to illustrate the idea. We will later show that the same approach can be applied to the folding kinetics involving multiple rate-limiting steps. As shown in Fig. 2, for a single rate-limiting process:
FIG. 2.
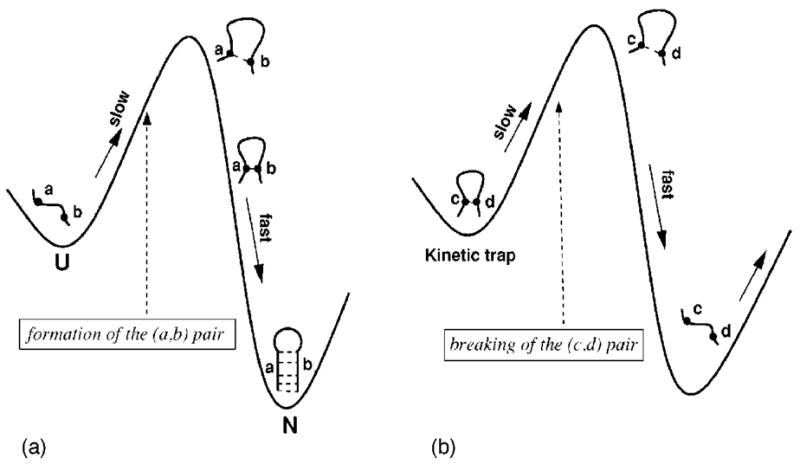
(a) If the formation of a critical base pair (a,b) is a (on-pathway) rate-limiting step (e.g., for nucleation), folding starting from any of the conformations that contain the (a,b) base pair would be fast, and all conformations that lead to fast folding would contain the rate-limiting base pair (a,b) (if there is a single rate-limiting step). (b) If the breaking of a critical base pair (c,d) is a (off-pathway) rate-limiting step (to leave a kinetic trap), all conformations that lead to slow folding would contain the rate-limiting base pair (c,d) (if there is a single rate-limiting step).
if the formation of a critical intrachain contact (a,b) is an (on-pathway) folding rate-limiting step (e.g., the formation of a nucleus in the nucleation process), folding starting from any of the conformations that contain the (a,b) contact would be fast;
if the disruption of a critical intrachain contact (c,d) is an (off-pathway) folding rate-limiting step (e.g., breaking a kinetic trap), folding starting from any of the conformations that contain the (c,d) contact would be slow.
So the on-pathway and off-pathway rate-limiting steps can be identified by searching for the common contacts contained in the fast and slow folding conformations.
Because the rate matrix and the master equation account for the complete ensemble of chain conformations, the eigenvalues and eigenvectors can give the populational kinetics for each and every state for any given initial conformation. We can exactly exhaustively enumerate the possible conformations to find out all the fast and slow folding conformations. However, as we present in the following, such exhaustive information about the fast and slow folding conformations is effectively contained in the eigenvectors for the slow modes.
We denote the (single) slow mode as the msth mode, i.e., λms ≪λm(m≠0, ms). The folding speed is directly correlated to the weighting coefficient in Eq. (1) because of the following reason. The folding reaction starting from the initial conformation c would be slow if the process is dominated by the slow mode ms, corresponding to a large magnitude of the weighting coefficient in Eq. (1), and the folding would be fast if the process is dominated by the fast modes, corresponding to a small magnitude of the weighting coefficient . Therefore, for a single rate-limiting step case, all conformations c can be unambiguously classified into two (fast and slow conformational) groups according to the (small and large) values of .
Therefore, for a folding reaction starting from the fully unfolded state U, the on- and off-pathway rate-limiting steps can be identified in the following way:
if the fully unfolded state U belongs to the group of the slow folding initial conformation cs’s that have large values, there is an on-pathway rate-limiting step, corresponding to the formation of the structure that exists in all the fast folding initial conformation cf ’s that have small values of ;
if the fully unfolded state U belongs to the fast folding initial conformation cf ’s that have small values, there is an off-pathway rate-limiting step, corresponding to the disruption of the (misfolded) structure that exists in all the slow folding initial conformation cs’s that have large values of .
For a folding process involving multiple rate-limiting steps, as we will show below, there are multiple slow modes, and for each slow mode ms, the weighting coefficient has a hierarchical (discrete) distribution for different initial folding conformations c, corresponding to the passage of the different (combinations) of rate-limiting steps. Therefore, the chain conformations can be classified into a hierarchy of different subgroups according to the values. To find out all the rate-limiting steps, we can apply the above method to each of the slow modes ms. For each slow mode ms, the spectrum gives on-pathway rate-limiting steps if U belongs to the slowest folding subgroup, and gives off-pathway rate-limiting steps, otherwise.
IV. TEST IN A SIMPLIFIED HAIRPIN FOLDING KINETICS MODEL
The purpose of the calculations presented in the following is to illustrate the principle and to test the above rate-limiting step searching method using a simplified hairpin folding model. Because our purpose here is not for the complete investigation for hairpin folding kinetics per se, we choose a minimal model that can have a variety of complex on- and off-pathway rate-limiting steps in order to simplify the analysis and to focus on the test for the method. Our strategy is to design rate-limiting steps by assigning proper entropy and enthalpy parameters for the formation (disruption) of certain rate-determining intra-chain contacts or base stacks (= adjacent stacking base pairs in nucleic acids). We then use the above rate-limiting step searching method to show how to find all the designed on- and off-pathway rate-limiting steps.
We assume that the conformational stability is provided by the base stacking force, and we use base stacks to describe a state.40 We assume an entropic (ΔS0) and enthalpic (ΔH0) change of (ΔS0, ΔH0)=(−5,−2) for the formation of a base stack, unless specified otherwise for certain special base stacks involved in the rate-limiting steps in specific models. All possible hairpin-forming base stacks and loops are allowed to form in the model. Loop entropies are neglected in order to simplify the illustrative calculation. It must be pointed out that the sequence-dependent enthalpy and entropy parameters for the formation (disruption) of the base stacks and small loops have been experimentally measured for RNAs.43 However, here we use such a rather simplified minimal model for the purpose of ideally simplifying the analysis in order to focus on the analysis for the rate-limiting step searching method.
In our simplified model, there are totally 391 hairpin conformational states for a 16-nt chain, and the native structure is a hairpin with 6 base stacks; see Fig. 3(A). The rate matrix is defined as ki→j= e−ΔGij/kBT for the formation or the disruption of a base stack and ki→j=0 otherwise. The kinetic barrier ΔGi j is assumed to be entropic and equal to −TΔSi j for the formation of a base stack and ΔGi j is assumed to be enthalpic and equal to −ΔHi j for the disruption of a base stack,40 where ΔHi j and ΔSi j are the enthalpic and entropic change for the i→j transition. In all the models presented in the following, the chain has a melting temperature of Tm> 0.4.44–47 We will study the equilibration (folding) kinetics under folding conditions of temperature T <Tm.
FIG. 3.
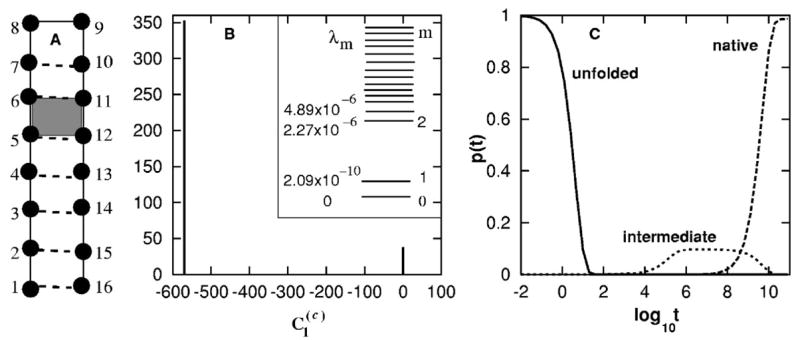
(A) The native structure of the RNA-like hairpin. The formation of the shaded stack (5,6,11,12) is an (designed) on-pathway rate-limiting step. (B) The eigenvalue distribution (inset) and the histogram of for the slow mode ms=1. (C) The populational kinetics in the folding process. The kinetic intermediates correspond to the transient accumulation of the conformations before the (5,6,11,12) is formed. In all the populational curve plots presented in this paper, the results for the states of which the fractional populations have never exceeded 10% during the folding process are not shown.
A. On-pathway rate-limiting step
Model
We design an on-pathway rate-limiting folding process by assigning a large entropic barrier −ΔS for the formation of the native base stack (5,6,11,12): (ΔS,ΔH) = (−15, −6).
Eigenvalue spectrum
We found that the rate matrix for T=0.2 (<Tm) has a single slow mode ms=1 of rate (eigen-value) λ1=2.08 × 10⁻¹⁰ [see Fig. 3(B)], causing an overall folding time of , which is consistent with the populational kinetics curve shown in Fig. 3(C).
–distribution
As shown in Fig. 3 B), for the slow mode ms=1 shows a 2-value distribution: for all the conformations (c) that have the (5,6,11,12) base stack formed, and for all the conformations without the (5,6,11,12) stack. Therefore, the formation of base stack (5,6,11,12) is the (on-pathway) rate-limiting folding step, and we have found out the (designed) rate-limiting step.
B. Two on-pathway rate-limiting steps
Model
We extend the above model by assuming (ΔS,ΔH)=(−15,−6) for both the (5,6,11,12) and (2,3,14,15) base stacks, and so the formation of the native base stacks (5,6,11,12) and (2,3,14,15) are expected to be two rate-limiting steps in series on the folding pathway.
Eigenvalue spectrum
We found that for T = 0.25, there are three distinctive slow eigenvalues 2.32 × 10−9,8.55 × 10−9 and 3.90 × 10⁻⁸, corresponding to modes ms = 1,2,3, respectively [see Fig. 4(B)].
FIG. 4.
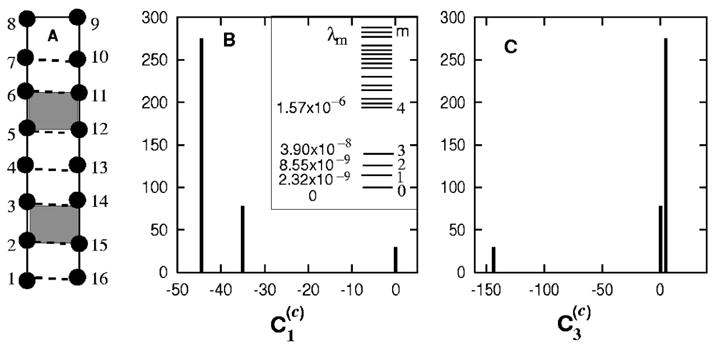
(A) The native structure of the RNA-like hairpin. The formation of the shaded stacks (2,3,14,15) and (5,6,11,12) are two (designed) on-pathway rate-limiting steps. (B) The eigenvalue distribution (inset) and the histogram of for the slow mode ms=1. (C) for the slow mode ms=3.
–distribution
As shown in Figs. 4 B and 4(C), for each slow mode has well separated discrete values. For modes ms=1 and 3, the group of conformations for the smallest values share the common base stacks (5,6,11,12) and (2,3,14,15), respectively. Therefore, the formation of native base stacks (5,6,11,12) and (2,3,14,15) are two rate-limiting steps. For mode ms=2, conformations with the smallest value have both base stacks formed.
C. Off-pathway rate-limiting process
Model
We assume a large enthalpic barrier −ΔH for the disruption of a non-native base stack (1,2,5,6): (ΔS,ΔH)=(−15,−6), hence conformations with base stack (1,2,5,6) form a kinetic trap [see Fig. 5(A)]. In fact, in the present simplified model, there is only one hairpin conformation that can form the base stack (1,2,5,6).
FIG. 5.
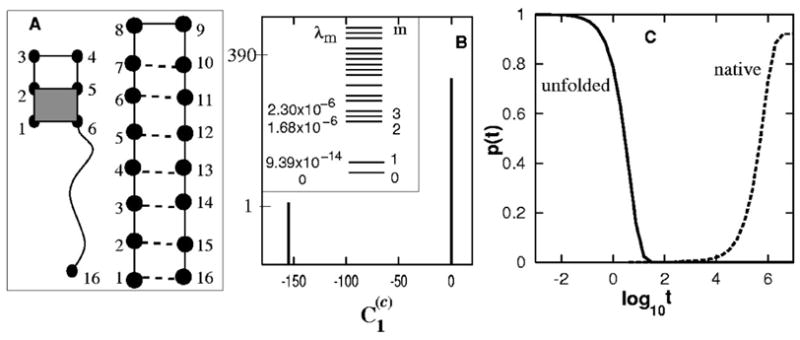
(A) The native and the (designed) trapped structures with the shaded (1,2,5,6) stack. (B) The eigenvalue distribution (inset) and the histogram of for the slow mode ms=1. (C) The populational kinetics in the folding process. No kinetic intermediate state is formed because the kinetic trap is avoided in the folding process.
Eigenvalue spectrum
For the folding kinetics at T = 0.2 we found that there exists a single slowest mode ms = 1 of rate (eigenvalue) of λ1= 9.39 × 10⁻¹⁴ [see Fig. 5(B)].
–distribution
As shown in Fig. 5(B), for the conformation c with the (1,2,5,6) base stack formed, and for all other conformations, including the fully unfolded state U; see Fig. 5(B). Therefore, the dominant rate-limiting step is the disruption of the base stack (1,2,5,6).
In fact, the rate constant for the slow mode λ1 can be estimated from the rate constant for the disruption of the (1,2,5,6) stack: e−ΔH/kBT =e−6/0.2=9.36 × 10−14, which agrees exactly with the slowest eigenvalue λ1 of the rate matrix.
Kinetic partitioning.48
The rate-limiting slow kinetic modes identified above are intrinsic to the energy landscapes. However, a molecule starting from a given initial state on the energy landscape can fold along different pathways in parallel, many of which do not necessarily pass through the rate-limiting kinetic traps.48 The overall folding kinetics is not only determined by the existence of the rate-limiting slow kinetic modes and the associated kinetic traps, but is also determined by the likelihood for the molecule to pass through the rate-limiting steps. Mathematically, the likelihood for the molecule to pass through a trapped state r can be characterized by its transient population pr(t) given by the rth component of the vector equation Eq. (1). Furthermore, for a given starting state c, the peak value of pr(t) (= the maximum transient accumulation of state r in the kinetic trap) is mainly determined by the coefficients in Eq. (1) for the slow modes ms, because the contributions from the fast modes decay quickly after initial folding events.
In model C above, as shown in the populational kinetics in Fig. 5(C), the overall folding time tfold~6.0 × 10⁵ is much faster than that predicted from the rate-limiting slow mode which gives . Such “anomalous” fast folding kinetics arises from the negligible likelihood for the molecule to pass through the kinetic trap. In this case, c is the initial unfolded state U, the slow mode is ms=1, and the trapped state r is the one with the (1,2,5,6) base stack, we found the likelihood is negligible. Therefore, the molecule would most likely fold through the fast kinetic modes (m⩾2), and the rate-limiting slow mode (and the kinetic trap) is avoided. As a result, the overall folding time can be estimated as .
D. Two off-pathway rate-limiting steps
Model
We assign high enthalpic barriers −ΔH for the disruption of two non-native base stacks by assuming (ΔS,ΔH)=(−3,−4) and (−4.0,−4.2) for the formation of base stacks (1,2,5,6) and (11,12,15,16), respectively [see Fig. 6(A)]. Therefore, mis-formed non-native base stacks (1,2,5,6) and (11,12,15,16) are expected to be two kinetic traps.
FIG. 6.
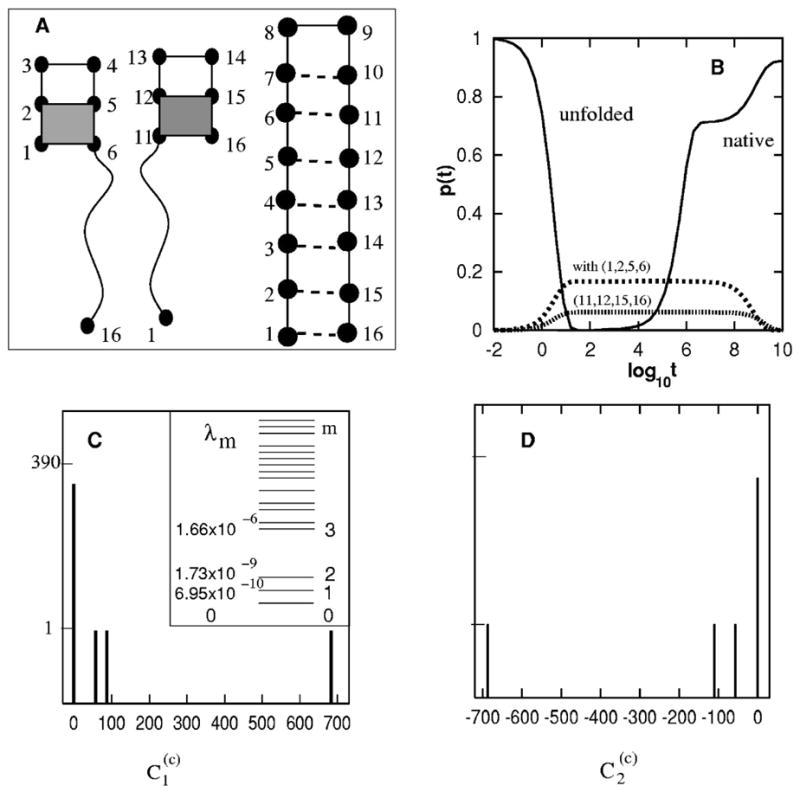
(A) The native and the (designed) trapped structures with the shaded (1,2,5,6) and (11,12,15,16) stacks. (B) The populational kinetics in the folding process. The kinetic intermediates correspond to the transient accumulation of conformations with (1,2,5,6) and (11,12,15,16) base stacks. The native population shows a biphasic kinetics. (C) The eigenvalue spectrum (inset) and the histogram of for the slow mode ms = 1. (D) The histogram of for the slow mode ms = 2.
Eigenvalue spectrum
The first four eigenvalues for T = 0.2(<Tm=0.4) are 0,−6.95 × 10⁻¹⁰,−1.73 × 10⁻⁹, −1.66 × 10⁻⁶. Therefore, there are two distinctive slow modes (ms=1,2) [see Fig. 6(C)].
–distribution
Figures 6(C) and 6 D) show that the dominant values for the two slow modes are 687.0 (for ms=1) and −687.0 (for ms=2) for conformations c that contain base stacks (11,12,15,16) and (1,2,5,6), respectively. Therefore, the two rate-limiting slow modes correspond to the breaking of the respective mis-formed base stacks.
Kinetic partitioning
For a folding from the fully unfolded state U, the likelihoods for passing through the two kinetic traps are 56 × 0.00146~8% and 110 × 0.00146~16% for (11,12,15,16) and (1,2,5,6), respectively. Because of the small probability of trapping, the overall folding kinetics becomes biphasic [see Fig. 6(B)]:
: the native population quickly rises to a significant level because the molecule has a large probability to fold quickly through the fast modes (m⩾3) without being trapped;
: the molecule misfold and refold to the native state by breaking the mis-formed non-native base stacks through the slow modes (ms=1,2).
E. Mixture of on- and off-pathway rate-limiting steps
Model
Our approach can be applied to complex folding process involving both on-pathway and off-pathways rate-limiting steps. We assume (ΔS),ΔH)=(−3, −4) and (−10,−4) for the formation of (1,2,5,6) and (5,6,11,12), respectively [see Fig. 7)(A)]. Therefore, the disruption of the non-native base stack (1,2,5,6) and the formation of native base stack (5,6,11,12) are expected to be an off-pathway and an on-pathway rate-limiting step, due to the large entropic barrier and the large enthalpic barrier, respectively.
FIG. 7.
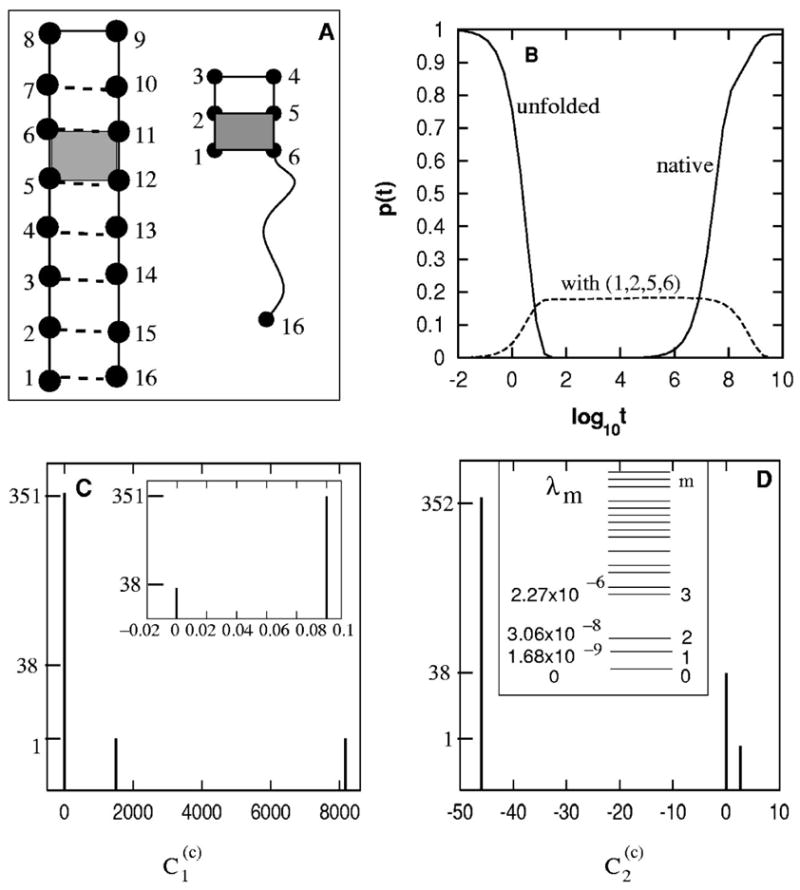
(A) The native structure and the (designed) trapped structures with the shaded (1,2,5,6) stack. The formation of the shaded (5,6,11,12) stack is an (designed) on-pathway rate-limiting folding step. (B) The populational kinetics in the folding process. The kinetic intermediates correspond to the transient accumulation of conformations with (1,2,5,6). The native population shows a biphasic kinetics. (C) The histogram of for the slow mode ms=1. (D) The eigenvalue spectrum (inset) and the histogram of for the slow mode ms=2.
Eigenvalue spectrum
At temperature T=0.2<Tm, the native structure is hairpin-like. The first five nonzero eigenvalues of the rate matrix are −1.68 × 10⁻⁹,−3.06 × 10⁻⁸, −2.27 × 10⁻⁶,−4.89 × 10⁻⁶,−5.17 × 10⁻⁶. There is clearly a gap between the second and third nonzero eigenvalue, corresponding to two slow modes ms=1,2 [see Fig. 7(D)].
–distribution
For the ms=1 slow mode, the weighting coefficient values for different initial folding conformation c’s, as shown in Fig. 7(C), are clustered around four discrete values −0.000 13, 8161, 1496, and 0.1 for c =conformations with the (5,6,11,12), the conformation with (1,2,5,6), the fully unfolded state, and all other conformations, respectively. Since the fully unfolded state U does not belong to the group of the largest weighting coefficient, there must exist an off-pathway rate-limiting step in the folding process. The conformations of the largest value (=8161) contain a single base stack (1,2,5,6). Therefore, the breaking of the (1,2,5,6) stack is an off-pathway rate-limiting step.
For the ms=2 slow mode, the coefficients also show a discrete three-value distribution around 0.021, 2.7, and −46 [see Fig. 7(D)] for initial conformations c=conformations with (5,6,11,12), the conformation with (1,2,5,6), and all other conformations (including the unfolded state), respectively. Because the fully unfolded state belongs to the group of conformations of the largest value (=46), there must be an on-pathway rate-limiting step. All the conformations of the smallest value (=0.021) contain a common base stack (5,6,11,12) Therefore, the formation of (5,6,11,12) is an on-pathway rate-limiting step.
Kinetic partitioning
For the folding from the fully unfolded state U, the likelihood for the molecules be trapped in the r=(1,2,5,6) kinetic trap is (ms=1), and the likelihood for the molecules to fold through the formation of the (5,6,11,12) stack is 75% (ms=2). Therefore, most of the molecules will avoid the (1,2,5,6) trap and fold quickly after the (5,6,11,12) stack is formed, and the rest of the molecules will be trapped in the state with the (1,2,5,6) stack and need to break the (1,2,5,6) base stack before re-folding by passing through the kinetic barrier for the formation of the (11,12,15,16) base stack. Such a “kinetic partitioning”48 process causes a two-time scale folding kinetics shown in the populational kinetic curves in Fig. 7(B).
V. APPLICATIONS TO RNA HAIRPIN FOLDING KINETICS
In the above sections, we have applied the method to the folding kinetics of model hairpin-like conformations. We have chosen such a simplified model in order to have an unambiguous way to test the theory, and to demonstrate the connections between the master equation and the complex on- and off-pathway kinetics and the kinetic partitioning mechanism. In this section, we apply the method to predict RNA hairpin folding kinetics using realistic chain models and experimentally measured energy and entropy parameters.40,43
The sequence and the native structure of the molecule are shown in Fig. 8(A).40 This 21-nt RNA sequence has totally 1603 possible native and non-native secondary structures. The temperature dependence of the heat capacity shows a melting temperature of Tm=62 °C.40 In the following, we investigate the rate-determining steps for the folding kinetics at folding condition T=40 °C<Tm and at unfolding condition T=90 °C>Tm, respectively.
FIG. 8.
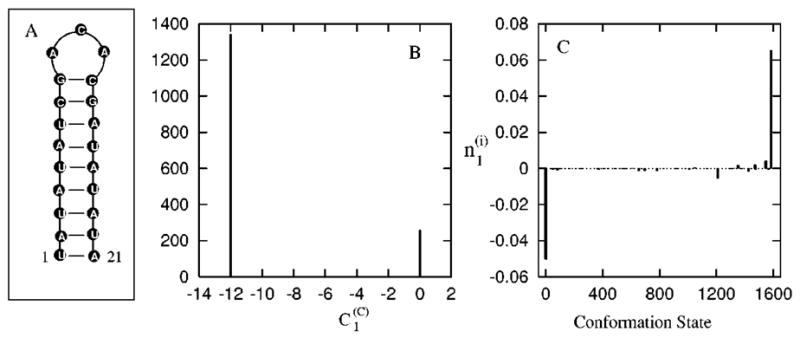
(A) The native structure and 21-nt RNA hairpin-forming sequence (see Ref. 40). (B) The histogram of for the slow mode ms = 1 at T=40 °C. The y axis represents the number of chain conformation c’s that have the value represented by the x axis. (C) The vector components of the eigenvector of the slowest mode ms=1 (see Ref. 40). The x-axis represents the conformations, and the y axis represents the corresponding components in the eigenvector.
T=40 °C
The native state occupies 86.3% fraction population in thermal equilibrium at T=40 °C. The eigenvalue spectrum shows that it has a single slow mode ms = 1. As shown in Fig. 8(B), for the slow mode ms=1 shows a 2-value distribution: for all the conformations (c) that have the UCGA base stack formed, and for all the conformations without the UCGA stack. Therefore, the formation of the base stack UCGA is the (on-pathway) rate-limiting folding step. Figure 8(C) shows the distribution of eigenvector components for the slow mode ms=1. Only the denatured state [labeled as state 1 in Fig. 8(C)] and native state [labeled as state 1585 in Fig. 8(C)] are significantly populated, indicating that the dominant folding mode is the depletion of the fully extended conformations into the fully folded native conformation. But the eigenvector components do not directly reveal the rate-limiting steps. It is the distribution that unambiguously gives the rate-limiting steps. Physically, the formation of the UCGA stack involves the largest entropic loss, and thus is rate determining.
T=90 °C
The completely unfolded state occupies 98% of the total population in thermal equilibrium at T=90 °C. The eigenvalue spectrum shows that it has a single slow mode ms=1. As shown in Fig. 9(A), for the slow mode ms=1 shows a 2-value distribution: for all conformations (c) that have the UCGA base stack formed, and for all the conformations without the UCGA stack. Therefore, the breaking of base stack UCGA is the (on-pathway) rate-limiting step for the unfolding. Figure 9(B) shows the eigenvector distribution of the slowest mode ms=1. There are multiple significantly populated states in the eigenvector spectrum. All these populated states have the UCGA stack. These (pre-equilibrated40) states reside inside a free energy well separated from the unfolded state by a high barrier arising from the large enthalpic cost to break the UCGA stack.40
FIG. 9.
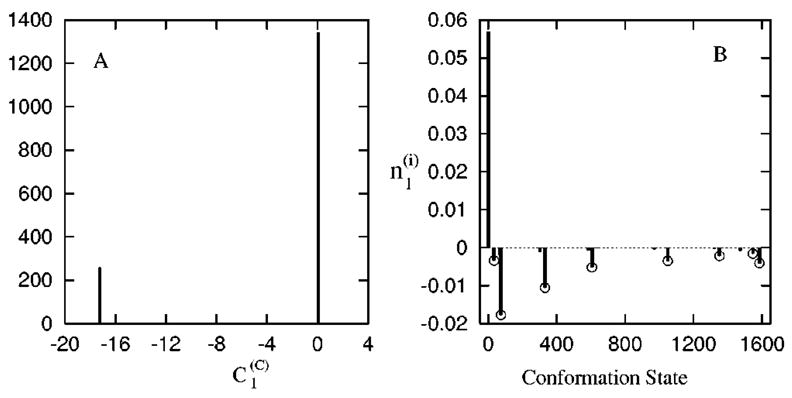
(A) The histogram of for the slow mode ms = 1 at T =90 °C. (B) The vector components of the eigenvector of the slowest mode ms=1 (see Ref. 40).
The above results obtained from the current simple analytical method, for both the folding and unfolding kinetics, agree well with the conclusions derived from the previous computationally intensive brute force analysis for the folding pathways and energy landscapes40 for the complete conformational ensemble.
VI. SUMMARY
The present transition state searching method can also be applied to the unfolding kinetics, where the rate-limiting steps involve the breaking of certain critical contacts. The rate-limiting steps in unfolding can be identified as the disruption of the common structure shared by the conformations (c) with the large value of for the slow modes (ms).
A basic premise of our transition state searching method is the discrete distribution of the values for different folding conformations (c) for the slow modes (ms). The separation in the values and the gap in the eigenvalue spectrum are related to each other. For a bumpy free energy landscape at low temperatures, there would be no dominant rate-limiting processes, and there would be no well defined slow and fast modes, and, in general, there would no separation in the value for different conformations for the slow modes.
Great advances have been made on the master equation approach to the folding kinetics.9,31,40 The analytical method introduced in this work does not involve Monte Carlo simulations, and can identify the rate-limiting steps in an unambiguous and rigorous way. We have used a realistic RNA hairpin folding problem as a paradigm, but the rate-limiting searching method is general and is applicable to more complex RNA folding problems. Using efficient computational algorithms (e.g., to cluster conformations into pre-equilibrated macrostates,30 the Lanczos algorithm,49 and the truncation technique for diagonalization of large matrices31), we may extend the method to treat large RNAs and other biopolymer molecules.
Acknowledgments
This work has been supported by grants from the American Heart Association (National Center) and the Petroleum Research Fund.
References
- 1.Cerjan CJ, Miller WH. J Chem Phys. 1981;75:2800. [Google Scholar]
- 2.Baker J. J Comput Chem. 1986;7:385. [Google Scholar]
- 3.Schlemiels HB. J Comput Chem. 1982;3:214. [Google Scholar]
- 4.Jensen F. J Chem Phys. 1995;102:6706. [Google Scholar]
- 5.Klimov DK, Thirumalai D. Proteins. 2001;43:465. doi: 10.1002/prot.1058. [DOI] [PubMed] [Google Scholar]
- 6.Onuchic JN, Luthey-Schulten Z, Wolynes PG. Annu Rev Phys Chem. 1997;48:545. doi: 10.1146/annurev.physchem.48.1.545. [DOI] [PubMed] [Google Scholar]
- 7.Du R, Pande VS, Rosenberg AY, Tanaka T, Shakhnovich EI. J Chem Phys. 1998;108:334. [Google Scholar]
- 8.Pande VS, Rokhsar DS. Proc Natl Acad Sci USA. 1999;96:1273. doi: 10.1073/pnas.96.4.1273. [DOI] [PMC free article] [PubMed] [Google Scholar]
- 9.Ozkan SB, Bahar I, Dill KA. Nat Struct Biol. 2001;8:765. doi: 10.1038/nsb0901-765. [DOI] [PubMed] [Google Scholar]
- 10.Dill KA, Chan HS. Nat Struct Biol. 1997;4:10. doi: 10.1038/nsb0197-10. [DOI] [PubMed] [Google Scholar]
- 11.Isambert H, Siggia ED. Proc Natl Acad Sci USA. 2000;97:6515. doi: 10.1073/pnas.110533697. [DOI] [PMC free article] [PubMed] [Google Scholar]
- 12.Ansari A, Kuznetsov SV, Shen YQ. Proc Natl Acad Sci USA. 2001;98:7771. doi: 10.1073/pnas.131477798. [DOI] [PMC free article] [PubMed] [Google Scholar]
- 13.Munoz V, Thompson PA, Hofrichter J, Eaton WA. Nature (London) 1997;390:196. doi: 10.1038/36626. [DOI] [PubMed] [Google Scholar]
- 14.Westerberg KM, Floudas CA. J Chem Phys. 1999;110:9259. [Google Scholar]
- 15.Onuchic JN, Socci ND, LutheySchulten Z, Wolynes PG. Fold Des. 1996;1:441. doi: 10.1016/S1359-0278(96)00060-0. [DOI] [PubMed] [Google Scholar]
- 16.Guo ZY, Thirumalai D. Fold Des. 1997;2:377. doi: 10.1016/S1359-0278(97)00052-7. [DOI] [PubMed] [Google Scholar]
- 17.Wolynes P. Fold Des. 1998;3:R107. [Google Scholar]
- 18.Guo ZY, Thirumalai D. Biopolymers. 1995;36:83. [Google Scholar]
- 19.Thirumalai D, Guo ZY. Biopolymers. 1995;35:137. [Google Scholar]
- 20.Klimov DK, Thirumalai D. J Mol Biol. 1998;282:471. doi: 10.1006/jmbi.1998.1997. [DOI] [PubMed] [Google Scholar]
- 21.Dokholyan NV, Buldyrev SV, Stanley HE, Shakhnovich EI. J Mol Biol. 2000;296:1183. doi: 10.1006/jmbi.1999.3534. [DOI] [PubMed] [Google Scholar]
- 22.Abkevich VI, Gutin AM, Shakhnovich EI. Biochemistry. 1994;33:10026. doi: 10.1021/bi00199a029. [DOI] [PubMed] [Google Scholar]
- 23.Nymeyer H, Socci ND, Onuchic JN. Proc Natl Acad Sci USA. 2000;97:634. doi: 10.1073/pnas.97.2.634. [DOI] [PMC free article] [PubMed] [Google Scholar]
- 24.Socci ND, Onuchic JN. J Chem Phys. 1995;103:4732. [Google Scholar]
- 25.Chan HS, Dill KA. Proteins: Struct, Funct, Genet. 1998;30:2. doi: 10.1002/(sici)1097-0134(19980101)30:1<2::aid-prot2>3.0.co;2-r. [DOI] [PubMed] [Google Scholar]
- 26.Dill KA. Protein Sci. 1999;8:1166. doi: 10.1110/ps.8.6.1166. [DOI] [PMC free article] [PubMed] [Google Scholar]
- 27.Chan HS, Dill KA. J Chem Phys. 1994;100:9238. [Google Scholar]
- 28.Guo C, Levine H, Kessler DA. Proc Natl Acad Sci USA. 2000;97:10775. doi: 10.1073/pnas.190103297. [DOI] [PMC free article] [PubMed] [Google Scholar]
- 29.Czerminski R, Elber R. J Chem Phys. 1990;92:5580. [Google Scholar]
- 30.Becker OM, Karplus M. J Chem Phys. 1997;106:1495. [Google Scholar]
- 31.Cieplak M, Henkel M, Karbowski J, Banavar JR. Phys Rev Lett. 1998;80:3654. [Google Scholar]
- 32.Zwanzig R. Proc Natl Acad Sci USA. 1997;94:148. doi: 10.1073/pnas.94.1.148. [DOI] [PMC free article] [PubMed] [Google Scholar]
- 33.Shakhnovich EI, Gutin AM. Europhys Lett. 1989;9:569. [Google Scholar]
- 34.Saven JG, Wang J, Wolynes PG. J Chem Phys. 1994;101:11037. [Google Scholar]
- 35.Leopold PE, Montal M, Onuchic JN. Proc Natl Acad Sci USA. 1992;89:8721. doi: 10.1073/pnas.89.18.8721. [DOI] [PMC free article] [PubMed] [Google Scholar]
- 36.Bryngelson JD, Wolynes PG. J Phys Chem. 1989;93:6902. [Google Scholar]
- 37.Ye YJ, Ripoll DR, Scheraga HA. Comput Theor Polym Sci. 1999;9:359. [Google Scholar]
- 38.Ye Y-J, Scheraga HA. AIP Conf Proc No 469. AIP; New York: 1999. Slow Dynamics in Complex Systems; p. 452. [Google Scholar]
- 39.Hao MH, Scheraga HA. J Phys Chem. 1997;107:8089. [Google Scholar]
- 40.Zhang WB, Chen SJ. Proc Natl Acad Sci USA. 2002;99:1931. doi: 10.1073/pnas.032443099. [DOI] [PMC free article] [PubMed] [Google Scholar]
- 41.Tacker M, Fontana W, Stadler PF, Schuster P. Eur Biophys J. 1994;23:29. doi: 10.1007/BF00192203. [DOI] [PubMed] [Google Scholar]
- 42.Hall CK, Helfand E. J Chem Phys. 1982;77:3275. [Google Scholar]
- 43.Serra MJ, Turner DH. Methods Enzymol. 1995;259:242. doi: 10.1016/0076-6879(95)59047-1. [DOI] [PubMed] [Google Scholar]
- 44.Zhang WB, Chen SJ. J Chem Phys. 2001;114:7669. [Google Scholar]
- 45.Tostesen E, Chen SJ, Dill KA. J Phys Chem B. 2001;105:1618. [Google Scholar]
- 46.Chen SJ, Dill KA. Proc Natl Acad Sci USA. 2000;97:646. doi: 10.1073/pnas.97.2.646. [DOI] [PMC free article] [PubMed] [Google Scholar]
- 47.Chen SJ, Dill KA. J Chem Phys. 1998;109:4602. [Google Scholar]
- 48.Thirumalai D, Woodson SA. Acc Chem Res. 1996;29:433. [Google Scholar]
- 49.Cullum JK, Willoughby RA. Lanczos Algorithms for Large Symmetric Eigenvalue Computations. Birkhauser; Boston: 1985. [Google Scholar]


