

Abstract
Rhabdomyosarcoma (RMS) in children occurs as two major histological subtypes, embryonal (ERMS) and alveolar (ARMS). ERMS is associated with an 11p15.5 loss of heterozygosity (LOH) and may be confused with nonmyogenic, non-RMS soft tissue sarcomas. ARMS expresses the product of a genomic translocation that fuses FOXO1 (FKHR) with either PAX3 or PAX7 (P-F); however, at least 25% of cases lack these translocations. Here, we describe a genomic-based classification scheme that is derived from the combined gene expression profiling and LOH analysis of 160 cases of RMS and non-RMS soft tissue sarcomas that is at variance with conventional histopathological schemes. We found that gene expression profiles and patterns of LOH of ARMS cases lacking P-F translocations are indistinguishable from conventional ERMS cases. A subset of tumors that has been histologically classified as RMS lack myogenic gene expression. However, classification based on gene expression is possible using as few as five genes with an estimated error rate of less than 5%. Using immunohistochemistry, we characterized two markers, HMGA2 and TFAP2ß, which facilitate the differential diagnoses of ERMS and P-F RMS, respectively, using clinical material. These objectively derived molecular classes are based solely on genomic analysis at the time of diagnosis and are highly reproducible. Adoption of these molecular criteria may offer a more clinically relevant diagnostic scheme, thus potentially improving patient management and therapeutic RMS outcomes.
Rhabdomyosarcoma (RMS) defines a group of histologically and genetically heterogeneous sarcomas that are the single most common soft tissue sarcomas affecting children and young adults. Two major forms of the disease are described,1,2,3,4,5 conventionally termed embryonal RMS (ERMS) and alveolar RMS (ARMS), reflecting morphological similarities to fetal muscle or pulmonary alveoli, respectively. These distinctions are clinically relevant because the embryonal form typically shows less aggressive clinical behavior and a better prognosis and morphological embryonal variants such as spindle/botryoid tumors5,6,7 are highly curable. When clinical stage and other variables are taken into account, survival rates range from 20% for patients with metastatic alveolar histology tumors to more than 95% for some localized forms of ERMS.8,9
Recurrent chromosomal translocations10,11 that result in the expression of the chimeric transcription factors, PAX3-FOXO1 or PAX7-FOXO1 (henceforth, P-F or PAX-FKHR), and that can be detected by molecular genetic techniques, are found exclusively in ARMS. Initially this was thought to provide an objective basis for distinguishing the two major forms of the disease.10 However, analysis of a large series of cases consistently fails to show an absolute association of P-F translocations with ARMS; at least 25% of these tumors possess classic alveolar histology but lack a translocation.12,13 The most recent work from the Children’s Oncology Group (COG) cites a figure as high as 45% for ARMS histology cases lacking known P-F fusions.14 In contrast, ERMS do not demonstrate recurrent chromosomal translocations (ie, P-F-negative). Instead, they show greater genomic instability (manifested as highly variable karyotypes) and recurring allelic imbalances such as loss of heterozygosity (LOH) at chromosome 11p15.5.15,16
RMS is defined as demonstrating at least minimal evidence of rhabdomyogenesis, or skeletal muscle differentiation. However, in a large proportion of cases, morphological evidence of myogenesis is limited to a small percentage of tumor cells or may be extremely difficult to detect. The use of antibodies for immunohistochemical (IHC) detection of myogenesis-associated proteins such as desmin, myogenin (MYOG), and MyoD (MYOD1) have aided the diagnostic workup of such cases,17,18 and when combined myogenin and MyoD have ∼97% sensitivity to detect RMS.19,20 The identification of muscle related differentiation is key and clinically relevant because some RMS cases can be virtually indistinguishable from the group of so-called undifferentiated or nonrhabdomyosarcoma soft-tissue sarcomas (UDS/NRSTS). The latter lack any morphological or ultrastructural evidence of myogenesis and have a poor outcome compared with RMS.21,22 Formerly, UDS/NRSTS was considered a diagnosis of exclusion but on current COG protocols (eg, D9902) these patients are not eligible for RMS clinical trials.
The Intergroup Rhabdomyosarcoma Study Group (IRSG) was formed as a multi-institutional cooperative effort to better understand the biology of RMS and to improve the outcome of this disease.7 Such cooperative efforts have resulted in dramatic improvement of RMS patient overall survival from 25% before the first IRSG-I protocol to ∼71% on IRSG-IV.9,23,24 The recognition that patient outcome is highly variable and dependent on numerous clinicopathological risk factors resulted in the development of a risk-based algorithm for treatment assignment, which combines a histological classification scheme with presurgical stage and postsurgical clinical group. A cornerstone of this risk-based assignment is the histological diagnosis, criteria for which were developed throughout several decades by numerous investigators and culminating in the International Classification of Rhabdomyosarcoma (ICR).3,25 ICR criteria, based mainly on the morphological and cytological examination of hematoxylin and eosin-stained histology sections, resulted in remarkable improvements in the reproducibility of diagnosis and provided a platform for survival models that are predictive of patient outcome.1,3 However, despite exhaustive efforts to establish consensus for these diagnostic criteria, as many as a third of patients could be incorrectly assigned to treatment protocols because of inconsistency and uncertainty as determined by institutional pathology diagnosis—and is the primary reason for mandatory central pathology review process at the COG.19
Genomic analysis of human tumor specimens is having a significant impact on the field of tumor pathology,25,26 redefining tumor classes based on molecular features27,28 and identifying new subclasses previously unrecognized by conventional histology or cytogenetics.29 We therefore sought to determine whether a new molecular-based classification scheme derived from analysis of gene expression profiles and whole-genome patterns of LOH might be better suited to define a heterogeneous disease such as RMS than conventional histological methods. Analysis was performed on initial diagnostic biopsy specimens from 160 cases of RMS drawn primarily from (IRSG)-IV and (IRSG)-V RMS studies conducted by the COG.8,9,21 These samples were analyzed using Affymetrix (Santa Clara, CA) 22,000 gene U133A expression arrays and 10,000 SNP mapping arrays, and results were validated by reverse transcriptase-polymerase chain reaction (RT-PCR) and IHC of primary tumor material. Based on our studies we have identified classes of RMS that differ markedly from those of conventional classification schemes including the ICR. These molecularly defined classes are highly reproducible and can be objectively defined, thus providing several advantages over those of current histopathological classification schemes. Moreover, molecular classification imparts prognostically relevant information that may be useful in optimizing risk-adapted therapy.
Materials and Methods
Tumor Specimens
Tumor specimens were obtained from the Intergroup Rhabdomyosarcoma Study Group/Pediatric Cooperative Human Tissue Network (Columbus, OH) and Children’s Hospital Los Angeles institutional tumor banks from 160 patients that were enrolled in IRSG IV and V COG clinical trials. Frozen tumor samples were sectioned and representative sections were examined. Only samples with tumor cell content of at least 80% were included for analysis. Clinical covariates were obtained from the COG Research Data Center (Arcadia, CA). For clinical characteristics of the data set see Table 1 and Supplemental Table S1 available at http://ajp.amjpathol.org for individual sample covariate data.
Table 1.
Clinical Characteristics of Gene Expression Microarray Data Set
| No. | % | |
|---|---|---|
| Histology | ||
| Alveolar | 66 | 41.3 |
| Mixed alveolar/embryonal | 4 | 2.5 |
| Embryonal | 69 | 43.1 |
| Botryoid | 3 | 1.9 |
| Spindle | 6 | 3.8 |
| Undifferentiated or NRSTS* | 12 | 7.5 |
| Clinical groups | ||
| IA & IB | 32 | 20.0 |
| IIA & IIB | 13 | 8.1 |
| III | 44 | 27.5 |
| IV | 26 | 16.3 |
| Unknown | 45 | 28.1 |
| Alive/Dead | ||
| Alive | 105 | 65.6 |
| Dead | 53 | 33.1 |
| Unknown | 2 | 1.3 |
| Sex | ||
| Male | 98 | 61.3 |
| Female | 52 | 32.5 |
| Unknown | 10 | 6.3 |
| Primary site | ||
| Orbit | 5 | 3.1 |
| Head/Neck | 12 | 7.5 |
| Paramenigeal | 22 | 13.8 |
| Bladder/prostate | 13 | 8.1 |
| Genitourinary Other† | 28 | 17.5 |
| Extremity | 39 | 24.4 |
| Other | 34 | 21.3 |
| Unknown | 7 | 4.4 |
| Age groups | ||
| <1 year | 7 | 4.4 |
| 1–4 years | 50 | 31.3 |
| 5–9 years | 59 | 36.9 |
| 10–14 years | 22 | 13.8 |
| >15 years | 13 | 8.1 |
| Unknown | 9 | 5.6 |
Review diagnosis of undifferentiated sarcoma or non-rhabdomyosarcoma soft-tissue sarcoma.
Non-bladder/prostate genitourinary tumors.
Histology and Molecular Diagnosis
Centrally reviewed (IRSG/Cooperative Human Tissue Network) histological diagnoses were based on the International Classification of Rhabdomyosarcoma criteria, in accordance with IRSG protocols.3,19 Mixed alveolar/embryonal tumors or tumors with any evidence of alveolar histology, classical, or solid variant were classified as the alveolar subtype (ARMS, n = 70). Embryonal tumors were all of classical histology, botryoid or spindle cell variants (Table 1) or not-otherwise specified (ERMS, n = 78). Undifferentiated sarcomas or those sarcomas designated as other because of indeterminate/uncertain diagnosis (eg, non-RMS histology) but placed on RMS treatment protocols were also evaluated (UDS/NRSTS, n = 12). RT-PCR using total RNA extracted from frozen tissue was performed on all tumors with alveolar or mixed alveolar/embryonal histology for detection of PAX3-FKHR and PAX7-FKHR fusion transcripts.12 Additionally, 45 of the ERMS and 8 of the UDS/NRSTS tumors were also assayed for PAX-FKHR transcripts and all were found to be P-F-negative in accordance with previously reported data from IRSG-IV cases.12,13
RNA and DNA Isolation for Microarray Expression and SNP Profiling
DNA and RNA were extracted from frozen tissues with DNA STAT and RNA STAT-60, respectively (Tel-Test Inc., Friendswood, TX). RNA was purified with the RNeasy protect kit (Qiagen, Valencia, CA) according to the manufacturer’s instructions. Biotin-labeled cRNA was prepared from total RNA and hybridized to Affymetrix GeneChip human U133A expression arrays performed according to the manufacturer’s instructions (Affymetrix). Genomic DNA was digested with XbaI, PCR amplified, and hybridized to Affymetrix GeneChip 10K mapping arrays performed according to the manufacturer’s instructions (Affymetrix).
Analysis of Gene Expression
All data management and analyses were conducted using the Genetrix suite of tools for microarray analysis (Epicenter Software, Pasadena, CA). Estimates of relative mRNA abundances for each of the 22,215 probe sets on the Affymetrix U133A expression microarray were derived using the ProbeProfiler algorithm (Corimbia, Berkeley, CA), which weights individual probes in each probe set according to a principal components model.30 Probe set filtering was used to remove genes whose SD was less than 40 Affymetrix average difference intensity units across all of the samples reducing the number of useable probe sets to 11,694 (henceforth, genes).31 Probe set average difference intensity values were truncated at 1 and log transformed. The complete tumor microarray data set can be found on the National Cancer Institute Cancer Array Database at https://array.nci.nih.gov/caarray/project/trich-00099.
k-Means Clustering
Semisupervised clustering was performed using a k-means algorithm. Because the k-means method converges to a local minimum, with the final clusters being dependent on the starting position of the cluster centroids, a metaclustering approach was used in which the clustering was repeated 2000 times and the cluster membership information from each run was aggregated. For each metaclustering run, i) the genes used for classification were independently selected based on the significance level for each gene in a Kruskal-Wallis H test of homogeneity of the expression means values in each of the three ICR histological groups, ii) the initial positions of the k centroid means were randomly selected, iii) a random selection of n (test) samples were separated for cross validation (leave-n-out sampling), where n was set to 10% of the sample set, iv) the k-means algorithm was applied to the remaining (training) samples, v) the membership of each of the n out-of-sample cases was based on the closest training set centroid, vi) a pairwise similarity matrix was cumulated across all metacluster runs, based on the proportion of all runs in which both members of the pair were present in the same test set that placed both members in the same class, and vii) a multidimensional scaling analysis based on the final cumulative similarity matrix was used to generate two-way hierarchical clustering dendrogram. Probe set selection criteria for Kruskal-Wallis H test used a false discovery correction with a P value set to <0.00001 to provide an estimated false discovery rate of 0.1%. Cluster centroids discovery for P-F RMS tumors was done as described above except a t-test was used to select for differentially expressed genes between PAX3-FKHR and PAX7-FKHR ARMS. The multidimensional scaling analysis showing the relative proximities of each sample based on the final cumulative similarity matrix of this first metaclustering round can be seen in Supplemental Figure S1A available at http://ajp.amjpathol.org. Two clusters of P-F RMS are apparent, the colored circles denote the new tumor classes that were used to select for differentially expressed genes in a second round of metaclustering. For fusion-negative tumors the same procedure was applied except using Kruskal-Wallis H test to initially select for genes differentially expressed between spindle/botryoid, embryonal, fusion-negative alveolar, and UDS/NRSTS tumor groups. Clusters identified by this round of metaclustering were used to select for genes and derive the clustering in a second round of metaclustering. Samples and genes were optimally ordered by complete-linkage hierarchical clustering using Pearson’s correlation metrics.
Nearest Shrunken Centroids
The nearest shrunken centroids algorithm, a derivative of SAM (significance analysis of microarrays), developed by Tibshirani and colleagues,32 and implemented within Genetrix, was evaluated as a classification tool by calculation of the centroids for each of the three major tumor classes (P-F RMS, F RMS, and UDS/NRSTS) as determined by our semisupervised metaclustering analyses. Our objective was to define a minimal discriminatory gene signature for RMS tumors and to determine whether the consensus molecular classes observed with analysis of the expression patterns of hundreds of genes (ie, P-F RMS, P-F-negative RMS, and UDS/NRSTS), are reliably identified with a shrunken subset of less than 20 genes. Such a minimal expression signature would be more suited than whole-genome arrays for routine clinical practice (eg, through the use of quantitative RT-PCR or other low-density multiplex assays). Samples evaluated for this analysis consisted of the 55 P-F-positive ARMS histology tumors, 93 P-F-negative tumors (embryonal, spindle, botryoid, and alveolar) and 12 UDS/NRSTS histology tumors (undifferentiated or other) (Figure 1). This combines the accepted or consensus molecular genetic classifiers (ie, P-F-positive or -negative) with the ICR histological classification scheme, and permits closer comparison of a putative expression-based scheme to a purely histological classification scheme. Classes were based on a training set of samples and allocation of members of a test set to the nearest centroid. The training and test sets were created through a leave-n-out cross validation procedure (with n = 16). The initial gene set for classification was the 609 genes that were selected in the all metaclustering analyses, and the centroids were shrunken using a δ value of δ = 1.9. This analysis identified five genes that were used to generate centroids that predicted sample class probabilities with a cross-validated error rate of 5%.
Figure 1.

Semi-supervised expression profiling of RMS and NRSTS tumors. The Kruskal-Wallis H test was used to identify 485 differentially expressed genes (used in at least 50% of the metaclustering rounds) between three main ICR histological groups (ARMS, ERMS, and NRSTS) throughout 2000 rounds of reiterative cross-validated metaclustering. A: Dendrogram derived from Pearson’s correlation complete linkage hierarchical clustering of 160 tumor samples, depicts two main branches that discriminate P-F RMS and all other P-F-negative tumors. The colored legend indicates tumor histology (review diagnosis) and PAX-FKHR (PAX-FOXO1) fusion status (ARMS only). B: Expression matrix depicting the expression patterns of two main gene clusters of 363 and 122 genes differentially expressed between P-F RMS and P-F-negative tumors (ie, two main branches of dendrogram in A). The expression of each gene in each sample was normalized in the pseudo-colored heatmap by the number of standard deviations above (red) and below (blue) the median expression value (black) across all samples.
SNP Analysis
Single nucleotide polymorphism analysis for LOH determination was performed on Affymetrix 10K human SNP chips analyzed using the SNP analysis module of the Genetrix Software package. Regions with LOH were determined by statistical comparison to a pooled normal DNA SNP reference profile available from Affymetrix and based on observation of genomic stretches with an excess of homozygotic SNPs (relative to the expected frequency, derived from SNP reference population allele frequencies). Fractional allelic loss, a measure of genome-wide allelic imbalance was determined as described previously.16
Survival Analysis
Comparison of survival times (censored overall and failure-free survival from the COG Biostatistics Center) was performed using Kaplan-Meier survival plots and log-rank tests of significance. Comparisons between tumor classes and tests of association used Fisher’s exact or χ2 tests where appropriate.
Functional Annotation of Gene Clusters
Functional annotation was performed using the Expression Analysis Systematic Explorer (EASE) software package for overrepresentation analysis of functional gene categories and for multidatabase annotation of the differentially expressed genes.31,34
Immunohistochemistry
Formalin-fixed, paraffin-embedded tissue microarrays (TMAs) for ARMS and ERMS were obtained from the Cooperative Human Tissue Network (Columbus, OH). The ARMS TMA contained 96 tumor sections representing 32 individual ARMS tumors, 5 normal skeletal muscle, and 5 ERMS tumors. The ERMS TMA contained 113 tumor sections comprised of material from 32 individual ERMS, 5 normal skeletal muscle, and 5 ARMS tumors. TMA were deparaffinized and rehydrated followed by heat-induced epitope retrieval in a steamer (Black & Decker, Towson, MD) using antigen Target Retrieval Solution (DAKO, Glostrup, Denmark) (for TFAP2β) or 0.01% pronase protease-induced epitope retrieval (HMGA2). After incubation with normal serum, sections were incubated with rabbit anti-TFAP2β (dilution 1:400; Santa Cruz Biotechnology, Santa Cruz, CA) or rabbit anti-HMGA2 (dilution 1:500; Covance, Berkeley, CA), detected using Vectastain Elite ABC kit and color was developed with diaminobenzidine (Vector Laboratories, Burlingame, CA). TMAs were counterstained with hematoxylin (for HMGA2) or Methyl Green (for TFAP2β). The control antibody, vimentin (dilution, 1:40; Ventana, Tuscon, AZ), was used to determine the integrity of tumor sections and array elements that were negative for vimentin were not scored. Tumors cores were scored as positive if at least 10% of tumor cells stained positively for the antigen in at least two of the three TMA sections evaluated for each patient. Slides were scored independently by two pathologists (T.J.T. and D.E.S.). Sensitivity and specificity were determined as described previously.35
Results
Gene Expression Cluster Analysis of RMS Tumors
To develop a molecular classification scheme for RMS based on specific gene expression patterns of primary diagnostic biopsies, we generated gene expression profiles on a cohort of 160 RMS and UDS/NRSTS tumors (Table 1). Although, the proportion of histological variants in this data set is reasonably representative of their incidence as reported in IRSG clinical trials, we enriched the numbers of cases with alveolar histology to include more translocation-negative ARMS tumors for analysis.19 We hypothesized, as has been reported previously on a smaller cohort of cases,36,37,38 that histological RMS variants would be associated with distinct expression profiles, reflecting inherent biological and clinicopathological differences. To determine the extent of the correlation between the histological classification and sample gene expression profiles, we initially used unsupervised hierarchical clustering (without any supervised gene selection, using 11,694 probe sets that passed a variance filter; see Materials and Methods). Using this method, we did not observe any apparent homogeneous or robust subgrouping of tumor clusters (eg, by histological groups) (data not shown). We then used a novel semisupervised learning approach, called metaclustering, to identify both differentially expressed genes between the major ICR histological groups (ie, ARMS, ERMS, and UDS/NRSTS) and reproducible sample clusters (ie, samples with similar expression patterns). Metaclustering was performed over numerous iterations with sample membership in k-means cluster centroids determined by the cumulative similarity of their gene expression profiles, controlling for centroid false-discovery under leave-10%-out sample cross-validation.39 After 2000 rounds of metaclustering, we identified 485 genes (Supplemental Table S2 available at http://ajp.amjpathol.org), selected using the Kruskal-Wallis H test that were differentially expressed between the three histological groups and used in at least 50% of the cross-validated metaclustering rounds. The genes and samples were then clustered using complete-linkage hierarchical clustering and ordered using the Pearson’s correlation distance metric. Hierarchical clustering analysis of the 160 tumors depicts a dendrogram split into two main branches (Figure 1A). Most of the tumors with ARMS histology and PAX-FKHR expression cluster together on one branch of the dendrogram, whereas ERMS histology tumors including spindle cell and botryoid variants comprised the second branch. However, nearly 20% of tumors with alveolar histology clustered with the ERMS tumors and only one of these tumors expressed a PAX-FKHR fusion gene variant. In addition, we observed a small subclade off of the main ERMS tumor dendrogram branch that contained most of the UDS/NRSTS cases, but this clade was also intermixed with an equal proportion of ERMS tumors. In the corresponding expression matrix presented in Figure 1B, we observe two primary gene clusters including 363 genes with increased expression in PAX-FKHR (P-F RMS) and 122 genes with increased expression in P-F-negative RMS tumors.
To better understand the functional significance of these distinct tumor expression patterns, we used overrepresentation analysis of Gene Ontology (GO) annotations for the identification of biological themes (Supplemental Table S3 available at http://ajp.amjpathol.org) overrepresented in the gene cluster associated with high expression in P-F RMS were genes mapping to chromosome 6, specifically 6q and GO Biological Process neurogenesis. In contrast, in the gene cluster highly expressed in P-F-negative tumors (alternatively, repressed in P-F RMS), genes on chromosome 8, specifically 8q were statistically overrepresented. Two main classes of tumors are apparent and are tightly correlated to the expression of PAX-FKHR fusion genes (ARMS only), or lack thereof (P-F-negative RMS and UDS/NRSTS) in these tumors. This expression signature is independent of tumor histology because P-F-negative ARMS cases cluster with tumors of embryonal and spindle/botryoid histologies but not with alveolar morphology tumors that express PAX-FKHR.
We next performed further metaclustering analyses aimed at determining if additional classes of tumors (ie, those not recognized by conventional histopathological criteria), could be derived from the gene expression data. For tumors that express PAX-FKHR fusions (P-F RMS), we reasoned that molecular-based subclasses of these tumors would reflect expression of either PAX3-FKHR or PAX7-FKHR fusion variants. We implemented the metaclustering algorithm on 55 cases of P-F RMS, using a paired t-test to select for genes differentially expressed between PAX3-FKHR- and PAX7-FKHR-positive ARMS tumors. A total of 199 genes differentially expressed between PAX3-FKHR- and PAX7-FKHR-positive tumors were identified to participate in cluster centroid generation in at least 50% of the cross-validated metacluster rounds (data not shown). A multidimensional scaling plot generated from the cumulative test similarity matrix depicts two clearly defined clusters (Supplemental Figure S1A available at http://ajp.amjpathol.org). These clusters were not, however, strictly correlated to the type of PAX-FKHR fusion variant expressed in these ARMS tumors. A smaller cluster (n = 17) contained most of the PAX7-FKHR cases but also some PAX3-FKHR tumors, whereas the larger cluster (n = 38) comprised ∼90% of the PAX3-FKHR-positive ARMS. A second metaclustering round was initiated but this time we defined the two sample clusters derived in the first metaclustering round as de novo tumor classes to query for differentially expressed genes in a similar manner in a second round of k-means metaclustering. In Figure 2, a two-way hierarchical clustering dendrogram (Figure 2A) and expression matrix (Figure 2B) depict the clustering of the ARMS samples and 222 genes (identified in at least 50% of the cross-validated runs). Two distinct gene expression signatures can be recognized (Supplemental Table S4 available at http://ajp.amjpathol.org). The smaller PAX7-FKHR-like cluster (n = 16, P7F-like), comprised of 11 PAX7-FKHR and 5 PAX3-FKHR tumors, display increased expression of a cluster of 134 genes. The larger PAX3-FKHR-like cluster (n = 39, P3F-like) contained a small number of PAX7-FKHR (n = 5) but most of the PAX3-FKHR tumors and had increased expression of a cluster of 88 genes. Overrepresentation analysis showed biological and functional distinction with the P7F-like gene cluster enriched for genes localized to chromosome 13q arm whereas P3F-like was enriched for genes localized to chromosome 4q (Supplemental Table S5 available at http://ajp.amjpathol.org). This analysis supports the existence of two subclasses of ARMS that are not absolutely correlated to the fusion variant expressed, but rather reflect distinct gene expression signatures for PAX3-FKHR-like and PAX7-FKHR-like tumors, respectively.
Figure 2.

Semi-supervised expression profiling of P-F RMS tumors. P-F-expressing ARMS tumors (n = 55) were subjected to two consecutive rounds of cross-validated metaclustering. The results of the second round of metaclustering are presented in the hierarchical clustering dendrogram (A) and expression matrix (B). Most PAX7-FKHR (purple dots) ARMS co-cluster on the left branch of the dendrogram with five PAX3-FKHR ARMS. The left branch is comprised of mainly PAX3-FKHR ARMS (red dots) but also includes five PAX7-FKHR ARMS (∼30% of this group). The expression matrix depicts the 134-gene P7F-like expression signature, with mean expression for the P7F-like tumors (purple bar) 2.8-fold greater than P3F-like tumors (P < 0.0001) and the 88-gene P3F-like expression signature, with mean expression for the P3F-like tumors (red bar) 2.9-fold higher than in P7F-like tumors (P < 0.0001). The expression of each gene in each sample was normalized in the pseudo-colored heatmap by the number of standard deviations above (red) and below (blue) the median expression value (black) across all samples.
A similar strategy was then implemented for all P-F-negative RMS and UDS/NRSTS tumors (n = 105). We used the Kruskal-Wallis H test to query for differential gene expression patterns among the four histological categories assigned for these P-F-negative tumors (UDS/NRSTS, ARMS, ERMS, and spindle/botryoid morphology). Here, we extracted the spindle/botryoid tumors from the embryonal designation, hypothesizing that these tumors that are typically characterized as displaying well-differentiated histology (ie, spindle cell and botryoid), would differ in their expression patterns when compared with those considered to be of poorly differentiated histology (ie, P-F-negative ARMS and UDS/NRSTS). Cluster membership for P-F-negative tumors was determined as described above for P-F RMS. Reiterative k-means clustering under cross-validation identified 333 genes found to participate in cluster centroid generation in at least 50% of the metaclustering runs (data not shown). Three main clusters of tumors were evident (Supplemental Figure S1B available at http://ajp.amjpathol.org) and these were used to determine gene selection for a second round of metaclustering. The results, depicted in Figure 3, were generated using two-way hierarchical clustering to derive a dendrogram (A) and expression matrix (B) showing the clustering of the P-F-negative tumors based on expression of a set of 387 genes (Supplemental Table S6 available at http://ajp.amjpathol.org). Two main gene clusters and three sample clusters were resolved by hierarchical clustering. One cluster of tumors (n = 29) includes 5 P-F-negative alveolar, 4 spindle/botryoid, and 20 embryonal histology tumors and show increased expression of a group of 176 genes. Overrepresentation analysis of this cluster demonstrates enrichment of GO terms such as BP muscle contraction, CC muscle fiber, and MF structural constituent of muscle, and genes localized to chromosome 1q (Supplemental Table S7 available at http://ajp.amjpathol.org). These tumors thus expressed a muscle differentiation gene signature, including the highest levels of MYOD1 and MYOG (Supplemental Figure S2 available at http://ajp.amjpathol.org) among the total tumor cohort, both of which are well-established markers of rhabdomyogenesis.20 This group was henceforth classified as well-differentiated RMS (WD RMS).
Figure 3.

Semi-supervised expression profiling of P-F-negative tumors. PAX-FKHR fusion-negative tumors (n = 105) were subjected to two consecutive rounds of cross-validated metaclustering. The results of the second round of metaclustering are presented in the hierarchical clustering dendrogram (A) and expression matrix (B). Three main sample clusters are resolved, two clusters on the left branch comprised of an assortment of histological subtypes of P-F-negative RMS and one cluster on the right branch contained most of the NRSTS tumors but also ∼27% of all ERMS tumors. See Figure 1 for tumor sample color legend. The expression matrix depicts the 176-gene muscle differentiation expression signature, highly expressed in well-differentiated WD RMS (blue bar), with mean expression levels 3- and 12-fold greater than in moderately-differentiated MD RMS (green bar) and the UDS/NRSTS (brown bar) tumor classes, respectively (P < 0.0001). The 203-gene chromosome 11 expression signature is expressed at similar levels in WD and MD RMS classes, both more than threefold greater than UDS/NRSTS tumors (P < 0.0001). A small gene cluster of just six genes is expressed at increased levels in the UDS/NRSTS class (arrow). The expression of each gene in each sample was normalized in the pseudo-colored heatmap by the number of standard deviations above (red) and below (blue) the median expression value (black) across all samples.
A second cluster of genes (n = 203) is expressed by both the WD RMS and a second tumor cluster (n = 44), which included 9 alveolar, 4 spindle cell, 1 UDS/NRSTS, and 30 embryonal histology tumors. Overrepresentation analysis of this gene cluster reveals statistically significant enrichment for genes localized to chromosome 11 (both 11p and 11q). Both the WD RMS class and samples in the second sample cluster express this chromosome 11 gene signature, but the second sample cluster shows decreased expression of the muscle differentiation signature. Accordingly we classified these tumors as moderately differentiated RMS (MD RMS). Neither the muscle differentiation nor the chromosome 11 gene signatures are expressed in the third sample cluster (n = 32), which contains 20 tumors with embryonal histology, 1 botryoid tumor, and 11 UDS/NRSTS histology tumors. A very small group of genes (n = 6, too few for overrepresentation analysis) form a gene cluster expressed in these 20 tumors but not in the WD and MD RMS clusters. In contrast to our initial hypothesis, we did not find that histologically well differentiated tumors (ie, spindle cell and botryoid RMS) co-cluster nor did we observe the P-F-negative alveolar histology tumors to co-cluster. Instead, these tumors were distributed evenly across the WD and MD tumor clusters. Notably, the UDS/NRSTS cluster, which as the name implies is enriched for UDS/NRSTS histology tumors, also contains ∼27% of the ERMS histology tumors. Box plots of established markers of rhabdomyogenesis, MYOD1 and myogenin, suggest that histological classification does not explain the variance in expression observed for these markers within histological classes (Supplemental Figure S2, A and B, available at http://ajp.amjpathol.org). In contrast, the molecular classes identified display decreased variance in expression for each marker, suggesting that the degree of rhabdomyogenesis is a key component of the overall phenotype of these tumors, information that is not captured by the current ICR classification but has been suggested previously in alternate classification schemes.5,18,22,40,41
LOH Analysis of RMS
High-density single nucleotide polymorphism (SNP) arrays have been used for high-throughput studies to detect allelic imbalance by analysis of the distribution of polymorphic sites.42,43,44 Using SNP oligonucleotide arrays detecting 11,555 genome-wide SNPs we performed LOH analysis for a subset of 73 tumors (of which 63 samples had corresponding gene expression data) (Supplemental Table S8 available at http://ajp.amjpathol.org). Chromosomal regions were divided into 15-Mb regions (for a total of 182 regions excluding sex chromosomes) and the probability of LOH was calculated for each region (for each sample) as well as the fractional allelic loss (FAL), a measure of the overall allelic imbalance for each sample (see Materials and Methods). Nearly all tumors (94%) had at least one 15-Mb region with LOH but the overall degree of LOH, represented by the FAL, differed greatly between the histological groups (Figure 4A). ERMS histology tumors (including the spindle/botryoid designation) had higher levels of FAL (approximately twofold greater) than ARMS (P < 0.005). Interestingly, as a separate entity, P-F-negative ARMS (n = 4) had mean FAL (0.16 ± 0.06) more than twofold greater than P-F RMS (0.07 ± 0.02, P < 0.02), but similar to that of other P-F-negative embryonal (0.14 ± 0.02) and spindle/botryoid (0.18 ± 0.05) histology tumors (P < 0.8) (Figure 4B). Tumors with UDS/NRSTS histology had mean FAL levels similar to the P-F RMS (0.05 ± 0.02) and nearly threefold lower than ERMS tumors. Twelve tumors that were classified by expression profiling in the previous section as UDS/NRSTS had associated SNP data. Most of these tumors were by central review of ERMS histology (n = 10), but the mean FAL in this molecular class (0.07 ± 0.01) was significantly lower than the mean FAL observed in the WD (0.14 ± 0.04) and MD (0.17 ± 0.03) RMS classes (Figure 4C). Intriguingly, this subset of ERMS histology tumors (that co-clustered with UDS/NRSTS histology tumors) did not have significantly different mean FAL observed in the UDS/NRSTS histology tumors (n = 5). The overall levels of allelic imbalance (ie, FAL) observed in this cohort of RMS tumors are nearly identical to those reported by Visser and colleagues.16
Figure 4.
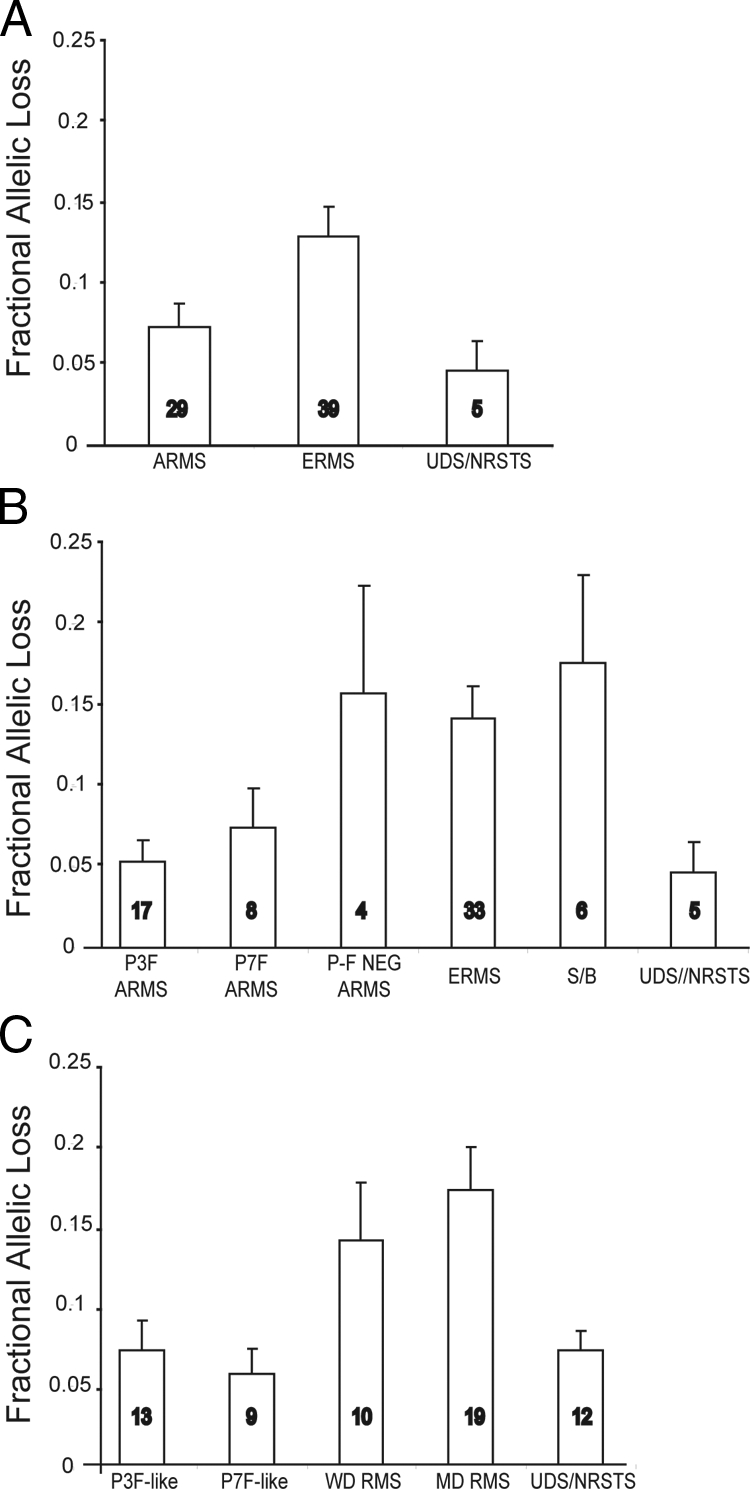
Genome-wide allelic imbalance of RMS and NRSTS using single nucleotide polymorphism microarray analysis. A: Mean fractional allelic loss for each of the three main ICR histological groups (analysis of variance, P < 0.005). B: Mean fractional allelic loss in which ARMS tumors are subdivided by P-F fusion status and ERMS tumors by histological variants (ERMS = classical embryonal, S/B = spindle or botryoid) (P < 0.006). C: Mean fractional allelic loss for tumors according to gene expression-based molecular classes (P < 0.003). Numbers in bars indicate the number of tumors analyzed.
We next analyzed genome-wide patterns of LOH to compare recurrent regions of allelic imbalance in the ICR histological and molecular subclasses. Figure 5 shows a map of 52 genome-wide 15-Mb regions with LOH in at least 10% of tumors. Similar to the results obtained by others,16 the predominant regions of LOH were found along chromosome 11, including both the long and short arms. Nearly 70% of the tumors analyzed had at least one region of LOH along chromosome 11 (including 55% at 11p and 41% at 11q). The proportion of ERMS (including classical embryonal and spindle/botryoid histological subtypes) with LOH along chromosome 11 was considerably higher (at 80%) than in other histological groups (P < 0.002). Other chromosome regions that showed frequent allelic imbalance included 8q, 10q, 10p, 6q, and 4q (Figure 5 and Supplemental Table S9 available at http://ajp.amjpathol.org). For chromosome 11p15, 77% of the P-F-negative RMS displayed LOH of this region (including all four P-F-negative ARMS) compared with only 24% of P-F RMS and no UDS/NRSTS tumors (P < 0.001). For P-F RMS subclasses, we found that 46% of P3F-like tumors displayed LOH on chromosome 4q in contrast to only 22% of P7F-like tumors (P < 0.008) (Figure 5 and Supplemental Table S9 available at http://ajp.amjpathol.org). Chromosome 1q LOH was observed in 50% of the WD but only 21% of the MD P-F-negative RMS tumors (P < 0.002). Intriguingly, these regions were overrepresented in the P3F-like and WD RMS muscle differentiation gene signatures, respectively (Supplemental Tables S5 and S7 available at http://ajp.amjpathol.org). The lone UDS/NRSTS tumor that clustered in the MD RMS class did not show chromosome 11 LOH, although it did express the chromosome 11 gene expression signature (Figure 5, green arrow). In the UDS/NRSTS molecular class, only 3 of 10 embryonal histology tumors that co-clustered with these histological UDS/NRSTS tumors (ie, by gene expression profiling in previous section) displayed chromosome 11 LOH. The other seven did not and shared a sparse LOH pattern similar to histological UDS/NRSTS tumors (Figure 5, brown arrows). A more detailed view of the proportion of tumor samples with chromosome 11 LOH, highlighting the two regions with the highest overall levels of LOH, 11p15.4 and 11q22.1, is depicted in Supplemental Figure S3 available at http://ajp.amjpathol.org.
Figure 5.

Genome-wide patterns of LOH, as determined across 15-Mb windows in 29 ARMS, 39 ERMS, and 5 NRSTS tumors. LOH regions are labeled at the bottom of the LOH map according to chromosome and the region start point in Mb from the p-terminus. LOH map is color-coded in the legend according to the probability of LOH as determined by the expected versus observed heterozygous frequency. Samples are color-coded in legend as in Figure 1. Brown and green arrows indicate seven ERMS tumors that co-clustered with UDS/NRSTS and an NRSTS tumor that co-clustered with MD RMS molecular class, respectively.
Kaplan-Meier Analysis of Patient Survival Stratified Using ICR and Molecular Tumor Classes
The importance of the differential diagnosis RMS to risk-adapted therapy is clearly established.21 As can be seen by Kaplan-Meier analysis for overall survival (OS), tumor histology is a significant prognostic factor in our data set, representative of the overall trends observed in the previous IRS-IV studies (Figure 6A).8,9 ERMS histology tumors had a 5-year OS of 80%, significantly better than either ARMS or NRSTS histology tumors, which both had an OS of 52% (log-rank test, P < 0.001). For tumors with ARMS histology we found that the gene expression-derived subclasses of ARMS tumors, which are not recognized by the conventional classification, imparted additional prognostic power (Figure 6B). Superior outcome for patients with P7F-like tumors (92% 5-yr OS) and poor outcome for P3F-like ARMS (35% 5-year OS) was observed (log-rank, P < 0.03); however, these differences were not independent of PCR-based translocation analysis by multivariate analysis (data not shown). The results were less striking for P-F-negative RMS and UDS/NRSTS histology tumors with respect to survival differences between gene expression-based subclasses of these tumors (Figure 6C). The WD molecular class had the best outcome with a 5-year OS of 87%, followed by the MD and UDS/NRSTS molecular classes with OS of 72% and 62%, respectively (log-rank, P < 0.1). Differences between the WD class and all other P-F-negative tumors (ie, MD and UDS/NRSTS classes) were, however, statistically significant (log-rank, P < 0.05). Survival analysis of patients grouped by gene expression-based classes, therefore, imparts additional prognostic information not recognized by the conventional ICR classification system, and further supports the notion that within the broad histological determination, there exist subclasses of these tumors with distinct biological (ie, gene expression, myogenic differentiation) and clinical characteristics.
Figure 6.
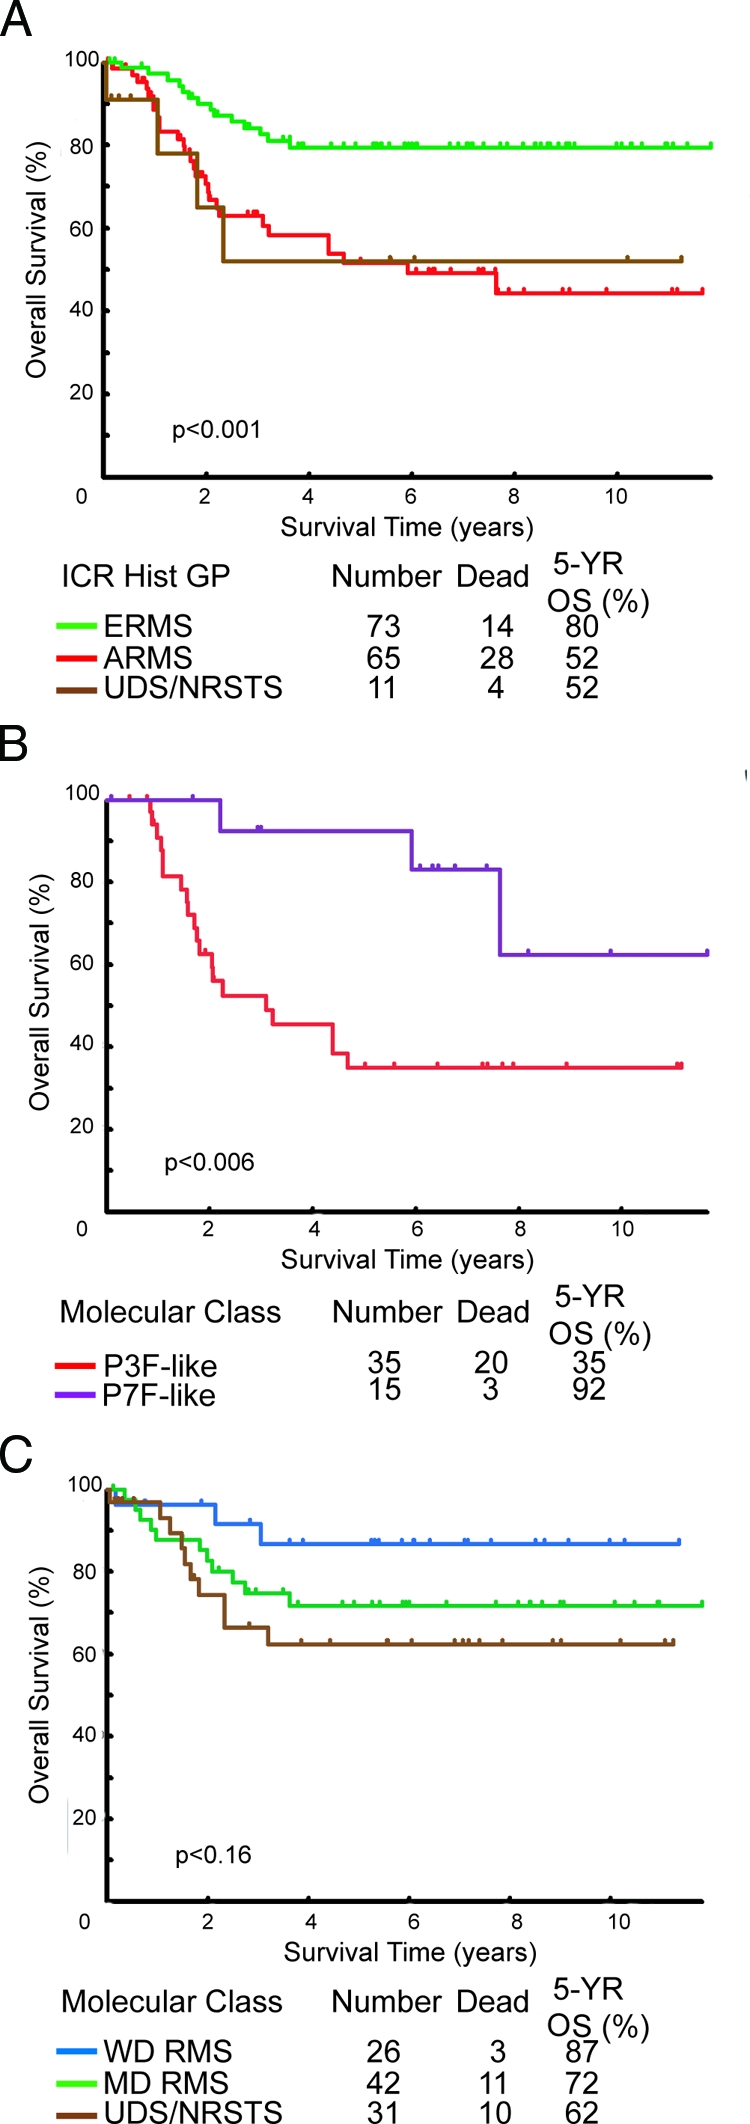
Kaplan-Meier overall survival estimates comparing conventional and molecular classes. A: Patient overall survival by ICR histology-based classification. B and C: Patient overall survival for gene expression-based classes of P-F RMS (ARMS) and P-F-negative tumors (ERMS, ARMS, UDS/NRSTS), respectively. Log-rank test P values in tests for homogeneity are indicated below the curves.
Defining a Minimal Discriminatory Gene Signature for RMS Tumors
We used the nearest shrunken centroids classification algorithm32 to determine whether the consensus molecular classes observed with analysis of the expression patterns of hundreds of genes (ie, P-F RMS, P-F-negative RMS, and UDS/NRSTS), are reliably identified with a shrunken subset of less than 20 genes.. Such a minimal expression signature would be more suited than whole-genome arrays for routine clinical practice (eg, through the use of quantitative RT-PCR or other assays). Samples evaluated for this analysis consisted of the 55 P-F-positive ARMS histology tumors, 93 P-F-negative tumors (embryonal, spindle, botryoid, and alveolar) and 12 UDS/NRSTS histology tumors (undifferentiated or other) (Figure 1). This combines the accepted or consensus molecular genetic classifiers (ie, P-F-positive or -negative) with the ICR histological classification scheme, and permits closer comparison of a putative expression-based scheme to a purely histological classification scheme. We found a minimal gene set of just five genes that can discriminate the 160 tumors into the three gene expression-based classes (ie, PF-RMS, P-F-negative RMS, and UDS/NRSTS) with an error rate of 5% estimated using leave-one-out cross-validation (Table 2 and Supplemental Figure S4A available at http://ajp.amjpathol.org). Rhabdomyogenic genes such as CDH15 (encoding muscle cadherin) and MYOG (encoding myogenin) distinguish all RMS tumors from the UDS/NRSTS class. No individual genes were singularly correlated to the P-F-negative RMS tumor category (ie, highly expressed in P-F-negative but not in either P-F-positive RMS or UDS/NRSTS) but the P-F-positive tumors are distinguished by high expression of TFAP2B (encoding transcription factor AP-2β), CNR1 (encoding cannabinoid receptor 1), and CDH3 (encoding placental P-cadherin). By comparison, leave-one-out cross-validation using this five-gene expression signature as predictors of the conventional ICR-histological class (ie, ARMS, ERMS, UDS/NRSTS) revealed an estimated error rate of 15% (ie, actual ICR class was different from the molecular class prediction for 24 tumors) (Supplemental Figure S4B available at http://ajp.amjpathol.org). This high error rate is attributable to the inclusion of P-F-negative ARMS with P-F RMS in the histological ARMS designation (red arrows, Supplemental Figure S4B available at http://ajp.amjpathol.org). All of the P-F-negative ARMS had class prediction probabilities consistent with the other P-F-negative RMS (and not the P-F RMS tumors) using this five-gene signature. This analysis further reiterates the molecular genetic dichotomy of RMS tumors (ie, based on an presence or absence of P-F fusion gene expression) and demonstrates that highly accurate RMS subtype distinction (ie, ARMS from ERMS, RMS from UDS/NRSTS) is possible by analyzing the expression patterns of a small number of putative diagnostic genes.
Table 2.
Genes used by Nearest Shrunken Centroids for Cross-Validated Class Prediction
| Affy ID | Symbol | Gene name | Class Discriminator | Mean affymetrix difference intensity
|
||
|---|---|---|---|---|---|---|
| P-F RMS | F- RMS* | UDS/NRSTS | ||||
| 214451_at | TFAP2B | Transcription factor AP-2 beta | P-F RMS | 495 | 2 | 2 |
| 213436_at | CNR1 | Cannabinoid receptor 1 (brain) | P-F RMS | 673 | 12 | 14 |
| 203256_at | CDH3 | Cadherin 3, type 1, P-cadherin (placental) | P-F RMS | 162 | 1 | 1 |
| 206327_s_at | CDH15 | Cadherin 15, M-cadherin (myotubule) | RMS versus UDS/NRSTS | 256 | 158 | 16 |
| 207282_s_at | MYOG | Myogenin (myogenic factor 4) | RMS versus UDS/NRSTS | 374 | 106 | 2 |
P-F negative RMS.
Note: all P values <0.00001.
TMA IHC for RMS Subtype Distinction
IHC is the most common molecular technique used by pathologists to aid in the differential diagnosis of RMS, NRSTS, and other small blue round cell tumors of childhood, primarily using antibodies to detect myogenic markers such as MyoD and desmin.19 However, there are currently no reliable markers to distinguish among RMS subtypes, aside from P-F fusion gene detection by FISH or RT-PCR. We therefore used rank-ordered gene lists (Supplemental Table S2 available at http://ajp.amjpathol. org) to evaluate candidates for potential utility as IHC diagnostic markers for RMS. We chose those genes with high levels of expression and high specificity based on their statistical association with the three main molecular classes of RMS, and further filtered them by the availability of commercial antibodies. As observed in the nearest shrunken centroids analysis, TFAP2β was highly expressed by P-F-positive RMS tumors with mean expression levels that were greater than 200-fold relative to all other RMS tumors (P < 0.00001, Supplemental Figure S5 available at http://ajp.amjpathol.org). For the P-F-negative RMS tumors, the transcription factor encoding gene, HMGA2, was identified as being up-regulated in these tumors. Although HMGA2 expression partially overlapped with P-F-positive RMS, it nonetheless strongly correlated with P-F-negative tumors, which had mean expression levels of greater than eightfold over P-F-positive RMS (P < 0.00001). Notably, there was no statistical difference in expression among P-F-negative tumors with alveolar versus embryonal histology (P = 0.8, Supplemental Figure S5 available at http://ajp.amjpathol.org). We then used RMS TMAs for high-throughput analysis of protein levels of these markers among the different RMS tumor types (Figure 7). TMAs containing 209 tumor and normal sections from 64 unique ARMS and ERMS cases (32 each) were tested in these assays, representing an independent data set of tumors not previously analyzed by microarray analysis. As shown in Figure 7, HMGA2 antibodies positively stain ERMS and fusion-negative ARMS, but react poorly with PAX3-FKHR- or PAX7-FKHR-positive ARMS. In contrast, the latter stained strongly with antibodies to TFAP2β. The IHC results validate the gene expression data and demonstrate the utility of TFAP2β as a P-F-positive RMS biomarker. TFAP2β immunostaining showed a sensitivity of 90% and a specificity of 100%, resulting in an overall predictive accuracy for P-F RMS of 96%, which is similar to results reported recently by others.35 For HMGA2, the sensitivity, specificity, and overall accuracy to distinguish P-F-negative RMS from P-F-positive RMS were 79%, 86%, and 82%, respectively; this is significant because of the current lack of available biomarkers for the ERMS subtype. Based on these two novel markers, we believe that virtually all cases of P-F-negative and P-F-positive RMS can be differentially diagnosed by IHC on formalin-fixed, paraffin-embedded tumor sections.
Figure 7.

Immunohistochemical analysis of an independent set of RMS TMAs validates oligonucleotide microarray results and demonstrates the utility of TFAP2β and HMGA2 in RMS diagnosis on formalin-fixed tissue. ERMS TMA with antibodies detecting HMGA2 (left) and ARMS TMA (right) with antibodies detecting TFAP2β are shown on the top row. Representative serial tumor sections are shown staining for HMGA2 (left column, embryonal and alveolar fusion-negative) and TFAP2β (right column, PAX3-FKHR alveolar). Insets show number of positively staining tumors out of total. ERMS and ARMS TMA were counterstained with hematoxylin and methyl green, respectively. Original magnifications, ×200.
Discussion
Several important conclusions emerge from our analysis of RMS, which represents the largest gene expression profiling study performed to date for this disease.28,36 We find that homogeneous and reproducible subtypes of RMS, as reflected in gene expression profiles, are at odds with the International Classification of Rhabdomyosarcoma, which is based on histological and cytological features, alone. Our data indicate that RMS can be effectively divided into two main molecular classes, similar to previous reports that found a dichotomy between tumors with type-specific genetic alterations (eg, recurrent translocations) and tumors with complex karyotypes in adult soft-tissue sarcomas.45,46 We define P-F RMS tumors as those with a specific translocation (eg, PAX3-FKHR or PAX7-FKHR), which is associated with a homogenous, tightly clustering gene expression profile. These tumors also show decreased allelic imbalance or genomic loss in terms of LOH. Our results are supported by previous in vitro experiments, in which we and others have characterized PAX-FKHR expression signatures from analysis of PAX-FKHR model systems and found them to be highly correlated to primary P-F RMS gene expression profiles.31,38 The notion that PAX-FKHR expression serves to define the ARMS subtype has been put forth by other authors,11,47 and comparisons of P-F RMS to P-F-negative RMS on a smaller cohort of cases36 found no statistically significant differences between P-F-negative ARMS and ERMS. Here we show in a larger cohort of RMS cases that there is little distinction between P-F-negative ARMS and ERMS gene expression profiles, but that these tumors are clearly distinct from P-F-positive tumors. Thus it may be more appropriate to define tumors both by histological appearance (alveolar, embryonal, and the embryonal variants) and by fusion status (PF-positive and PF-negative). In addition, we found levels of allelic imbalance and patterns of LOH of P-F-negative ARMS to be more consistent with ERMS than P-F RMS. Others have similarly reported on comparative genomic hybridization data of PAX-FKHR and P-F-negative ARMS, in which the latter share similar chromosomal gains with ERMS tumors but not with P-F-positive ARMS.48
The gene expression profiles of P-F RMS versus P-F-negative RMS is dominated by neurogenesis-associated genes. This is somewhat unexpected, given the traditional notion of RMS as arising from skeletal muscle cells. Given the well-established role for wild-type Pax3 and Pax7 in neurogenesis during early development,49 PAX-FKHR fusion gene expression in RMS cells may aberrantly activate neurogenesis transcription normally silent in the myogenic lineage, resulting in tumor cells with an inherent muscle phenotype but accompanied by the expression of genes characteristic of neurogenic cell lineages.31,50 In addition, we found that genes seemingly repressed in P-F RMS (ie, with increased expression in P-F-negative tumors) were overrepresented by genes localized to chromosome 8q. This is tightly correlated with the observed increased incidence of 8q LOH (specifically 8q24) in P-F-negative tumors and reports by others of copy-number change in ERMS but not ARMS, supporting the hypothesis that deregulation of gene expression in chromosome 8 is a consequence of copy number change specific to ERMS.48,51,52 We also found additional subclasses of P-F-positive RMS in which tumors segregated on the basis of P7F-like or P3F-like gene expression signatures. We observed that patients with P7F-like tumors had significantly improved outcomes in comparison to patients with P3F-like tumors (ie, 93% versus 35%). Sorensen and colleagues,13 reported previously that PAX7-FKHR expression is correlated with better patient outcome than PAX3-FKHR expression in ARMS, but this only reached statistical significance for patients with metastatic disease.53 Because of this ambiguity, specific PAX-FKHR gene fusion status is not yet been factored into treatment protocols. The gene expression data presented here suggests that there are in fact distinct populations of P-F-positive tumors and that these may not be simply correlated only to the type of fusion variant expressed (ie, P3F-like and P7F-like molecular classes) but additional as yet unrecognized or identified molecular features. The P3F-like and P7F-like subclasses are also supported by LOH data in which we found an increased proportion of 4q LOH in the P3F-like tumors that is also correlated to enrichment of genes localized to 4q in the P3F-like gene expression signature. It is important to note that these molecular classes did not impart additional prognostic information over PCR-based classes (ie, PAX3-FKHR and PAX7-FKHR tumors) but taken together the molecular and clinical evidence suggests that there exist ARMS subtypes (ie, PAX7-FKHR or P7F-like tumors) with a superior prognosis.
P-F-negative RMS tumors are typically characterized by complex karyotypes, displaying higher overall levels of allelic imbalance, more pronounced LOH, and heterogeneous gene expression profiles. Based on our findings, these tumors can be distinguished from undifferentiated and NRSTS histology tumors by expression of muscle differentiation and chromosome 11 gene expression signatures, and by increased LOH of chromosome 11. UDS/NRSTS molecular class tumors do not express muscle lineage markers, and display lower overall levels of allelic imbalance (similar to P-F RMS) and fewer regions of LOH, particularly along chromosome 11. In our molecular classification analysis, the UDS/NRSTS designation included ∼25% of all embryonal histology tumors. These embryonal tumors generally had lower levels of FAL similar to UDS/NRSTS histology tumors, and only a few showed LOH of chromosome 11. Although most LOH in tumors is thought to arise sporadically, recurrent regions of LOH are described in ERMS, such as that of chromosome 11p15.5.54,55 A potential consequence of LOH is gene dosage imbalance, in which loss of one allele can cause overexpression from the retained allele (dosage compensation)56 or allele-specific amplification.42 This phenomenon may explain why several chromosomal regions were overrepresented in tumor class-specific gene expression signatures even though there was also increased frequency of LOH in the same tumor class. The most striking example is the enrichment of genes localized to chromosome 11 in the chromosome 11 expression signature, coupled with the predominance of LOH along chromosome 11 in P-F-negative RMS but not UDS/NRSTS. Previous comparative genome hybridization studies have shown amplification of chromosome 11,48 which coupled with the high degree of LOH on chromosome 11 observed, suggests that allele-specific or amplification of the retained allele occurs in these tumors. Studies with higher density SNP, copy number, and exon-specific expression arrays are currently underway to examine the genome and transcriptome at higher resolution to better understand these intriguing observations.
Contrary to what was expected, we did not find a distinct expression signature for the spindle cell or botryoid ERMS variant tumors. These tumors are recognized as highly myogenic, well differentiated tumors with superior expected outcomes for patients.57 However, on a molecular level we could not distinguish spindle/botryoid tumors from a subset of other P-F-negative (including surprisingly, P-F-negative alveolar histology) RMS tumors. These tumors had elevated expression of a characteristic muscle differentiation gene signature and consequently classified as the well differentiated WD RMS subclass. Perhaps, a specific expression signature for spindle or botryoid variants eluded us do to the limited numbers available for study or alternatively, that this differentiated molecular phenotype is one favorable prognostic factor but the fact that these tumors arise in anatomical locations that are more amenable to complete surgical resection is an overriding prognostic factor. These can be distinguished from other RMS tumors such as the moderately differentiated, or MD RMS subclass, which had intermediate expression levels of this signature, and the UDS/NRSTS molecular class, where this expression signature was not detected. The WD class also showed increased expression of genes localized to chromosome 1q and accordingly, LOH analysis revealed this to be a region frequently lost in the WD but not the MD or UDS/NRSTS classes. Finally, outcome for WD RMS patients (5-year OS 87%) maybe be somewhat better than either the MD RMS or UDS/NRSTS classes, approaching the survival of localized embryonal disease.9 Because the proportion of UDS/NRSTS cases in our study is low, a definitive gene expression signature for this subclass remains elusive. Therefore the diagnosis of UDS/NRSTS is still a diagnosis of exclusion, as reported in the original ICR classification study.3 Intriguingly, we found nearly a third of embryonal histology tumors (n = 32) with expression profiles more similar to UDS/NRSTS histology tumors. These poorly differentiated ERMS tumors were found to have lower levels of FAL, fewer characteristic chromosome 11 LOH events, significantly lower expression of established rhabdomyogenic markers such as MYOD and MYOG, and decreased overall survival than the majority of ERMS histology tumors. In IRS-IV treatment protocols, UDS/NRSTS was included but in current practice these tumors are excluded from COG RMS trials, so this distinction maybe of less clinical significance at present. Further studies should however, revisit this issue to more fully understand the link between the degree of myogenic differentiation in RMS tumors to patient prognosis.40,58,59
We also identified a five-gene signature that was highly predictive of the broader gene expression based tumor classes, with only a small (5%) misclassification rate. The five-gene classifier uses three genes highly expressed in P-F RMS (TFAP2β, CDH3, and CNR1) to distinguish these tumors from P-F-negative RMS, irrespective of tumor histology. Quantitative RT-PCR analysis of these three genes could prove to be more reliable in clinical practice than molecular genetic assays for tumor-specific translocations because the latter can be confounded by variant gene fusions (eg, PAX3-NCOA1 or PAX3-AFX). Such variants are not picked up with standard PAX-FKHR RT-PCR or FISH assays, but these tumors are predicted to retain the overall P-F RMS expression signature.36 Two additional genes (MYOG, CDH15) were identified that distinguish RMS from UDS/NRSTS. MYOG is used routinely to aid in the diagnosis of RMS and has shown relatively high specificity in a recent IHC study of a large cohort of tumors.20 Finally, we found that antibodies directed against TFAP2β and HMGA2 proteins can be used for routine evaluation of clinical FFPE tissue sections. Analysis of an independent RMS TMA cohort (no overlap of samples used for microarray analysis) found that expression of TFAP2β is highly specific for P-F RMS, as suggested previously by others.35 This is the first report characterizing HMGA2 IHC for the distinction of P-F-negative RMS from P-F RMS. Wachtel and colleagues,35 recently reported their IHC findings for EGFR and fibrillin-2 on a large cohort of RMS tumors that show an overall accuracy of 62% and 73%, respectively, for distinguishing ERMS from ARMS. With these markers fusion-negative ARMS and P-F ARMS cannot be distinguished from each other whereas with HMGA2, we found an overall accuracy of 82% for distinguishing all P-F-negative RMS (including fusion-negative ARMS) from P-F RMS. The gene expression, SNP, and immunochemical profiles of RMS tumors presented here and previous work by us31 suggest that on a molecular level fusion-negative ARMS are more similar to fusion-negative ERMS than they are to phenotypically similar P-F RMS. Differences between molecular classification schemes proposed by Wachtel and colleagues,35 and our group are being investigated in follow-up studies currently underway.
In conclusion, a molecular classification of RMS classes such as outlined here may allow better characterization of molecularly distinct subgroups of RMS. A molecular-based classification might be more relevant toward directing subtype-specific therapeutics and is likely more tightly linked to underlying biology, such as chimeric gene expression and allelic imbalances, compared with historically defined classes based on histology. Perhaps, a hybrid model combining histopathological and molecular-based class (ie, P-F expression status) will be the most useful to clinicians and their patients. It will be important to test these new findings in a prospective analysis of uniformly treated RMS patients, as is planned in future COG studies of this disease.
Supplementary Material
Acknowledgments
We thank Betty Schaub, Sitara Waidyaratne, Xuan Chen (University of Southern California/Children’s Hospital Los Angeles Microarray Core); Morgan Woo, Sue Ann Phung (Children’s Hospital Los Angeles Histology Core); Dr. George McNamara (Children’s Hospital Los Angeles Imaging Core); Dr. Samuel Wu (Children’s Hospital Los Angeles Cytogenetics Core); Jackie Smith, Julie A. Bridge, Thomas J. Barr (Cooperative Human Tissue Network Biopathology Center); Dr. Fred Ulrich (Children’s Oncology Group); Violette Shahbazian, Xian Fang Liu (Children’s Hospital Los Angeles Pathology); and James W. Jacobsen (Cancer Diagnosis Program, National Cancer Institute) for all of their valuable assistance in this work.
Footnotes
Address reprint requests to Timothy J. Triche, M.D., Ph.D., Department of Pathology, Children’s Hospital Los Angeles, 4650 Sunset Blvd., Los Angeles, CA 90027. E-mail: triche@usc.edu.
Supported in part by the National Cancer Institute (director’s challenge CA-88199 to T.J.T.), Strategic Partnering to Evaluate Cancer Signatures (U01CA-114757 to T.J.T.), and the Children’s Oncology Group (young investigator’s award (to M.J.A.).
The author, S.J.Q. is deceased.
M.J.A., J.C.L., S.J.Q., H.S., D.E.S., J.D.B., W.H.M., P.H.B.S., and T.J.T. are members of the Children’s Oncology Group.
In Memoriam: We honor the memory of our dear colleague, Dr. Stephen J. Qualman (1953 to 2008), who dedicated his life’s work to improving the life of others with cancer through research.
Supplemental material for this article can be found on http://ajp. amjpathol.org.
Present address of E.D.: Genome Diagnostics, Inc., Pasadena, CA.
References
- Asmar L, Gehan EA, Newton WA, Webber BL, Marsden HB, van Unnik AJ, Hamoudi AB, Shimada H, Tsokos M, Harms D. Agreement among and within groups of pathologists in the classification of rhabdomyosarcoma and related childhood sarcomas. Report of an international study of four pathology classifications. Cancer. 1994;74:2579–2588. doi: 10.1002/1097-0142(19941101)74:9<2579::aid-cncr2820740928>3.0.co;2-a. [DOI] [PubMed] [Google Scholar]
- Enterline HT, Horn RC., Jr Alveolar rhabdomyosarcoma; a distinctive tumor type. Am J Clin Pathol. 1958;29:356–366. doi: 10.1093/ajcp/29.4.356. [DOI] [PubMed] [Google Scholar]
- Newton WA, Jr, Gehan EA, Webber BL, Marsden HB, van Unnik AJ, Hamoudi AB, Tsokos MG, Shimada H, Harms D, Schmidt D. Classification of rhabdomyosarcomas and related sarcomas. Pathologic aspects and proposal for a new classification—an Intergroup Rhabdomyosarcoma Study. Cancer. 1995;76:1073–1085. doi: 10.1002/1097-0142(19950915)76:6<1073::aid-cncr2820760624>3.0.co;2-l. [DOI] [PubMed] [Google Scholar]
- Riopelle JL, Thériault JP. Sur une forme méconnue de sarcome des parties molles: le rhabdomyosarcome alvéolaire. Ann Anat Pathol (Paris) 1956;1:88–111. [PubMed] [Google Scholar]
- Tsokos M, Webber BL, Parham DM, Wesley RA, Miser A, Miser JS, Etcubanas E, Kinsella T, Grayson J, Glatstein E. Rhabdomyosarcoma: a new classification scheme related to prognosis. Arch Pathol Lab Med. 1992;116:847–855. [PubMed] [Google Scholar]
- Leuschner I, Newton WA, Jr, Schmidt D, Sachs N, Asmar L, Hamoudi A, Harms D, Maurer HM. Spindle cell variants of embryonal rhabdomyosarcoma in the paratesticular region. A report of the Intergroup Rhabdomyosarcoma Study. Am J Surg Pathol. 1993;17:221–230. doi: 10.1097/00000478-199303000-00002. [DOI] [PubMed] [Google Scholar]
- Newton WA, Jr, Soule EH, Hamoudi AB, Reiman HM, Shimada H, Beltangady M, Maurer H. Histopathology of childhood sarcomas. Intergroup Rhabdomyosarcoma Studies I and II: clinicopathologic correlation. J Clin Oncol. 1988;6:67–75. doi: 10.1200/JCO.1988.6.1.67. [DOI] [PubMed] [Google Scholar]
- Breneman JC, Lyden E, Pappo AS, Link MP, Anderson JR, Parham DM, Qualman SJ, Wharam MD, Donaldson SS, Maurer HM, Meyer WH, Baker KS, Paidas CN, Crist WM. Prognostic factors and clinical outcomes in children and adolescents with metastatic rhabdomyosarcoma—a report from the Intergroup Rhabdomyosarcoma Study IV. J Clin Oncol. 2003;21:78–84. doi: 10.1200/JCO.2003.06.129. [DOI] [PubMed] [Google Scholar]
- Crist WM, Anderson JR, Meza JL, Fryer C, Raney RB, Ruymann FB, Breneman J, Qualman SJ, Wiener E, Wharam M, Lobe T, Webber B, Maurer HM, Donaldson SS. Intergroup rhabdomyosarcoma study-IV: results for patients with nonmetastatic disease. J Clin Oncol. 2001;19:3091–3102. doi: 10.1200/JCO.2001.19.12.3091. [DOI] [PubMed] [Google Scholar]
- Barr FG. Fusions involving paired box and fork head family transcription factors in the pediatric cancer alveolar rhabdomyosarcoma. Curr Top Microbiol Immunol. 1997;220:113–129. doi: 10.1007/978-3-642-60479-9_7. [DOI] [PubMed] [Google Scholar]
- Barr FG. Gene fusions involving PAX and FOX family members in alveolar rhabdomyosarcoma. Oncogene. 2001;20:5736–5746. doi: 10.1038/sj.onc.1204599. [DOI] [PubMed] [Google Scholar]
- Barr FG, Qualman SJ, Macris MH, Melnyk N, Lawlor ER, Strzelecki DM, Triche TJ, Bridge JA, Sorensen PH. Genetic heterogeneity in the alveolar rhabdomyosarcoma subset without typical gene fusions. Cancer Res. 2002;62:4704–4710. [PubMed] [Google Scholar]
- Sorensen PH, Lynch JC, Qualman SJ, Tirabosco R, Lim JF, Maurer HM, Bridge JA, Crist WM, Triche TJ, Barr FG. PAX3-FKHR and PAX7-FKHR gene fusions are prognostic indicators in alveolar rhabdomyosarcoma: a report from the children’s oncology group. J Clin Oncol. 2002;20:2672–2679. doi: 10.1200/JCO.2002.03.137. [DOI] [PubMed] [Google Scholar]
- Parham DM, Qualman SJ, Teot L, Barr FG, Morotti R, Sorensen PH, Triche TJ, Meyer WH. Correlation between histology and PAX/FKHR fusion status in alveolar rhabdomyosarcoma: a report from the Children’s Oncology Group. Am J Surg Pathol. 2007;31:895–901. doi: 10.1097/01.pas.0000213436.99492.51. [DOI] [PubMed] [Google Scholar]
- Besnard-Guérin C, Newsham I, Winqvist R, Cavenee WK. A common region of loss of heterozygosity in Wilms’ tumor and embryonal rhabdomyosarcoma distal to the D11S988 locus on chromosome 11p15.5. Hum Genet. 1996;97:163–170. doi: 10.1007/BF02265259. [DOI] [PubMed] [Google Scholar]
- Visser M, Sijmons C, Bras J, Arceci RJ, Godfried M, Valentijn LJ, Voute PA, Baas F. Allelotype of pediatric rhabdomyosarcoma. Oncogene. 1997;15:1309–1314. doi: 10.1038/sj.onc.1201302. [DOI] [PubMed] [Google Scholar]
- Cessna MH, Zhou H, Perkins SL, Tripp SR, Layfield L, Daines C, Coffin CM. Are myogenin and myoD1 expression specific for rhabdomyosarcoma? A study of 150 cases, with emphasis on spindle cell mimics. Am J Surg Pathol. 2001;25:1150–1157. doi: 10.1097/00000478-200109000-00005. [DOI] [PubMed] [Google Scholar]
- Tsokos M. The role of immunocytochemistry in the diagnosis of rhabdomyosarcoma. Arch Pathol Lab Med. 1986;110:776–778. [PubMed] [Google Scholar]
- Qualman SJ, Coffin CM, Newton WA, Hojo H, Triche TJ, Parham DM, Crist WM. Intergroup Rhabdomyosarcoma Study: update for pathologists. Pediatr Dev Pathol. 1998;1:550–561. doi: 10.1007/s100249900076. [DOI] [PubMed] [Google Scholar]
- Morotti RA, Nicol KK, Parham DM, Teot LA, Moore J, Hayes J, Meyer W, Qualman SJ. An immunohistochemical algorithm to facilitate diagnosis and subtyping of rhabdomyosarcoma: the Children’s Oncology Group experience. Am J Surg Pathol. 2006;30:962–968. doi: 10.1097/00000478-200608000-00005. [DOI] [PubMed] [Google Scholar]
- Raney RB, Anderson JR, Barr FG, Donaldson SS, Pappo AS, Qualman SJ, Wiener ES, Maurer HM, Crist WM. Rhabdomyosarcoma and undifferentiated sarcoma in the first two decades of life: a selective review of intergroup rhabdomyosarcoma study group experience and rationale for Intergroup Rhabdomyosarcoma Study V. J Pediatr Hematol Oncol. 2001;23:215–220. doi: 10.1097/00043426-200105000-00008. [DOI] [PubMed] [Google Scholar]
- Schmidt D, Reimann O, Treuner J, Harms D. Cellular differentiation and prognosis in embryonal rhabdomyosarcoma. A report from the Cooperative Soft Tissue Sarcoma Study 1981 (CWS 81). Virchows Arch A Pathol Anat Histopathol. 1986;409:183–194. doi: 10.1007/BF00708327. [DOI] [PubMed] [Google Scholar]
- Crist WM, Garnsey L, Beltangady MS, Gehan E, Ruymann F, Webber B, Hays DM, Wharam M, Maurer HM. Prognosis in children with rhabdomyosarcoma: a report of the intergroup rhabdomyosarcoma studies I and II. Intergroup Rhabdomyosarcoma Committee. J Clin Oncol. 1990;8:443–452. doi: 10.1200/JCO.1990.8.3.443. [DOI] [PubMed] [Google Scholar]
- Meyer WH, Spunt SL. Soft tissue sarcomas of childhood. Cancer Treat Rev. 2004;30:269–280. doi: 10.1016/j.ctrv.2003.11.001. [DOI] [PubMed] [Google Scholar]
- Quackenbush J. Microarray analysis and tumor classification. N Engl J Med. 2006;354:2463–2472. doi: 10.1056/NEJMra042342. [DOI] [PubMed] [Google Scholar]
- Lakhani SR, Ashworth A. Microarray and histopathological analysis of tumours: the future and the past? Nat Rev Cancer. 2001;1:151–157. doi: 10.1038/35101087. [DOI] [PubMed] [Google Scholar]
- Greer BT, Khan J. Diagnostic classification of cancer using DNA microarrays and artificial intelligence. Ann NY Acad Sci. 2004;1020:49–66. doi: 10.1196/annals.1310.007. [DOI] [PubMed] [Google Scholar]
- Khan J, Wei JS, Ringner M, Saal LH, Ladanyi M, Westermann F, Berthold F, Schwab M, Antonescu CR, Peterson C, Meltzer PS. Classification and diagnostic prediction of cancers using gene expression profiling and artificial neural networks. Nat Med. 2001;7:673–679. doi: 10.1038/89044. [DOI] [PMC free article] [PubMed] [Google Scholar]
- Ebert BL, Golub TR. Genomic approaches to hematologic malignancies. Blood. 2004;104:923–932. doi: 10.1182/blood-2004-01-0274. [DOI] [PubMed] [Google Scholar]
- James AC, Veitch JG, Zareh AR, Triche T. Sensitivity and specificity of five abundance estimators for high-density oligonucleotide microarrays. Bioinformatics. 2004;20:1060–1065. doi: 10.1093/bioinformatics/bth038. [DOI] [PubMed] [Google Scholar]
- Davicioni E, Finckenstein FG, Shahbazian V, Buckley JD, Triche TJ, Anderson MJ. Identification of a PAX-FKHR gene expression signature that defines molecular classes and determines the prognosis of alveolar rhabdomyosarcomas. Cancer Res. 2006;66:6936–6946. doi: 10.1158/0008-5472.CAN-05-4578. [DOI] [PubMed] [Google Scholar]
- Tibshirani R, Hastie T, Narasimhan B, Chu G. Diagnosis of multiple cancer types by shrunken centroids of gene expression. Proc Natl Acad Sci USA. 2002;99:6567–6572. doi: 10.1073/pnas.082099299. [DOI] [PMC free article] [PubMed] [Google Scholar]
- Tusher VG, Tibshirani R, Chu G. Significance analysis of microarrays applied to the ionizing radiation response. Proc Natl Acad Sci USA. 2001;98:5116–5121. doi: 10.1073/pnas.091062498. [DOI] [PMC free article] [PubMed] [Google Scholar]
- Hosack DA, Dennis G, Jr, Sherman BT, Lane HC, Lempicki RA. Identifying biological themes within lists of genes with EASE. Genome Biol. 2003;4:R70. doi: 10.1186/gb-2003-4-10-r70. [DOI] [PMC free article] [PubMed] [Google Scholar]
- Wachtel M, Runge T, Leuschner I, Stegmaier S, Koscielniak E, Treuner J, Odermatt B, Behnke S, Niggli FK, Schafer BW. Subtype and prognostic classification of rhabdomyosarcoma by immunohistochemistry. J Clin Oncol. 2006;24:816–822. doi: 10.1200/JCO.2005.03.4934. [DOI] [PubMed] [Google Scholar]
- Wachtel M, Dettling M, Koscielniak E, Stegmaier S, Treuner J, Simon-Klingenstein K, Buhlmann P, Niggli FK, Schafer BW. Gene expression signatures identify rhabdomyosarcoma subtypes and detect a novel t(2;2)(q35;p23) translocation fusing PAX3 to NCOA1. Cancer Res. 2004;64:5539–5545. doi: 10.1158/0008-5472.CAN-04-0844. [DOI] [PubMed] [Google Scholar]
- Laé M, Ahn EH, Mercado GE, Chuai S, Edgar M, Pawel BR, Olshen A, Barr FG, Ladanyi M. Global gene expression profiling of PAX-FKHR fusion-positive alveolar and PAX-FKHR fusion-negative embryonal rhabdomyosarcomas. J Pathol. 2007;212:143–151. doi: 10.1002/path.2170. [DOI] [PubMed] [Google Scholar]
- Mercado GE, Xia SJ, Zhang C, Ahn EH, Gustafson DM, Lae M, Ladanyi M, Barr FG. Identification of PAX3-FKHR-regulated genes differentially expressed between alveolar and embryonal rhabdomyosarcoma: focus on MYCN as a biologically relevant target. Genes Chromosom Cancer. 2008;47:510–520. doi: 10.1002/gcc.20554. [DOI] [PubMed] [Google Scholar]
- Simon R, Radmacher MD, Dobbin K, McShane LM. Pitfalls in the use of DNA microarray data for diagnostic and prognostic classification. J Natl Cancer Inst. 2003;95:14–18. doi: 10.1093/jnci/95.1.14. [DOI] [PubMed] [Google Scholar]
- Carter RL, Jameson CF, Philp ER, Pinkerton CR. Comparative phenotypes in rhabdomyosarcomas and developing skeletal muscle. Histopathology. 1990;17:301–309. doi: 10.1111/j.1365-2559.1990.tb00733.x. [DOI] [PubMed] [Google Scholar]
- Tonin PN, Scrable H, Shimada H, Cavenee WK. Muscle-specific gene expression in rhabdomyosarcomas and stages of human fetal skeletal muscle development. Cancer Res. 1991;51:5100–5106. [PubMed] [Google Scholar]
- Huang J, Wei W, Zhang J, Liu G, Bignell GR, Stratton MR, Futreal PA, Wooster R, Jones KW, Shapero MH. Whole genome DNA copy number changes identified by high density oligonucleotide arrays. Hum Genomics. 2004;1:287–299. doi: 10.1186/1479-7364-1-4-287. [DOI] [PMC free article] [PubMed] [Google Scholar]
- Hoque MO, Lee CC, Cairns P, Schoenberg M, Sidransky D. Genome-wide genetic characterization of bladder cancer: a comparison of high-density single-nucleotide polymorphism arrays and PCR-based microsatellite analysis. Cancer Res. 2003;63:2216–2222. [PubMed] [Google Scholar]
- Mei R, Galipeau PC, Prass C, Berno A, Ghandour G, Patil N, Wolff RK, Chee MS, Reid BJ, Lockhart DJ. Genome-wide detection of allelic imbalance using human SNPs and high-density DNA arrays. Genome Res. 2000;10:1126–1137. doi: 10.1101/gr.10.8.1126. [DOI] [PMC free article] [PubMed] [Google Scholar]
- Nielsen TO, West RB, Linn SC, Alter O, Knowling MA, O'Connell JX, Zhu S, Fero M, Sherlock G, Pollack JR, Brown PO, Botstein D, van de Rijn M. Molecular characterisation of soft tissue tumours: a gene expression study. Lancet. 2002;359:1301–1307. doi: 10.1016/S0140-6736(02)08270-3. [DOI] [PubMed] [Google Scholar]
- Segal NH, Pavlidis P, Antonescu CR, Maki RG, Noble WS, DeSantis D, Woodruff JM, Lewis JJ, Brennan MF, Houghton AN, Cordon-Cardo C. Classification and subtype prediction of adult soft tissue sarcoma by functional genomics. Am J Pathol. 2003;163:691–700. doi: 10.1016/S0002-9440(10)63696-6. [DOI] [PMC free article] [PubMed] [Google Scholar]
- Anderson J, Ramsay A, Gould S, Pritchard-Jones K. PAX3-FKHR induces morphological change and enhances cellular proliferation and invasion in rhabdomyosarcoma. Am J Pathol. 2001;159:1089–1096. doi: 10.1016/S0002-9440(10)61784-1. [DOI] [PMC free article] [PubMed] [Google Scholar]
- Bridge JA, Liu J, Qualman SJ, Suijkerbuijk R, Wenger G, Zhang J, Wan X, Baker KS, Sorensen P, Barr FG. Genomic gains and losses are similar in genetic and histologic subsets of rhabdomyosarcoma, whereas amplification predominates in embryonal with anaplasia and alveolar subtypes. Genes Chromosom Cancer. 2002;33:310–321. doi: 10.1002/gcc.10026. [DOI] [PubMed] [Google Scholar]
- Chi N, Epstein JA. Getting your Pax straight: Pax proteins in development and disease. Trends Genet. 2002;18:41–47. doi: 10.1016/s0168-9525(01)02594-x. [DOI] [PubMed] [Google Scholar]
- Robson EJ, He SJ, Eccles MR. A PANorama of PAX genes in cancer and development. Nat Rev Cancer. 2006;6:52–62. doi: 10.1038/nrc1778. [DOI] [PubMed] [Google Scholar]
- Bridge JA, Liu J, Weibolt V, Baker KS, Perry D, Kruger R, Qualman S, Barr F, Sorensen P, Triche T, Suijkerbuijk R. Novel genomic imbalances in embryonal rhabdomyosarcoma revealed by comparative genomic hybridization and fluorescence in situ hybridization: an intergroup rhabdomyosarcoma study. Genes Chromosom Cancer. 2000;27:337–344. doi: 10.1002/(sici)1098-2264(200004)27:4<337::aid-gcc1>3.0.co;2-1. [DOI] [PubMed] [Google Scholar]
- Gordon T, McManus A, Anderson J, Min T, Swansbury J, Pritchard-Jones K, Shipley J. Cytogenetic abnormalities in 42 rhabdomyosarcomas: a United Kingdom Cancer Cytogenetics Group Study. Med Pediatr Oncol. 2001;36:259–267. doi: 10.1002/1096-911X(20010201)36:2<259::AID-MPO1063>3.0.CO;2-K. [DOI] [PubMed] [Google Scholar]
- Barr FG, Smith LM, Lynch JC, Strzelecki D, Parham DM, Qualman SJ, Breitfeld PP. Examination of gene fusion status in archival samples of alveolar rhabdomyosarcoma entered on the Intergroup Rhabdomyosarcoma Study-III trial: a report from the Children’s Oncology Group. J Mol Diagn. 2006;8:202–208. doi: 10.2353/jmoldx.2006.050124. [DOI] [PMC free article] [PubMed] [Google Scholar]
- Anderson J, Gordon A, McManus A, Shipley J, Pritchard-Jones K. Disruption of imprinted genes at chromosome region 11p15.5 in paediatric rhabdomyosarcoma. Neoplasia. 1999;1:340–348. doi: 10.1038/sj.neo.7900052. [DOI] [PMC free article] [PubMed] [Google Scholar]
- Anderson J, Gordon A, Pritchard-Jones K, Shipley J. Genes, chromosomes, and rhabdomyosarcoma. Genes Chromosom Cancer. 1999;26:275–285. [PubMed] [Google Scholar]
- Kamb A. Consequences of nonadaptive alterations in cancer. Mol Biol Cell. 2003;14:2201–2205. doi: 10.1091/mbc.E02-11-0732. [DOI] [PMC free article] [PubMed] [Google Scholar]
- Cavazzana AO, Schmidt D, Ninfo V, Harms D, Tollot M, Carli M, Treuner J, Betto R, Salviati G. Spindle cell rhabdomyosarcoma. A prognostically favorable variant of rhabdomyosarcoma. Am J Surg Pathol. 1992;16:229–235. doi: 10.1097/00000478-199203000-00002. [DOI] [PubMed] [Google Scholar]
- Herrera-Gayol A, Royal A, Babai F. Correlation between cell differentiation stage, types of invasion, and hematogenous metastasis in experimental rhabdomyosarcomas. Exp Mol Pathol. 1995;63:1–15. doi: 10.1006/exmp.1995.1025. [DOI] [PubMed] [Google Scholar]
- Massi D, Beltrami G, Capanna R, Franchi A. Histopathological re-classification of extremity pleomorphic soft tissue sarcoma has clinical relevance. Eur J Surg Oncol. 2004;30:1131–1136. doi: 10.1016/j.ejso.2004.07.018. [DOI] [PubMed] [Google Scholar]
Associated Data
This section collects any data citations, data availability statements, or supplementary materials included in this article.