Abstract
We have developed a method for integrating three dimensional—volume reconstructions of spatially resolved matrix-assisted laser desorption/ionization imaging mass spectrometry (MALDI IMS) ion images of whole mouse heads with high-resolution images from other modalities in an animal-specific manner. This approach enabled us to analyze proteomic profiles from MALDI IMS data with corresponding in vivo data provided by magnetic resonance imaging.
In recent years, MALDI IMS has become an important tool in biomedical science, for example, for biomarker discovery and for assessing drug disposition directly from tissue sections1-5. Although current MALDI IMS systems provide information regarding the spatial distribution of macromolecules in a tissue sample, the precise three-dimensional locations of the mass spectra relative to the specimen are lost during sample preparation and analysis. We have developed a method for preserving this spatial information throughout the MALDI IMS preparation and acquisition process, and here we demonstrate how MALDI images can be integrated with anatomic and other data from other imaging modalities. In particular, we show how spatially resolved three dimensional—volume reconstruction MALDI IMS may be coregistered with in vivo magnetic resonance images that can be used for cross-validation, interpretation and visualization.
In MALDI IMS, scanning of the MALDI MS process is carried out in raster fashion over thin tissue slices6. Each laser spot corresponds to a pixel in a two-dimensional array, and the molecular profile of the proteomic content of the tissue is available at every pixel. MALDI IMS provides the ability to place mass spectra, and therefore molecular signatures, in a spatial context in situ (Supplementary Fig. 1 online).
Three dimensional—volume reconstruction MALDI IMS represents a further extension to the planar IMS7,8. The added spatial dimension provides contextual information to the MALDI IMS data that allows the interrogation of proteomic relationships in a tissue volume. Moreover, integration and correlation of three-dimensional MALDI data with other imaging modalities promises to enhance the interpretation of the proteomic data and provide visualization of protein patterns that otherwise may not be apparent.
Here we describe an improved method for extending three-dimensional MALDI IMS to whole-animal tissue sections and present an application for combining this proteomic information with in vivo magnetic resonance images. The benefit of this technique is that it provides data that is relative to the anatomy of the whole animal, rather than just to excised organs or sections. This sample-specific context enhances the feature-rich mass spectra by providing additional anatomical information. Furthermore, the method presented here can provide chemical annotation of tissues imaged by in vivo imaging modalities such as magnetic resonance imaging, computed tomography and positron emission tomography. We demonstrate the correlation between in vivo magnetic resonance images of a tumor-laden mouse brain and proteomic profiles obtained by MALDI IMS.
We carried out spatially resolved MALDI IMS in a brain tumor- laden athymic nude (nu/nu) (Charles River Laboratories) mouse (Supplementary Methods online). Prior to MALDI IMS analysis, we obtained high-resolution in vivo magnetic resonance images of a mouse head on a 7T magnet (Varian) to produce quantitative parametric images of the longitudinal relaxation time (T1), trans-verse relaxation time (T2) and apparent diffusion coefficient (ADC). After magnetic resonance imaging, each animal was immediately killed, perfused with saline and frozen in an ice block to minimize any postmortem protein degradation. The frozen tissue was sectioned on a cryo-microtome (Leica) in the cranial-caudal direction; sections were 20-μm thick. We acquired images of each blockface section using a high-resolution digital camera (Canon) and reconstructed them into a continuous blockface (image) volume (see Supplementary Methods, Supplementary Fig. 2 and Supplementary Movies 1 and 2 online).
We collected tissue sections from selected regions in the blockface volume during sectioning and prepared them for MALDI IMS acquisition. MALDI IMS images from 20 sections taken approximately 1 mm posterior to the bregma9 were collected every 160 μm in an anterior-to-posterior fashion, which encompassed the injection insult and spatial extent of the tumor. Tissue samples were prepared using previously described methods3 and acquired on a linear MALDI time-of-flight mass spectrometer (Autoflex II, Bruker Daltonics). We acquired ion images at a lateral resolution of 150–300 μm, with each pixel being represented by the accumulation of 300 laser shots. Postimage acquisition, MALDI data were processed for spectral smoothing and base-line correction in MATLAB (Math-works) and ProTSData software (Biodesix). To recreate the spatially resolved three dimensional—volume reconstruction MALDI IMS images, a series of postprocessing steps were carried out (see Supplementary Methods and Supplementary Fig. 3 online).
To cross-correlate the three-dimensional MALDI IMS and magnetic resonance images, we rigidly coregistered the blockface volume to the magnetic resonance volume of the mouse’s head. The singular nature of the brain, being almost completely encased in bone, prevents large-scale deformable changes in its anatomy, and therefore, a 6 degree-of-freedom rigid-body (position and orientation) normalized mutual information—based registration was sufficient to align the blockface and magnetic resonance volumes10. Because the MALDI IMS data are intrinsically associated with corresponding blockface images, registration implicitly aligns the MALDI IMS data with the magnetic resonance images.
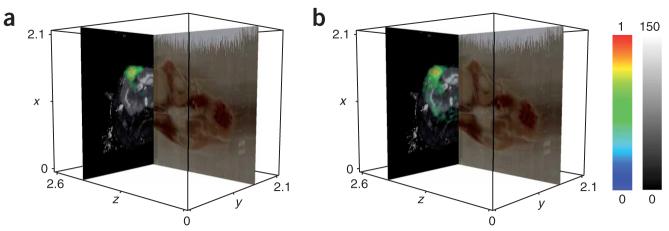
We generated ion volumes for two proteins, the astrocytic phosphoprotein Pea15 (m/z 15,035) and fatty acid binding protein 5 (Fabp5, m/z 15,076), in the spatially resolved MALDI IMS data and volume rendered them against the corresponding in vivo magnetic resonance data (Fig. 1). These proteins were identified previously and were determined to be elevated in grade III gliomas in humans11 (results for other manually identified m/z values are presented in Supplementary Fig. 4 online).
Figure 1.
Coregistered MALDI IMS and magnetic resonance data from a whole mouse head. (a) The red-green-blue image plane shows a sagittal section from the optical blockface volume. The axial magnetic resonance image represents the quantitative transverse relaxation (T2) component of the tissue, rendered in grayscale on a scale of 0 (black) to 150 ms (white). The MALDI IMS data for Pea15 are volume rendered as the yellow and green cloud. (b) The same rendering as in a is shown for Fabp5. Each axis is measured in centimeters and the white outline represents the extent of the blockface volume. The MALDI IMS data are rendered in color representing arbitrary units of intensity with from 0 (blue) to 1 (red).
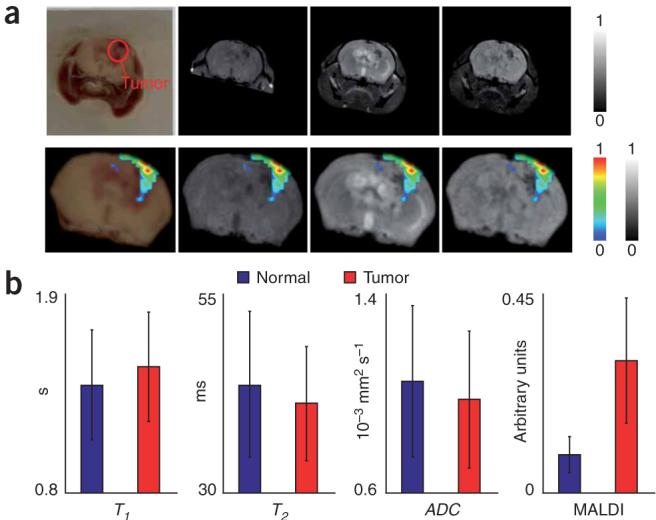
There was good agreement between the areas of high protein concentration and contrast variations in magnetic resonance and blockface volumes in the overlay renderings (Fig. 2a and Supplementary Movie 3 online). We analyzed two regions of interest (ROIs), inside and outside of the tumor, in the cortex (Fig. 2b). We selected voxels in the tumor ROI by thresholding ion intensity values for Pea15 that were 3 s.d. above the mean value throughout the brain. A similar number of voxels were randomly chosen from other areas in the brain to represent the normal tissue ROI. The average values for T1, T2, ADC and MALDI IMS intensity are shown in Table 1. Unpaired f-test for unequal variances showed that normal versus tumor ROIs had equal variances in all cases except for the T1 parameter. For the T1 parameter, an unpaired t-test with unequal variances was carried out and the samples in the normal and tumor region were shown to be significantly different (P ≤ 0.05). For the T2, ADC and MALDI IMS parameters, unpaired t-tests with equal variances showed significant (P ≤ 0.05) differences between samples in the normal and tumor ROIs.
Figure 2.

Intermodal validation of the MALDI IMS signature for Pea15, a biomarker for grade III glioma. (a) Coregistered MALDI IMS and magnetic resonance data from a whole mouse head. Top, corresponding slices from coregistered blockface, T1w’, T2w and diffusion weighted volumes, rendered in normalized grayscale (0 is black, 1 is white). Bottom, the same slice from each modality with the MALDI-IMS protein distribution overlaid. The ranges for all of the imaging data were normalized to 1 with corresponding red-green-blue and grayscale color bars shown. (b) Results of ROI analysis for manually selected ROIs that corresponded to normal and tumor tissue. Representative ROIs in a from a single slice are shown in the blockface image in a.
Table 1.
Measurement statistics of T1,T2,ADCand MALDI ion intensity for Pea15 in normal and tumor tissue
| Normal | Tumor | |
|---|---|---|
| T1 (s) | 1.4 ± 0.3 | 1.5 ± 0.3 |
| T2 (ms) | 43.7 ± 9.0 | 41.4 ± 7.0 |
| ADC (10-3 mm2 per s) | 1.05 ± 0.30 | 0.98 ± 0.27 |
| MALDI (arbitrary units) | 0.09 ± 0.04 | 0.30 ± 0.14 |
15,991 coregistered voxels per each tissue type were used from each modality to calculate the statistics. The tumor tissue was identified by sampling only those voxels in the brain tissue that showed ion intensities above 3 s.d. of the mean intensity for Pea15. A similar number of samples were chosen at random from the remaining voxels to represent normal tissue. The difference in means for each measure was found to be significant (P < 0.05) when comparing normal and tumor voxels.
The significantly different responses for all four parameters measured may represent certain physiological conditions at the tumor implant. As seen on the blockface image, there was a great deal of blood pooling on the ipsilateral side of the tumor insult. Magnetic resonance imaging observations in the presence of blood are quite complicated. The enhanced T1 and diminished T2 and ADC may be explained by the differences in cell density, water and protein contents, as well as by contributions from the paramagnetic effects of blood pooling near the injection insult12.
These results indicate a proof of concept for postmortem proteomic correlation with in vivo anatomical imaging provided by magnetic resonance. The results are encouraging, as proteomic features aligned well with corresponding regions in the magnetic resonance data. Subsequent studies will be required to fully explain the impact of the tissue proteomics on in vivo imaging contrast. The ability to relate proteomic information, both spatially and quantitatively, with in vivo imaging has potentially important implications. Functional information from in vivo studies, such as tumor angiogenesis or tissue degradation, can be correlated with proteomic profiles to help explain the molecular mechanisms of health and disease. Alternatively, understanding the spatial distribution of tissue macromolecules can lend insight into the biophysical basis of contrast in imaging technologies such as magnetic resonance. The method described here can be used to investigate such questions using proteomics and other imaging modalities concurrently.
Supplementary Material
ACKNOWLEDGMENTS
We would like to thank J. True, R. Baheza and the staff of the Vanderbilt University Institute of Imaging Science Center for Small Animal Imaging for their assistance in collecting the imaging data presented here. Financial support was provided by the US National Institutes of Health Institute of Biomedical Imaging and Bioengineering, Cancer Institute, Institute of Neurological Disorders and Stroke and the Institute of General Medical Sciences.
References
- 1.Chaurand P, et al. Am. J. Pathol. 2004;165:1057–1068. doi: 10.1016/S0002-9440(10)63367-6. [DOI] [PMC free article] [PubMed] [Google Scholar]
- 2.Chaurand P, Schwartz SA, Caprioli RM. J. Proteome Res. 2004;3:245–252. doi: 10.1021/pr0341282. [DOI] [PubMed] [Google Scholar]
- 3.Khatib-Shahidi S, et al. Anal. Chem. 2006;78:6448–6456. doi: 10.1021/ac060788p. [DOI] [PubMed] [Google Scholar]
- 4.Reyzer ML, et al. J. Mass Spectrom. 2003;38:1081–1092. doi: 10.1002/jms.525. [DOI] [PubMed] [Google Scholar]
- 5.Reyzer ML, et al. Cancer Res. 2004;64:9093–9100. doi: 10.1158/0008-5472.CAN-04-2231. [DOI] [PubMed] [Google Scholar]
- 6.Stoeckli M, et al. Nat. Med. 2001;7:493–496. doi: 10.1038/86573. [DOI] [PubMed] [Google Scholar]
- 7.Crecelius AC, et al. J. Am. Soc. Mass Spectrom. 2005;16:1093–1099. doi: 10.1016/j.jasms.2005.02.026. [DOI] [PubMed] [Google Scholar]
- 8.Andersson M, Groseclose MR, Deutch AY, Caprioli RM. Nat. Methods. 2008;5:101–108. doi: 10.1038/nmeth1145. [DOI] [PubMed] [Google Scholar]
- 9.Paxinos G, Franklin KBJ. The Mouse Brain in Stereotaxic Coordinates. Academic Press; San Diego: 2001. [Google Scholar]
- 10.Studholme C, Hill DLG, Hawkes DJ. Pattern Recognit. 1999;32:71–86. [Google Scholar]
- 11.Schwartz SA, et al. Cancer Res. 2005;65:7674–7681. doi: 10.1158/0008-5472.CAN-04-3016. [DOI] [PubMed] [Google Scholar]
- 12.Atlas S. Magnetic Resonance Imaging of the Brain and Spine. Lippincott Williams & Wilkins; Philadelphia: 2002. [Google Scholar]
Associated Data
This section collects any data citations, data availability statements, or supplementary materials included in this article.


