

Abstract
Most HIV-infected patients when treated with combination antiretroviral therapy achieve viral loads that are below the current limit of detection of standard assays after a few months. Despite this, virus eradication from the host has not been achieved. Latent, replication-competent HIV-1 can generally be identified in resting memory CD4+ T cells in patients with “undetectable” viral loads. Turnover of these cells is extremely slow but virus can be released from the latent reservoir quickly upon cessation of therapy. In addition, a number of patients experience transient episodes of viremia, or HIV-1 blips, even with suppression of the viral load to below the limit of detection for many years. The mechanisms underlying the slow decay of the latent reservoir and the occurrence of intermittent viral blips have not been fully elucidated. In this study, we address these two issues by developing a mathematical model that explores a hypothesis about latently infected cell activation. We propose that asymmetric division of latently infected cells upon sporadic antigen encounter may both replenish the latent reservoir and generate intermittent viral blips. Interestingly, we show that occasional replenishment of the latent reservoir induced by reactivation of latently infected cells may reconcile the differences between the divergent estimates of the half-life of the latent reservoir in the literature.
Keywords: HIV-1, HAART, latent reservoir, viral blips, asymmetric division, mathematical models
1 Introduction
Although viral loads in HIV-infected individuals can be suppressed to below the limit of detection (e.g., 50 RNA copies/mL) by highly active antiretroviral therapy (HAART) [1] and remain “undetectable” for a prolonged period of time, virus has not been eradicated from patients and viral RNA can usually be detected by more sensitive assays in plasma [2, 3, 4] (Figure 1). A major obstacle to viral eradication is the persistence of a cellular reservoir for HIV-1 in latently infected resting memory CD4+ T cells [5, 6, 7]. Because latently infected cells do not produce virus they are capable of escaping from viral cytopathic effects and host immune mechanisms [8]. If they encounter their recall antigen in the future and become activated, upregulation of viral gene expression will lead to the production of virions that can be detected as low-level viremia.
Figure 1.
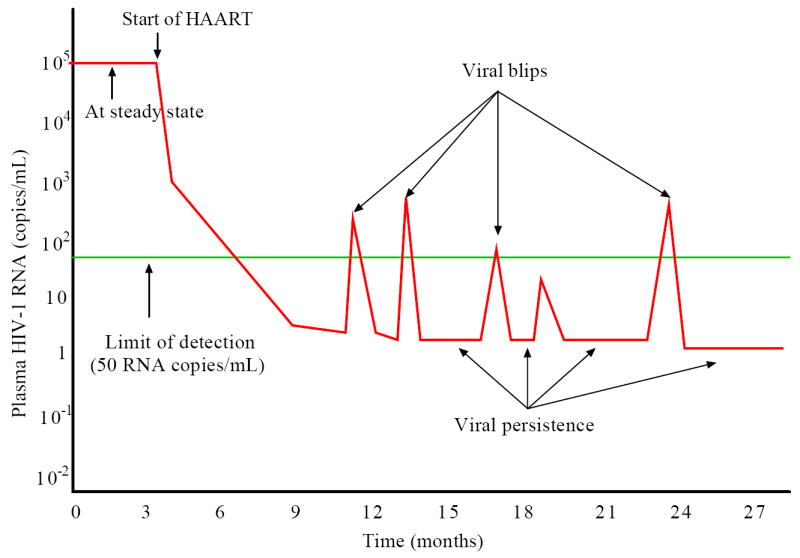
Schematic representation of the viral load before and after HAART. Before treatment, the viral load is at a steady state level. After initiation of HAART, the viral load undergoes multiphasic decay and is suppressed to below the limit of detection (50 RNA copies/mL) of standard assays after several months. A low level of viremia below 50 copies/mL may persist in patients for many years despite apparently effective antiretroviral treatment. Intermittent viral blips with transient HIV-1 RNA above the limit of detection are usually observed in well-suppressed patients.
The decay characteristics of the latent reservoir in resting memory CD4+ T cells remain controversial and estimates of the half-life of the reservoir have been quite divergent. In a cohort initiating therapy during chronic infection, Finzi et al. [9] and Siliciano et al. [10] estimated the half-life of replication-competent HIV-1 in the pool of latently infected cells to be 44 months. In fact, the mean slope of the decay in some patients is not statistically different from zero, implying that the reservoir in these patients might not decay at all. By a similar technique, a half-life of roughly 6 months was estimated in a cohort that initiated treatment in either chronic or acute infection [11, 12]. In a recent study, Chun et al. [13] estimated the half-life to be 4.6 months in patients who initiated antiretroviral therapy early in the infection. Strain et al. [14, 15] have suggested that the decay of latently infected cells decelerates during treatment. They estimated that the latent reservoir had a median half-life of 20 weeks during the first year of therapy. However, the decay rate declined significantly to a median half-life of 70 weeks in the subsequent 3 years. Furthermore, the deceleration appeared to continue. The decelerating decay of the latent reservoir could be explained by the heterogeneity of the pool of latently infected cells [14, 16, 17]. Cells specific for frequently encountered antigen may be preferentially activated and quickly cleared from the reservoir during the first year, whereas cells specific for rarely encountered antigen might persist without activation or be activated slowly in subsequent years.
Although infected individuals may exhibit sustained undetectable viremia on HAART, occasional viral load measurements that are above the limit of detection can occur. Such transient episodes of detectable viremia are called “blips” (Figure 1). Since viral blips are relatively rare events, neither the occurrence timing, frequency, duration and amplitude nor their etiology is well known. With more extensive sampling viral blips are more likely to be identified in the majority of patients at some time. Di Mascio et al. [18] examined viral blip time series obtained from 123 HIV-1 infected patients and suggested that the mean blip frequency was 0.09±0.11/sample with samples taken approximately a month apart, and the mean blip amplitude was 158±132 RNA copies/mL. Whereas the frequency and amplitude of blips did not increase with longer periods of observation, the frequency was found to be inversely correlated with the CD4+ T cell count at the start of therapy [18]. By comparing the dynamics of blips in two treatment subgroups, they observed that the blip frequency was roughly two-fold higher in patients treated during chronic infection than in patients treated during acute infection [19]. They also suggested that blips were not isolated random events that could be explained by assay variations [20], but rather were extended transient episodes with a duration of roughly 3 weeks [21] in which viral load rises rapidly to a peak, followed by a slower biphasic decay [22].
A number of explanations have been suggested for the occurrence of viral blips. Investigations of intermittent viremia suggest that viral blips might originate from higher levels of active viral replication [23], including the selection of drug resistant variants [24]. By comparing viral sequences derived from transient viremia with sequences from peripheral blood mononuclear cells (PBMC) collected before and during HAART, Tobin et al. [25] showed that viral blips could also result from production of virus following immune activation and clonal expansion of latently infected cells. Such activation and generation of viral blips could be due to vaccination [26, 27] or opportunistic infections [28, 29]. Some viral blips may also be the consequence of laboratory error or statistical variation of the viral load around the assay threshold rather than genuine transient episodes of viremia [30].
Curing HIV-1 infection will require more knowledge of the mechanisms underlying the stability of the latent reservoir and occurrence of intermittent viral blips. Studies of the dynamics of the latent reservoir are difficult since latently infected cells are rare, with a frequency on the order of 1 in 106 resting CD4+ T cells [31]. The latent pool may also be heterogeneous with different latently infected T cells having different antigen specificities. Given this heterogeneity, Muller et al. [17] proposed a model in which latently infected cells were stimulated by antigen stochastically. More common antigen would stimulate latent cells into activation, leaving cells with rare antigen specificities in the latent pool. If the latent pool decays by activation, this model then predicts a decelerating decay rate of activation and latent cell decay. Kim and Perelson [16] developed another model that takes into account constant bystander proliferation of latently infected cells and a decreasing latent cell activation rate. Using this model, they suggested that proliferation of latently infected cells could help maintain the latent reservoir while the impact of ongoing viral replication on this compartment remained insignificant if drug efficacy was high. These results are consistent with recent experiments [32] and modeling predictions [33].
Viral blips have also been the subject of mathematical models. Motivated by the observations that vaccination [26, 27] or opportunistic infection [34] is associated with enhanced viral replication, and that antigenic stimulation can result in a burst of virus production [35, 36, 37], Jones and Perelson [28] proposed a model for T cell expansion due to concurrent infection of HIV-infected patients. The model shows that viral blips can be generated by target cell activation upon exposure to the relevant antigen. They further showed that latent cell activation by antigen can likewise generate viral blips [29].
In this study, we develop a new model that considers the immune activation of latently infected cells, and examine whether activation of latently infected cells upon occasional encounter with their recall antigen is able to generate intermittent viral blips, without seriously depleting the latent reservoir. We also explore the hypothesis that latently infected cells undergo asymmetric division upon antigenic stimulation, which can replenish the latent cell pool and provide a potential mechanism to explain the variable decay kinetics of the latent reservoir during potent antiretroviral therapy. We assume that latently infected cells are stimulated stochastically by their relevant antigen. This is, to our best knowledge, the first time that random activation of latently infected cells is incorporated into models to study the characteristics of viral blips. Using this model, we provide quantitative and integrated insight into the mechanisms underlying the slow decay of the latent reservoir and intermittent viral blips in HIV-infected patients on HAART.
2 A basic model of latent cell activation
A basic model of latent cell activation was proposed by Perelson et al. [38] to study whether the activation of latently infected cells contributes to the second phase of the viral decline after initiation of antiretroviral treatment. Let T represent target cells, i.e., CD4+ T cells that are susceptible to HIV infection, T* productively infected cells, L latently infected cells, VI infectious virus, and VNI virus made noninfectious by the action of protease inhibitors, respectively. In the absence of a protease inhibitor we assume all virus belongs to the infectious virus population VI. The following equations describe the rates of change of these populations under the effect of reverse transcriptase (RT) and protease inhibitors:
| (1) |
The constant λ represents the recruitment rate of susceptible T cells, and dT is their death rate. Infection of target cells is assumed to occur at a rate proportional to the product of the concentration of virus and susceptible cells, an assumption that is valid for the blood compartment with relatively high concentration of each population. k is the infection rate constant. δ is the productively infected cell death rate, N is the number of virus particles produced by an infected cell during its life time, and c is the rate at which free virus is cleared. αL is the fraction of infections that result in latency rather than the active production of HIV-1 particles. dL is the death rate of latently infected cells and it is substantially less than δ since latently infected cells are less susceptible to cell mediated killing and death due to viral cytopathicity. a is the rate at which latently infected cells become activated.
RT inhibitors interfere with reverse transcription and prevent completion of synthesis of the viral DNA from HIV RNA. This activity has been modeled by assuming the infection rate k is reduced by a quantity, (1 − ∈RT), where ∈RT is the efficacy of RT inhibitors and 0 ≤ ∈RT ≤ 1. Protease inhibitors prevent HIV protease from cleaving the HIV polyprotein into functional units, causing infected cells to produce immature virus particles that are noninfectious. Thus, only a part, (1 − ∈PI), of newly produced virus is infectious, where ∈PI is the protease inhibitor efficacy and similarly, 0 ≤ ∈PI ≤ 1.
Fitting viral load and infected cell declines to experimental data suggested that the activation of latently infected cells was not a major contributor to the second phase of viral decline [38].
Assuming an overall drug efficacy, ∈ = 1 − (1 − ∈RT)(1 − ∈PI), model (1) can be reduced to a simpler form. Numerical simulations with typical parameters show that the difference (base 10 logarithm) between infectious virus and noninfectious virus, |log(VI) − log(VNI)|, approaches a constant after a short time on protease inhibitor therapy (Figure 2). Because we are interested in the virus dynamics over longer intervals, we can assume that the ratio of infectious and noninfectious virus is a constant θ. Thus, VI = θVNI. Denoting by V the total virus, V = VI + VNI, we obtain that . From the VI equation of model (1), we have
Figure 2.
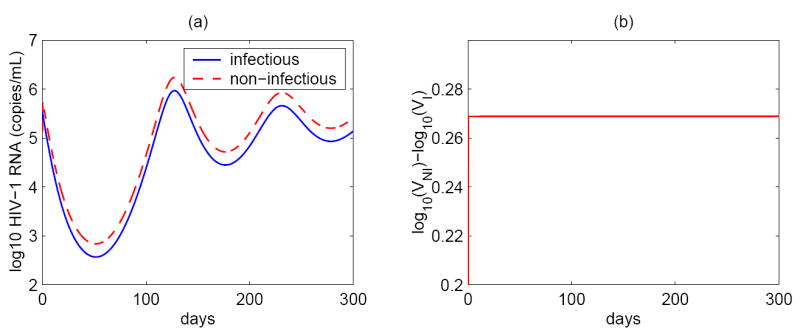
(a) Infectious and non-infectious viral levels simulated by the basic model (1). (b) The difference between non-infectious and infectious HIV-1 RNA concentrations. Shortly after initiation of potent antiretroviral therapy, the difference between non-infectious and infectious viral levels (base 10 logarithm) approaches a constant (~ 0.27). The parameter values used in the simulation are: λ = 104 ml−1 day−1, dT = 0.01 day−1, k = 2.4 × 10⁻⁸ ml day−1, αL = 0.001, ∈RT = 0, ∈PI = 0.65, dL = 0.004 day−1, a = 0.1 day−1, δ = 1 day−1, N = 4000, c = 23 day−1.
The summation of the VI and VNI equations in model (1) leads to the equation
Comparing the above two equations yields the constant so that . Using these relations, we can reduce model (1) to the simpler form:
| (2) |
where ∈ is the overall drug efficacy defined as above.
Equation (2) was used to test if the population of latently infected cells can play a role in maintaining a low steady state viral load during therapy [39]. There is a single nontrivial positive equilibrium of system (2):
| (3) |
Obviously, V̄ exists if and only if the overall drug efficacy ∈ is less than a “critical efficacy”, ∈c, above which virus is predicted to be eradicated. ∈c is the value of ∈ needed to make V̄ = 0 and it is given by
| (4) |
The derivative of V̄ with respect to ∈ is , whose absolute value is very large when ∈ increases to approach ∈c. This implies that the steady state viral load is very sensitive to small changes of the drug efficacy and thus it is difficult to obtain low-level viremic persistence during therapy using Eq. (2) [39, 40].
Another problem with Eq. (2) is that when it is used to study the dynamics of the latent reservoir it is difficult to maintain the stability of the latent cell pool due to the transition into productively infected cells. Furthermore, if occasionally observed viral blips also stem from the activation of latently infected cells, then this activation will deplete the latent reservoir more quickly than the estimated 44 month half-life [9, 10].
3 Model with asymmetric division of latently infected cells upon activation
3.1 Model formulation
Rapid cell division is a hallmark of immune responses. When a cell divides, two identical daughter cells may be produced. In some cases however, cell division leads to two cells that exhibit distinct fates [41]. This is known as asymmetric cell division [42] and it plays an important role in embryonic development and the generation and maintenance of cellular diversity [43]. The best-studied example is stem cells, which divide asymmetrically to give rise to two distinct daughter cells: one a stem cell and one programmed to differentiate into another cell type [43, 44]. In this way, stem cells are capable of both lifelong self-renewal and differentiation into various types of progeny. Recently, evidence has emerged that asymmetric division may also occur in T cells during the initiation of adaptive immune responses [45]. Chang et al. [45] proposed that during the division of a T cell after it responded to a microbial pathogen, the daughter cell proximal to the immunological synapse gave rise to an effector cytotoxic T cell, whereas the daughter derived from the distal pole differentiated into a memory T cell. As a consequence, asymmetric T cell division is able to initiate differentiation associated with the adaptive immune response of T cells. Here we hypothesize that a latently infected cell undergoes asymmetric division after the cell responds to its previously encountered antigen—one daughter cell stays in the latent state, while the other becomes activated and produces virus as a productively infected cell (Figure 3). To study what effects asymmetric division could have on the latent reservoir and viral blips, we consider the following model:
Figure 3.
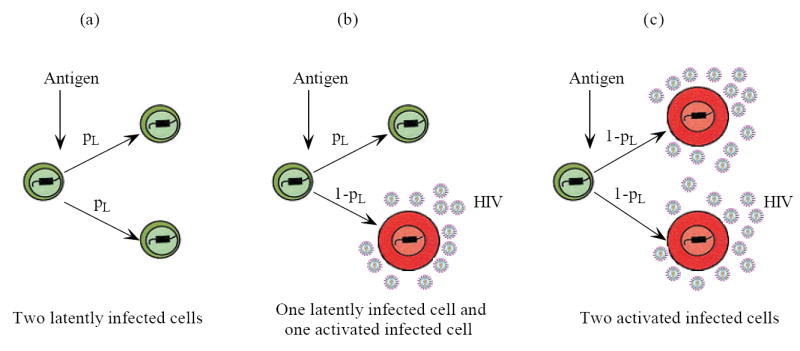
Schematic representation of asymmetric division of latently infected cells upon antigenic stimulation. Suppose a daughter cell has probability pL to stay in the latent state, and probability (1 − pL) to differentiate into a productively infected cell. (a) The probability that both two daughter cells are in the latent state is ; (b) The probability that one daughter cell is latently infected and the other is activated infected is 2pL(1 − pL); (c) The probability that two daughter cells are both activated infected is (1 − pL)2. The expectation of the number of latently infected cells generated every time a parental cell divides is .
| (5) |
When a latently infected cell divides upon antigen stimulation, we assume a daughter cell has probability pL to keep its latent state, and probability (1 − pL) to differentiate into an activated infected cell that produces virus. Therefore, after each division, the probability that two daughter cells are both in the latent state is ; the probability that one daughter cell is latent, the other is activated is 2pL(1 − pL); the probability that two daughter cells are both activated infected cells is (1 − pL)2 (Figure 3). As a consequence, when one latently infected cell is consumed, latently infected cells are generated and reseed the latent cell pool. In the meanwhile, 2(1 − pL) activated infected cells are generated and are able to produce new virions.
To model the antigenic stimulation of latently infected cells, we use an antigen-dependent activation function, f(t), which takes on only two values: 0 when there is no activation, and 1 when there is full activation. If the stimulation switches “on” at time Ton and “off” at time Toff, then the activation function assumes the following expression:
| (6) |
The time when each activation starts, Ton, and the duration that the activation lasts, Δt = Toff − Ton, will be discussed later. This model has previously been used to study T cell activation during lymphocytic choriomeningitis virus infection [46, 47].
With the probability pL and the activation function f(t), asymmetric division of latently infected cells upon intercurrent antigenic stimulation can be formulated in the equations of L(t) and T*(t) of model (5).
3.2 Model parameters
The death rate of target cells is chosen to be dT = 0.01 day−1 [48]. Assuming that the average density of CD4+ T cells within uninfected individuals remains relatively constant at about 106 cells per milliliter [49] and all these cells are targets of infection, we obtain λ = 104 ml−1 day−1. The rate of target cells becoming infected is not well known and is assumed to be k = 2.4 × 10⁻⁸ ml day−1 [50]. The estimate of burst size, N, varies from 100 to a few thousands [51, 52] in humans to as many as 50,000 in SIV-infected rhesus macaques [53]. Here, as an example, we choose N between 2000 and 4000 to get a reasonable amplitude of viral blips in treated patients. The death rate of infected cells, δ, and the clearance rate of virus, c, are chosen to be our current best estimates: δ = 1 day−1 [54] and c = 23 day−1 [55].
We use ∈ = 0.85 as the baseline drug efficacy to ensure that the viral load is suppressed to below the limit of detection after a few months of treatment. As we will show, once the drug efficacy is beyond a threshold, specific values of ∈ do not have much effect on viral persistence and blips, indicating that the contribution from ongoing viral replication is minor. We will also compare the resulting viral load and blips using different ∈. The fraction of new viral infections resulting in latency αL is not known. Here we choose αL = 0.001 [29]. By similar arguments as above, the choice of αL does not have much effect as long as it represents a small fraction of all infections. Latently infected cells are believed to have a long life span, and here we use dL = 0.004 day−1, corresponding to a half-life of approximately 6 months [11, 12]. The activation rate from latently infected cells to productively infected cells is assumed to be a = 0.1 day−1, which is greater than that chosen in [29] because we believe that latent cells have a larger activation rate in the presence of recall antigen. pL is the probability that a daughter cell remains in the latent state when it is produced. The choice of pL and the activation function f(t) varies and will be further discussed below. A summary of the parameters used in this and a later model are listed in Table 1.
Table 1.
Parameter definitions and values used in numerical simulations
| Parameter | Value | Description | Reference |
|---|---|---|---|
| λ | 104 ml−1 day−1 | Recruitment rate of susceptible T cells | [39] |
| dT | 0.01 day−1 | Death rate of susceptible T cells | [48] |
| k | 2.4 × 10⁻⁸ ml day−1 | Infection rate | [50] |
| ∈ | varied | Overall drug efficacy | see text |
| αL | 0.001 | Fraction resulting in latency | [29] |
| dL | 0.004 day−1 | Death rate of latently infected cells | see text |
| a | 0.1 day−1 | Activation rate of latently infected cells | see text |
| pL | varied | Probability that a daughter cell remains latent | see text |
| δ | 1 day−1 | Death rate of productively infected cells | [54] |
| N | varied | Burst size | [52, 53] |
| c | 23 day−1 | Clearance rate of free virus | [55] |
| δ′ | 0.7863 day−1(ml/cell)ω | Density dependent mortality | [39] |
| ω | 0.44 | Power in density dependent mortality function | [56] |
| pυ | 2500 day−1 | Viral production rate | [52] |
Since we are interested in viral dynamics on therapy as plasma virus becomes undetectable by conventional assays, we choose the initial viral load to be 50 HIV-1 RNA copies/mL. With the assumption of quasi-steady state between virus and infected cells, we have the initial value for productively infected cells, T0* = 0.3 cells/mL. After several months of HAART, the CD4+ T cell count increases to a higher level than the pretreatment level. We assume that the initial CD4+ T cell count is T0 = 600 cells/μL [16]. The concentration of latently infected cells at the initial time is calculated from [31]. We assume the total number of latently infected cells with replication-competent viral genomes at t = 0 is 5 × 10⁵ cells, 98% of which are in the lymphoid tissue and the rest are in the blood. Supposing that the blood volume is 5 liter, then the concentration of latently infected cells with replication-competent provirus in the blood is 2 cells/mL. This is set as the initial value of L(t) in model (5).
3.3 Persistent antigen
We first consider a scenario with f(t) ≡ 1. In this case, there is a constant level of antigen, which results in continuous reactivation of latently infected cells. We are interested in determining if asymmetric division of latently infected cells upon encounter with persistent antigen could generate a low-level steady state viral load and/or a stable latent reservoir. We find that the persistence of virus and the latent reservoir depends heavily on pL, the probability that a daughter cell remains in the latent state. (i) If pL is small (< 0.5, for example, ~ 0.3, Figure 4a,b), then the model reduces to a model similar to the basic one (2). The model is sensitive to small changes of the drug efficacy ∈, rendering ongoing viral replication unable to maintain low-level viremia in patients on HAART. If the residual viremia originates mainly from the activation of latently infected cells, then the activation will deplete the latent reservoir quickly and viral persistence would not be achieved. (ii) If the probability pL is large (> 0.5, for example, ~ 0.7, Figure 4c,d), then latently infected cells tend to produce latently infected daughter cells, leading to a substantial increase of the latent pool size even without replenishment from ongoing viral replication. In this case, the viral load can not be suppressed to below the limit of detection because of the transition from the incremental latent reservoir. (iii) If pL is equal to 0.5 or slightly greater than 0.5 (but less than ), then roughly one latent cell is generated every time a latently infected cell divides, making the latent reservoir unaffected by the division of latent cells. In this case, the activation of latently infected cells can maintain the viral load at a low level, without depleting the latent reservoir quickly (Figure 5). The half-life of the latent reservoir is mainly determined by the base turnover rate of latently infected cells rather than ongoing viral replication (Figure 5a). Moreover, although the treatment potency affects the magnitude of the viral load, the half-life of the viral decay with different drug efficacies appears to be the same after one year of treatment (Figure 5b). This indicates that the viral decay rate in this scenario is not influenced by residual viral replication during potent treatment. It is also worth noting that the low-level viremia and slow decay of the latent reservoir are sensitive to the probability pL in the presence of persistent antigen. If the value of pL deviates from 0.5, then the viral and latent reservoir persistence can not be sustained.
Figure 4.
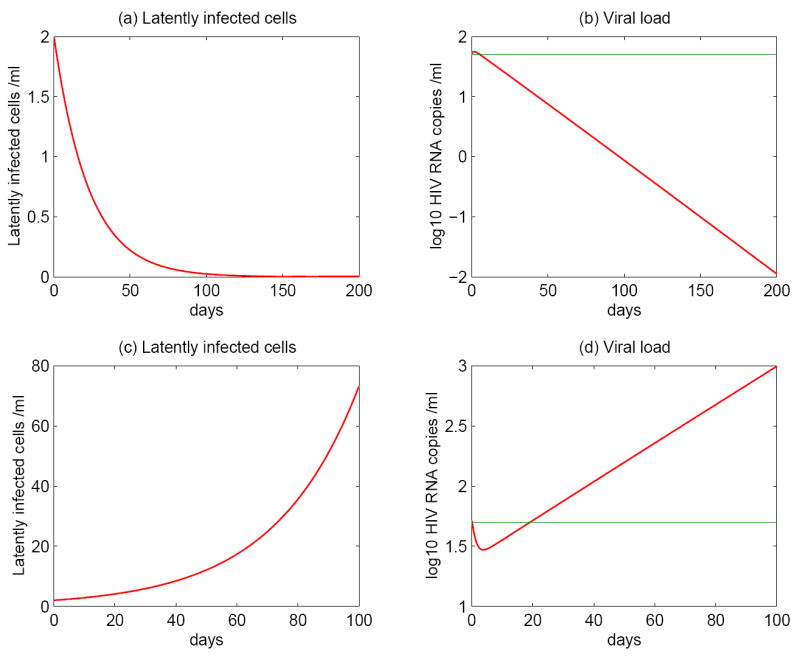
Numerical simulations of model (5) with asymmetric division of latently infected cells stimulated by persistent antigen. The top panels: latently infected cell and HIV-1 RNA levels with pL = 0.3. The renewal ability of latently infected cells is not good enough to maintain the latent reservoir. The model is sensitive to changes of the drug efficacy. Both activation from latent cells and ongoing viral replication cannot sustain the persistence of a low level of viremia. The bottom panels: the probability pL is 0.7. Because of the higher potential to replenish the latent cell pool, the size of the latent reservoir increases substantially. Consequently, the viral load cannot be suppressed to below the limit of detection. The other parameter values are chosen as in Table 1. The green line represents the detection limit of conventional assays, i.e., 50 RNA copies/mL.
Figure 5.
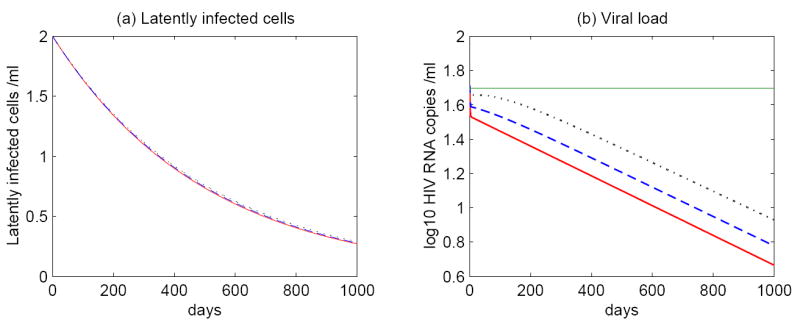
Simulations of model (5) with persistent antigen. The probability pL is fixed at 0.51 and hence latent cell activation can hardly influence the decay of the latent reservoir. The time evolution of (a) latent infected cells and (b) the viral load with different drug efficacies: ∈ = 1 (red solid line); ∈ = 0.9 (blue dashed line); ∈ = 0.8 (black dotted line). The half-life of the latent reservoir is determined by the intrinsic turnover of latently infected cells rather than ongoing viral replication. The HAART potency affects the magnitude of the viral load but not the half-life of the viral decay. The green line represents 50 RNA copies/mL, the detection limit of conventional assays.
3.4 Intermittent antigen
We employ the on-off activation function (6) to explore the effect of intermittent antigen. We will show that occasional activation of latently infected cells upon antigen encounter can generate viral blips, without causing a substantial depletion of the latent reservoir.
3.4.1 Density dependent infected cell death rate
With intermittent antigenic stimulation, model (5) can produce transient episodes of viremia above the limit of detection. However, the viral load declines to an unreasonably low level (below 5 × 10⁻⁵ virions/mL, a level that we can interpret as viral extinction [39]) quickly before the next viral burst (Figure 6b). Although one can include long-lived productively infected cells [38] in the model to prevent this, it greatly complicates the model. Alternatively, more frequent activation may prevent viral decline to an extremely low level (Figure 6d), but the viral load is still sensitive to changes of the drug efficacy. In order to overcome this obstacle and keep the model simple, we use, as suggested in [39, 56], a density-dependent infected cell death rate. Productively infected cells can be killed at a rate that depends on the density of effector cells. With a further assumption that the population size of effector cells is proportional to the density of infected cells, we can choose the productively infected cell death rate to be a function of the infected cell density, for example, δ(T*) = δ′T*ω [39, 56]. Thus, model (5) becomes
Figure 6.

Model (5) is able to generate viral blips with intermittent antigenic activation (panels (b)(d)). The probability pL is fixed at 0.58 in the presence of antigen. N = 3000 and ∈ = 0.8. The other parameter values are the same as in Table 1. The top panels: activations occur at 50 and 100 days; The bottom panels: activations occur more frequently at 20, 40, 60, and 80 days. Each activation lasts 5 days. Occasional replenishment from asymmetric division prevents rapid depletion of the latent reservoir (panels (a)(c)). Although asymmetric division of latent cells is able to generate blips, the viral load decreases to an unreasonably low level between two successive activations (panel (b)). This problem can be overcome with more frequent antigenic stimulation (panel (d)). However, the viral load is still sensitive to the drug efficacy in this case.
| (7) |
where we have assumed virus is produced at a constant rate, pυ, per infected cell. Using the density-dependent decay model, Holte et al. [56] estimated the power ω for each patient by fitting the model to the viral decline of patients under HAART. Here we choose ω = 0.44 as an example to show that using a density-dependent infected cell death rate is able to reduce the sensitivity of the steady state vial load to changes of drug efficacy. The parameter values of δ′ and pυ used in our simulations are listed in Table 1.
3.4.2 Intermittent viral blips
This model with a density dependent productively infected cell death rate is robust to small changes of the drug efficacy and can generate intermittent viral blips in the presence of intercurrent antigenic stimulation. There are three main features characterizing intermittent viral blips: blip frequency, viral amplitude, and duration of occurrence. If viral blips come from the activation of latently infected cells, then the timing and frequency of blips are determined by when and how often the latent cell encounters its recall antigen, respectively. Although intermittent episodes of low-level viremia are often observed in well-suppressed HAART-treated patients, the amplitude and duration of viral blips have only been examined in detail in two studies. Nettles et al. [30] observed low magnitude blips with a median of 79 copies/mL in 9 of 10 patients, while Di Mascio et al. found in 123 patients higher amplitudes with a mean of 158 copies/mL [18] and suggested a duration of approximately 3 weeks [21]. These observations revealed that blips occurred in most patients but typically with a low amplitude—normally from 50 to 500 RNA copies/mL [57]—and they generally resolved within days or weeks. Here we use the mathematical model (7) to study the factors that affect the amplitude and duration of viral blips.
In Figure 7, we show the prediction of the model if we assume a set of fixed times at which latently infected cells encounter antigen and are reactivated, and a fixed duration that each activation lasts. Specifically, activations occur at 10, 60, 110 and 160 days, and each activation lasts 4, 5, 5, and 6 days, respectively (left column). In the right column, each activation lasts longer. We observe that viral blips emerge each time the activation occurs. Thus, the blip frequency depends on how often antigenic stimulation occurs. Moreover, the longer antigen is present, the longer the duration of the blip (Figure 7c,f). This can also be seen clearly from the T* equation in model (7)—the timing and the duration of viral blips are determined by the step activation function f(t).
Figure 7.
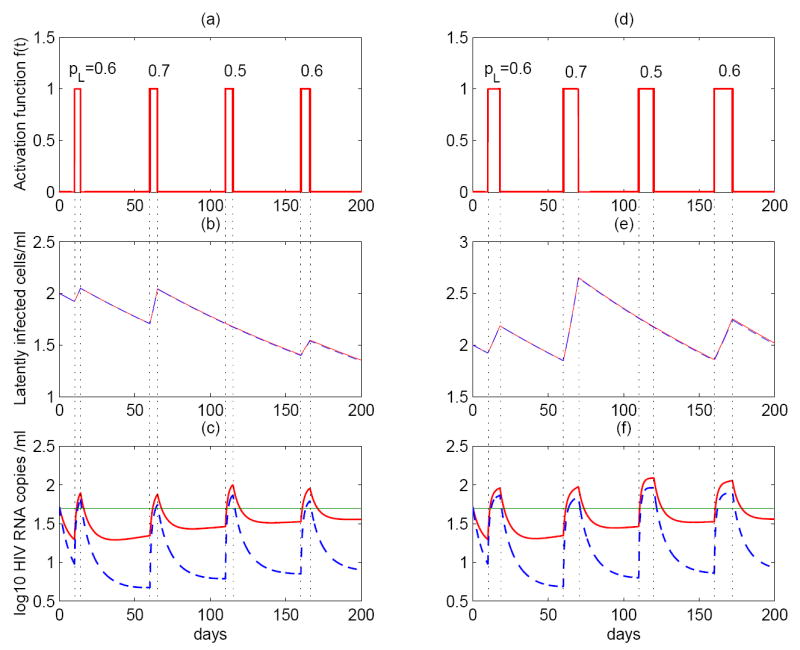
Asymmetric division of latently infected cells stimulated by intermittent antigen (model (7)) can generate intermittent viral blips. The left column: activations occur at the time of 10, 60, 110 and 160 day, and each lasts 4, 5, 5, and 6 days, respectively. The right column: activations occur at the same time, but the antigen lasts twice as long as the left column. In (b)(c)(e)(f), we performed simulations with different drug efficacies: ∈ = 0.8 (red solid line); ∈ = 0.9 (blue dashed line). For a higher level of drug efficacy, the amplitude of blips is smaller. Viral blips emerge whenever there exists antigenic stimulation. When the antigen is present for a longer time (the right column), the duration of blips is longer. If the probability pL is small (< 0.5), then the size of latent reservoir decreases; if pL is big (> 0.5), then the size of latent reservoir increases. This can be used to reconcile the different half-life estimates of the latent reservoir.
The amplitude of viral blips observed in the simulation is determined by several factors. According to the “activation term” (1 − pL)aL(t) in model (7), the amplitude depends primarily on two terms: the probability that a daughter cell remains in the latent state, pL, and the level of latently infected cells, L(t). When pL gets smaller, the population size of latently infected cells decreases. When pL is larger, L(t) increases. Therefore, the activation term remains at a comparable level for different values of pL and thereby the amplitude of blips observed does not vary much in our simulations (Figure 7c). However, the blip amplitude also depends on the drug efficacy of the treatment. With a higher drug efficacy ∈, the blip amplitude declines to a lower level (dashed lines in Figure 7c,f).
3.4.3 Decay of the latent reservoir
The decay characteristics of the latent reservoir remain controversial, with estimates of the decay half-life ranging from about 6 months [11, 12, 13] to 44 months [9, 10]. The hypothesis that asymmetric division of latently infected cells upon intermittent antigenic stimulation occasionally replenishes the latent reservoir can be used to reconcile the differences between these estimates. The pool size of latently infected cells is primarily determined by the probability pL (characterizing the self-renewal ability of the reservoir) and the duration over which latently infected cells divide with this probability (Figure 7a,b,d,e). When pL = 0.5 the latent reservoir decay is unaffected by division. If pL > 0.5, then the size of the reservoir increases substantially. If pL < 0.5, then the latent reservoir decays rapidly due to the activation of latently infected cells on cell division. Since sampling from patients on HAART is not intensive enough to portray all blips, it is difficult to offer an integrated perspective into the dynamics of the latent reservoir.
Occasional replenishment of the reservoir by self-renewal may provide the potential to reconcile these divergent estimates. To see this, we performed stochastic simulations of model (7). We assume the interval between two consecutive activations obeys a normal distribution with a mean of 50 days and a standard deviation of 10 days, and the duration each activation lasts obeys a uniform distribution over the interval of 4 to 6 days. Figure 8 column (a) shows the effects of assuming a uniform distribution for pL over the range [0.65, 0.8], with a mean greater than 0.5. In column (b), pL is uniformly distributed over [0.6, 0.7], with a mean slightly less than that of column (a) but still greater than 0.5, while in column (c), pL is uniformly distributed over [0.4, 0.55], whose mean is less than 0.5, while the duration of each activation is uniformly distributed over a longer period, 7 to 14 days. With these different distributions, we observe three different viral decay profiles of the latent reservoir. In column (a), the size of the latent reservoir oscillates due to occasional antigenic stimulation. However, statistically significant decay of the reservoir is not seen. This is consistent with clinical observations in some patients [9]. In column (b), although occasional activations can replenish the latent cell pool, the size of the reservoir diminishes gradually. Nevertheless, the decay is extremely slow due to the replenishment. This scenario might correspond to a long half-life of 44 months estimated in references [9, 10]. Column (c) is with a small probability pL, which implies that the renewal ability of the reservoir is poor. Occasional encounter with antigen activates latently infected cells to produce virus and consequently depletes the latent reservoir more quickly than in scenarios (a) and (b). This case might explain the short half-life (for example, ~ 6 months) estimated in references [11, 12, 13].
Figure 8.
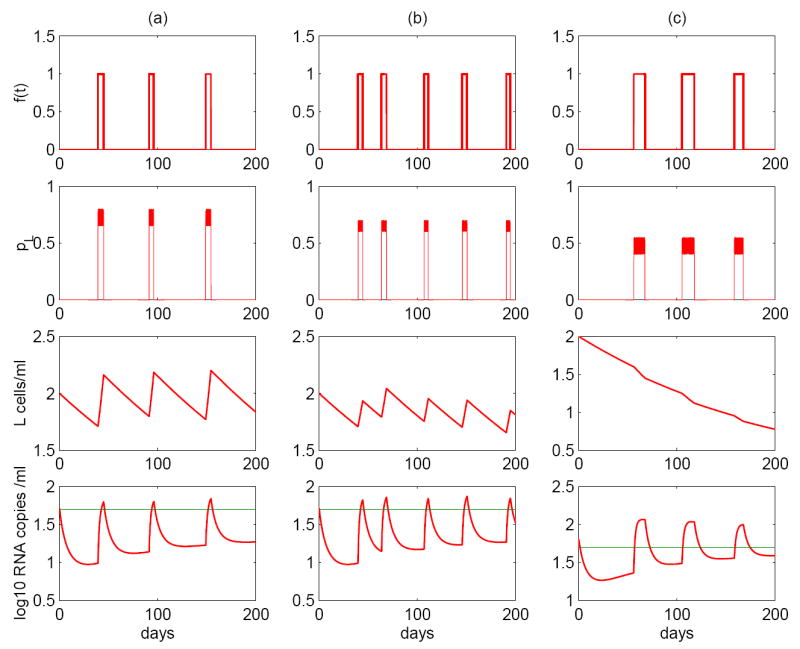
Stochastic simulations of asymmetric division of latently infected cells (model (7)). The model can robustly generate intermittent viral blips. Column (a): the interval between adjacent infections, ΔT, ~ N(50, 10); the duration each activation lasts, Δt, ~ U(4, 6); the probability pL ~ U(0.65, 0.8). Column (b): ΔT ~ N(40, 10), Δt ~ U(4, 6), pL ~ U(0.6, 0.7). Column (c): ΔT ~ N(50, 10), Δt ~ U(7, 14), pL ~ U(0.4, 0.55), viral production rate pυ = 2500 day−1. Three realizations display variable viral decay kinetics of the latent reservoir. (a) The decay rate is not statistically significantly different from zero, suggesting that the latent reservoir may not decay. (b) Although the latently infected cell pool size decreases, the decay rate is very small, corresponding to a very long half-life, for example, 44 months. (c) The latent reservoir shows a quicker decay than the scenario (b), corresponding to a shorter half-life, such as ~ 6 months. The probability that a daughter cell remains in the latent state when cells divide and the duration of each activation are two key factors controlling the decay of the latent reservoir.
It should also be noted that our model (7) can robustly generate viral blips with reasonable duration and amplitude, although the amplitude of viral blips can be largely influenced by the parameters such as the probability pL. By tuning the distributions of pL and the duration of each activation, Δt, we can obtain various decay profiles of the latent reservoir, which correspond to the divergent half-life estimates of the reservoir.
4 Discussion
HIV-1 eradication from infected individuals has not been achieved despite apparently effective combination antiretroviral treatment for a prolonged period of time. A low level of HIV-1 RNA can be detected in plasma by very sensitive assays [2, 3] even though potent HAART is usually able to reduce the plasma viral levels to below 50 RNA copies/mL [1, 58], the detection limit of conventional assays. Latent, replication-competent HIV-1 can generally be identified in resting memory CD4+ T cells [31, 59] and persists in patients on HAART [5, 6, 7]. Turnover of these latently infected cells is extremely slow [6, 11, 12, 10] and the cellular reservoir for HIV-1 in these cells remains a major obstacle to viral eradication [60, 61, 62, 63].
The apparent discrepancy between the half-life estimates of the latent reservoir, from 4.6 month [13] to 44 months [9, 10], was addressed in the study of Ramratnam et al. [11]. They suggested that the variable decay kinetics of the latent reservoir were possibly due to continual replenishment of the reservoir by residual viral replication. In patients who consistently maintained plasma virus of less than 50 RNA copies/mL the half-life of the latent reservoir was around 6 months, whereas those patients with intermittent viral loads above the detection limit often had a much slower decay rate [11]. The argument that residual ongoing viral replication exists during potent antiretroviral therapy and may reseed the latent reservoir is supported by the observations that treatment intensification can accelerate the decay of the reservoir [64] and decrease the viral load to a lower level even in patients with years of highly suppressive therapy [65].
Recent evidence from both mathematical modeling [16, 33] and genotypic analysis [14, 66, 67] showed that with current easy to take highly potent therapies ongoing viral replication might not be an important factor contributing to the stability of the latent reservoir in some patients. The extremely slow decay of the reservoir can also come from the intrinsic stability of latently infected cells. The latent reservoir consists at least in part of resting memory CD4+ T cells, whose intermitotic half-life is around 6 months [68, 69]. Further, memory T cells can be maintained by occasional proliferation in some murine systems [70, 71, 72]. A recent study also reported that proliferation of memory T cells was associated with slower decay of the viral reservoir [73]. Thus, latently infected cells may reseed the reservoir provided that they also undergo occasional proliferation upon activation that does not fully turn on HIV-1 gene expression [63]. In this situation, the latent reservoir may decay with a much longer half-life than 6 months.
Mathematical models including latent cell activation have shown that it is difficult to maintain the low-level viral load seen in many patients on HAART solely by activation of latently infected cells without severely depleting the latent reservoir [39, 74]. As shown in Section 3.4.2, if the transient episodes of low-level viremia originate from activation of latently infected cells upon encounter with their recall antigen, then the activation may deplete the latent reservoir more quickly than observed. This conflict inspired us to search for other mechanisms that can generate intermittent viral blips without largely diminishing the latent cell pool.
Asymmetric cell division is a common concept to explain the capability of stem cells to simultaneously produce terminally differentiated daughter cells with specific properties and functions and to maintain their own population of undifferentiated cells (self-renewal) [41, 42, 43]. Mathematical models, both deterministic and stochastic, that describe asymmetric cell division have been developed to study cell division in a culture of fission yeast [75] and the dynamics of stem cells in human colon crypts [76, 77]. Since cellular replication involves a high risk of genetic alterations and mutations, mathematical models were also proposed to evaluate the impact of asymmetric stem cell division on the expansion of mutant stem cells that are associated with the development of cancer [78, 79].
It is the recent evidence that asymmetric cell division may exist among naive/memory T cells that drives us to speculate that latently infected CD4+ T cells might undergo asymmetric division when they encounter their recall antigen and are reactivated. Chang et al. [45] tested the potential for asymmetric T cell division by studying naive T cells that were engineered to express a T cell receptor specific for a listeria monocytogenes antigen. Based on phenotypic and functional indicators displayed by the progeny, the first two daughter cells were believed to be differentially fated toward effector and memory lineages. Although a subsequent study by the authors is under way that investigates whether asymmetric division would likewise occur in memory T cells upon secondary exposure to the pathogen [45], several previous studies have already suggested that memory T cells have the capacity to renew themselves like stem cells in the response to a secondary challenge [80, 81]. Inspired by these observations, we hypothesized that latently infected CD4+ T cells asymmetrically divide to produce two daughter cells upon antigenic stimulation, one daughter cell is activated to produce new virions while the other still remains in a resting state with various probabilities. By this means, the activation of latent cells renews the latent reservoir and at the same time generates a transient burst of virus.
In the presence of persistent antigen, our model is able to describe the persistence of both low-level viremia and the latent reservoir. Whether immune activation of latent cells can maintain the pool size of latently infected cells depends heavily on pL, the probability that one daughter cell remains in the latent state during the division. This probability characterizes the self-renewal potential of latently infected cells. However, in the scenario of persistent antigen, the model is sensitive to the parameter pL— persistence of both plasma virus and the latent reservoir cannot be achieved unless the probability is equal to or slightly greater than 0.5. Residual ongoing viral replication has a minor impact on the decay of latently infected cells and plasma viral loads, although the HAART potency affects the viral load magnitude. In the model, the half-life of the latent reservoir is primarily determined by the intrinsic turnover of latently infected cells rather than ongoing viral replication, whereas the decay of plasma viral load is mainly determined by activation of latently infected cells (Figure 5).
With intermittent antigen encounter, asymmetric division of latently infected cells can maintain the stability of the latent reservoir and meanwhile generate viral blips with reasonable duration and amplitude in infected individuals on HAART. The model is robust to small changes of parameter values. The timing, frequency, and duration of each viral blip is determined by when, how often, and how long the antigenic activation occurs, respectively. The magnitude of viral blips depends on both the probability of a daughter cell remaining in the latent state and the duration of the activation. An interesting result is that occasional replenishment of the latent reservoir by asymmetric division of latently infected cells is able to reconcile the different estimates of of the half-life of the latent reservoir obtained in the literature. By this means, the model is capable of mimicking various observed kinetic profiles of the decay of the latent reservoir.
A density dependent death rate of productively infected cells is incorporated into the model to avoid unreasonably low levels of virus between two successive activations (Figure 6b). There are other ways to model low-level steady state viral loads, e.g., including long-lived productively infected cells [38] in the model, or having different populations of target cells respond differentially to antiretroviral drugs [39]. More frequent antigenic stimulation is also a possible means to maintain the low-level viral load during therapy (Figure 6d). As a consequence, more viral blips are produced. However, the frequency of viral blips is not well documented due to limitations in how frequently patients can be sampled. Thus, the low-level viremia observed during treatment might not be generated solely from activation of latently infected cells.
In summary, we have developed a mathematical model based on asymmetric division of latently infected cells that can give rise to both viral blips and a stable latent reservoir in patients on HAART. Whether latently infected CD4+ T cells undergo asymmetric cell division still awaits direct experimental verification.
Acknowledgments
Portions of this work were performed under the auspices of the U.S. Department of Energy under contract DE-AC52-06NA25396. This work was supported by NIH grants AI28433 and RR06555. We thank three referees for their constructive comments that improved this manuscript.
Footnotes
Publisher's Disclaimer: This is a PDF file of an unedited manuscript that has been accepted for publication. As a service to our customers we are providing this early version of the manuscript. The manuscript will undergo copyediting, typesetting, and review of the resulting proof before it is published in its final citable form. Please note that during the production process errors may be discovered which could affect the content, and all legal disclaimers that apply to the journal pertain.
References
- 1.Collier AC, Coombs RW, Schoenfeld DA, et al. Treatment of human immunodeficiency virus infection with saquinavir, zidovudine, and zalcitabine. N Engl J Med. 1996;334:1011. doi: 10.1056/NEJM199604183341602. [DOI] [PubMed] [Google Scholar]
- 2.Dornadula G, Zhang H, VanUitert B, et al. Residual HIV-1 RNA in blood plasma of patients taking suppressive highly active antiretroviral therapy. JAMA. 1999;282:1627. doi: 10.1001/jama.282.17.1627. [DOI] [PubMed] [Google Scholar]
- 3.Palmer S, Wiegand AP, Maldarelli F, et al. New real-time reverse transcriptase-initiated PCR assay with single-copy sensitivity for human immunodeficiency virus type 1 RNA in plasma. J Clin Microbiol. 2003;41:4531. doi: 10.1128/JCM.41.10.4531-4536.2003. [DOI] [PMC free article] [PubMed] [Google Scholar]
- 4.Palmer S, Maldarelli F, Wiegand A, et al. Low-level viremia persists for at least 7 years in patients on suppressive antiretroviral therapy. Proc Natl Acad Sci USA. 2008;105:3879. doi: 10.1073/pnas.0800050105. [DOI] [PMC free article] [PubMed] [Google Scholar]
- 5.Chun TW, Stuyver L, Mizell SB, et al. Presence of an inducible HIV-1 latent reservoir during highly active antiretroviral therapy. Proc Natl Acad Sci USA. 1997;94:13193. doi: 10.1073/pnas.94.24.13193. [DOI] [PMC free article] [PubMed] [Google Scholar]
- 6.Finzi D, Hermankova M, Pierson T, et al. Identification of a reservoir for HIV-1 in patients on highly active antiretroviral therapy. Science. 1997;278:1295. doi: 10.1126/science.278.5341.1295. [DOI] [PubMed] [Google Scholar]
- 7.Wong JK, Hezareh M, Gunthard HF, et al. Recovery of replication-competent HIV despite prolonged suppression of plasma viremia. Science. 1997;278:1291. doi: 10.1126/science.278.5341.1291. [DOI] [PubMed] [Google Scholar]
- 8.Lassen K, Han Y, Zhou Y, et al. The multifactorial nature of HIV-1 latency. Trends Mol Med. 2004;10:525. doi: 10.1016/j.molmed.2004.09.006. [DOI] [PubMed] [Google Scholar]
- 9.Finzi D, Blankson J, Siliciano JD, et al. Latent infection of CD4+ T cells provides a mechanism for lifelong persistence of HIV-1, even in patients on effective combination therapy. Nat Med. 1999;5:512. doi: 10.1038/8394. [DOI] [PubMed] [Google Scholar]
- 10.Siliciano JD, Kajdas J, Finzi D, et al. Long-term follow-up studies confirm the stability of the latent reservoir for HIV-1 in resting CD4+ T cells. Nat Med. 2003;9:727. doi: 10.1038/nm880. [DOI] [PubMed] [Google Scholar]
- 11.Ramratnam B, Mittler JE, Zhang L, et al. The decay of the latent reservoir of replication-competent HIV-1 is inversely correlated with the extent of residual viral replication during prolonged anti-retroviral therapy. Nat Med. 2000;6:82. doi: 10.1038/71577. [DOI] [PubMed] [Google Scholar]
- 12.Zhang L, Ramratnam B, Tenner-Racz K, et al. Quantifying residual HIV-1 replication in patients receiving combination antiretroviral therapy. N Engl J Med. 1999;340:1605. doi: 10.1056/NEJM199905273402101. [DOI] [PubMed] [Google Scholar]
- 13.Chun TW, Justement JS, Moir S, et al. Decay of the HIV reservoir in patients receiving antiretroviral therapy for extended periods: implications for eradication of virus. J Infect Dis. 2007;195:1762. doi: 10.1086/518250. [DOI] [PubMed] [Google Scholar]
- 14.Strain MC, Gunthard HF, Havlir DV, et al. Heterogeneous clearance rates of long-lived lymphocytes infected with HIV: intrinsic stability predicts lifelong persistence. Proc Natl Acad Sci USA. 2003;100:4819. doi: 10.1073/pnas.0736332100. [DOI] [PMC free article] [PubMed] [Google Scholar]
- 15.Strain MC, Little SJ, Daar ES, et al. Effect of treatment, during primary infection, on establishment and clearance of cellular reservoirs of HIV-1. J Infect Dis. 2005;191:1410. doi: 10.1086/428777. [DOI] [PubMed] [Google Scholar]
- 16.Kim H, Perelson AS. Viral and latent reservoir persistence in HIV-1-infected patients on therapy. PLoS Comput Biol. 2006;2:e135. doi: 10.1371/journal.pcbi.0020135. [DOI] [PMC free article] [PubMed] [Google Scholar]
- 17.Muller V, Vigueras-Gomez JF, Bonhoeffer S. Decelerating decay of latently infected cells during prolonged therapy for human immunodeficiency virus type 1 infection. J Virol. 2002;76:8963. doi: 10.1128/JVI.76.17.8963-8965.2002. [DOI] [PMC free article] [PubMed] [Google Scholar]
- 18.Di Mascio M, Markowitz M, Louie M, et al. Viral blip dynamics during highly active antiretroviral therapy. J Virol. 2003;77:12165. doi: 10.1128/JVI.77.22.12165-12172.2003. [DOI] [PMC free article] [PubMed] [Google Scholar]
- 19.Di Mascio M, Markowitz M, Louie M, et al. Dynamics of intermittent viremia during highly active antiretroviral therapy in patients who initiate therapy during chronic versus acute and early human immunodeficiency virus type 1 infection. J Virol. 2004;78:10566. doi: 10.1128/JVI.78.19.10566-10573.2004. [DOI] [PMC free article] [PubMed] [Google Scholar]
- 20.Percus JK, Percus OE, Markowitz M, et al. The distribution of viral blips observed in HIV-1 infected patients treated with combination antiretroviral therapy. Bull Math Biol. 2003;65:263. doi: 10.1016/S0092-8240(02)00095-2. [DOI] [PubMed] [Google Scholar]
- 21.Di Mascio M, Percus JK, Percus OE, et al. Duration of an intermittent episode of viremia. Bull Math Biol. 2005;67:885. doi: 10.1016/j.bulm.2004.11.003. [DOI] [PubMed] [Google Scholar]
- 22.Di Mascio M, Ribeiro RM, Markowitz M, et al. Modeling the long-term control of viremia in HIV-1 infected patients treated with antiretroviral therapy. Math Biosci. 2004;188:47. doi: 10.1016/j.mbs.2003.08.003. [DOI] [PubMed] [Google Scholar]
- 23.Havlir DV, Bassett R, Levitan D, et al. Prevalence and predictive value of intermittent viremia with combination HIV therapy. JAMA. 2001;286:171. doi: 10.1001/jama.286.2.171. [DOI] [PubMed] [Google Scholar]
- 24.Cohen Stuart JW, Wensing AM, Kovacs C, et al. Transient relapses (“blips”) of plasma HIV RNA levels during HAART are associated with drug resistance. J Acquir Immune Defic Syndr. 2001;28:105. doi: 10.1097/00042560-200110010-00001. [DOI] [PubMed] [Google Scholar]
- 25.Tobin NH, Learn GH, Holte SE, et al. Evidence that low-level viremias during effective highly active antiretroviral therapy result from two processes: expression of archival virus and replication of virus. J Virol. 2005;79:9625. doi: 10.1128/JVI.79.15.9625-9634.2005. [DOI] [PMC free article] [PubMed] [Google Scholar]
- 26.Gunthard HF, Wong JK, Spina CA, et al. Effect of influenza vaccination on viral replication and immune response in persons infected with human immunodeficiency virus receiving potent antiretroviral therapy. J Infect Dis. 2000;181:522. doi: 10.1086/315260. [DOI] [PubMed] [Google Scholar]
- 27.Jones LE, Perelson AS. Modeling the effects of vaccination on chronically infected HIV-positive patients. J Acquir Immune Defic Syndr. 2002;31:369. doi: 10.1097/00126334-200212010-00001. [DOI] [PubMed] [Google Scholar]
- 28.Jones LE, Perelson AS. Opportunistic infection as a cause of transient viremia in chronically infected HIV patients under treatment with HAART. Bull Math Biol. 2005;67:1227. doi: 10.1016/j.bulm.2005.01.006. [DOI] [PubMed] [Google Scholar]
- 29.Jones LE, Perelson AS. Transient viremia, plasma viral load, and reservoir replenishment in HIV-infected patients on antiretroviral therapy. J Acquir Immune Defic Syndr. 2007;45:483. doi: 10.1097/QAI.0b013e3180654836. [DOI] [PMC free article] [PubMed] [Google Scholar]
- 30.Nettles RE, Kieffer TL, Kwon P, et al. Intermittent HIV-1 viremia (Blips) and drug resistance in patients receiving HAART. JAMA. 2005;293:817. doi: 10.1001/jama.293.7.817. [DOI] [PubMed] [Google Scholar]
- 31.Chun TW, Carruth L, Finzi D, et al. Quantification of latent tissue reservoirs and total body viral load in HIV-1 infection. Nature. 1997;387:183. doi: 10.1038/387183a0. [DOI] [PubMed] [Google Scholar]
- 32.Bailey JR, Sedaghat AR, Kieffer T, et al. Residual human immunodeficiency virus type 1 viremia in some patients on antiretroviral therapy is dominated by a small number of invariant clones rarely found in circulating CD4+ T cells. J Virol. 2006;80:6441. doi: 10.1128/JVI.00591-06. [DOI] [PMC free article] [PubMed] [Google Scholar]
- 33.Sedaghat AR, Siliciano JD, Brennan TP, et al. Limits on replenishment of the resting CD4+ T cell reservoir for HIV in patients on HAART. PLoS Pathog. 2007;3:e122. doi: 10.1371/journal.ppat.0030122. [DOI] [PMC free article] [PubMed] [Google Scholar]
- 34.McLean AR, Nowak MA. Models of interactions between HIV and other pathogens. J Theor Biol. 1992;155:69. doi: 10.1016/s0022-5193(05)80549-1. [DOI] [PubMed] [Google Scholar]
- 35.Ferguson NM, deWolf F, Ghani AC, et al. Antigen-driven CD4+ T cell and HIV-1 dynamics: residual viral replication under highly active antiretroviral therapy. Proc Natl Acad Sci USA. 1999;96:15167. doi: 10.1073/pnas.96.26.15167. [DOI] [PMC free article] [PubMed] [Google Scholar]
- 36.Fraser C, Ferguson NM, Anderson RM. Quantification of intrinsic residual viral replication in treated HIV-infected patients. Proc Natl Acad Sci USA. 2001;98:15167. doi: 10.1073/pnas.261283598. [DOI] [PMC free article] [PubMed] [Google Scholar]
- 37.Fraser C, Ferguson NM, de Wolf F, et al. The role of antigenic stimulation and cytotoxic T cell activity in regulating the long-term immunopathogenesis of HIV: mechanisms and clinical implications. Proc Biol Sci. 2001;268:2085. doi: 10.1098/rspb.2001.1777. [DOI] [PMC free article] [PubMed] [Google Scholar]
- 38.Perelson AS, Essunger P, Cao Y, et al. Decay characteristics of HIV-1-infected compartments during combination therapy. Nature. 1997;387:188. doi: 10.1038/387188a0. [DOI] [PubMed] [Google Scholar]
- 39.Callaway DS, Perelson AS. HIV-1 infection and low steady state viral loads. Bull Math Biol. 2002;64:29. doi: 10.1006/bulm.2001.0266. [DOI] [PubMed] [Google Scholar]
- 40.Bonhoeffer S, Coffin JM, Nowak MA. Human immunodeficiency virus drug therapy and virus load. J Virol. 1997;71:3275. doi: 10.1128/jvi.71.4.3275-3278.1997. [DOI] [PMC free article] [PubMed] [Google Scholar]
- 41.Horvitz HR, Herskowitz I. Mechanisms of asymmetric cell division: two Bs or not two Bs, that is the question. Cell. 1992;68:237. doi: 10.1016/0092-8674(92)90468-r. [DOI] [PubMed] [Google Scholar]
- 42.Jan YN, Jan LY. Asymmetric cell division. Nature. 1998;392:775. doi: 10.1038/33854. [DOI] [PubMed] [Google Scholar]
- 43.Hall PA, Watt FM. Stem cells: the generation and maintenance of cellular diversity. Development. 1989;106:619. doi: 10.1242/dev.106.4.619. [DOI] [PubMed] [Google Scholar]
- 44.Macken CA, Perelson AS. Lecture Notes in Biomathematics. Vol. 76. Springer-Verlag; New York: 1988. Stem Cell Proliferation and Differentiation: A Multitype Branching Process Model. [Google Scholar]
- 45.Chang JT, Palanivel VR, Kinjyo I, et al. Asymmetric T lymphocyte division in the initiation of adaptive immune responses. Science. 2007;315:1687. doi: 10.1126/science.1139393. [DOI] [PubMed] [Google Scholar]
- 46.de Boer RJ, Homann D, Perelson AS. Different dynamics of CD4+ and CD8+ T cell responses during and after acute lymphocytic choriomeningitis virus infection. J Immunol. 2003;171:3928. doi: 10.4049/jimmunol.171.8.3928. [DOI] [PubMed] [Google Scholar]
- 47.de Boer RJ, Oprea M, Antia R, et al. Recruitment times, proliferation, and apoptosis rates during the CD8(+) T-cell response to lymphocytic choriomeningitis virus. J Virol. 2001;75:10663. doi: 10.1128/JVI.75.22.10663-10669.2001. [DOI] [PMC free article] [PubMed] [Google Scholar]
- 48.Mohri H, Bonhoeffer S, Monard S, et al. Rapid turnover of T lymphocytes in SIV-infected rhesus macaques. Science. 1998;279:1223. doi: 10.1126/science.279.5354.1223. [DOI] [PubMed] [Google Scholar]
- 49.Bofill M, Janossy G, Lee CA, et al. Laboratory control values for CD4 and CD8 T lymphocytes: implications for HIV-1 diagnosis. Clin Exp Immunol. 1992;88:243. doi: 10.1111/j.1365-2249.1992.tb03068.x. [DOI] [PMC free article] [PubMed] [Google Scholar]
- 50.Perelson AS, Kirschner DE, de Boer R. Dynamics of HIV infection of CD4+ T cells. Math Biosci. 1993;114:81. doi: 10.1016/0025-5564(93)90043-a. [DOI] [PubMed] [Google Scholar]
- 51.Haase AT, Henry K, Zupancic M, et al. Quantitative image analysis of HIV-1 infection in lymphoid tissue. Science. 1996;274:985. doi: 10.1126/science.274.5289.985. [DOI] [PubMed] [Google Scholar]
- 52.Hockett RD, Kilby JM, Derdeyn CA, et al. Constant mean viral copy number per infected cell in tissues regardless of high, low, or undetectable plasma HIV RNA. J Exp Med. 1999;189:1545. doi: 10.1084/jem.189.10.1545. [DOI] [PMC free article] [PubMed] [Google Scholar]
- 53.Chen HY, Di Mascio M, Perelson AS, et al. Determination of virus burst size in vivo using a single-cycle SIV in rhesus macaques. Proc Natl Acad Sci USA. 2007;104:19079. doi: 10.1073/pnas.0707449104. [DOI] [PMC free article] [PubMed] [Google Scholar]
- 54.Markowitz M, Louie M, Hurley A, et al. A novel antiviral intervention results in more accurate assessment of human immunodeficiency virus type 1 replication dynamics and T-cell decay in vivo. J Virol. 2003;77:5037. doi: 10.1128/JVI.77.8.5037-5038.2003. [DOI] [PMC free article] [PubMed] [Google Scholar]
- 55.Ramratnam B, Bonhoeffer S, Binley J, et al. Rapid production and clearance of HIV-1 and hepatitis C virus assessed by large volume plasma apheresis. Lancet. 1999;354:1782. doi: 10.1016/S0140-6736(99)02035-8. [DOI] [PubMed] [Google Scholar]
- 56.Holte SE, Melvin AJ, Mullins JI, et al. Density-dependent decay in HIV-1 dynamics. J Acquir Immune Defic Syndr. 2006;41:266. doi: 10.1097/01.qai.0000199233.69457.e4. [DOI] [PubMed] [Google Scholar]
- 57.Greub G, Cozzi-Lepri A, Ledergerber B, et al. Intermittent and sustained low-level HIV viral rebound in patients receiving potent antiretroviral therapy. AIDS. 2002;16:1967. doi: 10.1097/00002030-200209270-00017. [DOI] [PubMed] [Google Scholar]
- 58.Staszewski S, Morales-Ramirez J, Tashima KT, et al. Efavirenz plus zidovudine and lamivudine, efavirenz plus indinavir, and indinavir plus zidovudine and lamivudine in the treatment of HIV-1 infection in adults. N Engl J Med. 1999;341:1865. doi: 10.1056/NEJM199912163412501. [DOI] [PubMed] [Google Scholar]
- 59.Chun TW, Finzi D, Margolick J, et al. In vivo fate of HIV-1-infected T cells: quantitative analysis of the transition to stable latency. Nat Med. 1995;1:1284. doi: 10.1038/nm1295-1284. [DOI] [PubMed] [Google Scholar]
- 60.Blankson JN, Persaud D, Siliciano RF. The challenge of viral reservoirs in HIV-1 infection. Annu Rev Med. 2002;53:557. doi: 10.1146/annurev.med.53.082901.104024. [DOI] [PubMed] [Google Scholar]
- 61.Chun TW, Fauci AS. Latent reservoirs of HIV: Obstacles to the eradication of virus. Proc Natl Acad Sci USA. 1999;96:10958. doi: 10.1073/pnas.96.20.10958. [DOI] [PMC free article] [PubMed] [Google Scholar]
- 62.Ho DD. Toward HIV eradication or remission: the tasks ahead. Science. 1998;280:1866. doi: 10.1126/science.280.5371.1866. [DOI] [PubMed] [Google Scholar]
- 63.Pierson T, McArthur J, Siliciano RF. Reservoirs for HIV-1: mechanisms for viral persistence in the presence of antiviral immune responses and antiretroviral therapy. Annu Rev Immunol. 2000;18:665. doi: 10.1146/annurev.immunol.18.1.665. [DOI] [PubMed] [Google Scholar]
- 64.Ramratnam B, Ribeiro R, He T, et al. Intensification of antiretroviral therapy accelerates the decay of the HIV-1 latent reservoir and decreases, but does not eliminate, ongoing virus replication. J Acquir Immune Defic Syndr. 2004;35:33. doi: 10.1097/00126334-200401010-00004. [DOI] [PubMed] [Google Scholar]
- 65.Havlir DV, Strain MC, Clerici M, et al. Productive infection maintains a dynamic steady state of residual viremia in human immunodeficiency virus type 1-infected persons treated with suppressive antiretroviral therapy for five years. J Virol. 2003;77:11212. doi: 10.1128/JVI.77.20.11212-11219.2003. [DOI] [PMC free article] [PubMed] [Google Scholar]
- 66.Monie D, Simmons RP, Nettles RE, et al. A novel assay allows genotyping of the latent reservoir for human immunodeficiency virus type 1 in the resting CD4+ T cells of viremic patients. J Virol. 2005;79:5185. doi: 10.1128/JVI.79.8.5185-5202.2005. [DOI] [PMC free article] [PubMed] [Google Scholar]
- 67.Ruff CT, Ray SC, Kwon P, et al. Persistence of wild-type virus and lack of temporal structure in the latent reservoir for human immunodeficiency virus type 1 in pediatric patients with extensive antiretroviral exposure. J Virol. 2002;76:9481. doi: 10.1128/JVI.76.18.9481-9492.2002. [DOI] [PMC free article] [PubMed] [Google Scholar]
- 68.McLean AR, Michie CA. In vivo estimates of division and death rates of human T lymphocytes. Proc Natl Acad Sci USA. 1995;92:3707. doi: 10.1073/pnas.92.9.3707. [DOI] [PMC free article] [PubMed] [Google Scholar]
- 69.Michie CA, Mclean AR, Alcock C, et al. Lifespan of human lymphocyte subsets defined by CD45 isoforms. Nature. 1992;360:264. doi: 10.1038/360264a0. [DOI] [PubMed] [Google Scholar]
- 70.Seddon B, Tomlinson P, Zamoyska R. Interleukin 7 and T cell receptor signals regulate home-ostasis of CD4 memory cells. Nat Immunol. 2003;4:680. doi: 10.1038/ni946. [DOI] [PubMed] [Google Scholar]
- 71.Sprent J, Surh CD. T cell momory. Annu Rev Immunol. 2002;20:551. doi: 10.1146/annurev.immunol.20.100101.151926. [DOI] [PubMed] [Google Scholar]
- 72.Tough DF, Sprent J. Turnover of naive-and memory-phenotype T cells. J Exp Med. 1994;179:1127. doi: 10.1084/jem.179.4.1127. [DOI] [PMC free article] [PubMed] [Google Scholar]
- 73.Chomont N, El Far M, Ancuta P, et al. HIV-1 reservoir size and persistence are driven by cell survival and proliferation; HIV Pathogenesis (X8), Part of the Keystone Symposia Global Health Series; Banff, Alberta, Canada. March 27-April 1, 2008. [Google Scholar]
- 74.Kim H, Perelson AS. Dynamic characteristics of HIV-1 reservoirs. Curr Opinion HIV and AIDS. 2006;1:152. doi: 10.1097/01.COH.0000203836.08974.96. [DOI] [PubMed] [Google Scholar]
- 75.Tyson JJ. Effects of asymmetric division on a stochastic model of the cell division cycle. Math Biosci. 1989;96:165. doi: 10.1016/0025-5564(89)90057-6. [DOI] [PubMed] [Google Scholar]
- 76.Ro S, Rannala B. Methylation patterns and mathematical models reveal dynamics of stem cell turnover in the human colon. Proc Natl Acad Sci USA. 2001;98:10519. doi: 10.1073/pnas.201405498. [DOI] [PMC free article] [PubMed] [Google Scholar]
- 77.Yatabe Y, Tavare S, Shibata D. Investigating stem cells in human colon by using methylation patterns. Proc Natl Acad Sci USA. 2001;98:10839. doi: 10.1073/pnas.191225998. [DOI] [PMC free article] [PubMed] [Google Scholar]
- 78.Dingli D, Traulsen A, Michor F. (A)symmetric stem cell replication and cancer. PLoS Comput Biol. 2007;3:e53. doi: 10.1371/journal.pcbi.0030053. [DOI] [PMC free article] [PubMed] [Google Scholar]
- 79.Wodarz D. Effect of stem cell turnover rates on protection against cancer and aging. J Theor Biol. 2007;245:449. doi: 10.1016/j.jtbi.2006.10.013. [DOI] [PubMed] [Google Scholar]
- 80.Fearon DT, Manders P, Wagner SD. Arrested differentiation, the self-renewing memory lymphocyte, and vaccination. Science. 2001;293:248. doi: 10.1126/science.1062589. [DOI] [PubMed] [Google Scholar]
- 81.Luckey CJ, Bhattacharya D, Goldrath AW, et al. Memory T and memory B cells share a transcriptional program of self-renewal with long-term hematopoietic stem cells. Proc Natl Acad Sci USA. 2006;103:3304. doi: 10.1073/pnas.0511137103. [DOI] [PMC free article] [PubMed] [Google Scholar]