

Abstract
Fast excitation-driven fluctuations in the fluorescence emission of yellow-shifted green fluorescent protein mutants T203Y and T203F, with S65G/S72A, are discovered in the 10−6–10−3-s time range, by using fluorescence correlation spectroscopy at 10−8 M. This intensity-dependent flickering is conspicuous at high pH, with rate constants independent of pH and viscosity with a minor temperature effect. The mean flicker rate increases linearly with excitation intensity for at least three decades, but the mean dark fraction of the molecules undergoing these dynamics is independent of illumination intensity over ≈6 × 10² to 5 × 10⁶ W/cm2. These results suggest that optical excitation establishes an equilibration between two molecular states of different spectroscopic properties that are coupled only via the excited state as a gateway. This reversible excitation-driven transition has a quantum efficiency of ≈10−3. Dynamics of external protonation, reversibly quenching the fluorescence, are also observed at low pH in the 10- to 100-μs time range. The independence of these two bright–dark flicker processes implies the existence of at least two separate dark states of these green fluorescent protein mutants. Time-resolved fluorescence measurements reveal a single exponential decay of the excited state population with 3.8-ns lifetime, after 500-nm excitation, that is pH independent. Our fluorescence correlation spectroscopy results are discussed in terms of recent theoretical studies that invoke isomerization of the chromophore as a nonradiative channel of the excited state relaxation.
Green fluorescent protein (GFP) and its mutants (for a recent review, see ref. 1) have become most useful tools for fluorescence spectroscopic investigation of molecular processes in living cells and tissues, because they can be cloned in a variety of common cell lines. Particularly valuable is the capability to express gene constructs that tag specific proteins targeted to various cellular compartments. Thus, GFP cloning allows the introduction of bright fluorescent labels with high quantum yield, photostability, and minimal interference with the cellular machinery.
Since the discovery of the remarkable potential of GFP as a fluorescent probe, there have been numerous efforts to enhance its properties by developing mutants with enhanced photostability and extended emission wavelength range (2, 3). However, the photophysics and photochemistry of GFP mutants are found to be surprisingly complex in ways that can be both helpful and problematic in biological applications. For example, enhanced GFP (EGFP) can be used for intrinsic pH-calibration measurements (4). We report here an unexpected photophysics, i.e., a class of fast-fluorescence intermittency of yellow-shifted GFP mutants at normal to high pH, which is driven only by the illumination. Our findings might limit the use of these and possibly other GFP mutants as pH indicators without proper intensity calibration.
Research on the photophysical behavior of GFP has been facilitated by analyses of the three-dimensional structures (5, 6), and a useful summary has recently been provided (1). The chromophore is formed autocatalytically by posttranslational cyclization and oxidation of residues 65–67 (2, 7, 8) and does not fluoresce without the robust β-barrel shield provided by the rest of the protein (8, 9). Wild-type GFP exhibits two major absorption bands at 395 and 475 nm, which are associated with protonated and deprotonated states, respectively. Wild-type GFP does not fully equilibrate and can be slowly converted by UV illumination to its deprotonated state (10, 2). Excited state proton-transfer reaction after the short wavelength excitation has been observed in time-resolved measurements with ≈100-fs resolution (11, 12). In red-shifted mutants, the deprotonated state of the chromophore, absorbing at longer wavelength, is stabilized by a tight hydrogen-bonding network, which modifies its photophysical behavior (10, 6).
Various light-induced isomerization or internal conversion processes in GFP chromophores have been proposed (2, 8, 10) but to date have not been clearly identified. Some of the yellow-shifted GFP mutants that exhibit a dramatically decreased fluorescence quantum yield with fluorescence losses >90% and extremely short excited state lifetimes have been interpreted in terms of internal conversion induced by torsional motion within the chromophore (13). Theoretical considerations of energy barriers for such rotations in different ionization states have been made (14, 15) but so far lack clear experimental proof. It is likely that structural rearrangements of the chromophore also accompany the protonation and deprotonation processes (5, 10, 11).
The yellow-shifted GFP mutants S65G/S72A/T203Y (denoted T203Y) and S65G/S72A/T203F (denoted T203F), studied in this research, achieve stabilization of the yellow-emitting form (527 and 524 nm, respectively) as a result of the S65G mutation, thus they retain the possibility of H+ binding at the phenolate ion Y66. The chromophore is stabilized further by a stacked π-π-electron system formed by the aromatic mutation at residue 203 in the chromophore (6). These mutants can be externally protonated at low pH, like EGFP (F64L/S65T), to a neutral state that is nonfluorescent at long wavelength. For EGFP and S65T, the statistical thermodynamics of protonation and deprotonation has been characterized by using fluorescence correlation spectroscopy (FCS) (16), where submillisecond flicker caused by proton displacement between the protonated (dark) and unprotonated (bright) states of the chromophore was monitored (4). A small contribution (≈13%) of pH-independent flicker was noticed, at high pH, to depend slightly on light intensity. Another intensity-dependent fluorescence blinking between bright and dark states on a time scale of many seconds and with a quantum efficiency of ≈10−6 has been documented (17) on individual T203Y and T203F mutants, trapped in aerated aqueous polymer gels at neutral pH. In those experiments, the illumination intensity ranged from 0.5–2.0 kW/cm2, and a time resolution of 100 ms was utilized.
These observations motivated the present FCS studies of T203Y and T203F on a faster time scale. Our measurements at high pH reveal a pH-independent excitation-driven fast flickering (kHz–MHz). The yield of the flicker process, as measured by the dark-state fraction, is ≈ 60%, which is much larger than that in EGFP (4). We argue that reversible transitions between two spectroscopically different states of the chromophore can account for these observations. At low pH, our measurements indicate the existence of another nonfluorescent (protonated) state similar to that in EGFP.
Materials and Methods
FCS utilizes temporal fluctuations in the fluorescence emission of small ensembles of molecules in an open excitation volume (≈10−15 liter) that is defined by confocal geometry (16, 18, 19) or multiphoton excitation (20, 21). Fluctuations arise from the changes in the number of molecules, as they randomly diffuse in and out the volume element, as well as by changes in fluorescence yield as molecules undergo inter- or intramolecular dynamics. Analysis of fluorescence fluctuation autocorrelation yields valuable information on molecular dynamics in the microsecond to second time range. The slowest dynamics to be resolved temporally, in a system of mobile molecules, is diffusion through the excitation volume. A simplified three-dimensional form of the autocorrelation function for freely diffusing molecules undergoing faster reversible transitions to a dark state (i.e., flicker) is given by:
 |
1 |
where 〈N〉 denotes the average fluorophore number density, τd, the characteristic diffusion time through an ellipsoidal excitation volume with lateral (r0) and axial (z0) radii. The first bracketed term describes a fast dynamics that might occur on a τe time scale. The exponential decay term arises from transitions between two states of different spectroscopic properties, e.g., singlet/triplet (22), protonated/unprotonated (4), or in general between bright (B) and dark (D), i.e., fluorescent/nonfluorescent states. The fraction of molecules residing in the dark state at any time is represented by F. Assuming that n independent processes induce on–off dynamics on different time scales, the fitting function will be modified as follows:
 |
2 |
FCS measurements were carried out in a modified Zeiss IM-35 inverted microscope setup described elsewhere (21) by using a Nikon objective (1.2 numerical aperture/×60 water immersion) and confocal fluorescence collection optics with 100-μm aperture size. The data-collection time varied between 30 and 120 s, depending on excitation intensity (Iex). Fast detection by cross correlation of two avalanche photodiodes (SPCM AQ-141, EG & G, Vaudreuil, Canada) provided >12.5-ns time resolution. For fluorescence excitation, we used 488- and 514-nm lines of a 10-mW Ar+ ion laser (Ion Laser Technology, Salt Lake City). The lateral (r0) and axial (z0) radii of the effective volume element are ≈0.5 and ≈2 μm, respectively, as determined by a control experiment using rhodamine green. GFP samples were contained in a 200-μl deep-well glass slide sealed by a coverslip. Temperature was adjusted by using a stage thermostat and measured at the sample with a calibrated thermocouple.
Details of the time-correlated single-photon-counting (TCSPC) system, used for the excited state time-resolved fluorescence measurements, will be published elsewhere. Briefly, a mode-locked Ti:Sapphire laser system (Spectra-Physics) is used to generate 70- to 120-fs pulses over 810–1,000 nm. An electrooptic modulator selects pulses at a repetition rate of 4 or 10 MHz, then a doubling crystal generates the second harmonic, which is focused into the sample (1–5 μM). Filtered right-angle fluorescence is detected by a microchannel plate, amplified, and then timed by TCSPC electronics (SPC430, Becker & Hickl, Berlin) with ≈20-ps resolution after deconvolution with the system-response function. The time-resolved fluorescence decays are fit by using a nonlinear least-squares routine.
A. Miyawaki and R. Tsien (Howard Hughes Medical Institute, San Diego) kindly provided T203Y and T203F mutants. Buffer chemicals (highest purity) and water (HPLC grade) were obtained from Sigma. For pH-dependence measurements, GFP was diluted to 10–20 nM in CP buffer (10 mM citric acid, 100 mM potassium phosphate) of various pH.
Results
The on–off fluorescence flickering of GFP mutants in the micro- to millisecond time range, as first described by Haupts et al. (4), is influenced by several environmental factors. The pH effect, attributed to reversible external protonation of the chromophore, was discussed for EGFP (4). In addition, a fraction (≈13%) of EGFP molecules showed a pH-insensitive flicker that seemed dependent on illumination intensity. Here we present thorough intensity- and pH-dependent FCS studies of flicker dynamics in yellow-shifted mutants T203Y and T203F. These measurements allow an effective separation of these two effects, pH vs. intensity. The dependence of the light-induced flickering on excitation wavelength, temperature, and buffer viscosity is also examined. Time-resolved measurements explore the excited state dynamics of the fluorescent molecular species.
Fig. 1 shows the excitation intensity dependence of the correlation curves (normalized) for T203Y recorded at pH 8 at 514-nm excitation over intensity range 5 to 50 kW/cm2 in logarithmic steps of 0.1. The figure clearly demonstrates the effect of increasing intensity on the fast-flicker dynamics of freely diffusing molecules. At pH 8, the amplitude of the flicker because of external protonation is negligible. The concave tails of these curves, with a decay time of ≈1 ms, represent the diffusion process, which remains nearly constant, independent of intensity in this range. The decay time τe of the fast (<0.1-ms) dynamics, representing the transition between bright and dark/dim states, changes systematically with intensity. An order of magnitude increase in the intensity introduces a substantial decrease in τe. Furthermore, the mean dark fraction F remains constant at a value F = 0.58 ± 0.02 up to 5 × 10⁶ kW/cm2 (data not shown). Similar results were observed for T203F (data not shown) with a smaller fraction F = 0.4 ± 0.02 under the same experimental conditions. Satisfactory fits of these curves were obtained by using Eq. 1.
Figure 1.
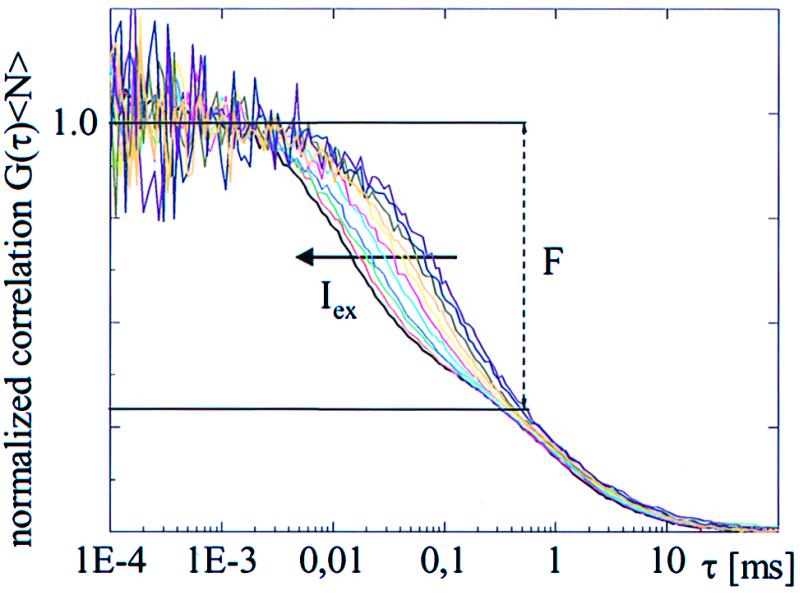
Excitation intensity (Iex) dependence of normalized fluorescence correlation curves for T203Y at pH 8 with 514-nm excitation. (Right–Left) Iex increases from 5 to 50 kW/cm2 by 0.1 OD steps. The average dark fraction F (≈ 60%), determined by the fitted amplitude of the fast-flicker process, remains constant, although the time constants decreased by an order of magnitude as the intensity increased.
To examine the effect of moderate shifts in excitation photon energy on the observed intensity-dependent kinetics, similar measurements were carried out with 488-nm excitation. The fractions F again remain constant over the whole intensity range within experimental errors, with 35 ± 3% for T203Y and 22 ± 2% for T203F. The transition rates (i.e., τe−1) between bright and dark states increase linearly as for 514-nm excitation. The excitation-intensity (Iex) dependence of F and τe−1 in both T203Y and T203F at 488 nm and 514 nm is plotted in Fig. 2. The linear dependence of the flicker rate on Iex in the low range raises the question whether there is a lower limit as the excitation rate vanishes. The experimental limit for maximum time scales that can be analyzed by FCS is given by the dwell time of a molecule in the focal volume, which is limited by diffusion (≈1 ms here). This constraint contrasts with the very long time photobleaching limit in studies on fixed single molecules (17, 23). Extrapolations of τe−1 toward Iex = 0 intersect the origin, i.e., τe−1 (0) ≈ 0 with an uncertainty of ca. ±100 Hz in linear fits to τe−1 (Iex) = τe−1 (0) + ΔIex. The molecular extinction coefficient at 514 nm is approximately twice the value at 488 nm. As shown in Fig. 2, the slope Δ = dτe−1/dIex at 514 nm (2.9 ± 0.05 cm2⋅kW−1⋅ms−1) is two times larger than that at 488 nm (1.45 ± 0.03 cm2⋅kW−1⋅ms−1). A similar trend was also observed for T203F mutant.
Figure 2.

Iex dependence of flicker-fraction F and rate τe−1 at low excitation levels for T203Y (●,■), and T203F (○, □) using 514 (circles) and 488 (squares) nm at pH 8. The rates depend linearly on Iex and show no significant residual amplitude as Iex→0. The F values are constant within experimental errors of ca. 5%. The plotted slopes Δ (cm2⋅kW−1⋅ms−1) are obtained by linear least-squares fitting.
The relationship between flicker rate and detected fluorescence emission rates over several orders of magnitude of intensity is shown in Fig. 3. To compare excitation at 488 nm with that at 514 nm, the intensity axis for 488 nm is scaled by the ratio of extinction coefficients. The linear increase of flicker rate with light intensity is preserved over a wide range without reaching a steady value (although the growth is slightly sublinear at high intensities). At intensities above 50 kW/cm2, an additional fast dynamics (22), caused by intersystem crossing between the first excited-singlet and triplet state, was observed with intensity-dependent fractions (here <8%) and a time constant of ≈1 μs (data not shown). Fitting with the functional form in Eq. 2, these kinetics can be separated. For low intensities, the fluorescence signal (photons/molecule/second) increases linearly and reaches a plateau above 100 kW/cm2, followed by a minor decline. To estimate the flicker efficiency, its rate should be compared with the excitation rate and not with the detected fluorescence, which is about 103 times smaller because of low detection efficiency. With an absorption cross section σ514 ≈ 2.5 × 10⁻¹⁶ cm2 (1), we obtain a quantum efficiency of 1.6 × 10⁻³ for flickering induced by excitation at 514 nm.
Figure 3.

Iex dependence of the flicker rate (■, □) and detected fluorescence emission rates (●,○) (photons/second/molecule) in T203Y at 514-nm (filled) in comparison with 488-nm (open) excitation. The 488-nm intensity was scaled by a factor of 1/2 to account for the difference in molecular extinction coefficient at 514 nm. In contrast to the fluorescence emission rates, saturation is not observed for the blinking rates, although the slope decreases slightly at very high Iex.
The pH dependence of fluorescence autocorrelations (at 488 nm) was observed for both mutants at low-excitation intensity, Iex = 4 kW/cm2. Although the autocorrelation curves (not shown) exhibit a behavior qualitatively similar to the findings in EGFP (4), it is clear that the data at pH <8 cannot be described adequately by Eq. 1 and that additional exponential decay is required. This implies the existence of two different dark states, each of which is involved in a specific fast on–off flicker transition. Although the observed time scales are not strictly separable (both processes take place within 10 μs to 1 ms), Eq. 2 with n = 2 provides a reasonable approximation for the low-to-moderate pH measurements. In fitting the curves at pH <8 by Eq. 2 with two exponentials, pH-dependent protonation dynamics (with τ1−1 and F1) and light-driven dynamics (τ2−1 and F2) can be independently characterized. This hypothesis is supported by the pH independence of F2 and τ2 with values F2 = 0.35 ± 0.05 (T203Y), 0.22 ± 0.03 (T203F), and τ2 = 200 ± 50 μs (T203Y), 400 ± 75 μs (T203F) throughout the pH range 4.5 to 11. The results for F1 and τ1−1 are shown in Fig. 4. At pH < 4, irreversible denaturation of the protein quenches the fluorescence, preventing reliable FCS analysis. Above pH 7, neither the average count rate nor the shape and amplitude of the correlation curves changes significantly for either mutant (at constant intensity), and F1 → 0. For 4 < pH < 7, F1 as well as τ1 shows the expected titration behavior of reversible external protonation. We assume that τ1−1 = kpr[H+] + kdepr and F1 = KD/(KD + 1) with KD = kpr/kdepr, where kpr is the protonation and kdepr the deprotonation rate constants. We estimate kpr = (1.4 ± 0.1) × 109 M−1 s−1, kdepr = (7 ± 2) × 103 M−1 for T203 Y and kpr = (2.1 ± 0.2) × 109 M−1 s−1, kdepr = (1.3 ± 0.4) × 104 M−1 for T203F. This yields pKa values of 5.3 ± 0.2 for T203Y and 5.2 ± 0.2 for T203F in agreement with previous results in the absence of halide ions (24).
Figure 4.

pH dependence of the protonation kinetics of T203Y (□) and T203F (●) at low Iex. Fitting the flicker rate (Left, dashed line) allows determination of protonation and deprotonation rate constants as described in the text. The fraction of dark state (Right) is a measure of protonation equilibrium constants.
The independence of the dynamics of these two exponential processes can be illustrated further simply by plotting the ratios of the low-pH correlation functions to those at high pH at the same intensities. The results for T203Y (with similar findings for T203F; data not shown) are given in Fig. 5 Left. Measurements were carried out for pH 5 and pH 8 by using (Iex), which varied by over an order of magnitude. In the fast time range τ ≤ 0.05 ms, where both intensity-dependent and pH-dependent dynamics is expected, this analytical procedure isolates the protonation effect for pH 5: at each intensity, the ratio of low- and high-pH curves for τ < 0.05 ms remains the same. However, there are different correlation ratios at τ > 1 ms that indicate excitation-induced changes in the diffusion process probably because of photobleaching of the deprotonated state at 514 nm (the protonated state is not excitable at this wavelength) at low pH. Fig. 5 Right demonstrates the possibility of separating these two effects by displaying the pH dependence of time constants τ1 and τ2 at two different intensities, where Ia is three times higher than Ib. Only τ1 is affected by pH (triangles) and, furthermore, the pH-dependent dynamics did not change with intensity (open vs. closed symbols).
Figure 5.

(Left) Correlation function ratios distinguish fluctuations because of protonation from excitation-driven flicker. The plot shows correlation curves of T203Y at pH 5 divided by those at pH 8, both recorded at the same intensity, for 10 different Iex in OD 0.1 steps. The ratiometric shoulder at short correlation times represents protonation kinetics at pH 5. The differences at long correlation times are caused by photobleaching of the unprotonated state only (see text). (Right) pH dependence of τ1 (protonation; ▴,▵) and τ2 (excitation-induced flicker; ●,○) for two different intensities Ia =100 kW/cm2 (filled) and Ib =33 kW/cm2 (open). Each time constant appears dependent on only one parameter, either Iex for τ2 or pH for τ1.
Steady-state fluorescence spectroscopy measurements of T203Y and T203F agree with the results of Dickson et al. (ref. 17; data not shown). The deprotonated ground electronic states of both T203Y and T203F at pH 8 absorb at 514 and 512 nm, respectively, and the spectra exhibit near-mirror images with emission from the first deprotonated excited state. The emission peaks at 527 nm (≈524 nm for T203F), with a minor shoulder at ≈575 nm in both mutants. Time-resolved fluorescence measurements on T203Y (pH 8) by using time-correlated single photon counting show that the deprotonated excited state fluorescence decays as a single exponential with a lifetime of 3.68 ns (χ2 = 1.1; data not shown). Similar behavior is observed for the T203F mutant with a 3.77-ns fluorescence lifetime. The fluorescence lifetimes after 500-nm excitation are independent of Iex over at least an order of magnitude and of the pH of the buffer. In contrast, multiexponential fluorescence decays were measured for the protonated excited state after 405-nm excitation in both mutants, where the fitting parameters are detection wavelength (λd) and pH dependent. A full account of these studies will be presented elsewhere (A. A. Heikal, S. Hess, and W.W.W., unpublished work).
To investigate the thermodynamics of the light-driven process, the temperature dependence (10–57°C) of the correlation functions was measured at pH 8, without denaturating the protein (25). In contrast with protonation dynamics (4), increasing temperature barely affected the rate of bright-dark state transitions at high pH. A small increase of the rate, i.e., a decrease of τ2 by ≈10%, is accompanied by an insignificant (<3%) decrease of the dark fraction. In contrast, the diffusion time τd decreased by a factor of 1.7, as expected from the change of viscosity. The slight temperature effect on τ2 can, however, not be attributed to changes in viscosity. Neither the addition of glycerol (50%), which increased the viscosity and consequently τd by a factor of 3, nor oxygen depletion in the buffer affects the excitation-induced flicker.
Discussion
FCS measurements on GFP mutants T203Y and T203F at pH 8 reveal a strong excitation-driven fast flicker in the submillisecond time range. The pronounced shoulder in the correlation curves is caused by reversible transitions between bright and dark states of the chromophore. These states possess distinguishable emission and absorption properties. The transition rate τ2−1 is linearly dependent on Iex over 6 × 10² to 5 × 10⁶ W/cm2 range, with a slight sublinearity at high intensities (Fig. 3), and extrapolates to zero, within 102 s−1, with Iex (Fig. 2). The equilibrium partition between these two states, F2, remains constant over this intensity range. This indicates that essentially all of these transitions are excitation induced, i.e., the excited state(s) acts as a gateway. This excitation-driven dynamics is not dependent on external pH, as shown by the analytical separation of pH and intensity effects on the FCS curves. Furthermore, the excitation-driven flicker is viscosity independent with minor temperature effects. These flickers are distinguished from singlet–triplet intersystem crossing (ISC) by using the FCS technique (22). In ISC, the fraction (FT) of molecules that reside in the triplet state increases with intensity, to reach a maximum of ≈0.08 under our experimental conditions, and the rate is much larger.
Possible models that account for these observations are depicted in Fig. 6. We attribute the flicker process in the fast time regime at high pH to an excitation-activated transition between at least two spectroscopically distinguishable states of the chromophore. One (B) is fluorescent, and the other one (D) is dark (or not significantly fluorescent). On excitation of the bright ground state B0 → B1 with a rate kxB, there is a high probability of fluorescence emission via B1→ B0 transition with nearly the same rate, because the quantum efficiency is high. However, there is also a small probability (≈10−3) for a transition to the dark state D0, from which a return to B0 is possible only by excitation, i.e., D0 → D1 transition, after the absorption of another photon.
Figure 6.

Proposed models for the observed excitation-driven dynamics: Iex dependence of the flicker rate at high pH suggests that transitions between bright (B) and dark (D) states occur with low probability via the excited B1 and D1 states by routes that are not yet distinguishable. However, the different time scales of excited state lifetimes kf−1 (ns) and flicker times (microseconds) simplify the kinetic model to a direct interconversion between the two states B ⇌ D. The overall transition rates kB and kD are thus linearly dependent on Iex. At low pH, additional independent reversible proton-binding transitions occur from the B–D system to an externally protonated dark state DH0.
Whether relaxation from the two excited states (B1 and D1) always occurs into the corresponding ground states (B0 and D0) via D1→ D0 and B1→ B0, or whether a branching allows for pathways D1→ B0 or B1→ D0, cannot be decided by our data. However, our unprotonated excited state single exponential fluorescence decay indicates that the D1→ D0 transition is nonradiative. The vanishing transition rates, as excitation intensity approaches zero, suggest that the dynamics under study is excitation driven with a high transition barrier between the ground states.
At low pH, an additional independent reversible transition between another protonated dark DH state and the unprotonated B state occurs via external protonation (4). The external protonation DH0→B0 channel, shown in Fig. 6, is negligible at high pH > pKa ≈ 5.3, because deprotonation is virtually complete, and F1→0. On the basis of the energetics of the chromophore, the protonated state absorbs at a shorter wavelength (λ), and the DH0→DH1 transition can be ruled out at λs used in this work.
Because the transitions occur on time scale orders of magnitude larger than the excited state lifetimes (≈3.8 ns), the dynamics at pH 8 can be expressed analytically in a simple two-state system B ⇌ D with forward (kD) and reverse (kB) transition rates. These rates can be determined from FCS as follows: τe the characteristic time constant is given by the reciprocal relation τe = (kB + kD)−1. The fraction of molecules in the dark state at any time is given by F = kD/(kD + kB) = (1 + K)−1 with equilibrium constant K = kB/kD. The heuristic assumption that kD and kB are both directly proportional to the intensity, approaching zero at Iex = 0, explains the overall linear dependence and satisfies the condition of intensity-independent equilibrium. The absorption cross sections and/or transition quantum yields must vary with wavelengths to explain the wavelength dependence of the fractions F. At a given wavelength (λ), the transition rates kB(λ) and kD(λ) are defined as follows: kD(λ) = σB(λ) qBD Iex and kB(λ) = σD(λ) qDB Iex, the σi(λ) are the absorption cross sections, and qij the quantum efficiencies for light-driven transitions between B and D. The constant dark fractions F enable us to determine fixed relationships between kD and kB at different wavelengths. We obtain kD/kB values of 1.5 (T203Y at 514 nm), 0.54 (T203Y at 488 nm), 0.67 (T203F at 514 nm), and 0.33 (T203F at 488 nm). Assuming that the absorption cross section (σ514) for state B is ≈2.5 × 10⁻¹⁶ cm2, the flicker quantum yield is calculated to be on the order of 10−3 (see Results). However, only the products σB(λ) qBD and σB(λ) qBD (that are related via F and Δ = σBqBD + σDqDB, as determined in Fig. 2) are known from FCS. Either one of σB(λ) and qBD could therefore be comparable to the respective values for the B state. This relationship could be determined only from F by FCS if absorption and fluorescence from B and D were independently observed. Also, F underestimates kD/(kD+kB) if D is not dark but rather fluorescent with much lower quantum efficiency. Because the time-resolved measurements reveal a single exponential decay of the first excited state fluorescence, the D state does not contribute observably to the measured fluorescence signal, thus F is a good estimate of kD/(kD + kB).
The absence of viscosity and oxygen dependence of the excitation-dependent flicker suggests that the integrity of the tight shielding of the chromophore, because of the β-barrel, is not compromised in the B ⇌ D transitions. In contrast, Haupts et al. (4) observed a linear decline of the external proton-transfer rate at low pH with increasing viscosity, because a two-body reaction is involved. Although viscosity-dependent measurements of the yellow fluorescent proteins (YFPs), at low pH, were not conducted, one would expect similar environmental effects as in the EGFP case.
The chemical character and photophysical pathways of both the bright and dark states of the chromophore, involved in the excitation-driven flicker, remain speculative. Recent semiempirical (14) and quantum chemical calculations (15) on GFP suggest cis-trans photoisomerization pathways of neutral, anionic, and zwitterionic chromophores in their ground and first-singlet excited states. More importantly, a significant decrease of the energy barrier for such isomerization on the excited state potential energy surface (PES) is predicted (14, 15), compared with that on the ground-state PES. This offers an attractive hypothesis that the bright and dark states observed here might be different conformations of the chromophore. As a reminder, the fluctuation of the ground-state population of a given fluorophore is the main one observable in FCS studies (because the excited state lifetime is too short, 3.8 ns in this case). For excited state photoisomerization to influence FCS temporal fluctuations, it must induce a dark ground state of the new isomer that persists for ≈10–100 μs. This also requires that the barrier height for reverse isomerization reaction on the ground-state PES of the new isomer must be high. Under the above-mentioned hypothesis, the excitation-driven fluorescence flicker observed here at high pH might be attributed to the proposed photoisomerization reaction (14). It is also likely that the protein framework provides sufficient hindrance to molecular motion so that the time scale for isomerization in the ground state is very long, beyond the range accessible by FCS. In fact, molecular dynamics simulations show that the GFP structure is quite rigid (26).
In the context of internal conversion, Voityuk et al. (14) and Weber et al. (15) highlight the so-called “zwitterionic” form of the chromophore (10, 27) that may be formed from the anionic form through proton transfer from a nearby Glu-222. This residue was shown to be hydrogen bonded with the sp-orbital of the nitrogen atom in the five-membered ring in the chromophore (6). The zwitterionic state is presumed to undergo radiationless decay through nonadiabatic crossing, through a rotational motion around two ring-bridging bonds in the chromophore, and will appear dark in fluorescence. Furthermore, that state might absorb at a comparable wavelength to the anionic state. Weber et al. suggested the slow blinking observed by Dickson et al. (17) might be conversions between the anionic and the dark zwitterionic form. A reversible anionic-zwitterionic transformation also remains a viable candidate for the fast bright–dark fluorescence flicker reported here at high pH. However, the zwitterionic ground state must survive long enough (microseconds to milliseconds) to be visible as a flicker in FCS experiments. Our findings also imply that the barrier for internal proton transfer is drastically decreased in the excited state. These two requirements seem in good agreement with recent quantum chemical calculations (15). The dynamics of a reversible anionic–zwitterionic transformation appears reasonably consistent with the optically driven fluorescence flicker that we observe at high pH.
Studies using wide-field fluorescence microscopy and fluorometry are usually carried out over illumination intensity ranges that are much lower than those utilized in our FCS experiments. Therefore, the implications of extrapolating the flicker rate (τ2−1) and fraction (F2) as Iex→0 must be considered to integrate our findings with previous studies on YFP at much lower intensities and longer time scales. In single-molecule studies (17) utilizing ≈100-ms temporal resolution, the fluorescence of these YFPs blinks at rates ≈103 times slower than our flicker rate at comparable low Iex. This difference is far beyond our uncertainty (≈10−2 s−1) of τ2−1(0). This might suggest an additional blinking process. In recent single-molecule studies of EGFP (23) at high pH near 1 kW/cm2, blinking characterized by on-times in the 100-ms range and off-time of many seconds was interpreted as reversible photobleaching; neither the time scale of this effect nor the dark fraction match the FCS dynamics depicted in Fig. 2. At low enough Iex, such a process could override the kinetics, which establish the equilibrium in FCS, leaving F2 indeterminate. One possibility is that a direct Do to B0 transition might occur at ≈10−1 s−1 rate.
Conclusions
Our experiments on the 1-μs to 10-ms time scale suggest that optical excitation of the anionic (unprotonated) state, at high pH, of the yellow-shifted GFP mutants T203Y, T203F, and probably of EGFP, activates a pathway to a nonfluorescent (i.e., dark) state with a quantum efficiency of ≈10−3. This dark state is photophysically distinct from the protonated dark state. The measured single-fluorescence decay time, at high pH, suggests the existence of only one bright fluorescent state. The fact that the average dark fraction associated with the optically activated fluorescence fluctuations is independent of excitation intensity implies a coexisting activation of the reverse transition from the dark state to the anionic bright state. Nevertheless, the absorption cross section of the dark state could be as small as 10−3 times that of the anionic state.
The structural mechanism underlying this behavior may be better understood by comparative studies in a designed set of YFP mutants with carefully controlled chemical variations. The slight intensity-dependent flicker observed in EGFP (4), at high pH, suggests that the effects observed in yellow T203 mutants may be ubiquitous. Because the dark fractions appear in steady-state fluorescence measurements as reduced quantum efficiency, they can reduce the potential of GFP mutants as fluorescent markers and complicate their intrinsic calibration as pH indicators made possible by FCS technique.
Acknowledgments
We thank Dr. V. Helms (Max-Planck-Institut, Frankfurt), Prof. M.-E. Michel-Beyerle (Technische Universität, Munich), and Dr. Sam Hess (Cornell University) for discussions. This research was carried out in the Developmental Resource for Biophysics Imaging and Optoelectronics at Cornell University with funding provided by the National Science Foundation (NSF) (BIR 8800278) and the National Institutes of Health (P412 RR04224). P.S. was supported by an Alexander-von-Humboldt Fellowship and Evotec BioSystems AG. S.K. was supported by the Deutscher Akademischer Austauschdienst and the NSF (DMR9612252). We are grateful to A. Miyawaki and R. Tsien of the University of California at San Diego for providing us with the YFP mutants.
Abbreviations
- GFP
green fluorescent protein
- FCS
fluorescence correlation spectroscopy
- YFP
yellow fluorescent protein
- EGFP
enhanced GFP
References
- 1.Tsien R Y. Annu Rev Biochem. 1998;67:509–544. doi: 10.1146/annurev.biochem.67.1.509. [DOI] [PubMed] [Google Scholar]
- 2.Cubitt A B, Heim R, Adams S R, Boyd A E, Gross L A, Tsien R. Trends Biochem Sci. 1995;20:448–455. doi: 10.1016/s0968-0004(00)89099-4. [DOI] [PubMed] [Google Scholar]
- 3.Crameri A, Whitehorn E A, Tate E, Stemmer W P C. Nat Biotechnol. 1996;14:315–319. doi: 10.1038/nbt0396-315. [DOI] [PubMed] [Google Scholar]
- 4.Haupts U, Maiti S, Schwille P, Webb W W. Proc Natl Acad Sci USA. 1998;95:13573–13578. doi: 10.1073/pnas.95.23.13573. [DOI] [PMC free article] [PubMed] [Google Scholar]
- 5.Ormö M, Cubitt A B, Kallio K, Gross L A, Tsien R Y, Remington S J. Science. 1996;273:1392–1395. doi: 10.1126/science.273.5280.1392. [DOI] [PubMed] [Google Scholar]
- 6.Wachter R M, Elsliger M A, Kallo K, Hanson G T, Remington S J. Structure (London) 1997;6:1267–1277. doi: 10.1016/s0969-2126(98)00127-0. [DOI] [PubMed] [Google Scholar]
- 7.Heim R, Prasher D C, Tsien R Y. Proc Natl Acad Sci USA. 1994;91:12501–12504. doi: 10.1073/pnas.91.26.12501. [DOI] [PMC free article] [PubMed] [Google Scholar]
- 8.Niwa H, Inouye S, Hirando T, Matsuno T, Kojima S, Kubota M, Ohashi M, Tsuji F I. Proc Natl Acad Sci USA. 1996;93:13617–13622. doi: 10.1073/pnas.93.24.13617. [DOI] [PMC free article] [PubMed] [Google Scholar]
- 9.Philips G N. Curr Opin Struct Biol. 1997;7:821–827. doi: 10.1016/s0959-440x(97)80153-4. [DOI] [PubMed] [Google Scholar]
- 10.Brejc J, Sixma T, Kitts P A, Kain S R, Tsien R Y, Ormö M, Remington J S. Proc Natl Acad Sci USA. 1997;94:2306–2311. doi: 10.1073/pnas.94.6.2306. [DOI] [PMC free article] [PubMed] [Google Scholar]
- 11.Chattoraj M, Kong B A, Bublitz G U, Boxer S G. Proc Natl Acad Sci USA. 1996;93:8362–8367. doi: 10.1073/pnas.93.16.8362. [DOI] [PMC free article] [PubMed] [Google Scholar]
- 12.Lossau H, Kummer A, Heinecke R, Pöllinger-Dammer F, Kompa C, Bieser G, Jonsson T, Silva C M, Yang M M, Youvan D C, et al. Chem Phys. 1996;213:1–16. [Google Scholar]
- 13.Kummer A D, Kompa C, Lossau H, Pöllinger-Dammer F, Michel-Beyerle M E, Silva C M, Bylina E J, Coleman W J, Yang M M, Youvan DC. Chem Phys. 1998;237:183–193. [Google Scholar]
- 14.Voityuk A A, Michel-Beyerle M E, Rösch N. Chem Phys Lett. 1998;296:269–276. [Google Scholar]
- 15.Weber W, Helms V, McCammon J A, Langhoff P W. Proc Natl Acad Sci USA. 1999;96:6177–6182. doi: 10.1073/pnas.96.11.6177. [DOI] [PMC free article] [PubMed] [Google Scholar]
- 16.Magde D, Elson E, Webb W W. Phys Rev Lett. 1972;29:705–708. [Google Scholar]
- 17.Dickson R M, Cubitt A B, Tsien R Y, Moerner W E. Nature (London) 1997;388:355–358. doi: 10.1038/41048. [DOI] [PubMed] [Google Scholar]
- 18.Koppel D E, Axelrod D, Schlessinger J, Elson E L, Webb W W. Biophys J. 1976;16:1315–1329. doi: 10.1016/S0006-3495(76)85776-1. [DOI] [PMC free article] [PubMed] [Google Scholar]
- 19.Rigler R, Mets Ü, Widengren J, Kask P. Eur Biophys J. 1993;22:169–175. [Google Scholar]
- 20.Mertz J, Xu C, Webb W W. Opt Lett. 1995;20:2532–2534. doi: 10.1364/ol.20.002532. [DOI] [PubMed] [Google Scholar]
- 21.Schwille P, Haupts U, Maiti S, Webb W W. Biophys J. 1999;77:2251–2265. doi: 10.1016/S0006-3495(99)77065-7. [DOI] [PMC free article] [PubMed] [Google Scholar]
- 22.Widengren J, Mets Ü, Rigler R. J Chem Phys. 1995;99:13368–13379. [Google Scholar]
- 23.Peterman, E. J. G., Brasselet, S. & Moerner, W. E. (1999) J. Phys. Chem., in press. [DOI] [PubMed]
- 24.Wachter R M, Remington S J. Curr Biol. 1999;9:R628–R629. doi: 10.1016/s0960-9822(99)80408-4. [DOI] [PubMed] [Google Scholar]
- 25.Bokman S H, Ward W. Biochem Biophys Res Commun. 1981;101:1372–1380. doi: 10.1016/0006-291x(81)91599-0. [DOI] [PubMed] [Google Scholar]
- 26.Helms V, Straatsma T P, McCammon J A. J Phys Chem B. 1999;103:3263–3269. [Google Scholar]
- 27.Voityuk A A, Michel-Beyerle M E, Rösch N. Chem Phys. 1998;231:13–25. [Google Scholar]