Abstract
A detailed study of metal-enhanced fluorescence (MEF) from fluorophores in the blue-to- red spectral region placed in close proximity to thermally evaporated zinc nanostructured films is reported. The zinc nanostructured films were deposited onto glass microscope slides as individual particles and were 1–10 nm in height and 20–100 nm in width, as characterized by Atomic Force Microscopy. The surface plasmon resonance peak of the zinc nanostructured films was ≈ 400 nm. Finite-difference time-domain calculations for single and multiple nanostructures organized in a staggered fashion on a solid support predict, as expected, that the electric fields are concentrated both around and between the nanostructures. Additionally, Mie scattering calculations show that the absorption and scattering components of the extinction spectrum are dominant in the UV and visible spectral ranges, respectively. Enhanced fluorescence emission accompanied by no significant changes in excited state lifetimes of fluorophores with emission wavelengths in the visible blue-to-red spectral range near-to zinc nanostructured films were observed, implying that MEF from zinc nanostructured films is mostly due to an electric field enhancement effect.
Keywords: Metal-Enhanced Fluorescence, Plasmon-Enhanced Fluorescence, Surface-Enhanced Fluorescence, Plasmonics, Radiative Decay Engineering, Zinc Oxide Nanostructures, Silver Island Films, Metallic Nanostructures, Plasmonic Nanostructures, Aluminum Nanostructures, Fluorophores
INTRODUCTION
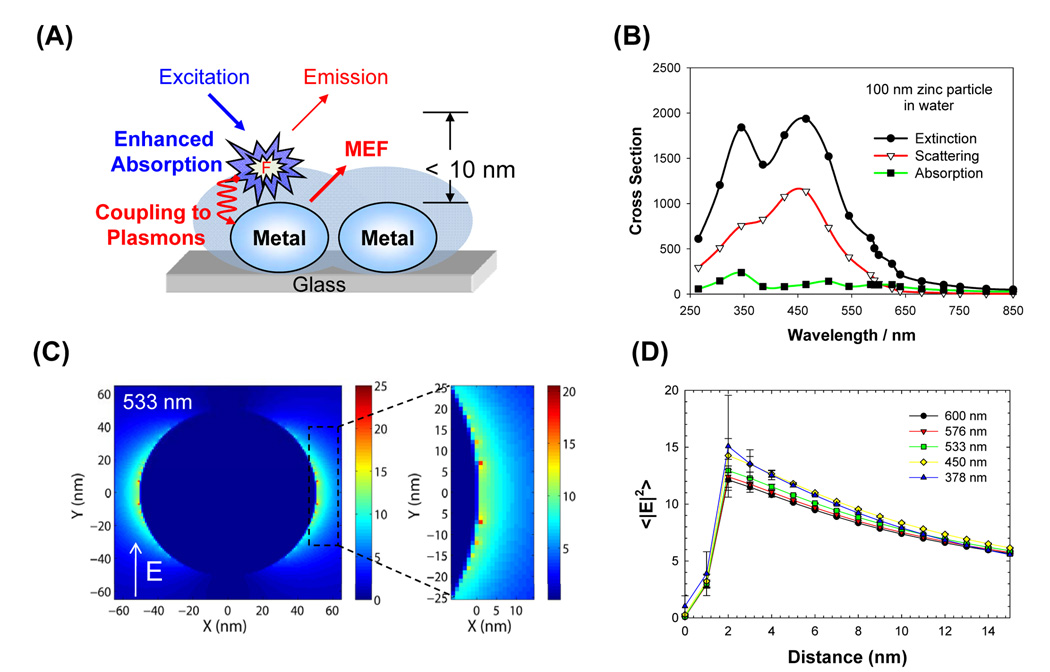
Metal-Enhanced Fluorescence (MEF),1 a technique that is based on the utilization of plasmonic (metals) nanostructures with fluorescent species, is becoming a useful tool for applications in medical diagnostics and biotechnology.2, 3 According to our laboratory’s interpretation of MEF (Figure 1A), MEF is governed by two mechanisms 1) an electric field effect and 2) coupling of excited states energies of fluorophores to surface plasmons. In the so-called electric field effect, fluorophores in close proximity (<10 nm) to the plasmonic nanoparticles are exposed to the increased electric fields in between and around the nanoparticles, effectively resulting in significant increases in their absorption cross section. This lends itself to a subsequent increase in the excitation and eventually in the fluorescence emission from the fluorophores, while the lifetime remains unchanged. In the second mechanism, where the excited state energies of fluorophores are partially transferred to surface plasmons (induced surface plasmons), two distinct observations can be made for fluorescent species in close proximity to plasmonic nanoparticles: 1) an increase in the fluorescence emission from the metal-fluorophore unified system with the spectral properties of the fluorophores maintained,4 and 2) a reduction in the fluorescence lifetime, giving rise to improvements in the photostability of the fluorophores.4
Figure 1.
(A) Schematic representation of the Metal-Enhanced Fluorescence phenomena; (B) Calculated Mie extinction, scattering and absorption cross section for 100 nm zinc nanoparticles; (C) FDTD image shown for a 533 nm source and (D) distance-dependent |E|2 intensity distribution for a 100 nm zinc nanoparticle illuminated with TFSF source propagating along the z-axis.
To date, MEF from plasmonic nanostructured materials such as silver,5 gold,6, 7 copper8 and aluminum9 have been observed. In this regard, while silver, gold and copper nanoparticles were used for applications of MEF with fluorophores emitting in the visible-NIR wavelength region, aluminum nanostructured films were shown9 to enhance the fluorescence emission of fluorophores in the UV and blue spectral regions. The selection of fluorophores for MEF applications is usually limited by the choice of metals since the absorption and scattering components of the metal are thought to play an important role in MEF.4 In reports on MEF to date, fluorophores which emit at red-shifted wavelengths with respect to the wavelength of the surface plasmon resonance (SPR) peak of the metals, where the surface plasmons collectively absorb/scatter light, are preferentially used. The wavelength of the SPR peak(s) mainly depends on the size and shape of the plasmonic nanostructures as well the refractive index of the surrounding medium. For example, silver colloids (spherical nanoparticles), the most commonly studied metal for MEF, has an SPR peak around 420 nm and this peak is red-shifted as the size of the colloids is increased (or due to aggregation). MEF from silver,4 gold10 and copper8 nanostructures have been shown with fluorescein (emission at 520 nm) or longer-wavelength fluorophores. In a recent study,9 aluminum nanostructured films were shown to enhance the fluorescence emission of fluorophores in the UV and blue spectral region.9 Although the surface morphology and the absorption spectra of these aluminum films resembled continuous films and the SPR peak was not evident in that study, one would expect the SPR peak of the aluminum nanoparticles to be in the UV range and thus facilitate MEF.
Various computational methods have shown that electromagnetic fields are enhanced or concentrated in proximity to metal nanoparticles.11–14 In comparison to traditional Mie theory,15 more accurate computational methods, such as discrete dipole approximation (DDA)16 or finite difference time domain (FDTD) methods11, 17 are often implemented to accurately approximate field distributions for larger particles with quadruple plasmon resonances, plasmon frequencies of silver nanoparticles, or non-spherical nanoparticles in complex media or arrangements.16–19 Recently, 2D FDTD simulations were performed to evaluate the maximum electric field enhancements at the surface of nanoparticle arrays, whereby nanostructures are modeled as nanowires with infinite length.20 Although the 2-D simulations will not predict that the localized surface plasmon extinction peak shifts to longer wavelengths with increasing height of nanostructures,21 2D calculations have been used to evaluate the local electric field enhancements in proximity to the nanoparticles.20
Zinc nanostructured films, especially in the oxide form (ZnO), have been used in many optical and optoelectronic applications due to their desirable optical properties at room temperature (band gap energy of 3.37 eV and exciton binding energy of 60 meV). Recently, ZnO nanostructured thin films (100 nm) deposited onto silicon wafers were used in a biosensing scheme, where increased fluorescence emission from fluorescein-labeled biomolecules was observed.22, 23 In addition, micro-scale ZnO structures were also shown to increase in fluorescence emission of fluorophores with emission wavelengths in the green-to-red spectral range.24 These observations were thought to relate to changes in photonic mode density near zinc structures, however, no descriptive mechanisms governing the enhanced fluorescence from zinc structures was given or even investigated.24 Moreover, a key study for MEF, the lifetime of fluorophores near zinc structures was not undertaken.24
In this report, a detailed investigation of MEF from fluorophores near zinc nanostructured thin films is reported. The zinc nanostructured films (1–10 nm thick) were deposited onto glass microscope slides by thermal evaporation. The characterization of the zinc nanostructured films undertaken by optical spectroscopy and Atomic Force Microscopy revealed a surface plasmon resonance peak around 400 nm and a particle width of 20–100 nm, respectively. FDTD calculations for a single, two and 12 nanostructure array show that the electric fields are concentrated around and between the nanostructures. Using 2D FDTD calculations, we have also provided a relative comparison of the wavelength dependence of the maximum field enhancements for zinc and silver nanoparticle arrays. When placed in close proximity to zinc nanostructures, metal-enhanced fluorescence emission from several fluorophores with emission wavelengths in the blue-to-red spectral range, was observed. In addition, no change in the lifetime of fluorophores was observed, which strongly indicates that MEF from zinc nanostructured films is dominated by the electric field effect. Further evidence for this hypothesis was gained from additional chemiluminescence studies on zinc nanoparticles, where no increase in chemiluminescence emission was observed due to the lack of coupling of chemically induced excited states to surface plasmons in the absence of any possible electric field component.
Given the growing interest in MEF and its applications, then UV enhancing materials are likely to find many Analytical applications in the Biosciences. It should be reemphasized that traditional MEF metals such as silver and gold are not suitable for the UV spectral range, only aluminum demonstrated to date,25 although the surfaces were ill-defined in this one report.25
EXPERIMENTAL SECTION
Materials
All fluorophores (7-hydroxycumarin-4-acetic acid (7-HC), fluorescein isothiocyanate (FITC), basic fuchsin, rose bengal and indocyanine green (ICG)) and silane-prep™ glass microscope slides (were purchased from Sigma-Aldrich Chemical company (Milwaukee, WI, USA). Zinc nanostructured films with various thicknesses were deposited onto silane-prep glass microscope slides by Thin Films, Inc., Hillsborough, NJ, USA.
Preparation of Sandwich Format Samples for Metal-Enhanced Fluorescence Measurements
A solution of 500 µL of a fluorophore (< 1 mM) in water was sandwiched between the glass slides and zinc nanostructured films. The surfaces were illuminated with the appropriate excitation source and fluorescence emission spectra and real-color photographs of fluorescence emission were collected as explained below.
Optical Spectroscopy and Real-Color Photographs
Absorption spectra of zinc nanostructured films were collected using a Varian Cary 50 UV-Vis spectrophotometer. Fluorescence spectra of fluorophores on blank glass substrates and zinc nanostructured films were collected using an Ocean Optics HD2000 fluorometer. Real-color photographs of fluorescence emission were taken through an emission filter with a Canon Powershot S50 Digital Camera. Frequency domain lifetime measurements were carried out using a Horiba JobinYvon multi-frequency fluorometer (MF2). The excitation wavelengths for 7-HC, FITC, basic fuchsin, rose bengal and ICG were, 405, 473, 532, 532, and 632 nm (all laser lines), respectively.
Testing for the Coupling of Excited States to Surface Plasmons in the Absence of a Notable Electric Field Effect using Chemiluminescence Solutions
In order to test whether enhanced luminescence can be observed from Zinc substrates in the absence of notable electric fields, the following experiment was undertaken: A chemiluminescence solution with emission in the blue spectral region was placed between two glass microscope slides (a control sample) and two zinc substrates in a sandwich format. The chemiluminescence emission from these substrates was subsequently collected using an Ocean Optics HD2000 fluorometer.
Frequency-Domain Phase and Modulation Measurements
Lifetime of fluorophores was measured using a Multi-Frequency Fluorometer from HORIBA Jobin Yvon. The excitation of fluorophores (in sandwich format and front-face geometry) was performed by a 408 nm NanoLED pulsed laser-diode and a 475 nm long-pass filter was used for the emission. Rhodamine 101 in water was used as a standard fluorophore (lifetime = 4.32 ns). The frequency-domain phase and modulation values were analyzed with a mono-exponential decay time model using fitting software provided by HORIBA Jobin Yvon, where the lifetime of the fluorophores were determined.
Atomic Force Microscopy (AFM)
AFM images were performed on a Molecular Imaging Picoplus Microscope. Samples were imaged at a scan rate of 1 Hz with 512 × 512 pixel resolution in contact mode. The width of the zinc nanostructures was determined using Adobe Photoshop software.
Mie Scattering and Finite-Difference Time-Domain (FDTD) Calculations
Mie scattering calculations for zinc nanoparticles were performed using freeware MieCalc v1.5 software (from Dr. Bernhard Michel - Simuloptics GmbH). This freeware allows one to calculate optical cross-sections and efficiencies as a function of various parameters such as wavelength, size of particle. In this regard, the optical cross-section for zinc nanoparticle (diameter 100 nm) was carried out between 250–850 nm for water as the surrounding medium (refractive index = 1.33). The wavelength-dependent optical constants were obtained from CRC Handbook of Chemistry and Physics, 85th Edition and were incorporated into the MieCalc software.
The FDTD method was employed here to determine the electric field intensities and distributions at the surface of 100 nm silver or zinc nanoparticles in a Total Field Scattered Field (TFSF) (Figure 1C–D). These results were compared with previously published reports for the maximum electric field intensities and scattering cross sections for 2D FDTD simulations of silver nanoparticles to verify the accuracy of the model.17 TFSF sources are used to divide the computation area or volume into total field (incident plus scattered field) and scattered field only regions.26, 27 The incident p-polarized electric field is defined as a plane wave with a wavevector that is normal to the injection surface. The scattered and total fields were monitored during the simulation such that the total or scattered transmission can be measured. Using FDTD Solution software (Lumerical, Inc. http://www.lumerical.com), the simulation region is set to 800 × 800 × 800 nm3 with a mesh accuracy of 6. To minimize simulation times and maximize resolution of field enhancement regions around the various particle arrangements, a mesh override region is set to 0.5 nm around the 100 nm nanoparticle arrays. The overall simulation time was set to 500 ns and calculated over a frequency range from 300–800 nm for silver nanoparticles and 235–800 nm for the zinc nanoparticles, whereby a plasma model is used to represent the properties of the silver or zinc nanoparticles in the range from 300– 800 nm or 235–800 nm, respectively. Particle spacing was set to 2 nm in the x and y dimension and mesh size (Δx and Δy) were set at 1 nm, 0.5 nm, and 0.25 nm to test convergence for multi-particle simulations. Convergence for 2 particle simulations was reached with Δx and Δy set to 0.5 nm.
RESULTS AND DISCUSSION
Figure 1B shows the comparison of extinction, scattering and absorption cross section of a 100 nm zinc nanoparticle (spherical) in water calculated using MieCalc software. While the extinction spectrum is dominated by the absorption component in the UV region (250–350 nm), the scattering component is more dominant in the blue and visible spectral range (up to 600 nm). The significance of this figure lies in the fact that Mie calculations can be used as a preliminary predictive tool in MEF studies for the plasmon-coupling component, as the MEF phenomena is underpinned by the absorption and scattering components of the metal’s extinction spectrum.4 Further detailed electric field (enhanced absorption) information on the interaction of zinc nanoparticles (or any other metal) with electromagnetic energy can be deduced from FDTD calculations, where the distribution of the electric field component (and the magnetic field) around the nanostructures can be predicted as shown in Figures 1C and 1D. Figures 1C and 1D show that the electric field (|E|2) is focused about 2 nm from the surface for 378 to 600 nm wavelength light and is diminishing further away from the surface. These calculations imply that the extent of the enhanced absorption phenomena is similar for fluorophores absorbing between 378–600 nm when placed in close proximity to zinc nanostructures.
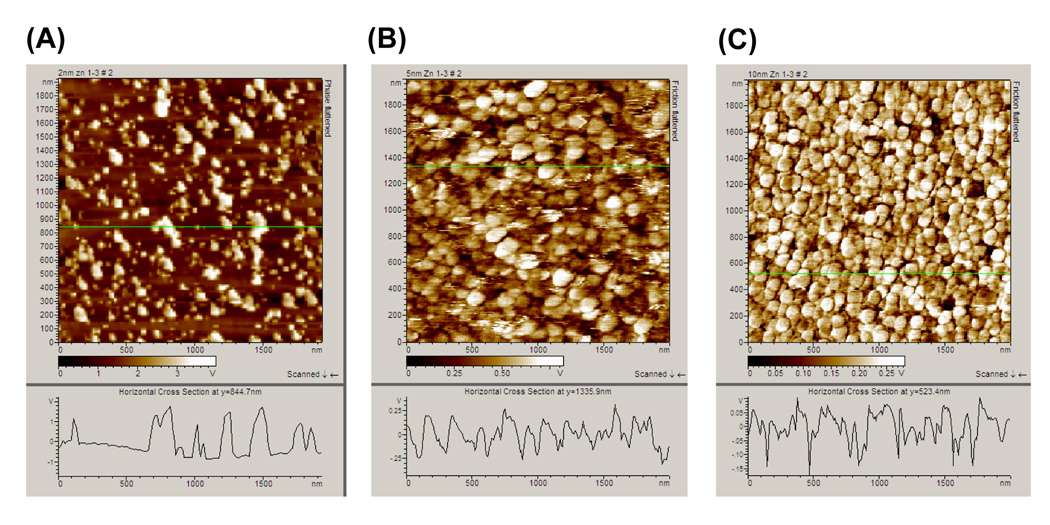
Previous reports on MEF using metal nanostructured films thermally evaporated onto solid substrates have shown a noticeable MEF effect for samples with the thickness of the metal layer ranging 1–10 nm.6, 28 In this regard, to study the effect of sample thickness, six thermally evaporated zinc nanostructured films with thicknesses of 1, 2, 3, 4, 5 and 10 nm were prepared. It is important to note that these thickness values refer to the thickness of the metal measured by the micro quartz balance in the thermal metal evaporator. Atomic Force Microscopy (AFM) was additionally employed to assess the actual surface morphology of the zinc nanostructured films. AFM images of 2-, 5- and 10 nm thick zinc nanostructured films show the zinc nanostructures were deposited onto the glass microscope slides as individual particles. Figure 2 also shows a decrease in the gap between the individual particles as the thickness of the zinc nanostructured film is increased. The width of the zinc nanostructures is on the average of 20 nm for 2-, 5-nm thick zinc nanostructured film samples, and the average width is 100 nm for 10 nm thick zinc samples. Several larger aggregates are also present in the 2 nm thick sample.
Figure 2.
Atomic Force Microscope images of zinc nanostructured films with thicknesses of (A) 2 nm, (B) 5 nm and (C) 10 nm determined using the contactmode of the AFM. The thicknesses of the zinc nanostructured films were measured by the micro quartz balance in the metal evaporator.
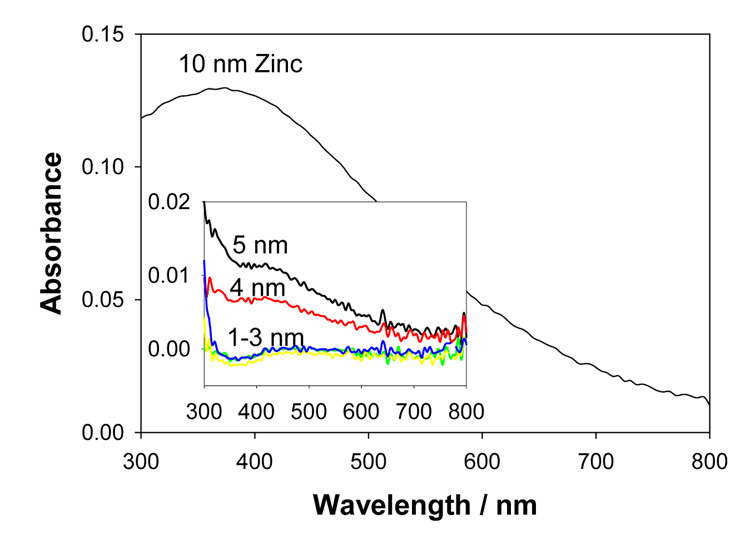
Figure 3 shows the absorption spectrum of the zinc nanostructured films deposited onto glass microscope slides (75×25 mm). Zinc nanostructures display a plasmon resonance (SPR) peak centered at ≈ 380 nm. The SPR peak value for 1–3 nm zinc nanostructured films is identical and an increase in this value is observed with an increase in thickness of the zinc nanostructured film. The absorption spectrum for a 10 nm thick zinc film also shows a broadening at the longer wavelengths as a result of reduced distance between the zinc nanostructures themselves.
Figure 3.
Absorption spectrum of vapor deposited metallic zinc of various thicknesses deposited onto glass microscope slides. These measurements were made with dry samples (in air).
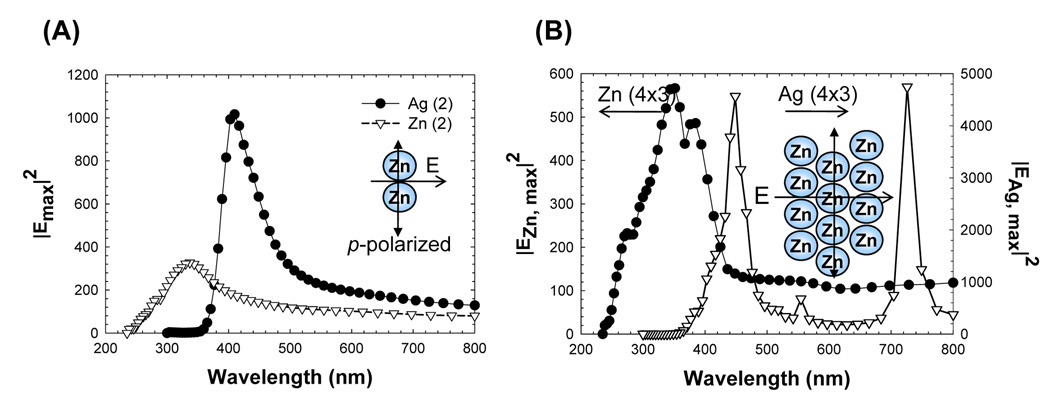
It is well known that significant increases in the electric fields between the plasmonic nanostructured materials can be achieved by varying the type, shape, size of the plasmonic nanostructured materials as a function of the gap distance.29–33 In this regard, we have calculated the electric field enhancements (using FDTD calculations) for two cases of organization of zinc nanostructures on a planar surface, and compared these results with those carried out for silver nanostructures: 2 nanoparticles and 12 staggered (4×3, see Figure 4B-inset) nanoparticles as shown in Figure 4. It is important to note that 2-nanoparticles case is considered to reflect the simplest case for enhanced absorption, which occurs between and around 2 nanoparticles. FDTD calculations were undertaken for 12 zinc nanostructured particles to represent the case where multiple zinc nanostructured particles are deposited very close to one another for thicker films, i.e, not unlike the AFM images obtained. In both cases, the maximum electric field intensity calculated for zinc is predicted to occur over a broad range of wavelengths and peaks at 350 nm, which is blue-shifted with respect to that of silver nanoparticles (420 nm). FDTD calculations show that the electric field intensity distributions for zinc nanostructured films are predicted to be weaker as compared to that for silver nanoparticles. However, for silver nanoparticles, the electric fields are effective only in the 400–500 nm range (Figure 4B), which implies that enhanced absorption component of MEF (using silver nanoparticles) will only apply to a limited number of fluorophores in this spectral range and would not work for UV fluorophores. In contrast, the enhanced absorption component should account for MEF from zinc nanoparticles over a broader range of fluorophores/wavelengths. Importantly, calculations shown in Figure 4 predict that zinc nanoparticles can be used for MEF applications (i.e. enhanced absorption component) with fluorophores in the UV spectral range.
Figure 4.
Calculated |E|2 maximum intensity for Zn and Ag nanoparticle arrays (d = 100 nm) (A) 2 nanoparticles, (B) 12 nanoparticles (4×3). Geometries and incident field polarization (p-polarized) and propagation direction are shown in the insets. The gap between the nanoparticles was assumed to be 2 nm in the calculations.
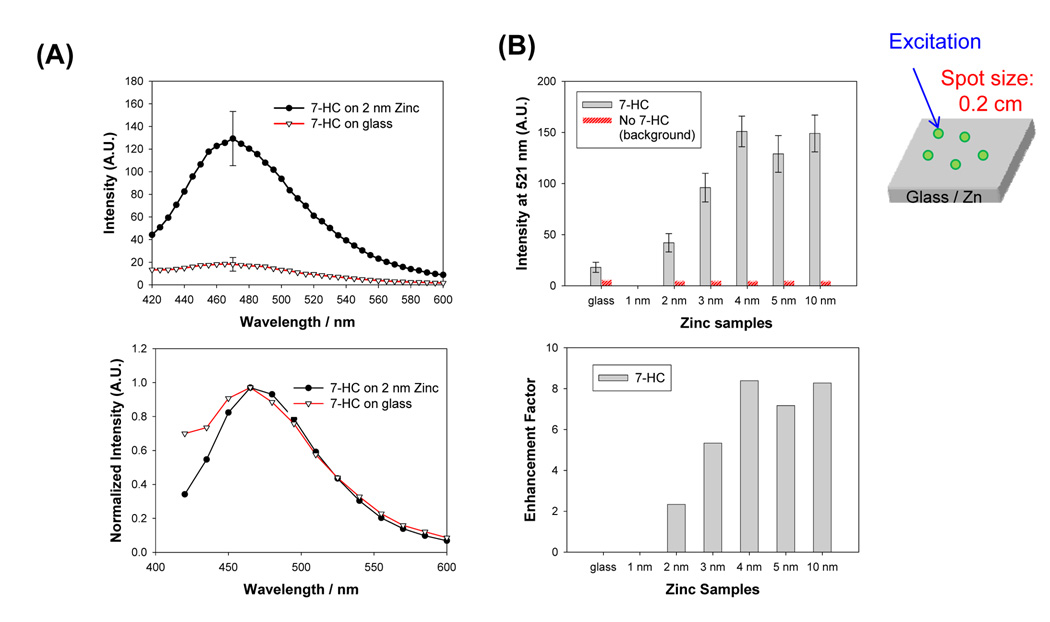
MEF from several fluorophores placed in close proximity to zinc nanostructured films was studied. Figure 5A shows the fluorescence emission spectra of 7- hydroxycumarin-4-acetic acid (7-HC) emission sandwiched between two blank glass microscope slides and zinc nanostructured films in separate experiments. Fluorescence emission of 7-HC from zinc nanostructured films are more intense than that from the glass microscope slides. The fluorescence emission peak of 7-HC is at ≈ 470 nm (from solution measurements, Figure S3). Background emission, which was assessed from the control samples (blank: no 7-HC), is significantly lower than the samples with 7-HC. To quantitatively assess the effect of zinc nanostructured films on the 7-HC emission, enhancement factors were calculated from 5 different measurements, i.e., enhancement factor = intensity of 7-HC at 470 nm on zinc / intensity of 7-HC at 470 nm on glass. Figure 5B shows that the intensity at 470 nm from zinc nanostructured films are larger than from the glass substrate alone and show an increase with the thickness of the zinc nanostructured films. The enhancement factor increases as the thickness of the zinc nanostructures increases, where larger enhancement factors are observed for zinc substrates with thicknesses > 4 nm.
Figure 5.
(A) Raw (top) and normalized (bottom) fluorescence emission spectrum of 7- HC from zinc (2 nm thick) and glass substrates. (B) Fluorescence emission intensity of 7-HC measured (at 470 nm) from glass and zinc substrates (top) and calculated fluorescence enhancement factor for FITC. (C) Sample geometry. Average of 5 measurements collected from different spots on the samples are shown. A.U. Arbitrary Units.
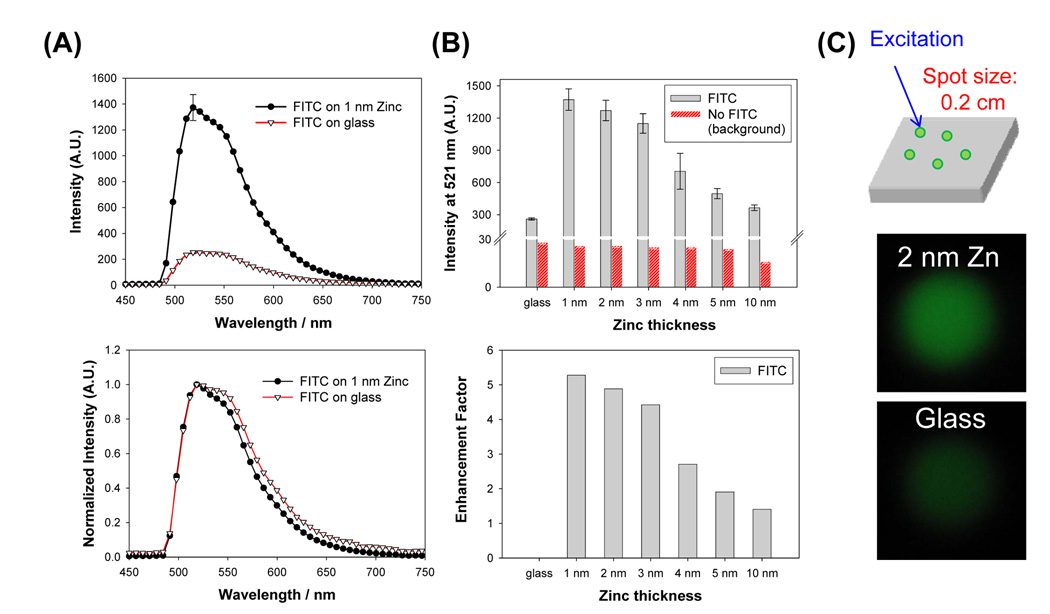
Since the FDTD calculations predict the increased electric fields around zinc nanoparticles also at longer wavelengths (Figure 1D), MEF from several other fluorophores with emission wavelengths ranging from 500–700 nm were also studied. Figure 6 shows the results for FITC that has an emission peak at 521 nm (See also Figure S1 and Figure S2). Figure 6A-top shows the increased fluorescence emission from FITC sandwiched between 1 nm thick zinc nanostructured films as compared to blank glass slides. Normalized emission spectra reveal that the spectral features of FITC on zinc nanostructured films and on glass microscope slides are similar. Figure 6B shows the comparison of the fluorescence emission intensity of FITC collected from 5 different spots on all zinc nanostructured films and the blank glass control slide. The largest enhancement of fluorescence was observed from 1 nm thick zinc nanostructured films and decreased monotonically as the thickness of zinc layer is increased. The enhancement factor was only 1.5-fold on 10 nm thick zinc nanostructured films. Background emission was found to be 10-fold lower than the weakest observed emission intensity (from glass). Visual confirmation of enhancement of fluorescence by zinc nanostructured films is provided with the comparison of real-color photographs of emission of FITC from zinc nanostructured films and on glass, Figure 6C.
Figure 6.
(A) Raw (top) and normalized (bottom) fluorescence emission spectrum of FITC from zinc (1nm thick) and glass substrates. (B) Fluorescence emission intensity of FITC measured (at 521 nm) from glass and zinc substrates (top) and calculated fluorescence enhancement factor for FITC. (C) Sample geometry and real-color photographs of FITC emission from 2 nm zinc (top) and glass (bottom) substrates taken through an emission filter. Average of 5 measurements collected from different spots on the samples are shown. Enhancement factor is calculated as the ratio of the intensity at 521 nm on zinc substrates to glass. A.U. Arbitrary Units.
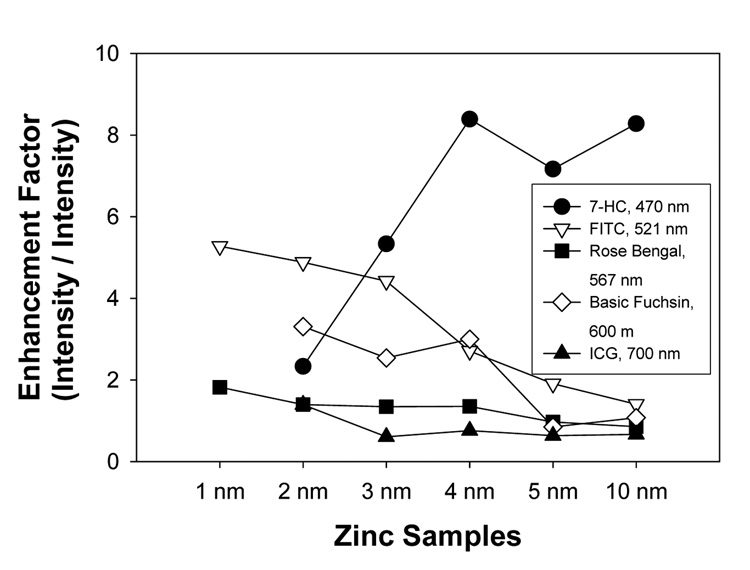
Figure 7 summarizes the comparison of the enhancement factors calculated for 7-HC, FITC, rose bengal, basic fuchsin and ICG deposited onto zinc nanostructured films. The largest enhancement factor, 5-fold, was observed from FITC (emission at 521 nm) on 1 nm thick zinc nanostructured films. The enhancement factor decreases as the thickness of the zinc layer increases for all the fluorophores, except for 7-HC that shows an opposite trend. It is important to note the enhancement factor calculations for the fluorophores (except 7-HC) and the total photon counts for 7-HC cannot be compared directly due to the differences in the measurement techniques (see experimental section), and are thus plotted on a different axis.
Figure 7.
Calculated fluorescence enhancement factor for various fluorophores deposited onto zinc substrates. Enhancement factor is calculated as the ratio of the intensity or total photon counts at the wavelengths indicated on zinc substrates to glass. Lines between the data points are drawn only to guide the eye.
The authors offer the following explanation for the observation of MEF from zinc nanostructured films. It is the authors’ belief that the MEF phenomenon observed from the fluorophore-plasmonic nanostructure system is a result of a combination of two effects: 1) enhanced absorption of excitation light by fluorophores around plasmonic nanostructures (a near-field effect) and 2) partial non-radiative energy transfer (coupling) to surface plasmons and subsequent efficient emission, although for zinc nanostructures, this is believed to be a very minor component. The enhanced electric field for zinc nanostructured films (Figure 4B) shows the maximum |Ez2| in the spectral range of 250–450 nm. That is, fluorophores placed in close proximity to zinc nanostructured films experience an enhanced absorption of excitation light (for all the fluorophores used in this study) as compared to those in the far-field, i.e, distal from the zinc nanostructures. This is due to enhanced (or focused) electric fields concentrated around the edges of the zinc nanostructured films and diminishes further away from the nanostructures themselves (Figure 1C, D).
After the partial non-radiative energy transfer from fluorophores to induced surface plasmons, the scattering component of the plasmonic nanostructures is thought to play an important role in the re-radiation of the coupled quanta from the particles themselves.4 For 100 nm zinc nanostructured films, the scattering component of the extinction peaks at 450 nm (near the wavelength of 7-HC emission) and diminishes at longer wavelengths, Figure S3. Considering the information above, one can expect that the enhanced absorption and scattering both play an important role in the enhanced emission observed for fluorophores in the UV-blue spectral range (Figure S3).
The observation of a larger enhancement factor for 7-HC on > 4 nm thick zinc nanostructured films as compared to other zinc thicknesses can also be explained by larger enhanced absorption component for > 4 nm thick films as shown in Figure 1B and Figure 3. In contrast, the plasmon coupling/emission component is likely to be the major factor in MEF from fluorophores at longer wavelengths deposited onto zinc nanostructured films irrespective of their thicknesses. However, the trend for the enhancement factor shows a decrease as the thickness of the zinc layer increases for all the fluorophores, except for 7-HC, and is thought to be due to the reduction in the extent of the electric-field component at longer wavelengths.
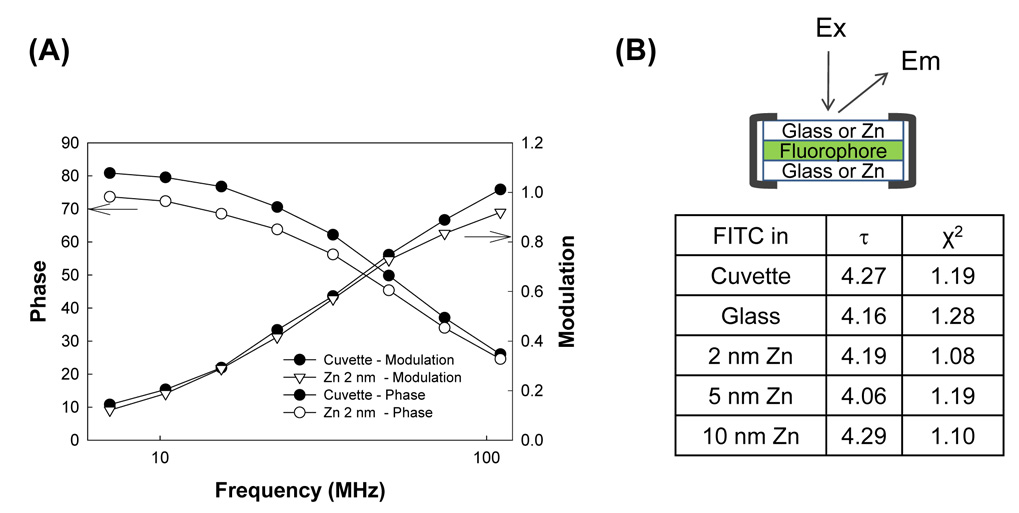
As described in the Introduction, in MEF while the emission of fluorophores placed in close proximity to plasmonic nanostructures is increased, the lifetime of their excited states is expected to be reduced due to the coupling to and emission from the surface plasmons. In this regard, to determine the mechanism by which MEF from zinc substrates is governed, the lifetime of FITC near-to zinc substrates was measured. The experimental geometry and the overall results for the lifetime of FITC are given in Figure 8. Figure 8A shows a similar trend in the frequency-domain phase and modulation of FITC in a cuvette (a control sample) and on 2 nm zinc substrates, indicating that the lifetime of FITC on 2 nm zinc substrates (sandwich format: Zinc / FITC / Zinc; Figure 8B) is similar to that of FITC in cuvette (without zinc substrates). A close examination of Figure 8B reveals that the lifetime of FITC on glass, 2, 5, and 10 nm zinc substrates are 4.16, 4.19, 4.06 and 4.29 nm, respectively.
Figure 8.
(A) Frequency-domain phase and modulation of FITC (in de-ionized water) in a cuvette and on 2 nm thick zinc substrates. The deviation in phase and modulation was set to 0.5 and 0.05 in the parameter fitting, respectively. (B) tabulated lifetime values for FITC measured from glass and zinc substrates. The experimental geometry shows the orientation of samples and the placement of fluorophores with respect to the zinc.
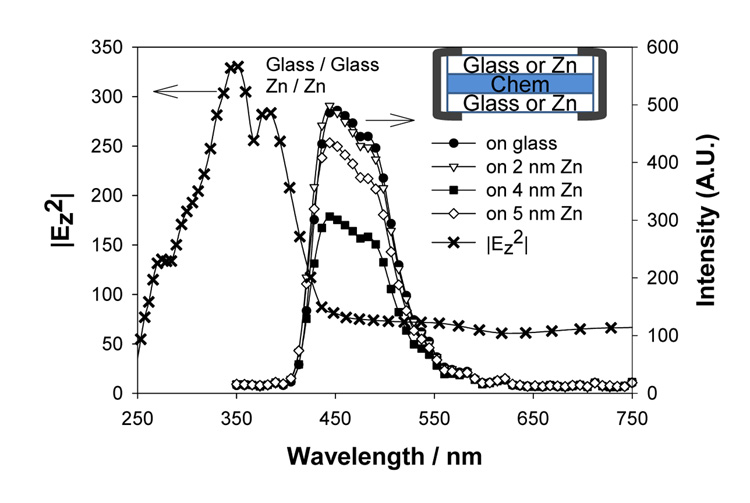
The above lifetime results coupled with the observations of enhanced emission imply that the electric field effect is the dominant mechanism in MEF from zinc substrates. In order to further confirm this hypothesis, another experiment, where only the coupling of excited states to surface plasmons is possibly present, whereas the electric field is absent, was undertaken. This was accomplished by placing a chemiluminescent solution on glass and zinc substrates. Since the emitted light is from only the chemically excited states and there is no external excitation source, little to no electric fields around zinc substrates is present. Figure 9 shows the chemiluminescence spectrum from a chemiluminescent solution placed on glass and the zinc substrates in the sandwich format (Figure 9-inset). The chemiluminescence emission intensities from 2 and 4 nm zinc substrates are less than, or similar to, those from glass, which implies a quenching mechanism.34, 35 These observations support the hypothesis that the enhanced fluorescence emission from zinc substrates appears mainly due to the electric field effect.
Figure 9.
Chemiluminescence spectra for a blue chemiluminescent solution on glass and zinc substrates. Calculated |E|2 maximum intensity for Zn nanoparticles (12) arrays is shown again to show the overlap with the chemiluminescence spectra Note: the reduced chemiluminescence intensities imply that there is no plasmoncoupled enhancement of chemiluminescence as has been observed with silver nanoparticles, 34 suggesting an electric field mechanism for enhancement of the data in Figure 7.
It is also important to note the potential uses of zinc substrates in the Analytical Biosciences. Since zinc substrates enhance fluorescence emission of fluorophores in the UV through the visible spectral range, the authors believe that these substrates can be used in research involving proteins and membranes with UV fluorophores and could be an alternative to more conventional MEF surfaces made from either silver or gold. Moreover, zinc substrates can potentially be used in the detection of intrinsic protein and DNA fluorescence.36
CONCLUSIONS
A detailed study of metal-enhanced fluorescence from zinc nanostructured films thermally evaporated onto glass microscope slides is reported. AFM analysis of the zinc nanostructures (1–10 nm in height as deposited) revealed that the zinc nanostructures were deposited as particulate films onto the glass surface and varied between 20–100 nm in width. Fluorescence emission from fluorophores, in the blue-to-red spectral region, in combination with fluorescence lifetimes, was measured in close proximity to zinc nanostructured films. A 5-fold increase in fluorescence emission and no significant changes in the fluorescence lifetime were observed for FITC. One possible mechanism is predominantly proposed for these observations: i.e., an enhanced absorption around and between zinc nanostructures; contributes to the enhancement of fluorescence emission for all fluorophores studied here. In contrast to the many recent papers on MEF from silver,37 gold,10 and copper8 etc, these results indicate that zinc nanostructured films can also be used in MEF applications, which utilize fluorophores in the blue (and UV) spectral region, and offer an alternative surface to MEF applications as compared to silver, gold and copper nanostructures.
Supplementary Material
ACKNOWLEDGMENTS
The authors acknowledge the Middle Atlantic Regional Center of Excellence for Biodefense and Emerging Infectious Diseases Research (NIH NIAID - U54 AI057168) and National Institute of Neurological Disorders and Stroke NINDS - NS055187 and NS055187-S1. Salary support to authors from UMBI and the IoF is also acknowledged.
REFERENCES
- 1.Aslan K, Gryczynski I, Malicka J, Matveeva E, Lakowicz JR, Geddes CD. Current Opinion in Biotechnology. 2005;16:55–62. doi: 10.1016/j.copbio.2005.01.001. [DOI] [PMC free article] [PubMed] [Google Scholar]
- 2.Aslan K, Huang J, Wilson GM, Geddes CD. Journal of the American Chemical Society. 2006;128:4206–4207. doi: 10.1021/ja0601179. [DOI] [PubMed] [Google Scholar]
- 3.Aslan K, Lakowicz JR, Szmacinski H, Geddes CD. Journal of Fluorescence. 2005;15:37–40. doi: 10.1007/s10895-005-0211-0. [DOI] [PMC free article] [PubMed] [Google Scholar]
- 4.Aslan K, Leonenko Z, Lakowicz JR, Geddes CD. Journal of Fluorescence. 2005;15:643–654. doi: 10.1007/s10895-005-2970-z. [DOI] [PMC free article] [PubMed] [Google Scholar]
- 5.Weber WH, Eagen CF. Optics Letters. 1979;4:236–238. doi: 10.1364/ol.4.000236. [DOI] [PubMed] [Google Scholar]
- 6.Strekal N, Maskevich A, Maskevich S, Jardillier JC, Nabiev I. Biopolymers. 2000;57:325–328. doi: 10.1002/1097-0282(2000)57:6<325::AID-BIP10>3.0.CO;2-7. [DOI] [PubMed] [Google Scholar]
- 7.Carminati R, Greffet JJ, Henkel C, Vigoureux JM. Optics Communications. 2006;261:368–375. [Google Scholar]
- 8.Zhang Y, Aslan K, Previte MJR, Geddes CD. AIP. 2007;Vol. 90:173116. [Google Scholar]
- 9.Ray K, Chowdhury MH, Lakowicz JR. Analytical Chemistry. 2007;79:6480–6487. doi: 10.1021/ac071363l. [DOI] [PMC free article] [PubMed] [Google Scholar]
- 10.Aslan K, Malyn SN, Geddes CD. J Fluoresc. 2007;17:7–13. doi: 10.1007/s10895-006-0149-x. [DOI] [PubMed] [Google Scholar]
- 11.Yee KS. Antennas and Propagation, IEEE Transactions on [legacy, pre - 1988] 1966;14:302–307. [Google Scholar]
- 12.Barber PW, Chang RK, Massoudi H. Physical Review B. 1983;27:7251–7261. [Google Scholar]
- 13.Yang WH, Schatz GC, Vanduyne RP. Journal of Chemical Physics. 1995;103:869–875. [Google Scholar]
- 14.Moreno E, Erni D, Hafner C, Vahldieck R. Journal of the Optical Society of America a-Optics Image Science and Vision. 2002;19:101–111. doi: 10.1364/josaa.19.000101. [DOI] [PubMed] [Google Scholar]
- 15.Mie G. Ann. Phys. (Leipzig) 1908;25:377–452. [Google Scholar]
- 16.Kelly KL, Coronado E, Zhao LL, Schatz GC. Journal of Physical Chemistry B. 2003;107:668–677. [Google Scholar]
- 17.Challener WA, Sendur IK, Peng C. Optics Express. 2003;11:3160–3170. doi: 10.1364/oe.11.003160. [DOI] [PubMed] [Google Scholar]
- 18.Foteinopoulou S, Vigneron JP, Vandenbem C. Optics Express. 2007;15:4253–4267. doi: 10.1364/oe.15.004253. [DOI] [PubMed] [Google Scholar]
- 19.Hao E, Schatz GC. Journal of Chemical Physics. 2004;120:357–366. doi: 10.1063/1.1629280. [DOI] [PubMed] [Google Scholar]
- 20.Futamata M, Maruyama Y, Ishikawa M. Journal of Physical Chemistry B. 2003;107:7607–7617. [Google Scholar]
- 21.Haynes CL, Van Duyne RP. Journal of Physical Chemistry B. 2001;105:5599–5611. [Google Scholar]
- 22.Dorfman A, Kumar N, Hahm JI. Langmuir. 2006;22:4890–4895. doi: 10.1021/la053270+. [DOI] [PubMed] [Google Scholar]
- 23.Kumar N, Dorfman A, Hahm JI. J Nanosci Nanotechnol. 2005;5:1915–1918. doi: 10.1166/jnn.2005.422. [DOI] [PubMed] [Google Scholar]
- 24.Dorfman A, Kumar N, Hahm J. Advanced Materials. 2006;18 2685-+ [Google Scholar]
- 25.Ray K, Chowdhury MH, Lakowicz JR. Anal Chem. 2007;79:6480–6487. doi: 10.1021/ac071363l. [DOI] [PMC free article] [PubMed] [Google Scholar]
- 26.Taflove A, Hagness SC. Computational Electrodynamics: The Finite- Difference Time-Domain Method. 2nd ed. Norwood, MA: Artech House; 2000. [Google Scholar]
- 27.Anantha V, Taflove A. Ieee Transactions on Antennas and Propagation. 2002;50:1337–1349. [Google Scholar]
- 28.Zhang J, Matveeva E, Gryczynski I, Leonenko Z, Lakowicz JR. J Phys Chem B. 2005;109:7969–7975. doi: 10.1021/jp0456842. [DOI] [PMC free article] [PubMed] [Google Scholar]
- 29.Sherry LJ, Chang SH, Schatz GC, Van Duyne RP, Wiley BJ, Xia Y. Nano Lett. 2005;5:2034–2038. doi: 10.1021/nl0515753. [DOI] [PubMed] [Google Scholar]
- 30.Sherry LJ, Jin R, Mirkin CA, Schatz GC, Van Duyne RP. Nano Lett. 2006;6:2060–2065. doi: 10.1021/nl061286u. [DOI] [PubMed] [Google Scholar]
- 31.Haes AJ, Zhao J, Zou S, Own CS, Marks LD, Schatz GC, Van Duyne RP. J Phys Chem B. 2005;109:11158–11162. doi: 10.1021/jp051178g. [DOI] [PubMed] [Google Scholar]
- 32.Gunnarsson L, Rindzevicius T, Prikulis J, Kasemo B, Kall M, Zou S, Schatz GC. J Phys Chem B. 2005;109:1079–1087. doi: 10.1021/jp049084e. [DOI] [PubMed] [Google Scholar]
- 33.Hao E, Schatz GC, Hupp JT. J Fluoresc. 2004;14:331–341. doi: 10.1023/b:jofl.0000031815.71450.74. [DOI] [PubMed] [Google Scholar]
- 34.Chowdhury MH, Aslan K, Malyn SN, Lakowicz JR, Geddes CD. Journal of Fluorescence. 2006;16:295–299. doi: 10.1007/s10895-006-0082-z. [DOI] [PMC free article] [PubMed] [Google Scholar]
- 35.Chowdhury MH, Aslan K, Malyn SN, Lakowicz JR, Geddes CD. Applied Physics Letters. 2006;88:173104. doi: 10.1063/1.2195776. [DOI] [PMC free article] [PubMed] [Google Scholar]
- 36.Lakowicz JR, Shen YB, D'Auria S, Malicka J, Fang JY, Gryczynski Z, Gryczynski I. Analytical Biochemistry. 2002;301:261–277. doi: 10.1006/abio.2001.5503. [DOI] [PMC free article] [PubMed] [Google Scholar]
- 37.Aslan K, Badugu R, Lakowicz JR, Geddes CD. Journal of Fluorescence. 2005;15:99–104. doi: 10.1007/s10895-005-2515-5. [DOI] [PMC free article] [PubMed] [Google Scholar]
Associated Data
This section collects any data citations, data availability statements, or supplementary materials included in this article.


