Abstract
A de novo sequencing program for proteins is described that uses tandem MS data from electron capture dissociation and collisionally activated dissociation of electrosprayed protein ions. Computer automation is used to convert the fragment ion mass values derived from these spectra into the most probable protein sequence, without distinguishing Leu/Ile. Minimum human input is necessary for the data reduction and interpretation. No extra chemistry is necessary to distinguish N- and C-terminal fragments in the mass spectra, as this is determined from the electron capture dissociation data. With parts-per-million mass accuracy (now available by using higher field Fourier transform MS instruments), the complete sequences of ubiquitin (8.6 kDa) and melittin (2.8 kDa) were predicted correctly by the program. The data available also provided 91% of the cytochrome c (12.4 kDa) sequence (essentially complete except for the tandem MS-resistant region K13–V20 that contains the cyclic heme). Uncorrected mass values from a 6-T instrument still gave 86% of the sequence for ubiquitin, except for distinguishing Gln/Lys. Extensive sequencing of larger proteins should be possible by applying the algorithm to pieces of ≈10-kDa size, such as products of limited proteolysis.
Keywords: Fourier transform MS, electrospray ionization, electron capture dissociation
Mass spectrometry (MS) has proven to be a valuable method for characterizing linear biomolecules, especially peptides and proteins (1–4). “Soft” ionization techniques such as matrix-assisted laser desorption/ionization (5) and electrospray ionization (6) are crucial to such characterizations as they allow large molecules to be vaporized and ionized with minimal dissociation. For an unknown protein that is actually represented in a genomic database, MS sequence information sufficient for its identification often can be obtained from the product masses resulting from dissociation of the protein either by proteolysis (7–11) or by molecular ion fragmentation [tandem MS (MS/MS)] (12). The uniqueness of the very limited data of such a “mass fingerprint” (7–11) or a “sequence tag” (12, 13) can often alone retrieve a single correct protein from the database. However, modifications after transcription (e.g., RNA splicing and posttranslational modifications) are not detailed in the genetic code, which also could contain errors, and the genome from which the protein is derived also may not have been sequenced. In these cases, protein de novo sequencing becomes necessary. An automated MS/MS method providing the complete sequence of a 76-residue protein is described here.
A basic limitation of MS de novo sequencing methods (14–19) is the necessity for backbone cleavage between each pair of adjacent amino acids; a mass value representing a terminal fragment containing only one of the two residues is a first requirement for ordering of a specific pair. However, as proteins become larger, a smaller proportion of the backbone bonds are cleaved by collisionally activated dissociation (CAD) (20–22), infrared multiphoton dissociation (23), and other methods that induce threshold energy dissociation (24, 25). Additional cleavages that are required for sequencing can be achieved with specific enzymes (1–3, 7–11, 13–16, 26), peptide derivatization (27), or MS “ladder sequencing” using mixtures from N-terminal Edman (15) and C-terminal carboxypeptidase (28) cleavages. However, chemical or enzymatic treatment of the sample greatly increases sample requirements; without this, MS sequence information has been obtained from ≈10−17 moles of peptides (29) and proteins (30).
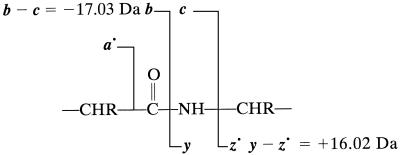
A new MS/MS method, electron capture dissociation (ECD) (31–35), induces far more general backbone cleavage through nonergodic dissociation, deriving extensive sequence information from proteins as large as 42 kDa (36). In contrast to fragment ions from CAD, ECD fragments always contain either the N or C terminus, and these can be distinguished if dissociations between the same residue pair yield both a y and a c or z⋅ ion (Eq. 1). For ubiquitin
(8.6 kDa), every amino acid pair has been separated to form the combined products of its ECD and CAD spectra (3), based on mass assignments from its known sequence. Here we examine the opposite problem of the de novo conversion of these mass values, despite consideration of many more unassignable values, into an accurate sequence with a fully automated computer program. The importance of high mass accuracy is shown by using data of Fourier transform MS (FTMS) (3, 37–40) to predict sequences, and their reliability, for melittin (2.8 kDa), ubiquitin (8.6 kDa), and cytochrome c (12.4 kDa), all noncyclic proteins (except for the heme in cytochrome c) with known termini and no posttranslational modifications.
Materials and Methods
Materials.
Electrospray ionization used 20 μM solutions of melittin, bovine ubiquitin, and equine cytochrome c in 49:49:2 (vol/vol) methanol/water/acetic acid solution. All samples and solvents were obtained from Sigma.
MS.
All spectra were obtained on a modified 6-T Finnigan FTMS (41) using nanoelectrospray ionization (30, 42). Protein molecular ions were dissociated directly by activated ion ECD (“in-beam”) (36) or isolated by stored waveform inverse Fourier transform (43) and subjected to ECD (35). Melittin spectra were scanned starting from m/z 400 and those of ubiquitin and cytochrome c from m/z 500. These spectra were reduced to a set of monoisotopic masses using thrash (44).
Data for de Novo Sequencing.
CAD and ECD are complementary (Eq. 1); CAD cleaves the amide bond to yield b and y fragment ions, whereas ECD cleaves the amine bonds to yield c and z⋅ ions, plus cleavages producing a minor amount of a⋅ and y ions (31–36). Both spectra are necessary to maximize the number of amino acid pairs that are separated. For example, cyclic proline forms two amine bonds, preventing backbone separation after a single cleavage, but CAD preferentially cleaves the amide bond on the N-terminal side of proline. The mass values used for the de novo sequencing of ubiquitin are from a conventional ECD spectrum of the 12+ molecular ions (20 scans), an in-beam ECD spectrum of the 7+ to 13+ ions (50 scans), and a nozzle-skimmer CAD spectrum (22) of 5+ to 13+ ions (33 scans). Values for melittin were from an ECD spectrum of 5+ ions (12 scans) and a nozzle-skimmer CAD spectrum of 3+ to 5+ ions (1 scan). Mass values for cytochrome c are from an in-beam ECD spectrum of 8+ to 18+ ions (100 scans), a conventional ECD spectrum of the 15+ ions (70 scans), and a sustained off-resonance irradiation CAD (21, 22) of the 14+ ions (7 scans).
Mass Accuracy.
Most of the spectra used here were internally calibrated to 2–3 parts-per-million (ppm) error by using the remaining molecular ions in the spectra. Because of lower resolution, the nozzle-skimmer CAD spectra for ubiquitin and melittin could be calibrated only to ≈15 ppm accuracy. Sub-ppm accuracy has been demonstrated for instruments with magnetic fields higher than the 6 T used here (39, 40, 45); the algorithm will be demonstrated after first correcting the ubiquitin data to 1 ppm accuracy and the cytochrome c and melittin data to 15 ppm where necessary. The actual data then will be used for ubiquitin.
De Novo Sequencing Program.
This algorithm uses pv-wave version 6.10 (Visual Numerics, Houston, TX), and all examples were demonstrated on a 275-MHz Sun Ultra 5 workstation. Three algorithm input values are required: (i) an accurate value for the monoisotopic mass of the molecular ion (Mm) to be sequenced, (ii) separate lists of monoisotopic mass values from the ECD and CAD spectra, and (iii) the allowed ppm mass accuracy (the mass tolerance is double for combination and comparison of the mass values).
From the list of masses, the program first identifies all pairs of complementary fragments (two fragments that sum to the mass of the molecular ion) (26), within the ppm tolerance specified above. ECD spectra have two types of pairs (c + z⋅ = Mm + H⋅ and a⋅ + y = Mm + H⋅ − 27.99) and the CAD one (b + y = Mm) (adventitious CAD also can give b, y ions in ECD spectra). These pairs are stored separately and erased from the initial mass list.
In previous MS/MS studies, determining which ion of a pair is b or y requires separate treatment such as 18O labeling of the C terminus (17) or chemical derivatization for amplification of only N- or C-terminal fragments (27, 46). Here this is done by further characterization of the pairs to identify “golden” complementary sets, a pair for which type of fragment ion has been formed by cleavage between the same pair of amino acids. For our original algorithm, used here for the 2.8- and 8.6-kDa proteins, only the c,z⋅ pairs are used for derivation of these golden sets, but extension to derive golden sets also for a⋅, y and b, y pairs is recommended below. If another mass value from one of the ECD spectra is 16.02 Da (within the designated accuracy) larger than one of the two masses in a c,z⋅ complementary pair, this new mass should correspond to a y fragment cleavage of the adjacent amide bond (Eq. 1); the mass that is 16.02 Da smaller than the y mass is thus assigned as the z⋅ fragment, and its complement is the c. The a⋅ ions are not used for these golden assignments as the c − a⋅ = 44 Da difference is a common side-chain loss (31–35). The mass values of b,y complementary pairs (not that of either alone) from the CAD spectrum also are used to assign golden complementary sets to the ECD c,z⋅ pairs, with b − c = −17.03 Da and y − z⋅ = +16.02 Da (Eq. 1). All assigned golden complementary sets are now ordered in a template sequence. Reference mass values for the N- and C-terminal groups also are established in this template based on terminal substitution; with no additional substitution, these reference masses are 0 Da from the N terminus and 18.01 Da from the C terminus (1–4).
Next, assignment to the template of each of the remaining complementary pairs is attempted based on mass differences consistent with the masses of one or more amino acids. However, each pair could belong in either of two positions in the template; it is possible that golden complementary sets near both positions will show acceptable mass differences, so that assignment of a pair to one terminus is made only if the other assignment is not possible. Thus if the difference between a mass in a remaining complementary pair and an N-terminal fragment in a golden set is within 200 Da and does not correspond to the mass sum of one or more amino acid residues, then this mass of the pair is assigned as a C-terminal fragment and this pair is placed as a new golden set in the template sequence and removed from the pair list. The accuracy of these golden sets is critical; if the assignment of a golden complementary set is inconsistent with the template, it and all of the newly incompatible golden sets are removed and placed back in the list of complementary pairs. Thus far, all incorrect assignments have been a consequence of 1-Da mass errors (see below), but coincidences, such as those involving mass values of CAD internal ions, are possible.
In the final step of the original algorithm (used for the 2.8- and 8.6-kDa proteins), the remaining complementary pairs and individual mass values of the ECD and CAD data are used to fill, where possible, the remaining gaps in the template between each pair of golden complementary sets. Such attempted assignments are made from the N-terminal end of the gap and continue until reaching the golden set at the other end (also attempting to fill the gap starting at the C-terminal end is recommended below). If this final mass difference does not correspond to the mass of one or more amino acids, the partial gap sequence is placed in a separate file for later consideration in case no sequence is formed that fills the gap. For each such sequence gap, more than one assignment can be possible. For example, a gap of 128.06 Da could be either Gln or Gly + Ala (57.02 + 71.04 Da). Also, the identical mass residues Leu and Ile are not distinguished. The best of multiple assignments for a specific subsequence is chosen by a probability-based scoring scheme.
Subsequence Scoring.
The mass data from the ECD and CAD spectra are complementary; both data sets are required for complete sequencing. Thus a mass difference corresponding to a specific amino acid between a mass assigned in the template (see above) and a mass from a previously unassignable ECD or CAD complementary pair is given a value of 1.0. Similar fitting of the individual fragment masses (those not in pairs) are given values of ECD c,z⋅ = 0.8, ECD a⋅,y = 0.4, and CAD b,y = 0.6, based approximately on their occurrence frequency; for CAD, ≈50% of the masses represent internal fragments from multiple dissociations of the molecular ion. The occurrence probability of a b or y mass in a CAD spectrum further depends on the identity of the amino acids on both sides of the cleavage; their 0.6 value is multiplied by this reported average (34) of their relative cleavage frequencies (e.g., 3.1 for the N-terminal side of Pro and 2.4 for the C-terminal side of Asp). These ECD spectra showed little fragmentation adjacent to Leu or Ile, so values for these CAD cleaved were increased by 0.5. Also added was the constraint that a sequence was not allowed that required ECD to yield c and z⋅ fragments on the N-terminal side of proline; otherwise, ECD fragmentations were considered to be sufficiently independent of sequence (31–36). The score for each predicted subsequence is the average of the scores given to each mass used to generate this sequence. Subsequence assignments containing gaps of more than one amino acid (up to 300 Da) or using mass correspondence outside the user-set error tolerance are reported only if better sequences cannot be found. The program then returns the full sequence made up of the highest scored subsequences. For both the 2.8- and 8.6-kDa proteins tested, this version of the algorithm provided the correct complete sequence.
Partial Gap Filling.
If the sequence gaps between golden sets are so large that the ECD/CAD data are insufficient to fill them, the subsequence attempted assignments from the golden set at each end are examined for possible additional assignments of neighboring amino acids. The scores for each amino acid assignment are halved; the reliability of these scoring values is poor because it has been tested only on the 12.4-kDa protein (see below).
Results and Discussion
Because FTMS instruments now available provide substantially better mass accuracy (39, 40, 45) than the 6-T instrument used here, sequence assignments were first attempted after ensuring that the ECD and CAD mass lists contained values correct to ± 1 ppm.
Ubiquitin (8.6 kDa, 76 aa).
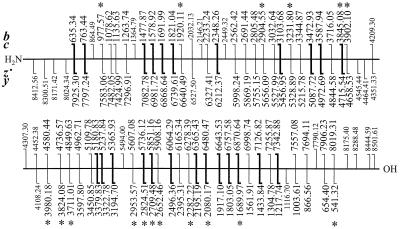
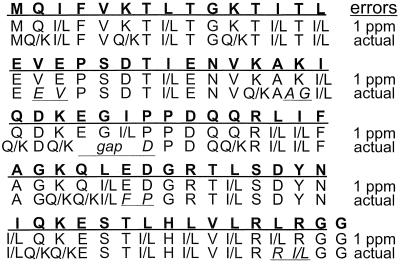
The program initially identified 57 c,z⋅, six a⋅,y, and six b,y complementary pairs and assigned 21 c,z⋅ pairs as golden by finding the associated y fragments. Two of the CAD b,y complementary pairs were identified as golden by comparison with the ECD masses, and 30 more could be assigned as golden sets from the mass differences versus the first 23 sets. Thus of 75 interresidue bonds (Fig. 1), 53 (70%) of these are assigned and ordered in the template. The gaps of ≈500 Da between the termini and the closest golden set reflect the lack of mass measurement below m/z 500, so that no complementary pair is possible near the termini. The largest other gap (Fig. 1) is 678 Da (c masses of 3902.11 to 4580.44), which corresponds to only 6 aa, with no other gap larger than 3 aa (313 Da). These gaps are filled (consistent with both terminal golden sets) by the remaining mass data (Fig. 2), and the sequence is predicted correctly (except Leu/Ile) by the program in less than 1 min. Seven of 11 gaps predict only the correct sequence, whereas scoring values for alternative subsequences of the remaining four gaps are 50–75% of the correct values.
Figure 1.
Mass values yielding the complete sequence for ubiquitin. Larger type are “golden” complementary sets; those with a bold vertical bar were identified by a complementary y mass. Mass values in italics are in error by >2 ppm. Values in smaller type completed gaps in the sequence.
Figure 2.
Correct (bold letters) and predicted sequences for ubiquitin without and with error correction. Underlined and italicized letters indicate incorrect predictions.
Melittin (2.8 kDa, 26 aa).
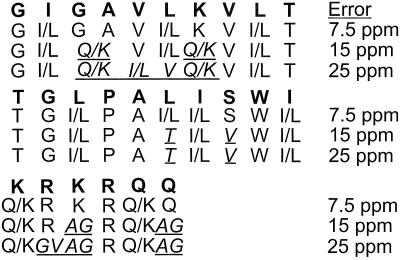
Ten c,z⋅ and four b,y complementary pairs were identified, leading to the determination of eight “golden” complementary sets. With a 15 ppm error tolerance, the full melittin sequence (except for I/L and Q/K) is predicted correctly (Fig. 3) in 3.5 min.
Figure 3.
Predicted sequences for melittin at different error tolerances.
Cytochrome c (12.4 kDa, 104 aa).
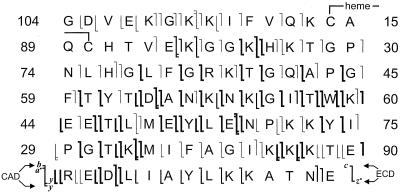
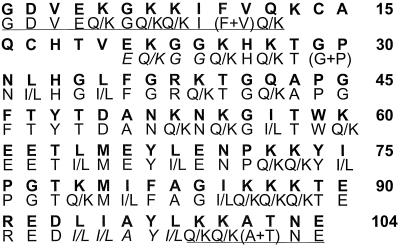
The region surrounding the heme could not be fragmented by ECD, possibly because of the heme's high H⋅ affinity (32, 35). The de novo algorithm found 52 c,z⋅, six a⋅,y, and nine b,y complementary pairs, with 29 c,z⋅ pairs as originally golden complementary sets; this was increased to 37 (bold vertical bars, Fig. 4) with a neighboring c,z⋅ or a⋅,y pair that could not be assigned in the other terminal region. Although these golden sets only bound the region of residues 24–93, the program without the final part for partial gap filling correctly predicts the Fig. 5 sequence for this region in 42 s. Only one gap (between G29 and P30) in this sequence is assigned originally as a doublet 29(G + P)30 and the ordering P29–G30 is unfavorable because the c28 fragment ion would be formed by cleavage on the N-terminal side of proline. Use of the algorithm extension for partial gap-filling added the correct assignments for I/L94–I/L98. However, no spectral data corresponded to cleavages in the four-residue region L100–N103, resulting in six incorrect assignments for L99–A101 from the unassigned N-terminal mass values. Extending the partial gap filling to start also from the gap C terminus added the E21–G24 assignment (Fig. 5, italics).
Figure 4.
Cytochrome c fragmentations (92/103 bonds cleaved), with golden sets indicated by bold vertical bars.
Figure 5.
Correct (bold letters) and predicted sequences for cytochrome c.
Another algorithm extension is to use ECD a⋅,y and CAD b,y complementary pairs for the original assignment of golden sets; this would add a⋅,y L7–L8 and b,y E21–L22, L22–G23, and L64–M65 as golden sets. Partial gap filling from L7–L8 now predicts the N-terminal sequence G1–Q12 with fair certainty, except that 10(F + V)11 is identified only as a doublet (Fig. 5, underlined). Partial gap filling from the E21–G23 extends the correct center prediction to E21–L99. A separate bird (47) spectrum of cytochrome c give b100 and b102 peaks; using these data (Fig. 5, underlined), the program returns the whole 104-residue sequence except the heme region L13–V20 and the doublet A101–T102 (which might be identified by starting the scans at m/z 250 instead of 500).
Ppm and 1-Da Mass Errors.
Distinguishing amino acids or their combinations can require high mass accuracy. For example, the masses of the Lys and Gln residues differ by 0.037 Da, as CH4 in the composition of Lys is substituted by O for Gln. Thus the ± 0.018-Da accuracy required for a 1.8-kDa fragment ion corresponds to 10 ppm mass accuracy, and that for a 9-kDa ion requires 2 ppm. Although the achievable accuracy decreases with peak signal/noise (S/N) levels, sub-ppm accuracy has been reported for FTMS instruments with ≥9.4-T magnetic fields accuracy (39, 40, 45).
The “1-Da error” is a second type of error peculiar to such high-resolution mass spectra. Ions of a specific composition yield a 1-Da spaced cluster of isotopic peaks resulting from multiple combinations of natural abundance isotopes. Sequencing uses the mass of the monoisotopic peak (all 1H, 12C, 14N, 16O, 32S) whose abundance will be ≈60% of that of the most abundant isotopic peak for a 3-kDa species. However, for larger ions of low S/N, the monoisotopic peak will not be observable (relative abundance only 2% for 10-kDa and 0.01% for 30-kDa species). thrash fits the abundances of the observable isotopic peaks to the predicted distributions to determine the most probable monoisotopic peak; thus at low S/N a 1-Da (actually 1.0023 Da) error is possible (44). One such erroneous mass value can lead to more than one incorrect residue prediction, such as differentiating the pair ordering Asn (114.04 Da)-Asp (115.03 Da) versus Asp-Asn. Of promise for future studies, a significant increase in S/N for the fragment ions can be achieved by the addition of external ion accumulation (48).
A great advantage of ECD is its unusual amount of fragment ion information. For a cytochrome c ECD spectrum used here, thrash (44) identified 386 isotopic clusters representing more than 2,100 peaks; obviously the S/N values of many of these will be marginal. To illustrate the effect of these errors, the actual data from our 6-T FTMS also will be used for the algorithm sequence prediction.
Effect of Errors on Sequencing.
The two ubiquitin ECD spectra have 645 isotopic clusters, of which 99 have been assigned masses by thrash that are incorrect by ± 1 Da, and four masses are actually ± 2 Da. However, most fragment ion species are represented by multiple charge states, and many of the same species are represented in both spectra used here; 87 of these erroneous masses also are represented by at least one correctly assigned mass. For these cases, any subsequence predictions that are incorrect should be accompanied by correct predictions.
The program found 57 c,z⋅, four a⋅,y, and four b,y complementary pairs. Of the c,z⋅ pairs, 19 were found to be golden because ECD y ions were found that resulted from cleavage between the same amino acids. Identification of neighboring pairs of the three types yielded 45 total golden complementary sets, but nine of these were removed because of incompatible mass differences caused by 1-Da errors. The remaining sets provide a template (Fig. 2) corresponding to 45% (36/75) of the ubiquitin sequence (the error-free data gave 70%). Using the data without error correction causes a much larger gap of 12 aa (c = 3716.05 to c = 4962.71). Using gap filling with the remaining sequence data, the program was able to predict correctly 65 of 76 aa of ubiquitin (Fig. 3). The error of the substitution of A + G for a Q/K is caused by the assignment of a fragment as arising from this Ala/Gly cleavage whose CAD mass is actually incorrect by 14 ppm (this nozzle-skimmer CAD spectrum of ubiquitin could be calibrated only to 15 ppm accuracy). This sequence prediction required ≈14 min; almost all of the additional time was required to generate the probable sequences in the largest gap in the middle of the protein.
The full melittin sequence is predicted correctly (Fig. 3) in 3.5 min with 15 ppm error tolerance. However, 5 aa are predicted incorrectly with a 30 ppm tolerance and seven for 50 ppm (Fig. 3). The effect of errors on the cytochrome c predictions were similar to the effects on the above examples.
The overall accuracy required by the algorithm in general can be met by the few ppm error limit possible for commercial 7-T FTMS instruments using careful calibration. The 1-Da error problem can be reduced by two or more ECD spectra run under different conditions, e.g., of electron current or extent of ion activation (36), or by external ion accumulation (48).
Extension to Modified Proteins.
Extending the algorithm to accommodate posttranslational or other modifications should be relatively straightforward, especially if other evidence restricts the type of modification expected, such as oxidation (49), phosphorylation, or glycosylation (50). Fortunately, ECD gives little cleavage of such side chains (far less than CAD) (50), so that the program also could incorporate ECD masses expected for modified amino acids, e.g., phosphorylation adds 80 Da to the Ser, Thr, and Tyr mass values. Similarly, the values of 0 and 18 for the golden N and C termini, respectively, could be extended with 42 and 17 to check for N-acetylation and C-amidation.
De Novo Sequencing of Larger Proteins.
Although activated ion ECD plus CAD can supply substantial sequence data directly from proteins as large as the 42-kDa thiaminase (36), the total data required are at least five times that used here for sequencing the 8.6-kDa protein. The alternative “top-down” methodology (26) uses proteolysis or MS/MS to generate 5- to 15-kDa fragments that cover the whole sequence. These pieces then are sequenced separately, hopefully as extensively as the examples shown here. The full sequence then is reconstructed by using sequence overlaps or the masses in the ECD and CAD spectra of the protein molecular ion to order these large fragments. For example, although thiaminase is a mixture of 379-, 380-, and 381-residue proteins (51), CAD produces 58 b,y fragments, such as the complementary pair of 8.8 (including peaks for the Ala and Ala + Gly heterogeneity)/33.4 kDa, with the latter represented by both a 10.9/22.5-kDa pair and a 18.8/14.5-kDa pair (51); limited proteolysis also gives extensive sequence coverage (52).
Conclusions
When sequence information (e.g., DNA) is available for an unknown protein, methods using simple MS instrumentation (1, 2, 7–11) should be used first. However, for erroneous, incomplete, or absent information, the ECD/CAD data from FTMS can now provide the full sequence of an 8.6-kDa protein without the need for proteolysis. Because FTMS has provided peptide molecular weight values from the proteolysis of <10-19 mol protein (53) and nine MS/MS fragment masses from 10-17 mol of a 29-kDa protein (30), it is conceivable that sufficient mass data for this algorithm could be obtained from even sub-fmol amounts of protein. The speed of both the thrash data reduction and this algorithm shows promise for high-throughput protein sequencing applications (conversion to C, which increased thrash speed by 10 times, should be tried here). Completion of the human genome sequence will greatly increase both the importance of identifying its expressed proteins and the values of sensitive, complementary, and reliable sequencing methods.
Acknowledgments
We are grateful to Barbara Baird, Tadhg Begley, Kathrin Breuker, Blas Cerda, Einar Fridriksson, Ying Ge, David Holowka, Helene Lavanant, Mark Lewis, and Ingemar Lindh for helpful discussions and to the National Institutes of Health (GM16609) for generous financial support.
Abbreviations
- MS/MS
tandem MS
- ECD
electron capture dissociation
- CAD
collisionally activated dissociation
- FTMS
Fourier transform MS
- ppm
parts per million
- S/N
signal/noise
References
- 1.Andersen J S, Svensson B, Roepstorff P. Nat Biotechnol. 1996;14:449–457. doi: 10.1038/nbt0496-449. [DOI] [PubMed] [Google Scholar]
- 2.Ducret A, Van Oostveen I, Eng J K, Yates J R, III, Aebersold R. Protein Sci. 1998;7:706–719. doi: 10.1002/pro.5560070320. [DOI] [PMC free article] [PubMed] [Google Scholar]
- 3.McLafferty F W, Fridriksson E K, Horn D M, Lewis M A, Zubarev R A. Science. 1999;284:1289–1290. doi: 10.1126/science.284.5418.1289. [DOI] [PubMed] [Google Scholar]
- 4.Kelleher N L. Chem Biol. 2000;7:R37–R45. doi: 10.1016/s1074-5521(00)00081-8. [DOI] [PubMed] [Google Scholar]
- 5.Karas M, Hillenkamp F. Anal Chem. 1988;60:2299–2301. doi: 10.1021/ac00171a028. [DOI] [PubMed] [Google Scholar]
- 6.Fenn J B, Mann M, Meng C K, Wong S F, Whitehouse C M. Science. 1989;246:64–71. doi: 10.1126/science.2675315. [DOI] [PubMed] [Google Scholar]
- 7.Henzel W J, Billeci T M, Stults J T, Wong S C, Grimley C, Watanabe C. Proc Natl Acad Sci USA. 1993;90:5011–5015. doi: 10.1073/pnas.90.11.5011. [DOI] [PMC free article] [PubMed] [Google Scholar]
- 8.James P, Quadroni M, Carafoli E, Gonnet G. Biochem Biophys Res Commun. 1993;195:58–64. doi: 10.1006/bbrc.1993.2009. [DOI] [PubMed] [Google Scholar]
- 9.Mann M, Hojrup P, Roepstorff P. Biol Mass Spectrom. 1993;22:338–345. doi: 10.1002/bms.1200220605. [DOI] [PubMed] [Google Scholar]
- 10.Pappin D J C, Hojrup P, Bleasby A J. Curr Biol. 1993;3:327–332. doi: 10.1016/0960-9822(93)90195-t. [DOI] [PubMed] [Google Scholar]
- 11.Yates J R, Speicher S, Griffin P R, Hunkapiller T. Anal Biochem. 1993;214:397–408. doi: 10.1006/abio.1993.1514. [DOI] [PubMed] [Google Scholar]
- 12.Mortz E, O'Connor P B, Roepstorff P, Kelleher N L, Wood T D, McLafferty F W, Mann M. Proc Natl Acad Sci USA. 1996;93:8264–8267. doi: 10.1073/pnas.93.16.8264. [DOI] [PMC free article] [PubMed] [Google Scholar]
- 13.Mann M, Wilm M. Anal Chem. 1994;66:4390–4399. doi: 10.1021/ac00096a002. [DOI] [PubMed] [Google Scholar]
- 14.Biemann K, Papayannopoulos I A. Acc Chem Res. 1994;27:370–378. [Google Scholar]
- 15.Chait B T, Wang R, Beavis R C, Kent S B H. Science. 1993;262:89–92. doi: 10.1126/science.8211132. [DOI] [PubMed] [Google Scholar]
- 16.Wilm M, Shevchenko A, Houthaeve T, Breit S, Schweigerer L, Fotsis T, Mann M. Nature (London) 1996;379:466–469. doi: 10.1038/379466a0. [DOI] [PubMed] [Google Scholar]
- 17.Shevchenko A, Chernushevich I, Ens W, Standing K G, Thomson B, Wilm M, Mann M. Rapid Commun Mass Spectrom. 1997;11:1015–1024. doi: 10.1002/(SICI)1097-0231(19970615)11:9<1015::AID-RCM958>3.0.CO;2-H. [DOI] [PubMed] [Google Scholar]
- 18.Hakansson K, Zubarev R, Hakansson P. Rapid Commun Mass Spectrom. 1998;12:705–711. doi: 10.1002/(SICI)1097-0231(19980615)12:11<705::AID-RCM212>3.0.CO;2-3. [DOI] [PubMed] [Google Scholar]
- 19.Reiber D C, Brown R S, Weinberger S, Kenny J, Bailey J. Anal Chem. 1998;70:1214–1222. doi: 10.1021/ac971158d. [DOI] [PubMed] [Google Scholar]
- 20.Loo J A, Udseth H R, Smith R D. Rapid Commun Mass Spectrom. 1988;2:207–210. [Google Scholar]
- 21.Gauthier J W, Trautman T R, Jacobsen D B. Anal Chim Acta. 1991;246:211–225. [Google Scholar]
- 22.Senko M W, Speir J P, McLafferty F W. Anal Chem. 1994;66:2801–2808. doi: 10.1021/ac00090a003. [DOI] [PubMed] [Google Scholar]
- 23.Little D P, McLafferty F W. J Am Soc Mass Spectrom. 1996;7:209–210. doi: 10.1016/1044-0305(95)00680-X. [DOI] [PubMed] [Google Scholar]
- 24.Chorush R A, Little D P, Beu S C, Wood T D, McLafferty F W. Anal Chem. 1995;67:1042–1046. doi: 10.1021/ac00102a004. [DOI] [PubMed] [Google Scholar]
- 25.Price W D, Williams E R. J Phys Chem A. 1997;101:8844–8852. doi: 10.1021/jp9722418. [DOI] [PMC free article] [PubMed] [Google Scholar]
- 26.Kelleher N L, Lin H Y, Valaskovic G A, Aaserud D J, Fridriksson E K, McLafferty F W. J Am Chem Soc. 1999;121:806–812. [Google Scholar]
- 27.Roth K D W, Huang Z-H, Sadagopan N, Watson J T. Mass Spectrom Rev. 1998;17:255–274. doi: 10.1002/(SICI)1098-2787(1998)17:4<255::AID-MAS1>3.0.CO;2-4. [DOI] [PubMed] [Google Scholar]
- 28.Patterson D H, Tarr G E, Regnier F E, Martin S A. Anal Chem. 1995;67:3971–3978. doi: 10.1021/ac00117a024. [DOI] [PubMed] [Google Scholar]
- 29.Shabanowitz J, Settlage R E, Marto J A, Christian R E, White F M, Russo P S, Martin S E, Hunt D F. In: Mass Spectrometry in Biology and Medicine. Burlingame A L, Carr S A, Baldwin M A, editors. Totowa, NJ: Humana; 2000. [Google Scholar]
- 30.Valaskovic G A, Kelleher N L, McLafferty F W. Science. 1996;273:1199–1202. doi: 10.1126/science.273.5279.1199. [DOI] [PubMed] [Google Scholar]
- 31.Zubarev R A, Kelleher N L, McLafferty F W. J Am Chem Soc. 1998;120:3265–3266. [Google Scholar]
- 32.Zubarev R A, Kruger N A, Fridriksson E K, Lewis M A, Horn D M, Carpenter B K, McLafferty F W. J Am Chem Soc. 1999;121:2857–2862. [Google Scholar]
- 33.Kruger N A, Zubarev R A, Horn D M, McLafferty F W. Int J Mass Spectrom. 1999;185/186/187:787–793. [Google Scholar]
- 34.Kruger N A, Zubarev R A, Carpenter B K, Kelleher N L, Horn D M, McLafferty F W. Int J Mass Spectrom Ion Proc. 1999;182/183:1–5. [Google Scholar]
- 35.Zubarev R A, Horn D M, Fridriksson E K, Kelleher N L, Kruger N A, Lewis M A, Carpenter B K, McLafferty F W. Anal Chem. 2000;72:563–573. doi: 10.1021/ac990811p. [DOI] [PubMed] [Google Scholar]
- 36.Horn, D. M., Ge, Y. & McLafferty, F. W. (2000) Anal. Chem., in press. [DOI] [PubMed]
- 37.Marshall A, Hendrickson C, Jackson G. Mass Spectrom Rev. 1998;17:1–35. doi: 10.1002/(SICI)1098-2787(1998)17:1<1::AID-MAS1>3.0.CO;2-K. [DOI] [PubMed] [Google Scholar]
- 38.Williams E R. Anal Chem. 1998;70:179A–185A. doi: 10.1021/ac981773x. [DOI] [PMC free article] [PubMed] [Google Scholar]
- 39.Shi S D-H, Hendrickson C L, Marshall A G. Proc Natl Acad Sci USA. 1998;95:11532–11537. doi: 10.1073/pnas.95.20.11532. [DOI] [PMC free article] [PubMed] [Google Scholar]
- 40.Bruce J E, Anderson G A, Wen J, Harkewicz R, Smith R D. Anal Chem. 1999;71:2595–2599. doi: 10.1021/ac990231s. [DOI] [PubMed] [Google Scholar]
- 41.Beu S C, Senko M W, Quinn J P, Wampler F M, McLafferty F W. J Am Soc Mass Spectrom. 1993;4:557–565. doi: 10.1016/1044-0305(93)85017-R. [DOI] [PubMed] [Google Scholar]
- 42.Wilm M, Mann M. Anal Chem. 1996;68:1–8. doi: 10.1021/ac9509519. [DOI] [PubMed] [Google Scholar]
- 43.Marshall A G, Want T-C L, Ricca T L. J Am Chem Soc. 1985;107:7893–7897. [Google Scholar]
- 44.Horn D M, Zubarev R A, McLafferty F W. J Am Soc Mass Spectrom. 2000;11:320–332. doi: 10.1016/s1044-0305(99)00157-9. [DOI] [PubMed] [Google Scholar]
- 45.Masselon C, Anderson G A, Harkewicz R, Bruce J E, Pasa-Tolic L, Smith R D. Anal Chem. 2000;72:1918–1924. doi: 10.1021/ac991133+. [DOI] [PubMed] [Google Scholar]
- 46.Keough T, Youngquist R S, Lacey M P. Proc Natl Acad Sci USA. 1999;96:7131–7136. doi: 10.1073/pnas.96.13.7131. [DOI] [PMC free article] [PubMed] [Google Scholar]
- 47.Price W D, Schnier P D, Williams E R. Anal Chem. 1996;68:859–866. doi: 10.1021/ac951038a. [DOI] [PubMed] [Google Scholar]
- 48.Senko M W, Hendrickson C L, Emmett M R, Shi S D H, Marshall A G. J Am Soc Mass Spectrom. 1997;8:970–976. [Google Scholar]
- 49.Schey K L, Finley E L. Acc Chem Res. 2000;33:299–306. doi: 10.1021/ar9800744. [DOI] [PubMed] [Google Scholar]
- 50.Mirgorodskaya E, Roepstorff P, Zubarev R A. Anal Chem. 1999;71:4431–4436. doi: 10.1021/ac990578v. [DOI] [PubMed] [Google Scholar]
- 51.Kelleher N L, Costello C A, Begley T P, McLafferty F W. J Am Soc Mass Spectrom. 1995;6:981–984. doi: 10.1016/1044-0305(95)00584-Z. [DOI] [PubMed] [Google Scholar]
- 52.Kelleher N L, Nicewonger R B, Begley T P, McLafferty F W. J Biol Chem. 1997;272:32215–32220. doi: 10.1074/jbc.272.51.32215. [DOI] [PubMed] [Google Scholar]
- 53.Belov M E, Gorshkov M V, Udseth H R, Anderson G A, Smith R D. Anal Chem. 2000;72:2271–2279. doi: 10.1021/ac991360b. [DOI] [PubMed] [Google Scholar]


