

Abstract
Background
Measuring genome size by flow cytometry assumes direct proportionality between nuclear DNA staining and DNA amount. By 1997 it was recognized that secondary metabolites may affect DNA staining, thereby causing inaccuracy. Here experiments are reported with poinsettia (Euphorbia pulcherrima) with green leaves and red bracts rich in phenolics.
Methods
DNA content was estimated as fluorescence of propidium iodide (PI)-stained nuclei of poinsettia and/or pea (Pisum sativum) using flow cytometry. Tissue was chopped, or two tissues co-chopped, in Galbraith buffer alone or with six concentrations of cyanidin-3-rutinoside (a cyanidin-3-rhamnoglucoside contributing to red coloration in poinsettia).
Key Results
There were large differences in PI staining (35–70 %) between 2C nuclei from green leaf and red bract tissue in poinsettia. These largely disappeared when pea leaflets were co-chopped with poinsettia tissue as an internal standard. However, smaller (2·8–6·9 %) differences remained, and red bracts gave significantly lower 1C genome size estimates (1·69–1·76 pg) than green leaves (1·81 pg). Chopping pea or poinsettia tissue in buffer with 0–200 µm cyanidin-3-rutinoside showed that the effects of natural inhibitors in red bracts of poinsettia on PI staining were largely reproduced in a dose-dependent way by this anthocyanin.
Conclusions
Given their near-ubiquitous distribution, many suspected roles and known affects on DNA staining, anthocyanins are a potent, potential cause of significant error variation in genome size estimations for many plant tissues and taxa. This has important implications of wide practical and theoretical significance. When choosing genome size calibration standards it seems prudent to select materials producing little or no anthocyanin. Reviewing the literature identifies clear examples in which claims of intraspecific variation in genome size are probably artefacts caused by natural variation in anthocyanin levels or correlated with environmental factors known to induce variation in pigmentation.
Key words: Anthocyanin, cyanidin-3-rutinoside, DNA staining inhibitors, Euphorbia pulcherrima, flow cytometry, genome size artefacts, nuclear DNA amount, genome plasticity
INTRODUCTION
Scientists have measured DNA amounts in plant cells and nuclei for over 50 years, developing a range of techniques to estimate relative or absolute genome sizes in different taxa (Bennett and Leitch, 2005a). In October 2005 the Plant DNA C-values Database gave values for 4427 angiosperms (Bennett and Leitch, 2005b). Today such 1C values vary by five orders of magnitude, from 0·07 pg (63 Mbp) in Genlisia margaretae (Greilhuber et al., 2006) to 127 pg (approx. 125 000 Mbp) in tetraploid Fritillaria assyriaca. Genome size variation is a key diversity character with important practical uses and many consequences (Bennett and Leitch, 2005a).
Early measurements used chemical methods (Sunderland and McLeish, 1961), and a first estimate based on ‘complete’ genome sequencing was published in 2000 (Arabidopsis Genome Initiative, 2000). Most genome size measurements, however, were made using photomicrodensitometry or flow cytometry, which involves binding a stain with nucleic acid, and assumes that such staining using the Feulgen reaction or a fluorochrome [e.g. propidium iodide (PI)] is proportional to nuclear DNA content and is generally constant for different cells, tissues and taxa (Bennett and Leitch, 2005c).
Measurements of genome size by all methods are subject to errors associated with the assumptions, techniques and instrumentation used to obtain them. Swift (1953) stated that chemical estimates were probably accurate to 10 or 20 %, and Bennett and Smith (1976) suggested that measurements in interspecific comparisons using Feulgen microdensitometry ‘are probably accurate to within 5–10 %’, although smaller differences in DNA amount are routinely detected in blind intraspecific comparisons'. The value of 125 Mbp given by the Arabidopsis Genome Initiative (2000), based partly on genome sequencing, was underestimated by about 25 % owing to incorrect assumptions about the sizes of unsequenced centromeric gaps (Hosouchi et al., 2002). Direct comparison with Caenorhabditis elegans (approx. 100 Mbp) showed it to be approx. 157 Mbp (0·16 pg) (Bennett et al., 2003). Clearly, attention to detail is still needed to improve the accuracy of published genome size measurements.
Breakdown in direct proportionality between nuclear DNA staining and DNA amount will increase error in the genome size estimates obtained. A systematic breakdown linked to any biotic or abiotic factor will generate artefactual variation in genome size estimates, which may be misinterpreted as intraspecific variation in genome size. Indeed, such variation may correlate with environmental characters, leading to reports of a plastic genome the size of which is claimed to vary in response to such characters or even to have adaptive significance. Detecting the existence and extent of pseudo-intraspecific variation in genome size and preventing or minimizing the phenomenon has received considerable attention (Greilhuber, 1988, 1998, 2005; Noirot et al., 2000, 2005; Price et al., 2000; Doležel and Bartos, 2005; Loureiro et al., 2006a,b, 2007; Walker et al., 2006; Greilhuber et al., 2007).
Intraspecific variation in nuclear genome size estimates by factors of 1·5–2·2 was reported for five gymnosperm taxa (Miksche, 1968, 1971; Dhir and Miksche, 1974). This was correlated with the latitude of origin of the seed, with a cline in DNA values increasing from south to north in the geographical range in three species (Dhir and Miksche, 1974). Later, Greilhuber (1986) showed that phenolic compounds present in the vacuoles of roots of many species (including Pinus) were mobilized by the fixation process, and could bind nuclear DNA in a process he termed ‘self-tanning’ (Greilhuber 1988), causing reduced Feulgen staining and pseudo-intraspecific nuclear DNA variation. This was greatly reduced, though not completely prevented, by fixation in formaldehyde rather than 1 : 3 methanol/acetic acid. Most of the variation previously reported by Miksche (1968) in Pinus glauca disappeared when fixation in formaldehyde was used (Teoh and Rees, 1976).
Greilhuber (1986, 1988) demonstrated the inhibitory effects on DNA staining by compounds such as endogenous tannins, and he noted that secondary metabolites such as high-molecular-weight polyphenolics and even low-molecular-weight phenolic substances such as quercetin can reduce the intensity of Feulgen staining in plants (Greilhuber, 1988, 1997). By 1997 it had become more widely recognized that secondary metabolites may affect DNA staining in plants, causing inaccurate genome size estimates. Indeed, following Doležel (1991) the phenomenon was noted as a key potential problem at the 1997 Angiosperm Genome Size Workshop and Discussion Meeting by Doležel, and in derived papers by Greilhuber (1998) and in Helianthus annuus (sunflower) by Price et al. (1998).
Some intraspecific variation in genome size, termed ‘orthodox’ by Greilhuber (1998), is real and expected, e.g. when it reflects karyotypic variation in the number and size of chromosomes, or of heterochromatic segments, visible under the light microscope (e.g. differences in knob number in maize). However, many examples of intraspecific variation in estimates with no obvious cytological basis have been reported. These, termed ‘unorthodox’ by Greilhuber (1998), have often been uncritically or prematurely accepted as genuine, without considering alternative explanation(s) adequately.
In Helianthus annuus up to 60 % intraspecific genome size variation was reported by three groups using Feulgen microspectrophotometry (Nagl and Capesius, 1976; Olszewska and Osiecka 1983; Cavallini et al., 1986, 1989), and later up to 250 % by two groups using flow cytometry with PI (Arumuganathan and Earle, 1991; Michaelson et al., 1991). Johnston et al. (1996) and Price and Johnston (1996) reported that the large variation (up to 250 %) appeared to change during development in response to light quality and quantity. Both used either barley or pea calibration standards, which were processed and stained independently before being added to the sunflower samples. Later, Price et al. (2000) found that simultaneous processing of samples from the target and the standard species was necessary to obtain reliable DNA estimates. Price et al. (2000) also showed that leaves of H. annuus have unidentified compounds that interfere with PI intercalation and/or fluorescence, but they did not speculate on the identity of the secondary compounds, which acted as DNA staining inhibitors.
Noirot et al. (2000) noted discrepancies of 2–20 % in nuclear DNA content using mixed and unmixed extracts of several plant species combinations (target/standard). They suggested that this may be because cytosolic compounds affect dye accessibility, and they noted that improved best practice could decrease, but not eliminate, stoichiometric error. Noirot et al. (2003) subsequently showed that two important compounds present in Coffea spp. (caffeine and chlorogenic acid) modified accessibility of the dye PI to Petunia DNA, and suggested that these compounds could be responsible for pseudo-intraspecific genome size variation, including environmental variation. They noted that chlorogenic acid had a negative effect on nuclear fluorescence. Chlorogenic acid is also present in H. annuus (Koeppe et al., 1976) and is known to be environment-dependent, and this may explain environmental variations in genome size estimations in H. annuus. Moreover, as chlorogenic acid belongs to the large family of phenolic plant substances biosynthesized by the phenylpropanoid pathway, all within-species variations in genome size estimations must be interpreted carefully. Even when the plants are grown in the same environment, polymorphism of the regulatory genes of the phenylpropanoid pathways may lead to pseudo-variation in genome size.
Walker et al. (2006) reported true intraspecific variation in nuclear DNA contents for the legume Bituminaria bituminosa populations, made by flow cytometry, but also noted that estimates of nuclear DNA made using leaves collected in August (summer, average maximum daily temperature 35–36 °C) were significantly lower (by between 3·8 and 7·4 %) than those obtained in December (winter, average maximum daily temperature 18–23 °C). They suggested that this environmentally induced (artefactual) variation within populations, with apparent decreases in summer, may have been due to interference from leaf furanocoumarins, which are known to accumulate to a greater extent at higher temperatures.
Recently, Loureiro et al. (2006b) showed a strong effect of tannic acid in four isolation buffers on relative fluorescence intensity of PI-stained nuclei of Pisum sativum and Zea mays. Furthermore, they showed for the first time that a cytosolic compound can change light scattering properties of particles in a tissue homogenate, a phenomenon termed the ‘tannic acid effect’. However, such effects differed in extent between species as P. sativum nuclei exhibited a greater decrease in fluorescence intensity than those of Z. mays.
Here we report experiments with poinsettia (Euphorbia pulcherrima, Euphorbiaceae), a plant rich in phenolics with green leaves and strikingly pigmented red bracts. The aims were to test (1) if poinsettia has compounds that interfere with PI fluorescence; and, if so, whether (2) the level of DNA PI staining inhibitors differs between green leaves and red bracts; (3) the compounds which inhibit PI staining of DNA in poinsettia have a similar effect on nuclei from pea leaves simultaneously processed with poinsettia tissues; (4) the effect of natural DNA PI inhibitors in red poinsettia bracts can be reproduced, in a dose-dependent way, in PI-stained nuclei of the green leaves of poinsettia and pea, by including one anthocyanin found in poinsettia leaves in the chopping buffer.
MATERIALS AND METHODS
Plant materials and cultivation
Mature, healthy plants of Euphorbia pulcherrima were used. Initially, two potted plants with dark green leaves and striking red bracts were used, the varietal identity of which was unknown. Such plants are grown in large numbers, especially for the Christmas season, along with other cultivars with bracts of different pigmentation phenotypes such as pink or white (Stewart and Arisumi, 1966). Euphorbia pulcherrima develops the striking and attractive coloration in bracts around the flowers only in plants grown under short day conditions. Later experiments used aerial material from eight mature plants of each of two varieties of E. pulcherrima (‘Winter Rose’ and ‘Carousel’). Both had dark green leaves and striking red bracts, and were kindly donated by Ellisons Greenhouse (Brenham, TX, USA). Red coloration in poinsettia bracts is caused by anthocyanins, and the main compounds responsible include cyanidin-3-glucoside and cyanidin-3-rhamnoglycoside (Stewart and Arisumi, 1966). As cyanidin-3-rutinoside is a cyanidin-3-rhamnoglucoside and is available commercially, this pigment was used in the experiments here.
Experiments were conducted on two days in January 1999 (days 1 and 2) and seven days in January–February 2000 (days 3–9), with one to four (but usually three) replicates for each material and/or treatment per day. Samples are listed according to day number (first) and replicate number (second) in Tables 1–4 (e.g. sample 7·3 is day 7 replicate 3).
Table 1.
Mean red fluorescence (channel number) of PI-stained 2C nuclei of pea leaf and of green leaf and red bract of poinsettia measured alone using an unknown variety on days 1–3 and known varieties on days 4–9
| Material |
Ratio |
|||||
|---|---|---|---|---|---|---|
| Poinsettia |
||||||
| Day and replicate | Pea | Leaf | Bract | Leaf/pea | Bract/pea | Leaf/bract |
| 1·1 | 826·3 | 255·7 | 130·9 | 0·309 | 0·158 | 1·953 |
| 2·1 | 767·8 | 260·1 | 158·1 | 0·339 | 0·206 | 1·645 |
| 3·1 | 764·9 | 235·1 | 177·5 | 0·307 | 0·232 | 1·325 |
| 3·2 | 782·8 | 245·3 | 161·9 | 0·313 | 0·207 | 1·515 |
| 3·3 | 782·3 | 278·6 | 202·0 | 0·356 | 0·258 | 1·379 |
| 3·4 | 790·5 | 274·0 | 185·6 | 0·347 | 0·235 | 1·476 |
| Mean | 785·8 ± 9·0 | 258·1 ± 6·8 | 169·3 ± 10·1 | 0·329 ± 0·009 | 0·216 ± 0·014 | 1·549 ± 0·093 |
| 4·1 | 772·4 | 294·1 | 224·6 | 0·381 | 0·291 | 1·309 |
| 4·2 | 806·9 | 265·0 | 219·5 | 0·328 | 0·272 | 1·207 |
| 4·3 | 719·3 | 265·1 | 224·8 | 0·369 | 0·313 | 1·179 |
| 6·1 | 800·9 | 263·6 | 179·2 | 0·329 | 0·224 | 1·471 |
| 6·2 | 842·5 | 292·1 | 215·9 | 0·347 | 0·256 | 1·353 |
| 6·3 | 810·1 | 287·7 | 208·6 | 0·355 | 0·257 | 1·379 |
| 7·1 | 780·5 | 285·6 | 220·8 | 0·366 | 0·283 | 1·293 |
| 7·2 | 795·7 | 284·1 | 214·4 | 0·357 | 0·269 | 1·325 |
| 7·3 | 793·0 | 288·5 | 245·4 | 0·364 | 0·309 | 1·178 |
| 8·1 | 794·0 | 277·7 | 234·6 | 0·350 | 0·295 | 1·184 |
| 8·2 | 817·8 | 283·1 | 223·8 | 0·346 | 0·274 | 1·265 |
| 8·3 | 850·4 | 304·2 | 234·1 | 0·358 | 0·275 | 1·299 |
| Mean | 798·6 ± 9·8 | 282·6 ± 3·7 | 220·5 ± 4·7 | 0·351 ± 0·004 | 0·281 ± 0·007 | 1·249 ± 0·026 |
| Overall mean* | 794·3 ± 7·3 | 274·4 ± 4·2 | 203·4 ± 7·3 | 0·346 ± 0·005 | 0·256 ± 0·009 | 1·374 ± 0·045 |
Mean values are given with the standard deviation.
* Overall means are all significantly different (P < 0·001).
Note, the poinsettia/pea ratio for green leaf is 0·346 and for red bract 0·256 with a mean of 0·301. The mean gives a DNA amount for poinsettia of 4C = 5·85 pg (1C = 1·46), unlike the figure for green leaf alone given in Bennett et al. (2000) of 4C = 6·6 pg (1C = 1·65), assuming Pisum sativum ‘Minerva Maple’ 4C = 19·46 pg (1C = 4·87) (Bennett and Smith, 1976). The genome size obtained using the above data for green leaf is 4C = 6·73 pg (1C = 1·68), compared with 4·98 pg (1 C = 1·25) obtained using red bract, a significant difference (P < 0·001) of 35·1 %.
Examination of root-tip cells using the enzyme digestion method of Jewell and Islam-Faridi (1994) gave a chromosome count in the original plant with red bracts of 2n = 28, which is taken to be a tetraploid. As the poinsettia/pea ratio of PI staining was similar (approx. 0·350 : 1) later plants were probably also tetraploids (Table 1). Plants were maintained at room temperature (20 ± 5 °C) standing on a window sill with natural daylight (11–12 h), and watered daily. Plants of pea, Pisum sativum ‘Minerva Maple’ (2n = 2x = 14) were grown one per pot in a growth chamber with 14-h days at 25 °C and 10-h nights at 20 °C with fluorescent and incandescent light, and watered daily. Hereafter, P. sativum is referred to as pea and E. pulcherrima as poinsettia.
Nuclear isolation, staining and flow cytometry
Leaf and/or bract tissue was chopped manually, using a new one-sided razor blade for each sample, in 1 mL of ice-cold chopping buffer (Galbraith et al., 1983), pH 7·2 [either alone (zero anthocyanin) or with one of six known concentrations of anthocyanin], to release nuclei as described by Johnston et al. (1999). Chopping buffer contained boiled ribonuclease A at a concentration of 1 mg L–1. The suspension was filtered through a 53-μm nylon mesh to recover 1 mL, which was kept on ice.
For pea, one turgid, still expanding leaflet, about 15–20 mm in length, was used as a replicate. For poinsettia, a part of a still expanding leaf or bract about 15–20 mm square was used as a replicate. When material from two tissues or species was co-chopped, care was usually taken to co-chop both items simultaneously (with one placed on top of the other). However, in a few cases red and green tissue from poinsettia were placed together in chopping medium in one dish, and the order of chopping of the two tissues in Galbraith solution was varied, and noted for each dish (see Table 3), to test if this was important.
Table 3.
Mean red fluorescence (channel number) of PI-stained 2C nuclei of green leaf and red bract of poinsettia and leaf of pea measured either alone or in mixtures (on two days in 2000), which were ‘co-chopped’ sequentially in a known order rather than simultaneously
| Material |
||||
|---|---|---|---|---|
| Alone |
Mixtures of poinsettia green leaf and red bract |
|||
| Poinsettia |
||||
| Day and replicate | Leaf | Bract | Leaf first, bract second | Bract first, leaf second |
| 2·1 | 260·1 | 158·1 | 239·1 | 155·1 |
| 5·1 | 259·3 | 160·4 | 236·7 | 170·4 |
| 5·2 | 271·6 | 174·2 | 206·7 | 168·4 |
| 5·3 | 253·5 | 141·2 | 239·2 | 145·6 |
| Mean | 261·1 ± 3·8a | 158·5 ± 6·8b | 230·4 ± 7·9c | 159·9 ± 5·8b |
Mean values are given with s.d.
Means with different letters are significantly different (P < 0·01).
Immediately after chopping, PI was added to samples to a final concentration of 50 µg mL−1, and nuclei were stained or co-stained in the dark at 4 °C for 1–12 h, or (for one sample) 30 h. The mean fluorescence of nuclei (usually about 5000 per sample) was quantified using a Coulter Epics Elite flow cytometer (Coulter Electronics, Hialeah, FL, USA) equipped with a water-cooled laser tuned at 514 nm and 500 mW. Fluorescence at >615 nm was detected by a photomultiplier screened by a long-pass filter.
Preparation of cyanidin-3-rutinoside chloride solutions
Ten-milligram samples of cyanidin-3-rutinoside (relative molecular weight 631) were obtained from AApin Chemicals Ltd, Abingdon, UK. An approx. 200 mm stock solution was made by dissolving 2·5 mg in 2 mL of Galbraith chopping buffer (Galbraith et al., 1983). Various less concentrated solutions were made as needed by dilution. Solutions at 200, 20 and 2 µm were bright dark red, dark pink and light pink, respectively, whereas Galbraith solution with no added anthocyanin was colourless. Typical concentrations of anthocyanin in vacuoles or (much lower) in cytoplasms and nuclei in vivo are unknown (R. Grayer, pers. comm.). Nevertheless, the above solutions match the appearance of a range of anthocyanin solutions commonly seen in vacuoles of living plant cells.
Statistical tests
All data collected were analysed by analysis of variance (ANOVA) using SAS-GLM procedures (SAS Institute, Cary, NC, USA). Scheffe's test was used for all post-hoc comparisons among all pairwise combinations of fluorescence measurements and all concentration effects. Ratios of sample and standard fluorescence were root transformed prior to analysis.
RESULTS
DNA PI staining inhibitors in poinsettia
On comparing PI-stained 2C nuclei from green leaf and red bract tissue, a large difference between the fluorescence was observed. In early comparisons mean fluorescence for green leaves (258·1 ± 6·8) was much higher (52·5 %) than for red bracts (169·3 ± 10·1), and significantly so (P < 0·0001) (Table 1). A similar difference was repeated in comparisons using new plants (Table 1) for which the mean fluorescence for green leaves (282·6 ± 3·7) was 28·1 % higher than for red bracts (220·5 ± 4·7). This difference was again significant (P < 0·0001). The direction of the difference was consistent as fluorescence for green leaves always exceeded that for red bracts (e.g. Fig. 1A, B), but its extent was highly variable, ranging from 18 to 95 % (average 35·1%) for comparisons made on different plants and/or days (Table 1).
Fig. 1.
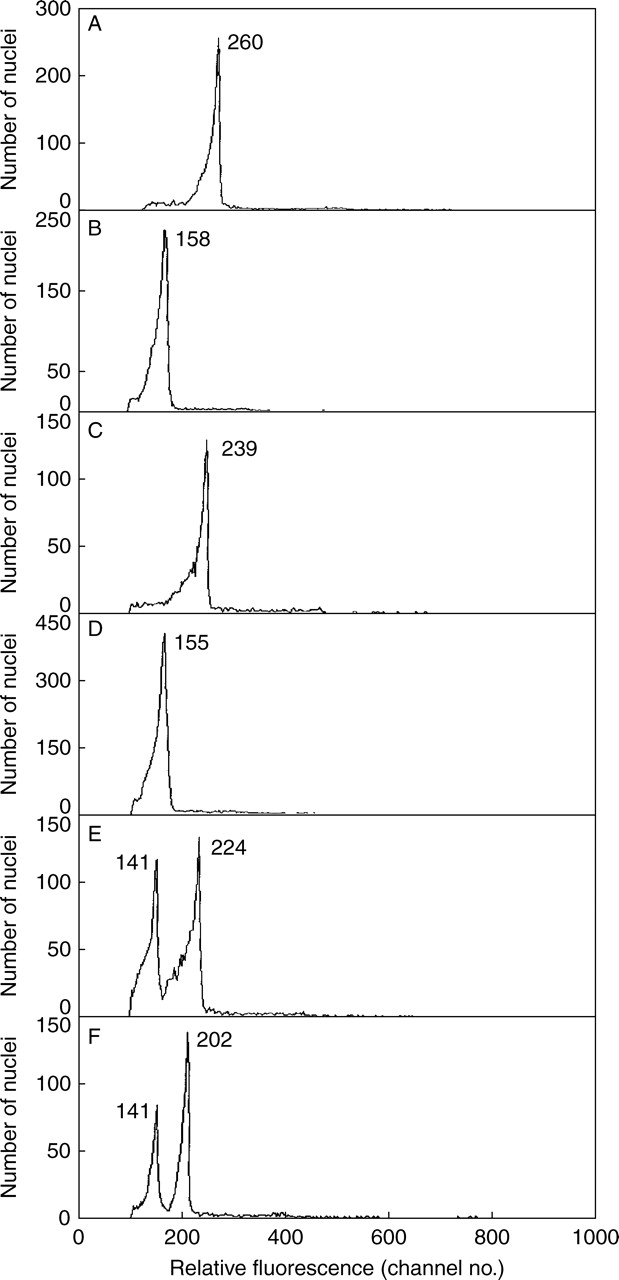
Relative DNA staining in nuclei from green leaf (A) or red bract tissue (B) of Euphorbia pulcherrima chopped alone, or in ‘co-chopped’ mixtures processed in the order green leaf first and red bract second (C), red bract first and green leaf second (D), or when samples C and D were combined and run immediately after (E), or run 2 h later (F). The mean relative absorbance for nuclei in each peak is given.
The above results may indicate a real difference in nuclear DNA amount between green and red tissues on the same branch, or that red bracts contain compounds which inhibit PI staining (and fluorescence) and generate pseudo-intraspecific variation. To resolve this, a pea leaflet was included as an internal standard. In comparisons using the two original plants, results for 2C nuclei (Table 2) showed that: (1) the pea peak was significantly lower (P < 0·0001) for pea co-chopped with either green (728·1 ± 9·3) or red (582·9 ± 2·7) poinsettia tissues than for pea chopped alone (789·4 ± 10·1) (Fig. 2A–C); (2) the pea peak was significantly lower (P < 0·001) (26 %) when co-chopped with red poinsettia bract (582·9 ± 2·7) than with green leaf tissue (728·1 ± 9·3) (8 %); (3) despite these major shifts in peak positions, the mean ratios (co-chopped poinsettia/pea) for green (0·372 ± 0·008) and red (0·348 ± 0·005) tissues were similar (Table 2); and (4) there was still a small (approx. 6·9 %) difference (P < 0·05) between the ratios for green and red tissues. Using red bract tissue gave a significantly lower 1C genome size estimate for poinsettia (1·69 pg) than for green leaf tissue (1·81 pg), despite including pea as internal calibration standard for both.
Table 2.
Mean red fluorescence (channel number) of PI-stained 2C nuclei of green leaf and red bract of poinsettia and leaf of pea measured either alone or in co-chopped mixtures using an unknown variety on day 1 and known varieties on days 4–8
| Material |
||||||||||
|---|---|---|---|---|---|---|---|---|---|---|
| Alone |
Co-chopped mixtures |
Ratio |
||||||||
| Poinsettia |
Pea + Poinsettia |
Pea + Poinsettia |
||||||||
| Day and replicate | Pea | Leaf | Bract | Poinsettia, Leaf + Bract | Pea | Leaf | Pea | Bract | Pea/leaf | Pea/bract |
| 1·1 | 826·3 | 255·7 | 130·9 | – | 763·0 | 262·5 | 572·9 | 189·2 | 0·344 | 0·330 |
| 3·1 | 764·9 | 235·1 | 177·5 | – | 707·1 | 272·6 | 582·2 | 201·9 | 0·386 | 0·347 |
| 3·2 | 782·8 | 245·3 | 161·9 | – | 725·6 | 282·0 | 587·6 | 211·2 | 0·389 | 0·359 |
| 3·3 | 782·3 | 278·6 | 202·0 | – | 722·3 | 271·3 | 585·8 | 207·9 | 0·376 | 0·355 |
| 3·4 | 790·5 | 274·0 | 185·6 | – | 722·7 | 263·7 | 586·1 | 205·5 | 0·365 | 0·351 |
| Mean | 789·4 ± 10·1 | 257·7 ± 8·3 | 171·6 ± 12·1 | – | 728·1 ± 9·3 | 270·4 ± 3·5 | 582·9 ± 2·7 | 203·1 ± 3·8 | 0·372 ± 0·008 | 0·348 ± 0·005 |
| 4·1 | 772·4 | 294·1 | 224·6 | 216·2 | 760·4 | 277·4 | 691·3 | 248·2 | 0·365 | 0·359 |
| 4·2 | 806·9 | 265·0 | 219·5 | 195·6 | 755·5 | 289·0 | – | – | 0·383 | – |
| 4·3 | 719·3 | 265·1 | 224·8 | 165·9 | 762·3 | 282·7 | 725·7 | 265·9 | 0·371 | 0·366 |
| 6·1 | 800·9 | 263·6 | 179·2 | 246·5 | 758·4 | 285·9 | 696·3 | 259·9 | 0·377 | 0·373 |
| 6·2 | 842·5 | 292·1 | 215·9 | 232·2 | 737·8 | 272·9 | 635·3 | 228·9 | 0·370 | 0·360 |
| 6·3 | 810·1 | 287·7 | 208·6 | 246·6 | 791·3 | 297·7 | 765·1 | 281·0 | 0·376 | 0·367 |
| 7·1 | 780·5 | 285·6 | 220·8 | 223·9 | 724·1 | 262·3 | 619·4 | 218·9 | 0·362 | 0·353 |
| 7·2 | 795·7 | 284·1 | 214·4 | 226·8 | 764·4 | 284·8 | 661·0 | 233·6 | 0·373 | 0·353 |
| 7·3 | 793·0 | 288·5 | 245·4 | 242·7 | 778·0 | 287·0 | 787·3 | 287·1 | 0·369 | 0·365 |
| 8·1 | 794·0 | 277·7 | 234·6 | 249·7 | 816·7 | 306·3 | 691·5 | 251·1 | 0·375 | 0·363 |
| 8·2 | 817·8 | 283·1 | 223·8 | 240·2 | 717·1 | 261·4 | 659·6 | 238·8 | 0·365 | 0·362 |
| 8·3 | 850·4 | 304·2 | 234·1 | 230·1 | 789·9 | 295·9 | 664·3 | 240·0 | 0·375 | 0·361 |
| Mean | 798·6 ± 9·8 | 282·6 ± 3·7 | 220·5 ± 4·7 | 226·4 ± 7·1 | 763·0 ± 8·2 | 283·6 ± 3·9 | 690·6 ± 15·6 | 250·3 ± 6·5 | 0·372 ± 0·002 | 0·362 ± 0·002 |
| Overall mean* | 795·9 ± 7·4 | 275·3 ± 4·4 | 206·1 ± 7·3 | 226·4 ± 7·1 | 752·3 ± 7·4 | 279·7 ± 3·3 | 657·0 ± 16·7 | 235·6 ± 7·2 | 0·372 ± 0·003 | 0·358 ± 0·002 |
* Overall means are all significantly different (P < 0·001). Mean values are given with the standard deviation.
Note, the poinsettia/pea ratio for green leaf is 0·372 and for red bract 0·358 with a mean of 0·365. The mean gives a DNA amount for poinsettia of 4C = 7·10 pg (1C = 1·76), close to the figure given previously in Bennett et al. (2000) of 4C = 6·6 pg (1C = 1·65 pg), assuming Pisum sativum ‘Minerva Maple’ 4C = 19·46 pg (1C = 4·87) (Bennett and Smith, 1976). The genome size obtained using green leaf is 4C = 7·23 pg (1C = 1·81), compared with 7·04 pg (1 C = 1·74) obtained using red bract, a significant difference (P < 0·001) of 4·0 %.
Fig. 2.
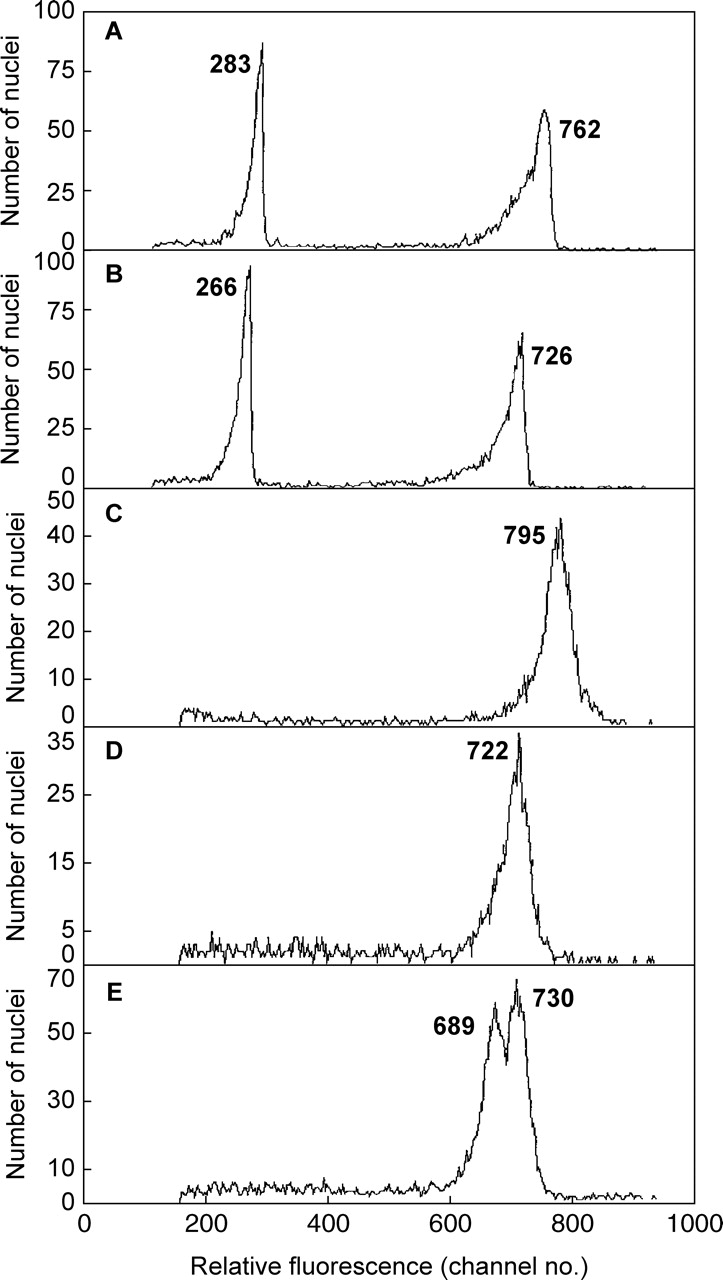
Relative DNA staining in 2C nuclei of Pisum sativum co-chopped with green leaf (A) or red bract tissue (B) of Euphorbia pulcherrima and of Pisum sativum suspended in Galbraith buffer with no added anthocyanin (C), or with 200 µm of added cyanidin-3-rutinoside (D), or (E) after stained nuclei of C and D were mixed. The mean relative absorbance for nuclei in each peak is given.
These results were repeated in a larger replicated experiment using different plants (Table 2) in which (1) the pea peak was significantly lower (P < 0·001) when co-chopped with either green (763·0 ± 8·2) or red (690·6 ± 15·6) poinsettia tissues than when chopped alone (798·6 ± 9·8), (2) the pea peak was significantly lower (P < 0·001) when co-chopped with red poinsettia bract (690·6 ± 15·6) (13·5 %) than with green leaf tissue (763·0 ± 8·2) (8·6 %), (3) the mean ratios (co-chopped poinsettia/pea) for green (0·372 ± 0·002) and red (0·362 ± 0·002) tissues were similar (Table 2), and (4) the red bract 1C genome size estimate for poinsettia (1·76 pg) was lower than for green leaf (1·81 pg)–a significant difference (P < 0·001) of 2·8 %. The results for all plants in Table 2 show that the mean ratios (co-chopped poinsettia/pea) for green (0·372 ± 0·002) and red (0·358 ± 0·002) tissues were similar, but overall the red bract estimate of the 1C genome for poinsettia (1·74 pg) was lower than for green leaf (1·81 pg)–a significant difference (P < 0·001) of 3·9 %.
As both red bract and green leaf of poinsettia reduce DNA staining in pea nuclei, but to different degrees, we also questioned what effect they might have on each other. Thus, tissue from red bracts and green leaves of poinsettia was co-chopped to see if two peaks or one were obtained, and if the latter, would one tissue have a major effect? In all cases (Table 2, column 4; Fig. 1C, D) one 2C peak was obtained when tissue with different pigmentation was co-chopped, but with a dominant effect of the red tissue. Thus, fluorescence for co-chopped red bract and green leaf tissue (226·4 ± 7·1) was generally much closer to that seen when red bract was chopped alone (220 ± 4·7) than green leaf alone (282·6 ± 3·7). This suggested that the factors responsible for inhibiting DNA staining were more present or active in red bracts than in green leaves of poinsettia.
How red and green tissues were co-chopped was also important. Although red and green tissue were placed together in chopping medium in one dish, in practice one was chopped before the other in early tests. We suspected that differences in the PI staining obtained reflected whether green or red tissue was ‘co-chopped’ first. The order of chopping the two tissues in Galbraith solution was varied, and noted for each dish, in a small test. The results (Table 3) confirmed that the level of PI staining obtained was strongly influenced by the order of ‘co-chopping’. Thus, values were always closer to those expected had the tissue co-chopped first been chopped alone (261·1 ± 3·8 for green chopped alone and 158·5 ± 6·8 for red chopped alone). Green chopped first was 230·4 ± 7·9 (Fig. 1C), but lower if chopped second (159·9 ± 5·8) (Fig. 1D). All differences were significant (P < 0·001).
Thus, the tissue chopped first produced an effect on some condition(s) of the chopping solution that can strongly affect the amount of PI staining in nuclei released by processing from the tissue chopped second. An unreplicated test which mixed PI-stained nuclei of green leaf stained alone, with others stained after ‘co-chopping’ with red bract chopped first, showed a double peak when run immediately (Fig. 1E). This persisted 2 h later, although with some reduction in mean fluorescence for nuclei from green leaf, but not for those from red bract (Fig. 1F). Thus, the ability of PI to stain nuclear DNA is largely set by conditions in the chopping solution immediately after their release at chopping before PI is added, and it is not easily or quickly altered by subsequent change in those conditions. Thus, it is important to co-chop the tissues simultaneously, and this was achieved by placing them one on top of the other. Clearly, factors affect nuclei from both tissues in co-chopped comparisons, but may not affect them equally. This raised questions concerning the nature of those factor(s), and their mode of action. As effects on nuclei by chemical inhibitors seemed a likely cause, it was decided to test the effect of a simple anthocyanin on PI staining in pea and poinsettia, and cyanidin-3-rutinoside was selected because it occurs at high concentration in poinsettia leaves.
Anthocyanin inhibits PI staining
Treatments with varying anthocyanin concentration showed clear effects on PI staining of cyanidin-3-rutinoside with significant (P < 0·001) inhibition in pea and poinsettia with increasing and/or high concentration (Table 4). Moreover, the extent of the inhibition obtained using anthocyanin was similar to, and within the range of, inhibition observed when corresponding tissues were co-chopped with red bract tissue of poinsettia. For example, chopping pea in 200 µm anthocyanin produced 63·6 % of the inhibition caused by natural compounds in red poinsettia bract tissue, whereas chopping green poinsettia leaf tissue with 200 µm anthocyanin produced 83·8 % of the inhibition caused by red bract tissue. Treatment with 2 µm anthocyanin had little or no inhibitory effect on PI staining in nuclei, compared with the control without added anthocyanin. Treatments with 20 µm anthocyanin significantly reduced the staining of pea (P < 0·01) and green poinsettia leaf (P < 0·01), but not of the red bract tissue. Treatment with 200 µm anthocyanin significantly reduced the staining of pea, poinsettia leaf and red bract tissue (P < 0·001).
Table 4.
Mean red fluorescence (channel number) of PI-stained 2C nuclei of green leaf and red bract poinsettia and leaf of pea chopped in buffer with low (2 µm), medium (20 µm) or high (200 µm) cyanidin-3-rutinoside, or with no added anthocyanin (zero)
| Concentration of cyanidin-3-rutinoside (μm) |
|||||
|---|---|---|---|---|---|
| Material | Day and replicate | 0 | 2 | 20 | 200 |
| Pea | 6·1 | 800·9 | 803·5 | 761·4 | 730·7 |
| 6·2 | 842·5 | 855·8 | 833·0 | 769·3 | |
| 6·3 | 810·1 | 883·6 | 824·2 | 763·7 | |
| 7·1 | 780·5 | 795·2 | 749·7 | 733·5 | |
| 7·2 | 795·7 | 798·6 | 766·7 | 736·7 | |
| 7·3 | 793·0 | 781·7 | 770·3 | 729·0 | |
| 8·1 | 794·0 | 820·2 | 821·2 | 778·0 | |
| 8·2 | 817·8 | 855·1 | 835·0 | 728·5 | |
| 8·3 | 850·4 | 789·6 | 749·1 | 702·3 | |
| 9·1 | 909·5 | 890·5 | 893·9 | 820·3 | |
| 9·2 | 886·3 | 863·1 | 839·7 | 796·3 | |
| Mean | 825·5 ± 12·6 | 830·6 ± 12·0 | 804·0** ± 14·2 | 753·5*** ± 10·6 | |
| Poinsettia, green leaf | 4·1 | 294·1 | 257·5 | 251·7 | 232·4 |
| 4·2 | 265·0 | 268·5 | 246·7 | 220·2 | |
| 4·3 | 265·1 | 265·6 | 252·1 | 203·8 | |
| 6·1 | 263·6 | 263·0 | 253·0 | 240·5 | |
| 6·2 | 292·1 | 273·3 | 270·4 | 229·9 | |
| 6·3 | 287·7 | 254·0 | 284·3 | 244·5 | |
| 7·1 | 285·6 | 295·6 | 249·9 | 234·4 | |
| 7·2 | 284·1 | 277·6 | 277·5 | 240·6 | |
| 7·3 | 288·5 | 290·7 | 282·4 | 242·7 | |
| 8·1 | 277·7 | 297·8 | 274·6 | 239·0 | |
| 8·2 | 283·1 | 289·3 | 277·2 | 257·1 | |
| 8·3 | 304·2 | 314·3 | 314·6 | 267·9 | |
| 9·1 | 296·3 | 299·2 | 285·9 | 242·2 | |
| 9·2 | 304·1 | 314·0 | 289·0 | 237·4 | |
| Mean | 285·1 ± 3·6 | 282·9 ± 5·3 | 272·1* ± 5·2 | 238·0*** ± 4·0 | |
| Poinsettia, red bract | 4·1 | 224·6 | 215·1 | 210·0 | 154·0 |
| 4·2 | 219·5 | 213·1 | 213·9 | 168·1 | |
| 4·3 | 224·8 | 221·2 | 211·3 | 145·3 | |
| 6·1 | 179·2 | 228·9 | 220·1 | 176·4 | |
| 6·2 | 215·9 | 223·2 | 220·0 | 183·1 | |
| 6·3 | 208·6 | 226·1 | 216·7 | 189·2 | |
| 7·1 | 220·8 | 214·6 | 209·5 | 217·0 | |
| 7·2 | 214·4 | 201·8 | 182·0 | 172·7 | |
| 7·3 | 245·4 | 235·9 | 214·4 | 178·3 | |
| 8·1 | 234·6 | 214·5 | 210·2 | 201·6 | |
| 8·2 | 223·8 | 222·6 | – | 193·2 | |
| 8·3 | 234·1 | 223·7 | 220·1 | 207·7 | |
| 9·1 | 223·7 | 224·6 | 219·1 | 135·9 | |
| 9·2 | 227·0 | 244·0 | 239·6 | 178·4 | |
| Mean | 221·2 ± 4·1 | 222·1 ± 2·8 | 214·4 ± 3·5 | 178·6*** ± 6·1 | |
Mean values are given with s.d.
*P < 0·05, **P < 0·01, ***P < 0·001.
Anthocyanin inhibition of PI staining is dose dependent
Leaves contain a cocktail of natural compounds which may increase or decrease PI staining. Their concentration is in many cases unknown but may exceed or approach those of our anthocyanin treatments. The mix and final concentration of compounds in Galbraith buffer after chopping, which affect PI staining, reflects the natural level interacting with our treatment. Thus, the present results suggest that the effect of the cytosolic compounds on PI staining may swamp, or become roughly equivalent to, added anthocyanin at concentrations of 20 µm or below in poinsettia bracts and of 2 µm or below in poinsettia leaves and pea. To test if the effect of added anthocyanin on PI staining is dose dependent above this threshold three experiments (n = 8) were performed adding two concentrations (50 and 100 µm) between 20 and 200 µm. The results (Fig. 3) confirm that anthocyanin affects PI staining, and show that an inhibitory effect is clearly concentration dependent above approx. 50 µm. Thus, mean fluorescence fell significantly (P < 0·001) from 50 to 100 µm, and then again (P < 0·001) to 200 µm, in all eight replicates and all three materials compared. Moreover, this effect could already be seen after the addition of 20 µm in pea and green leaves of poinsettia.
Fig. 3.
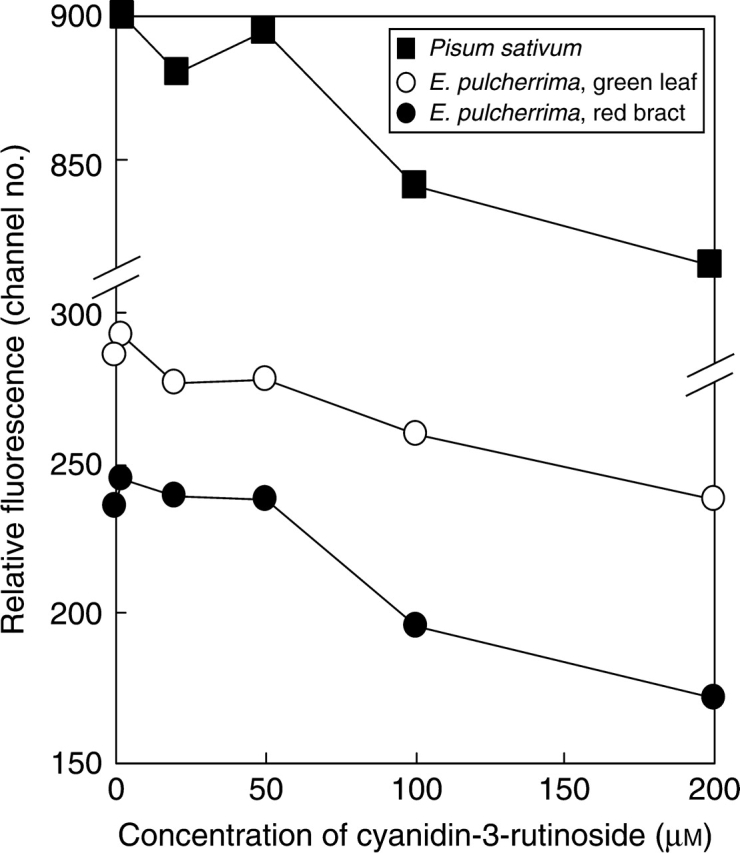
Relative DNA staining in 2C nuclei of Pisum sativum, green leaf or red bract of Euphorbia pulcherrima suspended in Galbraith buffer with no added anthocyanin or with five concentrations of added cyanidin-3-rutinoside.
These results obtained when adding a pure anthocyanin largely mimic the reduction in fluorescence induced by levels of natural inhibitors in red poinsettia bract tissue.
DISCUSSION
The present work reconfirms that estimates of genome size using flow cytometry can be biased by the presence of cytosolic compounds, leading to pseudo-intraspecific variation in genome size. Thus, the results above show that: (1) like sunflower and coffee, poinsettia also has compounds that interfere with PI fluorescence; (2) the level and activity of DNA PI staining inhibitors differs between tissues in poinsettia, and is lower in green leaves than in red bracts; (3) the compounds which inhibit PI staining of DNA in poinsettia have a similar effect on nuclei from pea leaves simultaneously processed with poinsettia tissues; and (4) the effect of natural DNA PI inhibitors in red poinsettia bracts is largely reproduced, in a dose-dependent way, in PI-stained nuclei of the green leaves of both poinsettia and pea, by including the anthocyanin cyanidin-3-rutinoside in the chopping buffer at concentrations up to 200 µm.
Our results (Tables 1 and 2) reconfirm the critical importance of using a full internal standard for intraspecific comparisons as noted by Doležel (1991), Noirot et al. (2000) and Price et al. (2000). They also support the view (Noirot et al., 2000) that use of an internal calibration standard does not completely overcome the problem of factors which interfere with DNA staining, affecting its stoichiometry differently in different tissues of one species, or in target and calibration species. The latter was confirmed by Loureiro et al. (2006a,b), who showed that nuclei of pea and Zea mays were affected differently by tannic acid.
The present results also showed that the ability of PI to stain nuclear DNA is largely set by conditions in the chopping solution immediately after their release at chopping before PI is added, and it is not easily or quickly altered by subsequent change in those conditions, as was also reported by Noirot et al. (2003, 2005) and Loureiro et al. (2006a,b). One unreplicated test also confirmed this, which mixed PI-stained nuclei chopped with no added anthocyanin (Fig. 2C) and others chopped in 200 µm anthocyanin (Fig. 2D). One hour later this mixture showed a clear double peak, but with some reduction in mean fluorescence for pea nuclei from both treatments (Fig. 2E).
Recently, Loureiro et al. (2006a,b) described the effect of tannic acid in Galbraith isolation buffer on estimates of DNA content in Pisum sativum and Zea mays. An increase in side scatter (SS) and a high SS-CV were found to be diagnostic for the presence of tannic acid and the term ‘tannic acid effect’ was given to the phenomenon. Thus, they recommended that in addition to analysing fluorescence pulse integral (FL) and presenting FL histograms, researchers should also analyse and present forward scatter vs. SS in log scale and/or SS in log scale vs. FL cytograms, with the respective CV values obtained for each parameter, to check for such effects in future work. Whether our results involve a tannic acid effect is unknown. Our experiments completed in 1999 and 2000 took no account of the recommendations of Loureiro et al. (2006a,b), and sadly new work by the present authors has been precluded.
However, the effects of cytosolic compounds in poinsettia red bract or of added anthocyanin on nuclear fluorescence in green leaf of poinsettia and pea may be similar to the ‘tannic acid effect’ reported by Loureiro et al. (2006a,b) for Pisum sativum and Zea mays. As far as we are aware, it was the first to show experimentally that a single added compound can mimic the effect of natural cytosolic compounds: the anthocyanin cyanidin-3-rutinoside mimics DNA staining inhibition by natural inhibitors in red poinsettia tissue known to contain several anthocyanins. This suggests that anthocyanin interferes with PI staining of DNA, but is there any evidence that this is possible in vitro, or likely to occur in vivo? If so, does the phenomenon have biological significance?
Anthocyanin and DNA staining
There is good reason to expect that anthocyanin may bind to nuclear DNA and affect its staining by PI, by varying the number of accessible binding sites or competing for them. Several well-known histological techniques used to stain chromosomes or nuclei use natural phenolic compounds, structurally related to anthocyanins, obtained from animals or plants. These include carminic acid (used in carmine stain) derived from cochineal (Buckingham, 1982) from the dried female cochineal insects (Dactylopius coccus), and haematoxylin from two dyewood trees (logwood–Haematoxylon campechianun, and brazilette–H. brazilleto: Record and Hess, 1945). Anthocyanins from sources, including red cabbage and dahlia, were used as histological stains in the late 19th and early 20th centuries (Harms, 1965; Lillie et al., 1975). When a world shortage of haematoxylin occurred in the 1970s, a method substituting anthocyanin BB from blackberry (Rubus spp.) juice was developed. This gave staining similar to that obtained with haematoxylin (Al-Tikriti and Walker, 1977), and Novelli (1953) stated that staining of kidney nuclei with anthocyanin from elderberry (Sambucus nigra) was ‘preferable to carmalum, and even to haematoxylin’.
Anthocyanins are structurally related to several potent intercalators and are known to bind to purines such as caffeine and adenine (Mas et al., 2000). Both DNA and RNA can act as strong effective co-pigments for natural anthocyanins (Mistry et al., 1991), attributed to an intercalating phenomenon between adjacent base pairs. Sarma and Sharma (1999) mixed cyanidin and calf-thymus DNA and reported evidence for a cyanidin–DNA co-pigmentation complex. They concluded that some anthocyanins may be present in nuclei and may associate with DNA, offering protection to DNA.
Anthocyanins may offer protection by binding to alien nucleic acid in vivo. Many flavonoids have cytostatic activity, and anthocyanins (including the glucosides of cyanidin, delphinidin and pelargonidin) have been reported to suppress tumour cell growth by delaying or inhibiting DNA synthesis (Koide et al., 1997). Many plant phenolics including anthocyanins have been implicated in the resistance of plants to infection and disease (Britton, 1983). The mechanisms are unknown but could involve anthocyanins complexing with bacterial, fungal or viral DNA to inhibit replication or expression in invading alien genomes.
Implications for the selection and growth of calibration standards
If anthocyanins can inhibit DNA staining, this has several implications for the selection and cultivation of plant genome size calibration standards. First, it seems prudent to avoid using species or genotypes as calibration standards noted or named for high levels of pigmentation. Red cabbage or copper beech would be poor choices, and taxa with specific epithets such as rubra or purpureum may be risky.
Second, it seems important to select and use as calibration standards cultivars that are genetically disposed to produce little anthocyanin. For example, Hordeum vulgare cultivars differ in this respect in their aerial parts. Many, such as ‘Proctor’, have red awns and leaf sheaths with red veins due to anthocyanin controlled by the dominant genes, ant. 1, ant. 2, etc. A few cultivars, such as ‘Sultan’, are double recessive for ant. 2 g, with green awns and leaf sheaths, and lack such pigmentation. In 1970 Robert Finch (Plant Breeding Institute, Cambridge) chose ‘Sultan’ in a barley cytogenetics project, as out-crosses with most other cultivars would show up by having red awns. For this reason, Bennett and Smith (1976) at the same institute, chose ‘Sultan’ as a Hordeum vulgare calibration standard, which now seems highly advantageous for this purpose. It may be timely to explore the use for DNA content calibration standards of the anthocyaninless ‘albinos’ of Antirrhinum major, Petunia spp. and Pisum sativum (Harborne, 1976). It may also be prudent to use an Arabidopsis thaliana mutant (Burbulis et al., 1996) that is completely devoid of flavonoids, rather than ecotype Columbia, as a basal calibration standard for plants.
Third, it is important to cultivate calibration standards in environments expected to minimize pigmentation, and to avoid the factors listed below likely to increase anthocyanin expression. Standards should be healthy, vigorous and unstressed, and ideally grown in controlled environments with defined optimum conditions. Seed multiplication for use as calibration standard should follow the above to minimize maternal effects in tissues (e.g. root tips) of young seedlings of calibration standards.
Fourth, it seems prudent to select and use as calibration standards tissues known to produce little anthocyanin or related DNA-staining inhibitors. These are common in aerial parts of most plants including leaves (Harborne, 1976; Close and Beadle, 2003). However, roots generally have much lower levels of anthocyanins and colourless flavonoids than aerial parts (R. Grayer, pers. comm.) except in a few species such as red radish, Raphanus sativus.
In general, interspecific comparisons made by one procedure using young colourless 1-cm-long root meristems from seed all germinated at 20 °C in the dark for Feulgen microdensitometry (Bennett and Smith, 1976) may be less prone to such error than comparisons made by flow cytometry using pigmented leaf material from standard and target plants at different developmental stages, from many uncontrolled or unknown environments which varied in temperature, daylength and light quality (Arumuganathan and Earle, 1991).
Implications for the pseudo-genome size variation
Valkonen (1994) gave DNA amounts for Solanum species estimated by flow cytometry using PI staining with chicken red blood cells (2C = 2·33 pg) as calibration standard. Experiments on Solanum brevidens showed that growing plants at under cool conditions (18 °C) combined with strong illumination for 4 weeks reduced the DNA content of leaf nuclei significantly by up to 10 %. However, he noted that ‘the plants grown at 18 °C were stunted, and the leaves had “extremely intense” red or reddish-blue anthocyanin pigmentation, which suggest early senescence in the plants.’ It seems likely that the 10 % intraspecific reduction in PI fluorescence reflects inhibition of DNA staining by an elevated level of anthocyanin pigmentation induced by the environmental conditions imposed on the stressed plants.
The idea that reduced PI fluorescence in S. brevidens may reflect early senescence is also interesting. Valkonen (1994) stated that ‘senescence has been shown to reduce the nuclear [DNA] content in plants, of which many examples were quoted by Bassi (1990)’. However, enhanced pigmentation due to increased anthocyanin levels is a classic sign of senescence. ‘The pigment in autumn leaves is almost always the simplest anthocyanin cyanidin-3-glucoside’ (Harborne, 1976), found in all 74 species from 25 families surveyed by Hayashi and Abe (1953). Elevated anthocyanin levels, typical of senescence, would be expected to inhibit DNA staining in nuclei of senescing tissues. Thus, the reduced estimates of nuclear DNA content in examples cited by Bassi (1990) could reflect pseudo-variation, rather than senescence per se.
Elevated anthocyanin pigmentation is not exclusive to senescence but is a typical response to many ontogenetic, biotic and abiotic stresses met by plants. Increased foliar anthocyanin is commonly induced as a response to increased light intensity, UV irradiance, ionizing radiation, exposure to drought, flood, high salinity, thermal shock by low or high temperature, mechanical damage by bruising or insect damage, deficiency or excess of key minerals (e.g. phosphorus and nitrogen), exposure to ozone and infection by pathogens (see reviews by Harborne, 1976; Hrazdina, 1982; Steyn et al., 2002; Close and Beadle, 2003).
Plants grown in or collected from locations differing in latitude, altitude, rainfall, drainage or temperature often come from environments known or expected to vary in one or more of the above factors. Thus, reports of unorthodox (sensu Greilhuber, 1998) intraspecific variation in genome size estimates, especially those correlated with environmental factors, should be treated with caution. Such data may reflect environmentally induced differences in cyanic compounds which inhibit DNA staining reactions, and hence may indicate pseudo-intraspecific variation (Fig. 4).
Fig. 4.

Model suggesting how differences in key geographical and topological factors, and in many associated abiotic environmental characters commonly reported to enhance anthocyanin levels in plants, may produce environmentally correlated pseudo-intraspecific genome size variation. Note, this may apply to many cytosolic compounds beside anthocyanin which interfere with DNA staining for nuclear DNA content estimation, for example furanocoumarins (Walker et al., 2006).
Dasypyrum villosum (syn. Haynaldia villosa) shows a remarkable intra-individual seed colour polymorphism from yellow to almost black, and seed of any colour can produce plants with pale and dark fruits. Cremonini et al. (1994) claimed that seedling roots from pale caryopses have DNA contents 20–24 % greater than dark caryopses. However, nuclei from leaves of older plants grown from yellow and dark-brown caryopses compared using flow cytometry with PI staining showed no significant differences in genome size (means differed by only 0·0048). Greilhuber (2005) aired the possibility that endogenous staining inhibitors can mimic DNA content differences in this context. However, the pigment(s) responsible for seed coat colour in D. villosum, and whether it includes anthocyanin, is unknown.
Intraspecific variation in genome size estimates in roots of seedlings of several gymnosperms (Miksche, 1968, 1971; Dhir and Miksche, 1974) correlated with increasing latitude in Pinus glauca, P. sitchensis and P. resinosa is a case in point. These taxa are rich in tannins which can inhibit DNA staining. Anthocyanins also occur in gymnosperm seedlings (including P. banksiana and P. sylvestris), and the levels vary in response to environmental factors, and were higher in P. banksiana in high rather than low light (Nozzollillo et al., 1990). Such differences may also cause artefactual genome size variation.
An early example of a plastic genome concerns flax (Linum usitatissimum), in which heritable variation in genome size estimates of 16% were induced during 5–6 weeks of growth in different environmental conditions involving variation in temperature, light intensity and minerals (notably, phosphorus or nitrogen treatments), all known to induce variable anthocyanin levels in plants. Such changes could regress over two generations. Many anthocyanins, including cyanidin-3-rutinoside, have been identified in flax petals or leaves (Dubois and Harborne, 1975). It is worth asking if variable anthocyanin expression, induced by such treatments, might correlate with variation in genome size estimates between genotrophs, especially as the DNA measurements made in flax used shoot apex rather than root tip material (Evans, 1968), and blue-flowered plants had lower average DNA values than white-flowered plants, for both a mutant white genotroph (7 % higher) and white epitrophs (3·7 % higher) (Evans, 1968, table 6).
Interspecific variation in genome size originates from intraspecific variation, and there are good reasons for expecting such variation to occur and to display nucleotypic correlations (Bennett, 1985). It is, however, important to be able to identify and differentiate real and pseudo-intraspecific variation with certainty. Together, the results of Noirot et al. (2000, 2002, 2003, 2005) and the present work show that pseudo-variation of 10–20 % is common in experiments which ignore possible staining inhibitors, whereas residual variation of approx. 5–10 % is not common, even when workers are aware of their potential for generating pseudo-variation. It is difficult to be sure if such residual variation is real or not (Greilhuber, 2005), but it is possible to see whether it is accompanied by variation in phenolics, and if so, whether any developmental or environmental correlations fit the expectation that increased anthocyanin causes decreased pseudo-genome size. Many reports of intraspecific genome size variation merit reassessment with this in mind, including those in several grasses.
Independent reports of intraspecific variation in genome size estimates in Dactylis glomerata (up to 22·7 %) show significant negative correlations with altitude (Creber et al., 1994; Reeves et al., 1998). Perhaps such compounds are increased in response to environmental changes in light and temperature with increasing altitude? Intraspecific variation in genome size estimates in Zea mays (up to 5 %) was correlated with environmental factors such as altitude (Bullock and Rayburn, 1991) and cold tolerance (McMurphy and Rayburn, 1991). Such variation may all be real, but this needs rigorous proof as Z. mays displays highly variable anthocyanin pigmentation between genotypes and growth conditions (Escribano-Bailón et al., 2004), and synthesis of anthocyanin was reported to increase progressively with decreasing temperature under constant high light in Zea (Pietrini and Massacci, 1998). Turpeinen et al. (1999) reported intraspecific variation in genome size estimates in Hordeum spontaneum (approx. 5 %) positively correlated with mean January temperature using flow cytometry with PI staining. Like Zea, Hordeum and other members of Triticeae also display highly variable anthocyanin pigmentation between genotypes and growth conditions, which varies with temperature, UV-B and altitude (Escribano-Bailón et al., 2004). Rigorous proof that intraspecific variation in total genome size is real seems essential before conclusions regarding its relevance to changes in one repeated sequence copy number (retrotransposon BARE-1) are drawn. The above observations concern examples of intraspecific variation reported in grasses, but they apply equally to other striking examples of unorthodox interspecific variation [e.g. 3·8-fold claimed in diploid Collinsia verna (Greenlee et al., 1984)]. Most unusually these genome sizes were estimated on nuclei from meiotic anthers in this species, flowers of which are rich in the anthocyanin delphinidin glycoside. Perhaps variation in polyphenols played a role in generating pseudo-variation here and in Helianthus annuus, which also has highly variable red/purple pigmentation due to anthocyanin (Bullard et al., 1989).
Given their near ubiquitous distribution, many suspected roles and known affects on DNA staining, anthocyanins (and many other compounds such as tannins, Loureiro et al., 2006a) are a potent, potential cause of significant error variation in genome size estimations for most plant tissues and taxa. Nevertheless, recognizing this problem is not grounds for scientists to drop genome size investigations using flow cytometry (Noirot et al., 2005). Rather, it should alert them to the need to implement steps recommended as best practice, warn them against incautious interpretations such as pseudo-intraspecific variation, and drive new efforts to improve the accuracy and interpretation of genome size measurements (The Genome Size Initiative, http://www.kew.org/cval/pgsm/index.html; Loureiro et al., 2007).
ACKNOWLEDGEMENTS
We thank Ellison Nursery (Brenham, TX, USA) for kindly donating plant material of Euphorbia pulcherrima for experimental use, and George Hodnett for technical assistance. M.D.B. thanks the College of Agricultural and Life Sciences and the Department of Soil and Crop Sciences, and the Department of Entomology at Texas A&M University for providing facilities and financial support.
This paper is dedicated to the memory of Professor H. James Price by his co-authors. He worked on it with them until a few hours before his untimely death on 9 November, 2005.
LITERATURE CITED
- Al-Tikriti SA, Walker F. Anthocyanin BB: a nuclear stain substitute for haematoxylin. Journal of Clinical Pathology. 1977;31:194–196. doi: 10.1136/jcp.31.2.194. [DOI] [PMC free article] [PubMed] [Google Scholar]
- Arabidopsis Genome Initiative. Analysis of the genome sequence of the flowering plant. Arabidopsis thaliana. Nature. 2000;408:796–815. doi: 10.1038/35048692. [DOI] [PubMed] [Google Scholar]
- Arumuganathan KE, Earle ED. Nuclear DNA content of some important plant species. Plant Molecular Biology Reporter. 1991;9:208–219. [Google Scholar]
- Bassi P. Quantitative variations of nuclear DNA during plant development: a critical analysis. Biological Reviews of the Cambridge Philosophical Society. 1990;65:185–225. [Google Scholar]
- Bennett MD. Intraspecific variation in DNA amount and the nucleotypic dimension in plant genetics. In: Freeling M, editor. UCLA Symposium on molecular and cellular biology, Plant genetics. Vol. 35. New York: Alan Liss; 1985. pp. 283–302. [Google Scholar]
- Bennett MD, Leitch IJ. Nuclear DNA amounts in angiosperms: progress, problems and prospects. Annals of Botany. 2005;95:45–90. doi: 10.1093/aob/mci003. [DOI] [PMC free article] [PubMed] [Google Scholar]
- Bennett MD, Leitch IJ. Plant DNA C-values (genome size) database. 2005. http://www.kew.org/genomesize/homepage. (accessed 23 May 2007)(release 4·0, Oct. 2005)
- Bennett MD, Leitch IJ. Genome size evolution in plants. In: Gregory TR, editor. The evolution of the genome. San Diego: Elsevier; 2005. pp. 89–162. [Google Scholar]
- Bennett MD, Smith JB. Nuclear DNA amounts in angiosperms. Philosophical Transactions of the Royal Society of London, Series B. Biological Sciences. 1976;274:227–274. doi: 10.1098/rstb.1976.0044. [DOI] [PubMed] [Google Scholar]
- Bennett MD, Bhandol P, Leitch IJ. Nuclear DNA amounts in angiosperms and their modern uses–807 new estimates. Annals of Botany. 2000;86:859–909. [Google Scholar]
- Bennett MD, Leitch IJ, Price HJ, Johnston JS. Comparisons with Caenorhabditis (∼ 100 Mb) and Drosophila (∼ 175 Mb) using flow cytometry show genome size in Arabidopsis to be ∼ 157 Mb and thus ∼25% larger than the Arabidopsis Genome Initiative estimate of ∼125 Mb. Annals of Botany. 2003;91:547–557. doi: 10.1093/aob/mcg057. [DOI] [PMC free article] [PubMed] [Google Scholar]
- Britton G. The biochemistry of natural pigments. Cambridge: Cambridge University Press; 1983. [Google Scholar]
- Buckingham J. Carminic acid. Dictionary of organic compounds, 1006, C-00355. New York: Chapman and Hall; 1982. [Google Scholar]
- Bullard WR, Woronecki PP, Dolbeer RA, Mason JR. Biochemical and morphological characteristics in maturing achenes from purple-hulled and oilseed sunflower cultivars. Journal of Agricultural Feed Chemistry. 1989;37:886–890. [Google Scholar]
- Bullock D, Rayburn AL. Genome size variation in southwestern US Indian maize populations may be a function of effective growing season. Maydica. 1991;36:247–250. [Google Scholar]
- Burbulis IE, Iacobucci M, Shirley BW. A null mutation in the first enzyme of flavonoid biosynthesis does not affect male fertility in Arabidopsis. The Plant Cell. 1996;8:1013–1025. doi: 10.1105/tpc.8.6.1013. [DOI] [PMC free article] [PubMed] [Google Scholar]
- Cavallini A, Zolfino C, Cionini G, Cremonini G, Natali L, Sassoli O, Cionini PG. Nuclear DNA changes within Helianthus annuus L.: cytophotometric karyotypic and biochemical analysis. Theoretical and Applied Genetics. 1986;73:20–26. doi: 10.1007/BF00273713. [DOI] [PubMed] [Google Scholar]
- Cavillini A, Zolfino C, Natali L, Cionini G, Cionini PG. Nuclear changes within Helianthus annuus L.: origin and control mechanism. Theoretical and Applied Genetics. 1989;77:12–16. doi: 10.1007/BF00292309. [DOI] [PubMed] [Google Scholar]
- Close DC, Beadle C. The ecophysiology of foliar anthocyanin. The Botanical Review. 2003;69:149–161. [Google Scholar]
- Creber HMC, Davies MS, Francis D, Walker HD. Variation in DNA C-value in natural populations of Dactylis glomerata. New Phytologist. 1994;128:555–561. doi: 10.1111/j.1469-8137.1994.tb03001.x. [DOI] [PubMed] [Google Scholar]
- Cremonini R, Colonna N, Stefani A, Galasso I, Pignone D. Nuclear DNA content, chromatin organization and chromosome banding in brown and yellow seeds of Dasypyrum villosum (L.) P. Candargy. Heredity. 1994;72:365–373. [Google Scholar]
- Dhir NK, Miksche JP. Intraspecific variation of DNA content in Pinus resinosa Ait. Canadian Journal of Genetics and Cytology. 1974;16:77–83. [Google Scholar]
- Doležel J. Flow cytometric analysis of nuclear DNA content in higher plants. Phytochemical Analysis. 1991;2:143–154. [Google Scholar]
- Doležel J, Bartoš J. Plant DNA flow cytometry and estimation of nuclear genome size. Annals of Botany. 2005;95:99–110. doi: 10.1093/aob/mci005. [DOI] [PMC free article] [PubMed] [Google Scholar]
- Dubois JA, Harborne JB. Anthocyanin inheritance in petals of flax. Linum usitatissimum. Phytochemistry. 1975;14:2491–2494. [Google Scholar]
- Escribano-Bailón MT, Santos-Buelga C, Rivas-Gonzalo JC. Anthocyanins in cereals. Journal of Chromatography A. 2004;1054:129–141. doi: 10.1016/j.chroma.2004.08.152. [DOI] [PubMed] [Google Scholar]
- Evans GM. Nuclear changes in flax. Heredity. 1968;23:25–38. [Google Scholar]
- Galbraith DW, Harkins KR, Maddox JM, Ayres NM, Sharma DP, Firoozabady E. Rapid flow cytometric analysis of the cell cycle in intact plant tissues. Science. 1983;220:1049–1051. doi: 10.1126/science.220.4601.1049. [DOI] [PubMed] [Google Scholar]
- Greilhuber J. Severely distorted Feulgen-DNA amounts in Pinus (Coniferophytina) after nonadditive fixations as a result of as a result of meristematic self-tanning with vacuole contents. Canadian Journal of Genetics and Cytology. 1986;28:409–415. [Google Scholar]
- Greilhuber J. ‘Self-tanning’–a new and important source of stoichiometric error in cytophotometric determination of nuclear DNA content in plants. Plant Systematics and Evolution. 1988;158:87–96. [Google Scholar]
- Greilhuber J. The problem of variable genome size in plants (with special reference to woody plants). In: Borzan Z, Schlarbaum SE, editors. Cytogenetic studies of forest trees and shrub species; Proceedings of the First IUFRO Cytogenetics Working Party; September 8–11, 1993; Brijuni National Park, Croatia. Zagreb: Croatian Forests, Inc., and Faculty of Forestry, University of Zagreb; 1997. pp. 13–34. [Google Scholar]
- Greilhuber J. Intraspecific variation in genome size: a critical reassessment. Annals of Botany. 1998;82:27–35. [Google Scholar]
- Greilhuber J. Intraspecific variation in genome size in angiosperms: identifying its existence. Annals of Botany. 2005;95:91–98. doi: 10.1093/aob/mci004. [DOI] [PMC free article] [PubMed] [Google Scholar]
- Greilhuber J, Borsch T, Müller K, Worberg A, Porembski S, Barthlott W. Smallest angiosperm genomes found in Lentibulariaceae with chromosomes of bacterial size. Plant Biology. 2006;8:770–777. doi: 10.1055/s-2006-924101. [DOI] [PubMed] [Google Scholar]
- Greilhuber J, Temsch EM, Loureiro J. Nuclear DNA content measurement. In: Doležel J, Greilhuber J, Suda J, editors. Flow cytometry with plant cells. Weinheim: Wiley-VCH Verlag GmbH & Co; 2007. pp. 67–102. [Google Scholar]
- Greenlee JK, Rai KS, Floyd AD. Intraspecific variation in nuclear DNA content in Collinsia verna Nutt. (Scrophulariceae) Heredity. 1984;52:235–242. [Google Scholar]
- Harborne JB. Functions of flavonoids in plants. In: Goodwin TW, editor. Chemistry and biochemistry of plant pigments. London: Academic Press; 1976. pp. 736–778. [Google Scholar]
- Harms H. Handbuch der Farbstoffe für die Mikroscopie. vol. 2. Kamp-Lintfort, Germany: Staufen-Verlag; 1965. pp. 116–118. [Google Scholar]
- Hayashi K, Abe Y. Studien über Anthocyane XXIII. Miscellaneous Reports of the Research Institute for Natural Resources (Tokyo) 1953;29:1–8. Papier-chromatographische Übersicht der Anthocyane im Pflanzenreich. I. [Google Scholar]
- Hosouchi T, Kumekawa N, Tsuruoka H, Kotani H. Physical map-based sizes of the centromeric regions of Arabidopsis thaliana chromosomes 1, 2 and 3. DNA Research. 2002;9:117–121. doi: 10.1093/dnares/9.4.117. [DOI] [PubMed] [Google Scholar]
- Hrazdina G. Anthocyanins. In: Harborne JB, Mabry TJ, editors. The flavonoids. Advances in research. London: Chapman and Hall; 1982. pp. 135–188. [Google Scholar]
- Jewell DC, Islam-Faridi MN. Details of a technique for somatic chromosome preparation and C-banding of maize. In: Freeling M, Walbot V, editors. The maize handbook. New York: Springer; 1994. pp. 483–493. [Google Scholar]
- Johnston JS, Jenson A, Czeschin DG, Price HJ. Environmentally induced nuclear 2C DNA content variation in Helianthus annuus. American Journal of Botany. 1996;83:1113–1120. [Google Scholar]
- Johnston JS, Bennett MD, Rayburn AL, Galbraith DW, Price HJ. Reference standards for determination of DNA content of plant nuclei. American Journal of Botany. 1999;86:609–613. [PubMed] [Google Scholar]
- Koeppe DE, Southwick LM, Bittell JE. The relationship of tissue chlorogenic acid and leaching of phenolics from sunflower grown under varying phosphate nutrient conditions. Canadian Journal of Botany. 1976;54:593–599. [Google Scholar]
- Koide T, Kamei H, Hashimoto Y, Kojima T, Terabe K, Umeda T. Influence of flavonoids on cell cycle phase as analyzed by flow cytometry. Cancer Biotherapy and Radiopharmaceuticals. 1997;12:111–115. doi: 10.1089/cbr.1997.12.111. [DOI] [PubMed] [Google Scholar]
- Lillie RD, Pizzaloto P, Donaldson PT. Hematoxylin substitutes: a survey of mordant dyes tested and consideration of the relation of their structure and performance as nuclear stains. Stain Technology. 1975;51:25–41. doi: 10.3109/10520297609116665. [DOI] [PubMed] [Google Scholar]
- Loureiro J, Rodriguez E, Doležel J, Santos C. Flow cytometric and microscopic analysis of the effect on tannic acid on plant nuclei and estimation of DNA content. Annals of Botany. 2006;98 doi: 10.1093/aob/mcl140. [DOI] [PMC free article] [PubMed] [Google Scholar]
- Loureiro J, Rodriguez E, Doležel J, Santos C. Comparison of four nuclear isolation buffers for plant DNA flow cytometry. Annals of Botany. 2006;98 doi: 10.1093/aob/mcl141. [DOI] [PMC free article] [PubMed] [Google Scholar]
- Loureiro J, Rodriguez E, Doležel J, Santos C. Two new nuclear isolation buffers for plant DNA flow cytometry: a test with 37 species. Annals of Botany. 2007;100:875–888. doi: 10.1093/aob/mcm152. [DOI] [PMC free article] [PubMed] [Google Scholar]
- Mas T, Susperrigui J, Berké B, Chèze C, Moreau S, Nuhrich A, Vercanterun J. DNA triplex stabilisation property of natural anthocyanin. Phytochemistry. 2000;53:679–687. doi: 10.1016/s0031-9422(99)00619-6. [DOI] [PubMed] [Google Scholar]
- McMurphy LM, Rayburn AL. Genome size variation in maize populations selected for cold tolerance. Plant Breeding. 1991;106:190–195. [Google Scholar]
- Michaelson MJ, Price HJ, Johnston JS, Ellison JR. Variation of nuclear DNA content in Helianthus annuus (Asteraceae) American Journal of Botany. 1991;78:1238–1243. [Google Scholar]
- Miksche J. Quantitative study of intraspecific variation of DNA per cell in Picea glauca and Pinus banksiana. Canadian Journal of Genetics and Cytology. 1968;10:590–600. [Google Scholar]
- Miksche J. Intraspecific variation of DNA per cell between Picea sitchensis (Bong. Carr) provenances. Chromosoma. 1971;32:343–352. doi: 10.1007/BF00285248. [DOI] [PubMed] [Google Scholar]
- Mistry TV, Cai Y, Lilly TH, Haslam E. Polyphenol interactions. 5. Anthocyanin co-pigmentation. Journal of the Chemical Society–Perkin Transactions. 1991;II:1287–1296. [Google Scholar]
- Nagl W, Capesius I. Molecular and cytological characteristics of nuclear DNA and chromatin for angiosperm systematics: basic data for Helianthus annuus. Plant Systematics and Evolution. 1976;126:221–237. [Google Scholar]
- Noirot M, Barre P, Louarn J, Duperrey C, Hamon S. Nucleus–cytosol interactions–a source of stoichiometric error in flow cytometric estimation of nuclear DNA content in plants. Annals of Botany. 2000;86:309–316. [Google Scholar]
- Noirot M, Barre P, Louarn J, Duperrey C, Hamon S. Consequences of stoichiometric error on nuclear DNA content evaluation in Coffea liberica var. dewevrei using DAPI and propidium iodide. Annals of Botany. 2002;89:385–389. doi: 10.1093/aob/mcf056. [DOI] [PMC free article] [PubMed] [Google Scholar]
- Noirot M, Barre P, Louarn J, Duperrey C, Hamon S. Effects of caffeine and chlorogenic acid on propidium iodide accessibility to DNA: consequences on genome size evaluation in coffee trees. Annals of Botany. 2003;92:259–264. doi: 10.1093/aob/mcg139. [DOI] [PMC free article] [PubMed] [Google Scholar]
- Noirot M, Barre P, Duperrey C, Hamon S, De Kochko A. Investigating the causes of stoichiometric error in genome size estimation using heat experiments: consequences on data interpretation. Annals of Botany. 2005;95:111–118. doi: 10.1093/aob/mci006. [DOI] [PMC free article] [PubMed] [Google Scholar]
- Novelli A. A new nuclear staining method with a vegetal indicator dye: the sambucyanin. Experientia. 1953;IX:152–153. doi: 10.1007/BF02154593. [DOI] [PubMed] [Google Scholar]
- Nozzollillo C, Isabelle P, Das G. Seasonal changes in phenolic constituents of jack pine seedlings (Pinus banksiana) in relation to the purpling phenomenon. Canadian Journal of Botany. 1990;68:2010–2017. [Google Scholar]
- Olszewska MJ, Osiecka R. The relationship between 2C DNA content, life cycle type, systematic position, and the dynamics of DNA endoreduplication in parenchyma nuclei during growth and differentiation of roots in some dicotyledonous herbaceous species. Biochemie und Physiologie der Pflanzen. 1983;78:581–599. [Google Scholar]
- Pietrini F, Massacci A. Leaf anthocyanin content changes in Zea mays L. grown at low temperature: significance for the relationship between quantum yield of PS II and the apparent quantum yield of CO2 assimilation. Photosynthesis Research. 1998;58:213–219. [Google Scholar]
- Price HJ, Johnston JS. Influence of light on DNA content of Helianthus annuus. Proceedings of the National Academy of Sciences USA. 1996;93:11264–11267. doi: 10.1073/pnas.93.20.11264. [DOI] [PMC free article] [PubMed] [Google Scholar]
- Price HJ, Morgan PW, Johnston JS. Environmentally correlated variation in 2C nuclear DNA content measurements in Helianthus annuus L. Annals of Botany. 1998;82(Supplement A):95–98. [Google Scholar]
- Price HJ, Hodnett G, Johnston JS. Sunflower (Helianthus annuus) leaves contain compounds that reduce nuclear propidium iodide fluorescence. Annals of Botany. 2000;86:929–934. [Google Scholar]
- Record SJ, Hess RW. Timbers of the world. Newhaven, CT: Yale University Press; 1945. [Google Scholar]
- Reeves G, Francis D, Davies MS, Rogers HJ, Hodkinson TR. Genome size is negatively correlated with altitude in natural populations of Dactylis glomerata. Annals of Botany. 1998;82(Supplement A):99–105. [Google Scholar]
- Sarma AD, Sharma R. Anthocyanin-DNA copigmentation complex: mutual protection against oxidative damage. Phytochemistry. 1999;52:1313–1318. [Google Scholar]
- Stewart RN, Arisumi T. Genetic and histogenic determination of pink bract color in poinsettia. Journal of Heredity. 1966;57:217–220. [Google Scholar]
- Steyn WJ, Wand SJE, Holcroft DM, Jacobs G. Anthocyanins in vegetal tissues: a proposed unified function in photoprotection. New Phytologist. 2002;155:349–361. doi: 10.1046/j.1469-8137.2002.00482.x. [DOI] [PubMed] [Google Scholar]
- Sunderland N, McLeish J. Nucleic acid content and concentration in root tip cells of higher plants. Experimental Cell Research. 1961;24:541–554. doi: 10.1016/0014-4827(61)90453-0. [DOI] [PubMed] [Google Scholar]
- Swift H. The quantitative aspects of nuclear nucleoproteins. International Review of Cytology. 1953;2:1–76. [Google Scholar]
- Teoh SB, Rees H. Nuclear DNA amounts in populations of Picea and Pinus species. Heredity. 1976;36:123–137. [Google Scholar]
- Turpeinen T, Kulmala J, Nevo E. Genome size variation in Hordeum spontaneum populations. Genome. 1999;42:1094–1099. doi: 10.1139/g99-066. [DOI] [PubMed] [Google Scholar]
- Valkonen JPT. Nuclear DNA content of the Solanum spp. in the series Etuberosa as determined by laser flow cytometry. Annals of Applied Biology. 1994;125:589–600. [Google Scholar]
- Walker DJ, Monino I, Correal E. Genome size in Bituminaria bituminosa (L.) C.H. Stirton (Fabaceae) populations: separation of “true” differences from environmental effects on DNA determination. Environmental and Experimental Botany. 2006;159:104–116. [Google Scholar]