Abstract
We report single-molecule measurements on the folding and unfolding conformational equilibrium distributions and dynamics of a disulfide crosslinked version of the two-stranded coiled coil from GCN4. The peptide has a fluorescent donor and acceptor at the N termini of its two chains and a Cys disulfide near its C terminus. Thus, folding brings the two N termini of the two chains close together, resulting in an enhancement of fluorescent resonant energy transfer. End-to-end distance distributions have thus been characterized under conditions where the peptide is nearly fully folded (0 M urea), unfolded (7.4 M urea), and in dynamic exchange between folded and unfolded states (3.0 M urea). The distributions have been compared for the peptide freely diffusing in solution and deposited onto aminopropyl silanized glass. As the urea concentration is increased, the mean end-to-end distance shifts to longer distances both in free solution and on the modified surface. The widths of these distributions indicate that the molecules are undergoing millisecond conformational fluctuations. Under all three conditions, these fluctuations gave nonexponential correlations on 1- to 100-ms time scale. A component of the correlation decay that was sensitive to the concentration of urea corresponded to that measured by bulk relaxation kinetics. The trajectories provided effective intramolecular diffusion coefficients as a function of the end-to-end distances for the folded and unfolded states. Single-molecule folding studies provide information concerning the distributions of conformational states in the folded, unfolded, and dynamically interconverting states.
Experimental knowledge of the condensed phase is based primarily on ensemble measurements. Therefore, biological and chemical kinetics are usually discussed in terms of the evolution of the ensemble average. However, if heterogeneity of structure and mechanism is essential for function, this useful paradigm breaks down. By using single-molecule detection (1–11), it is now possible to follow the evolution of individual members of an equilibrium ensemble. This trajectory can be used to evaluate the dynamics of the system at equilibrium including rates, rate constants, and distributions of properties.
Proteins and other biological assemblies exhibit microscopic structural heterogeneity and are therefore of particular interest for single-molecule study. In one example, fluorescence spectral fluctuations were attributed to dynamics among enzyme substrates in single-molecule experiments (5). In another example, protein conformational dynamics was cited as the origin of fluorescence intensity and polarization fluctuations of single folded molecules of Staphylococcal nuclease (10). Further, single-molecule methods have recently been used to investigate protein folding and unfolding (9, 11). Atomic force microscopy has been applied to observe the response of folded multidomain proteins to abrupt changes in their folding equilibrium, e.g., after application of a mechanical force (12). However, the observation of a single protein domain in dynamic equilibrium between folded and unfolded states has proven to be challenging.
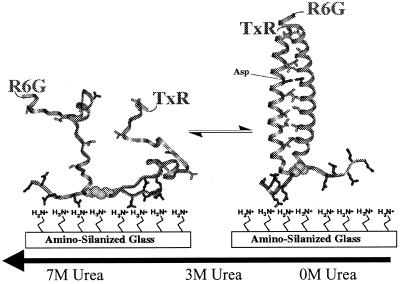
Recently we reported on the structure distributions obtained from single-molecule studies of a small model protein, GCN4-Pf (9). This peptide contains a short stretch of a two-stranded coiled coil from the yeast transcription factor, GCN4 (13, 14), as shown in Fig. 1. It also has a disulfide crosslink near its C terminus to provide an intramolecular folding situation and a polyGlu tag for absorbing the peptide onto positively charged surface. A GCN4 construct with a covalent disulfide linkage folds in an apparent two-state equilibrium (15). To allow fluorescence resonance energy transfer measurements, the peptide includes a fluorescent donor (5-carboxy-rhodamine 6G) and acceptor (Texas red) at the N termini of its two otherwise identical chains. Related peptides have been very extensively studied and have been shown to exist in a two-state equilibrium between an unfolded state and fully α-helical dimers (16–22). Kinetic studies suggest that the α-helical secondary structure and the double-helical folded structure form concomitantly (19–24).
Figure 1.
Schematic representation of the folding of GCN4-Pf. (Right) Structure of folded GCN4-P1 from x-ray diffraction.(13). A hypothetical unfolded structure is shown at Left. The peptide adheres to the positively charged surface by electrostatic interaction with the negatively charged glutamic acids at the C terminus of the peptide. Conformational fluctuations cause changes in the donor–acceptor distance, resulting in an anticorrelated modulation in the donor and acceptor fluorescence intensities.
Previously, we examined the distribution of interfluorophore distances, R, for GCN4-Pf absorbed to aminopropyl-silanized glass under conditions where the peptide was nearly fully folded (0 M urea), unfolded (7.4 M urea), and in a dynamic exchange between folded and unfolded states (3.0 M urea). As the concentration of urea increased, the mean end-to-end distance also increased, and the distributions broadened. Further, by examining distributions obtained with different averaging times, it was possible to infer that the peptide exhibited dynamic behavior under all three conditions (9). The proximity of a surface can influence the dynamics of folded and unfolded states (9), thus in the present manuscript we describe parallel experiments on GCN4-Pf in bulk solution. Correlation methods are used to directly measure the conformational and folding dynamics.
Materials and Methods
Stopped-Flow Kinetics.
The GCN4-P1 variant used in this study, designated GCN4-Pf (9), is a disulfide-crosslinked heterodimer whose individual chains differ only in the nature of the fluorescent species at the N terminus of its individual chains. The sequence of the peptide is:
Fluor-GGRMKQLEDK10VEELLSKDYH20LENEVARLKK30LVGERGGCGE40EEEE, in which Fluor is Texas red (TxR) or rhodamine 6 g (Fig. 1). TxR was introduced via an N-carboxysuccinamide ester (Molecular Probes), which was provided as a mixture of positional isomers with respect to the position of attachment to the phenyl ring. A single isomer isolated by HPLC was used in all experiments. To evaluate the contributions of the fluorescent tags and the C-terminal Glu sequence to the folding of this peptide, we prepared a second peptide, GCN4-Pw, lacking these features. A Tyr-19 of this peptide was changed to Trp, providing a convenient fluorescent tag for monitoring its folding (24). The kinetics of folding of these two peptides were assessed by using a Biologic SFM-4/QS stopped-flow fluorimeter. The fluorescence of GCN4-Pw was measured by using excitation at 280 nm and 324 nm cut-on filter for emission. The folding of GCN4-Pf was monitored by using an excitation wavelength of 535 nm and a 590-nm emission filter. The temperature of the sample syringes and observation cuvette was controlled with a circulating water bath. The dead time of the stopped-flow experiments was 2.5 ms, depending on syringe speed and dilution ratio. Starting from the folded state (0 M urea), unfolding was initiated by dilution to yield the desired denaturant concentration at pH 6.1, 10 mM 2-(N-morpholino)ethanesulfonic acid, 10°C. The final peptide concentration was 8.9 μM. Six kinetic traces were averaged at each unfolding condition and fit by nonlinear least-squares to single-exponential functions by using sigmaplot (Jandel, San Rafael, CA). The first-order rate constant thus obtained at 3 M urea for GCN4-Pf was 150 s−1 and for GCN4-Pw was 490 s−1. The similarity of these rate constants indicates that the fluorescent probes do not greatly influence the kinetics of folding of GCN4-Pw. In fact, the difference may arise from a small stabilization of the dimer associated with the Trp substitution.
Confocal Microscopy of Single Molecules.
For single-molecule studies of GCN4-Pf in the surface-associated state, GCN4-Pf is adsorbed to the surface of an aminopropylsilanized microscope coverslip (9) by applying 30 μl of a 1.0-nM solution of GCN4-Pf in 10 mM 2-(N-morpholino)ethanesulfonic acid, pH 6.1, buffer. After 5 min, the surface is washed three times, then loaded with the same buffer containing the desired urea concentrations.
The inverted scanning confocal microscope has been described before (8, 9). To excite the single molecules, we used an average excitation power of 0.5 μW from a 76-MHz mode-locked Nd:YAG laser (Coherent Antares) frequency doubled to 532 nm and circularly polarized. Two avalanche photodiodes (EG & G, Salem, MA) provide high quantum yield detection of single photons from each of the fluorescent dyes. Fluorescence images of GCN-4 Pf were recorded simultaneously by scanning the sample stage (area, 36 μm2). We have examined approximately 700 individual surface-absorbed GCN4-Pf molecules. Photobleaching curves of rhodamine 6 g and Texas red were simultaneously recorded with an integration time of 0.98 ms. A total of 287 molecules lasted longer than the ≈150 ms needed for detailed analysis. Under our experimental conditions, approximately five to ten photons per millisecond are detected.
Measurements of solution-phase energy-transfer efficiency distributions of single GCN4-Pf peptides were made by focusing the excitation light into a 400-pM solution. The average light intensity was 14 MW/cm2 at the diffraction-limited focus. As GCN4-Pf diffuses freely through the confocal volume with a typical transit time of ≈2 ms, the resulting burst of photons is recorded by the two avalanche photodiodes. The data were collected for periods of approximately 30 min. Energy transfer efficiency and distance distributions were typically calculated from ≈5,000 bursts of 120–300 photons in 1.5-ms bins above the background.
The aim is to extract from the trajectories the fluctuations related to stochastic motions in the folded and unfolded states, as well as the dynamics of interconversion between those two states. However, photophysical processes may also give rise to intensity fluctuations from time-dependent shifts in the fluorescence spectrum (25, 26), transient nonfluorescent states of the system (27), including triplet states (28, 29) (known as “blinking”), and irreversible photobleaching (1). In our analysis, we do not include data after a molecule blinks. Inclusion of blinking events in the analysis results in a very large correlation (which decays on the ≈0.5-s time scale) as well as a peak near zero efficiency in the energy transfer distributions discussed below.
Measurement of Fluorescence Anisotropy.
The fluorescence anisotropy decays of rhodamine 6 g and Texas red were determined by time-correlated single-photon counting. Nonlinear least-squares fits obtained by convolution of exponential functions with the instrument response provided the parameters in Table 1.
Table 1.
Fit parameters for bulk fluorescence anisotropy decay.
| Dye | λex nm | X2 | a1 | τ1 ns | a2 | τ2 ns | a3 | τ3 ns | r1 | τr1 ns | r2 | τr2 ns | r∞ |
|---|---|---|---|---|---|---|---|---|---|---|---|---|---|
| R6G | 548 | .141 | .142 | .204 | 1.89 | .028 | |||||||
| TxR | 548 | 1.2 | 0.720 | 0.033 | 0.074 | 0.369 | 0.206 | 4.05 | 0.017 | 0.526 | 0.202 | 1.54 | 0.038 |
| TxR | 585 | 1.1 | 0.832 | 0.009 | 0.011 | 0.556 | 0.157 | 3.93 | 0.147 | 0.394 | 0.145 | 1.27 | 0.025 |
IMA = a1e−t/τ1 + a2e−t/τ2 + a3e−t/τ3 r=r1e−t/τr1 + r2e−t/τr2 + r∞
Correlation Analysis.
Individual molecule correlation functions are calculated and averaged to give an overall correlation function Ck,l(t) by using the following equation:
 |
1 |
M is the total number of molecules, with i and j summing over all molecules. Si,l and Si,k are the signals (with the mean subtracted) to be correlated. The total time the ith molecule is observed is ti.
To minimize the noise associated with counting a finite number of photons (shot noise), we use the Fourier transform of the correlation function to determine the power spectrum. Coupled with knowledge of the magnitude of the shot noise contribution to the variance, the power spectrum allows us to perform an optimal filtering procedure (30). The optimal filter is defined by Eq. 2,
 |
2 |
in which |S(f)|2 is the power spectrum of the signal that we calculate from the correlation function, and |(f)|2 is a constant equal to the shot noise. The Fourier transform of the trajectory is multiplied by the filter and then inverse Fourier transformed to produce the filtered trajectory, which is then used to calculate other variables and determine their distributions.
The corrected (9) and optimally filtered trajectories ID, IA are used with the quantum yields for unsensitized donor and acceptor fluorescence (ØD, and ØA, respectively), and the donor and acceptor extinction coefficients to determine the quantum yield for energy transfer (ØET) according to Eq. 3:
 |
3 |
in which ɛA/D is the ratio of the donor and acceptor extinction coefficients at the excitation wavelength. The reduced distance between the chromophores is r = R/R0, where R0 is the Förster radius (31) at which there is a 50% yield of energy transfer.
Results
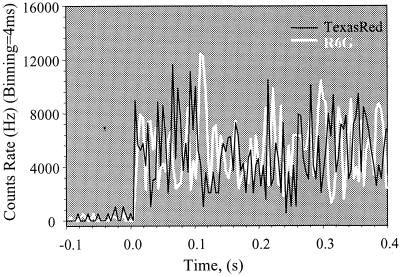
Fig. 2 illustrates a typical time trace for a surface-absorbed molecule of GCN4-Pf. The donor is excited with 532-nm light, and the emitted photons are monitored at two wavelengths; one primarily corresponds to donor and the other to acceptor fluorescence. As the distance between fluorophores increases, the fluorescence of the donor increases, whereas that of the acceptor decreases. Thus, there is an anticorrelation of the donor and acceptor signals that was absent from GCN4-Pf molecules labeled with only the donor (9). Furthermore, the mean squared signal fluctuations (excluding shot noise) were approximately 6-fold lower for the single donor-labeled peptide. Thus, most of the variance in the trajectories arises from variations in the donor/acceptor distances, the angles between donor and acceptor transition dipoles, and the orientation of the transition dipoles of the dyes relative to the surface normal (the colatitudes).
Figure 2.
Typical time-resolved signals along the donor (white line) and acceptor (black line) fluorescence channels from a single GCN4-Pf at pH 6.1.
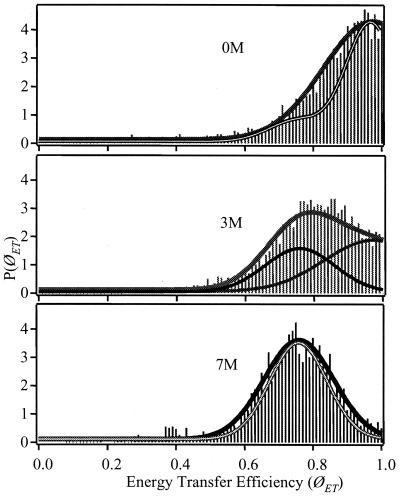
The signals are collected for a given period and then converted to quantum yields for energy transfer (ØET), as described in Materials and Methods. The mean values of ØET for GCN4-Pf in free solution shift to lower ØET as the urea concentration is increased as shown by the distributions in Fig. 3. This is consistent with the expected increased average value of r in the unfolded state.
Figure 3.
Probability distributions P(ØET) represented by sticks under urea concentrations as labeled measured on freely diffusing GCN4-Pf. The black-and-white solid lines in the 0- and 7-M sections are Gaussian representations of the distributions of ØET with the contribution of the shot noise deconvolved. The thick solid line in the 3-M section urea is a fit of the 3-M data to 45% of the 0-M and 55% of the 7-M distributions. The thin lines are the contributions of the 0- and 8-M urea distributions needed to fit the 3-M distribution.
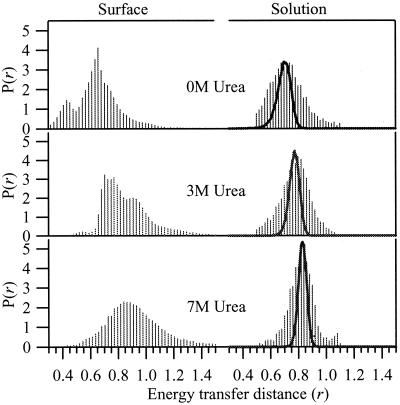
The interchromophore distance, r, is a structural variable with a distribution that is characteristic of the conformational ensemble of the peptide under a given condition. An individual peptide fluctuates within this distribution with characteristic times that depend on the details of the free-energy landscape that the peptide explores during a trajectory. Fig. 4 shows the distributions of r for GCN4-Pf in solution and on the surface, computed from the values of ØET. The distributions of ØET were calculated from data averaged into 1.5-ms bins. The solid line represents a simulation of the width of the distributions expected from the shot noise alone. The distributions are significantly broader than the shot noise. The distribution associated with the partially folded peptide in 3.0 M urea is well described by the 45% of the folded plus 55% of the unfolded distributions.
Figure 4.
(Left) Probability distributions of the average donor acceptor separation measured on the aminosilanized cover slips from optimally filtered trajectories. (Right) Probability distributions under different urea concentrations measured on freely diffusing GCN4-Pf with shot noise broadening of a single value overlaid for comparison.
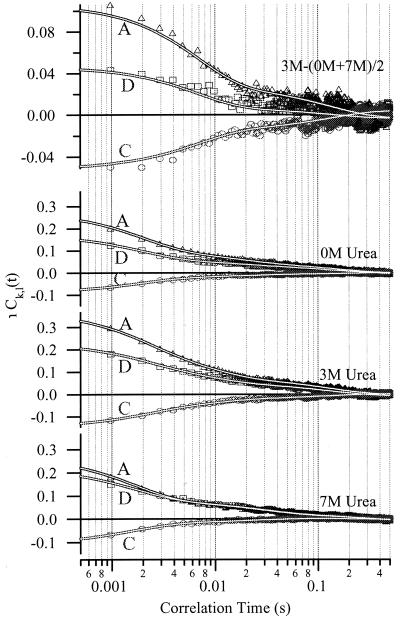
Conformational fluctuations of the protein cause changes in the coordinate r. The resulting fluctuations in the signal will persist for as long as the underlying fluctuations. To measure their time scale(s), we obtained the donor and acceptor auto- and crosscorrelation functions. The averaged correlation functions are shown in Fig. 5. For each concentration of urea, the correlation functions were fit to three exponentials. The decay parameters were fit globally, whereas the preexponential factor was allowed to vary locally. Thus, each fit had 3 global and 3 local parameters for a total of 12 parameters that are summarized in Table 1. The correlation functions generated from the individual trajectories were each fit to two exponentials. The individual molecules show multiple time scales in each of the urea conditions with the decay rates varying from molecule to molecule (data not shown). The crosscorrelation function is negative, but its magnitude at time 0 is less than the geometric mean of the amplitudes of the autocorrelation functions.
Figure 5.
Signal correlation functions, Ck,l(t), and their dependence on urea concentration for immobilized GCN4-Pf. A, acceptor autocorrelation; D, donor autocorrelation; C, crosscorrelation. (Top) A fit to the 3-M crosscorrelation function with the contributions from the conformational fluctuations because of the folded and unfolded states removed by subtracting the mean of the 0- and 7-M data from the 3-M urea data. The three panels (Bottom) were calculated from Eq. 1 with urea concentrations as labeled.
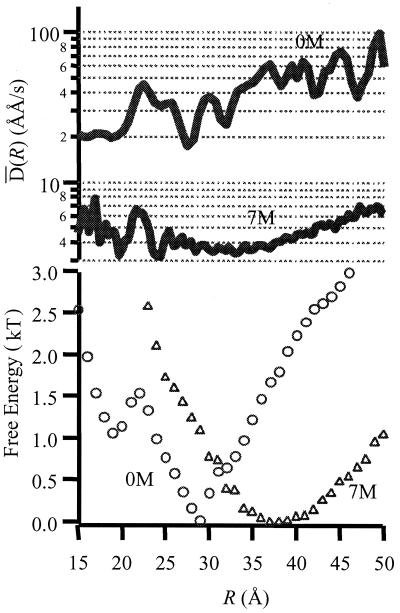
Each value of the coordinate r corresponds to a large number of configurations. Consequently, there is not only a probability distribution across r, but for any other given observable there is also a conditional probability distribution that is a function of r. To gain more information about the distribution of conformations that give rise to a given value of r, we must examine the distribution function of some other variable at each value of r. Fortunately, the calculation of a distance trajectory allows additional information to be extracted from single-molecule measurements. This information is important in understanding the heterogeneity of structure. For example, a given position r can correspond to either a folded or unfolded configuration, but folded configurations should have very different fluctuations than unfolded ones. The first derivative of the distance trajectory with respect to time gives an instantaneous velocity. An effective “diffusion” constant is defined by the product of this velocity and the instantaneous position change ΔR, giving ΔR2/Δt = D. The mean value, D̄(R), is shown in Fig. 6 as a function of R for GCN4-Pf on the surface. Note that D̄ is the mean of the distribution of Ds. At each point, R values of D̄(R) depend on the solution conditions. The value of D̄ for 7 M urea is the smallest of the three conditions, confirming the idea that interchange between unfolded configurations of GCN4-Pf on the silanized glass surface is relatively slow under these conditions. For 0 M urea, the distribution shows a broad minimum at a value of R expected from the folded structure of GCN4-Pf (10–30 Å). For configurations of the peptide in which R is greater than this value, D̄ increases by an order of magnitude.
Figure 6.
(Top) Mean instantaneous diffusion coefficient as a function of the effective folding coordinate R computed from r by using R0 = 44 Å. (Bottom) Potentials of mean force calculated from the probability distributions from optimally filtered trajectories of immobilized GCN4-Pf by using G(R) = −kT lnP(R). Concentrations of urea are as labeled.
Discussion
One objective of the current work was to compare distributions of ØET for surface-adsorbed GCN4-Pf with those of the same peptide in free solution. Previously, we reported a broad feature in the 7 M urea distributions at relatively low ØET and attributed it to portions of the trajectory where the unfolded peptide has its conformational fluctuations slowed because of interactions with the surface (9). This conclusion is confirmed by the present study. The broad feature was indeed absent in the distributions obtained from freely diffusing molecules (Fig. 3). Furthermore, the average value for D̄ at 7 M is substantially less than for the other urea conditions (Fig. 6). The slowest time scale in the correlation functions (Fig. 5, Table 2) is independent of urea concentration and is therefore also ascribed to the surface-related features.
Table 2.
Fit parameters for signal correlation functions
| Urea | at = a12 + a22 + a32 | τ1 | a12/at | τ2 | a22/at | τ3 | a32/at | |
|---|---|---|---|---|---|---|---|---|
| 0 M | 〈D|D〉 | 0.28 | 1.8 ms | 0.61 | 12.5 ms | 0.21 | 135. ms | 0.19 |
| 〈A|A〉 | 0.1784 | 1.8 ms | 0.62 | 12.5 ms | 0.16 | 135. ms | 0.23 | |
| 〈D|A〉 | −0.0906 | 1.8 ms | 0.68 | 12.5 ms | 0.21 | 135. ms | 0.11 | |
| 3 M | 〈D|D〉 | 0.3788 | 2.2 ms | 0.51 | 9.8 ms | 0.28 | 138. ms | 0.21 |
| 〈A|A〉 | 0.236 | 2.2 ms | 0.44 | 9.8 ms | 0.33 | 138. ms | 0.23 | |
| 〈D|A〉 | −0.1523 | 2.2 ms | 0.54 | 9.8 ms | 0.29 | 138. ms | 0.17 | |
| 7 M | 〈D|D〉 | 0.2763 | 1.6 ms | 0.71 | 24.8 ms | 0.17 | 145. ms | 0.12 |
| 〈A|A〉 | 0.2197 | 1.6 ms | 0.63 | 24.8 ms | 0.27 | 145. ms | 0.10 | |
| 〈D|A〉 | −0.1072 | 1.6 ms | 0.82 | 24.8 ms | 0.21 | 145. ms | −0.04 |
Ignoring the broad surface-related feature in the 7-M distribution on the surface, we see that the distributions observed on the surface and freely diffusing in solution are quite similar in width and position, leading us to conclude that the main peaks are representative of the fluctuating peptide with minimal contributions from surface interactions. The contribution of shot noise to the width may be deconvoluted by assuming a Gaussian form for the underlying distribution, as shown by the black-and-white curves in Fig. 3. The distributions are significantly broader than expected from the limit imposed by shot noise, as would be required if configurational averaging were incomplete on the 1.5-ms time scale. The evidence from the two types of distribution measurements and the correlation functions indicates that there are dynamic fluctuations in ØET that persist for t > 1.5 ms and that are independent of the surface.
At issue in all fluorescent resonant energy transfer experiments is the determination of R0, the Förster radius, in particular the contribution of the dipole angles in the donor acceptor pair occurring in the κ2 factor. For single-molecule experiments, there are three main considerations. The first is how adequately the molecule samples the available κ2 distribution on the time scale of the measurement. This averaging should be complete on the nanosecond time scale. The second is how often κ2 is sampled by the measurement. Enough photons are sampled in the present experiments to ensure that the κ2 distribution is statistically averaged. The final issue is the mean value of κ2. Often κ2 is set to its isotropically averaged value of 2/3. This is appropriate for the unfolded distribution, because the dyes should reorient rapidly in the time between observed photons. From the anisotropy decay of each dye, we can determine order parameters for the donor (0.58), for the acceptor (0.44), and for the energy transfer process (0.14) in the folded ensemble. This restricts the range for κ2 to 0.33 < κ2 < 2.3 and the Förster radius to 37 Å < R0 < 51 Å. This range accounts for some of the discrepancy between the folded interdye distances inferred from the known structure of GCN4 (≈15 Å) and observed values, which assume κ2 = 2/3, from measurements of bulk lifetime (23 Å), single molecules on the surface (27 Å), or freely diffusing (25 Å). This uncertainty in R0 should not contribute to the width of the distributions if rotational diffusion of the dyes is very fast compared with the observation time.
For a two-state system like GCN4-Pf, the folded state is expected to exhibit a narrow range of coordinates that reflect its well-defined geometry, whereas the unfolded state distribution should be broader. If the motional averaging within these distributions was sufficiently fast, their experimentally determined widths would be determined by the shot noise. The observed distributions for the molecules in solution, free from surface interactions, are significantly broader than shot noise. Therefore, the energy-transfer measurement senses the presence of motions on time scales comparable with or slower than the observation window of 1.5 ms. It is important to consider the origin of these slow motions, in particular the extent to which they are intrinsic to the peptide or associated with the donor and acceptor probe molecules. The slowness of the conformational averaging of the folded state was surprising given the well-defined structure of derivatives of GCN4-Pf (13, 14, 32). Even if the ends of the helices are more frayed than expected from the crystal structure, one might expect rapid conformational equilibrium on a time scale faster than 1.5 ms. This suggests that there might be contributions to the distributions and correlation functions from the slow conformational dynamics of dye–peptide-associated structures. On the other hand, the folding and unfolding kinetics of GCN4-p2 are known to be viscosity dependent (33), supporting the notion that near the transition state there are significant structure fluctuations, representing spatial diffusion near the barrier, which might occur on the time scale of folding. Future experiments with much shorter time resolution may permit the resolution of this question.
The power of single-molecule experiments is evident when we consider that within the accuracy of the measurement, we have an experimental measure of the trajectory of the folding and unfolding reactions as they occur repeatedly at equilibrium. Transition-state theory would predict discrete changes in r as the molecule jumps between the folded and unfolded states. In contrast, r will vary smoothly if the folding dynamics are more describable as a diffusive process on a free-energy surface with many ways of moving between folded and unfolded states. Understanding how the empirical folding coordinate r relates to actual distributions of structures is an important step in relating the observed distributions and correlation functions to protein folding. We observe a large distribution of D̄. This observation implies that conformational dynamics are occurring on a rugged landscape with a broad distribution of local barrier heights.
When energy transfer is the only mechanism of intensity modulation, the amplitude of the negative crosscorrelation would be the geometric mean of the autocorrelation amplitudes. Because such a relationship is not observed, energy transfer is not the only mechanism for modulating the signal. Variations in the colatitudes, θ, of the donor and acceptor transition dipoles can also modulate the signal. The θ dependence of the signal is within a few percent of sin2θ(1 + sin2θ) for our microscope (34). Thus, fluctuations of θ will increase the magnitude of the autocorrelation functions, and correlated fluctuations will make a positive contribution to the crosscorrelation effectively, canceling some of the negative crosscorrelation. Nevertheless, it is clear from the data that the signals are exhibiting dynamic modulation of the energy transfer distance.
If the protein fluctuates between a folded state and unfolded configurations, we would expect the time-correlation functions to exhibit an exponential decay with a time constant equal to the reciprocal of the sum of the folding and unfolding rates. The maximum amplitude of the correlation function would occur when the folded and unfolded occupancies are equal, at the midpoint of the titration curve. The magnitudes of the correlation functions at time 0 (Table 2) increase with urea concentration from 0 M to 3 M and decrease from 3 M to 7 M, consistent with the measured midpoint of the GCN4-Pf equilibrium of 3 M on the aminosilanized surface (9). The correlation functions we measure, however, exhibit nonexponential decays. Taken at face value, the presence of three exponentials in our averaged correlation functions requires a minimum of four states to be present in the folding free-energy surface. The slowest component has been assigned to surface-hindered conformational fluctuations. The fastest time scales are assigned to conformational dynamics that do not result in a folding transition. The intermediate times are attributed to folding/unfolding fluctuations, as discussed in the next paragraph.
An important finding of this work is that correlation analysis can be used to differentiate the motions within the folded and unfolded states from the process of exchange between these two states. An estimate of the rate of exchange between the folded and unfolded states may be obtained by subtracting contributions of fluctuations within those states from the correlation functions at 3 M urea. The resulting residual correlation, shown in Fig. 5 Top, is well described by a sum of two exponentials. The fit parameters depend somewhat on the subtraction. The larger component is 65–75% of the total with a decay rate of between 120 s−1 and 200 s−1, in good agreement with the relaxation rate of GCN4-Pf in bulk solution at 3 M urea(150 s−1). Thus we equate this process to the folding/unfolding reaction. A smaller-amplitude component with a considerably slower rate constant is likely a result of interactions with the surface. The time scale of the more rapid relaxation process is also consistent with measurements of the distributions of GCN4-Pf in solution. These observations were binned in 1.5-ms increments, which are 4- to 5-fold smaller than the relaxation time for folding (7 ms). With these time constants, the distribution at 3 M urea should show small but significant deviations from a linear combination of the folded and unfolded distributions. Indeed, we see that there is a reasonable, but not perfect, fit for the freely diffusing 1.5-ms distributions. In particular, the fit would be improved by a slight shift in the position of the unfolded distribution peak. This shift may also be an indication that the unfolded distribution varies with the concentration of chemical denaturant. Although the system behaves macroscopically as a two-state system, the data show that the donor and acceptor probes somehow persist in subconfigurations within the folded or unfolded ensembles for times comparable to that of folding.
In conclusion, this paper provides a direct analysis of the trajectories of folding of a small model protein undergoing exchange between folded and unfolded states. The data are consistent with the bulk macroscopic data, but provide additional information on the end-to-end distance distributions, potentials of mean force (9), diffusion coefficients, and folding mechanism. Further refinements of this technique will examine molecule-to-molecule variations in these parameters, particularly as they relate to the folding/unfolding process.
Acknowledgments
This work was supported by GM54616 (to W.F.D.), GM12592 (to R.M.H.) and GM48130 (to W.F.D. and R.M.H.) with instrumentation developed under RR01348. D.S.T. was supported by National Institutes of Health Grant NRSA F32-GM18589.
References
- 1.Xie X S, Trautman J K. Annu Rev Phys Chem. 1998;49:441–480. doi: 10.1146/annurev.physchem.49.1.441. [DOI] [PubMed] [Google Scholar]
- 2.Funatsu T, Harada Y, Tokunaga M, Saito K, Yanagida T. Nature (London) 1995;374:555–559. doi: 10.1038/374555a0. [DOI] [PubMed] [Google Scholar]
- 3.Geva E, Skinner J L. Chem Phys Lett. 1998;288:225–229. [Google Scholar]
- 4.Ishijima A, Kojima H, Funatsu T, Tokunaga M, Higuchi H, Tanaka H, Yanagida T. Cell. 1998;92:161–171. doi: 10.1016/s0092-8674(00)80911-3. [DOI] [PubMed] [Google Scholar]
- 5.Lu H P, Xun L, Xie X S. Science. 1998;282:1877–1882. doi: 10.1126/science.282.5395.1877. [DOI] [PubMed] [Google Scholar]
- 6.Warshaw D M, Hayes E, Gaffney D, Lauzon A M, Wu J, Kennedy G, Trybus K, Lowey S, Berger C. Proc Natl Acad Sci USA. 1998;95:8034–8039. doi: 10.1073/pnas.95.14.8034. [DOI] [PMC free article] [PubMed] [Google Scholar]
- 7.Ying L M, Xie X S. J Phys Chem B. 1998;102:10399–10409. [Google Scholar]
- 8.Jia Y, Sytnik S, Li L, Vladimirov S, Cooperman B S, Hochstrasser R M. Proc Natl Acad Sci USA. 1997;94:7932–7936. doi: 10.1073/pnas.94.15.7932. [DOI] [PMC free article] [PubMed] [Google Scholar]
- 9.Jia Y, Talaga D S, Lau W L, Lu H S M, DeGrado W F, Hochstrasser R M. Chem Phys. 1999;247:69–83. [Google Scholar]
- 10.Ha T, Ting A Y, Liang J, Caldwell W B, Deniz A A, Chemla D S, Schultz P G, Weiss S. Proc Natl Acad Sci USA. 1999;96:893–898. doi: 10.1073/pnas.96.3.893. [DOI] [PMC free article] [PubMed] [Google Scholar]
- 11.Deniz A A, Laurence T A, Beligere G S, Dahan M, Martin A B, Chemla D S, Dawson P E, Schultz P G, Weiss S. Proc Natl Acad Sci USA. 2000;97:5179–5184. doi: 10.1073/pnas.090104997. [DOI] [PMC free article] [PubMed] [Google Scholar]
- 12.Fisher T E, Oberhauser A F, Carrion-Vazquez M, Marszalek P E, Fernandez J M. Trends Biochem Sci. 1999;24:379–384. doi: 10.1016/s0968-0004(99)01453-x. [DOI] [PubMed] [Google Scholar]
- 13.O'Shea E K, Klemm J D, Kim P D, Alber T. Science. 1991;254:539–544. doi: 10.1126/science.1948029. [DOI] [PubMed] [Google Scholar]
- 14.Ellenberger T E, Brandl C J, Struhl K, Harrison S C. Cell. 1992;71:1223–1237. doi: 10.1016/s0092-8674(05)80070-4. [DOI] [PubMed] [Google Scholar]
- 15.O'Shea E K, Rutkowski R, Kim P S. Science. 1989;243:538–542. doi: 10.1126/science.2911757. [DOI] [PubMed] [Google Scholar]
- 16.Lumb K J, Carr C M, Kim P S. Biochemistry. 1994;33:7361–7367. doi: 10.1021/bi00189a042. [DOI] [PubMed] [Google Scholar]
- 17.Jelesarov I, Durr E, Thomas R M, Bosshard H R. Biochemistry. 1998;37:7539–7550. doi: 10.1021/bi972977v. [DOI] [PubMed] [Google Scholar]
- 18.Durr E, Jelesarov I, Bosshard H R. Biochemistry. 1999;38:870–880. doi: 10.1021/bi981891e. [DOI] [PubMed] [Google Scholar]
- 19.Wendt H, Leder L, Harma H, Jelesarov I, Baici A, Bosshard H R. Biochemistry. 1997;36:204–213. doi: 10.1021/bi961672y. [DOI] [PubMed] [Google Scholar]
- 20.Wendt H, Berger C, Baici A, Thomas R M, Bosshard H R. Biochemistry. 1995;34:4097–4107. doi: 10.1021/bi00012a028. [DOI] [PubMed] [Google Scholar]
- 21.Wendt H, Baici A, Bosshard H R. J Am Chem Soc. 1994;116:6973–6974. [Google Scholar]
- 22.Zitzewitz J A, Bilsel O, Luo J, Jones B E, Matthews C R. Biochemistry. 1995;34:12812–12819. doi: 10.1021/bi00039a042. [DOI] [PubMed] [Google Scholar]
- 23.Ozeki S, Kato T, Holtzer M E, Holtzer A. Biopolymers. 1991;31:957–966. doi: 10.1002/bip.360310805. [DOI] [PubMed] [Google Scholar]
- 24.Sosnick T R, Jackson S, Wilk R R, Englander S W, DeGrado W F. Proteins. 1996;24:427–432. doi: 10.1002/(SICI)1097-0134(199604)24:4<427::AID-PROT2>3.0.CO;2-B. [DOI] [PubMed] [Google Scholar]
- 25.Lu H P, Xie X S. Nature (London) 1997;385:143–146. [Google Scholar]
- 26.Trautman J K, Macklin J J, Brus L E, Betzig E. Nature (London) 1994;369:40–42. [Google Scholar]
- 27.Ha T, Enderle T, Chemla D S, Selvin P R, Weiss S. Phys Rev Lett. 1996;77:3979–3982. doi: 10.1103/PhysRevLett.77.3979. [DOI] [PubMed] [Google Scholar]
- 28.Ha T, Enderle T, Chemla D S, Selvin P R, Weiss S. Chem Phys Lett. 1997;271:1–5. [Google Scholar]
- 29.Basche T, Kummer S, Brauchle C. Nature (London) 1995;373:132–134. [Google Scholar]
- 30.Press W H, Teukolsky S A, Vetterling W T, Flannery B T. Numerical Recipes in FORTRAN: The Art of Scientific Computing. Cambridge, U.K.: Cambridge Univ. Press; 1997. [Google Scholar]
- 31.Streyer L. Annu Rev Biochem. 1978;47:819–846. doi: 10.1146/annurev.bi.47.070178.004131. [DOI] [PubMed] [Google Scholar]
- 32.Oas T G, McIntosh L P, O'Shea E K, Dahlquist F W, Kim P S. Biochemistry. 1990;29:2891–2894. doi: 10.1021/bi00464a001. [DOI] [PubMed] [Google Scholar]
- 33.Bhattacharyya R P, Sosnick T R. Biochemistry. 1999;38:2601–2609. doi: 10.1021/bi982209j. [DOI] [PubMed] [Google Scholar]
- 34.Bopp M A, Jia Y, Haran G, Morlino E A, Hochstrasser R M. Appl Phys Lett. 1998;73:7–9. [Google Scholar]


