

Abstract
The expression of microRNA in nonalcoholic steatohepatitis (NASH) and their role in the genesis of NASH are not known. The aims of this study were to: (1) identify differentially expressed microRNAs in human NASH, (2) tabulate their potential targets, (3) define the effect of a specific differentially expressed microRNA, miR-122, on its targets and compare these effects to the pattern of expression of these targets in human NASH. The expression of 474 human microRNAs was compared in subjects with the metabolic syndrome and NASH vs. controls with normal liver histology. Differentially expressed microRNAs were identified by the μParaflo™ microRNA microarray assay and validated using quantitative real-time PCR. The effects of miR-122 on its predicted targets were assessed by silencing and over-expressing miR-122 in vitro. A total of 23 microRNAs each was under- or over-expressed. The predicted targets of these microRNAs are known to affect cell proliferation, protein translation, apoptosis, inflammation, oxidative stress and metabolism. miR-122 level was significantly decreased in subjects with NASH (63% by real-time PCR, p< 0.00001). Silencing miR-122 led to an initial increase in mRNA levels of these targets (p< 0.05 for all) followed by a decrease by 48hrs. This was accompanied by an increase in protein levels of these targets (p< 0.05 for all). Over-expression of miR-122 led to a significant decrease in protein levels of these targets.
Conclusions
NASH is associated with altered hepatic microRNA expression. Under-expression of miR-122 potentially contributes to altered lipid metabolism implicated in the pathogenesis of NASH.
Keywords: Nonalcoholic fatty liver, lipogenesis, inflammation, insulin resistance, unfolded protein response
INTRODUCTION
Nonalcoholic steatohepatitis (NASH) is part of a spectrum of nonalcoholic fatty liver disease (NAFLD) and can progress to cirrhosis in 15% of subjects (1). The mechanisms by which NASH develops and progresses to cirrhosis have not been fully defined.
MicroRNAs (miRNA) are non-protein-coding, small single-stranded RNA, typically 21-23 nucleotides long that regulate gene expression via mRNA degradation and/or translational inhibition (2, 3). Currently, 873 human miRNAs have been identified (miRBase 11.0, April 2008). Their expression is both organ-specific and dependent on the stage of development (4, 5). miRNAs also regulate other important cellular processes e.g. metabolism, immune function, cell proliferation, apoptosis, tissue development and differentiation (6-10). These may be particularly germane to the genesis of NASH which is characterized by abnormal lipid metabolism, activation of apoptosis, cellular regenerative responses and inflammation (11). There are currently no published data on the patterns of hepatic miRNA expression in NASH.
The aims of this study were to: (1) identify differentially expressed miRNAs in human NASH and validate these independently, (2) tabulate potential targets of differentially expressed miRNAs, and (3) evaluate and compare the effects of silencing and over-expression of a specific differentially expressed miRNA, miR-122 that is known to target hepatic lipogenic genes on the pattern of lipogenic gene expression in human NASH. It is hoped that these data would serve as the basis for future hypothesis generation and hypothesis-driven studies of the role of miRNAs in hepatic lipid metabolism and pathogenesis of NASH.
MATERIALS AND METHODS
Study population
Consecutive subjects with the metabolic syndrome with or without suspected NAFLD were considered for this study, which was approved by the institutional review board. Informed consent was obtained and each subject underwent routine clinical assessment, radiologic, hematologic, biochemical, and serologic testing. The metabolic syndrome was diagnosed using the Adult Treatment Panel III criteria (12). Alcohol consumption was assessed clinically and considered to be significant when > 20 gm/day for females and > 30 gm/day for males. NAFLD was suspected in those with (a) either abnormal liver enzymes or radiologic evidence of a fatty liver and negative study for other common etiologies of liver disease, and (b) absence of clinically significant alcohol consumption.
Subjects who gave informed consent underwent a percutaneous core liver biopsy with a 15-gauge Microvasive® biopsy device under ultrasound or laparoscopic guidance. One liver core was fixed in formalin for histologic assessment while another was snap frozen in liquid nitrogen and stored at -80°C for future studies. Each liver biopsy was fixed and stained with hematoxylin and eosin, and Masson’s trichrome stain. All biopsies were evaluated by a single pathologist and scored using the NASH clinical research network criteria (13). Steatohepatitis was defined by the presence of steatosis, cytologic ballooning and inflammation (13). Based on the laboratory, sonographic and histologic findings, subjects were selected and classified as follows: Test group: NASH, control group: normal liver histology, ultrasound and liver enzymes. Exclusion criteria included a fatty liver alone, cirrhosis or bridging fibrosis, a liver biopsy < 2 cm long for histologic characterization and the use of statins.
The identification of differentially expressed miRNAs in NASH was performed in two phases. The first involved a comparison of hepatic expression of all known human miRNAs at the time of these studies (based on miRBase 9.2, 2007, n=474 targets) in a set of 15 subjects with NASH vs. 15 controls using a micro-array chip assay (LC Sciences, Houston, TX). These study findings were further validated by quantitative real-time PCR (RT-PCR) in a total of 25 subjects with NASH and 25 controls, as defined above.
RNA preparation, miRNA purity assessment and μParaflo™ microRNA microarray assay
Total RNA was extracted from 10 mg of liver tissue (∼1 cm biopsy length) using Trizol (Invitrogen, Carlsbad, CA) for both RT-PCR and microarray studies. For the microarray assay, prior to hybridization, RNA quality was further assessed by the UV spectrum intensity ratio (A260:A280 > 1.8) and the 28S:18S RNA ratio using the RNA 6000 Nano assay reagent kit (Agilent, Palo Alto, CA, P/N G2938-90030) and the eukaryote total RNA Nano assay (14). The presence of small RNA was detected in each sample from the corresponding peaks in the RNA electropherogram.
A challenge in miRNA studies is avoidance of contamination by other small RNA species e.g. precursor miRNA and also separation of mature miRNAs from longer hairpin and pri-miRNA molecules. These were accomplished by isolation, separation and purification of miRNAs using the Ambion flashPAGE™ fractionater system (Ambion, Austin, TX) according to manufacturer protocols. The absence of precursor miRNA contamination was further confirmed by adding miRNA precursor detection probes complementary to the precursor hairpin loops to the microarray chips. At assay conditions optimized for mature miRNA detection, none of the differentially expressed miRNAs reported in this study had a corresponding precursor signal above detection level.
Microarray analysis was done using miRBase 9.2 probe content and performed as previously published (15). 4-8 μg of total RNA was size-fractionated using YM-100 Microcon centrifugal filter (Millipore, Billerica, MA). Small RNAs (<300nt) isolated were 3′-extended with a poly(A) tail using poly(A) polymerase. An oligonucleotide tag was ligated to the poly(A) tail for fluorescent dye staining (Cy3 and Cy5 were used for the two RNA samples in dual-sample experiments). Hybridization was performed overnight on a μParaflo microfluidic chip using a micro-circulation pump (Atactic Technologies) (16, 17). On the microfluidic chip, each detection probe consisted of a chemically modified nucleotide coding segment complementary to target miRNA (miRBase and sanger.ac.uk) or other RNA (control sequences) and a spacer segment of polyethylene glycol to extend the coding segment away from the substrate. After RNA hybridization, tag-conjugating Cy3 and Cy5 dyes were circulated through the microfluidic chip for dye staining. Fluorescence images were collected using a laser scanner (GenePix 4000B, Molecular Device) and digitized using Array-Pro image analysis software (Media Cybernetics).
RT-PCR measurement of miRNA expression
Differentially expressed miRNAs in NASH were defined as those detected with a signal change (vs. controls) in any direction with a p-value < 0.05, a minimum signal intensity > 500 and a significance analysis of microarray (SAM) test with a q-value < 5%. Four miRNAs were selected for RT-PCR validation. Two were randomly selected from over-expressed miRNAs (miR-34a, miR-146b), one from under-expressed miRNAs (miR-122) and one that was not significantly altered (miR-451). Total RNA was isolated and extracted from frozen liver tissues as previously stated. cDNA was synthesized using TaqMan MicroRNA Reverse Transcriptase (Applied Biosystems (ABI), Foster City, CA) according to manufacturer’s instructions. RT-PCR was performed with the RT product, TaqMan Gene Expression Master Mix, primers and probe mix (TaqMan MicroRNA Assay kit, ABI) which was incubated in a 96-well plate at 95°C for 10 min, followed by 40 cycles of 95°C for 15s and 60°C for 10 min. The relative abundance of miRNA was normalized to small nuclear RNA U6 (RNU6B, ABI) and was expressed as percent change, either increase or decrease, in NASH vs. controls. RT-PCR primer sequences are the exact antisense copy of the mature miRNA sequence that can be found in the miRNA registry (18).
RT- PCR for mRNA expression of several lipogenic genes
RT-PCR was performed to examine the mRNA expression of several predicted miR-122 gene targets: fatty acid synthetase (FAS), HMG CoA reductase (HMGCR) and their transcriptional activators, the sterol-response-element-binding protein-1c and 2 (SREBP-1c, SREBP-2). Following reverse transcription (ThermoScript Reverse Transcriptase kit, Invitrogen), RT-PCR was performed using SYBR Green PCR master mix (BioRad, Hercules, CA) on an ABI Prism 7300 Sequence Detection System with the following conditions: 50°C for 2 min and then at 95°C for 10 min followed by 40 cycles of amplification (95°C for 15s; 60°C for 30s; 80°C for 30s). Glyceraldehyde-3-phosphate dehydrogenase was used as the endogenous normalizer. Primer sequences are shown in table 1.
Table 1.
Quantitative real-time PCR primer sequences
| Primer | Sequence (5′ to 3′) | Name |
|---|---|---|
| SREBP-1c | CAGCCCCACTTCATCAAGG (F) ACTGTTGCCAAGATGGTTCCG (R) |
Sterol regulatory element binding protein 1c |
| SREBP-2 | AACGGTCATTCACCCAGGTC (F) GGCTGAAGAATAGGAGTTGCC (R) |
Sterol regulatory element binding protein 2 |
| ACC | TCGCTTTGGGGGAAATAAAGTG (F) ACCACCTACGGATAGACCGC (R) |
Acetyl CoA carboxylase |
| FAS | TGTGGACATGGTCACGGAC (F) GGCATCAAACCTAGACAGGTC (R) |
Fatty acid synthetase |
| HMGCR | GTCATTCCAGCCAAGGTTGT (F) TCCTGTCCACAGGCAATGTA (R) |
3-hydroxy-3methylglutaryl-coenzymeA reductase |
| GAPDH | CAATGACCCCTTCATTGACC (F) TTGATTTTGGAGGGATCTCG (R) |
Glyceraldehyde-3-phosphate dehydrogenase |
F, forward; R, reverse
Identification of potential miRNA gene targets
Predicted gene targets of all differentially expressed miRNAs were identified using several databases including microrna.org, sanger.ac.uk, cbio.mskcc.org, ebi.ac.uk/interpro/, PicTar and TargetScan. For genes that were not elucidated from these resources, pubmed literature search was performed. All predicted targets identified in any database were then categorized into different functional classes identified using the gene ontology (GO)-molecular function hierarchy (www.geneontology.org). Genes with functions that are potentially relevant to the pathogenesis of NASH, i.e. lipid and glucose metabolism, inflammation, oxidative stress and cellular response, apoptosis, cell growth and differentiation, translation regulation and protein processing were sorted for presentation in supplementary tables S1-S6 (for online display). Within major gene families, gene targets that are commonly studied and/or are of active interest in the context of NASH e.g. lipogenesis (e.g. FAS), inflammation (c-JUN kinase) were summarized for inclusion in the body of the manuscript (table 4).
Table 4.
MicroRNA gene targets
| Functional class | Gene target | Overexpressed miRNA | Underexpressed miRNA |
|---|---|---|---|
| Transcription factors | Homeobox protein (HOX) | 146b, 199a*, 455, 128b, 128a, 127, 214 99b, 181b, 27b, 100, 16, 23a, 23b, 125b |
188, 191*, 139, 145, 92b, 122, 26b |
| Sex-determining region Y-box (SOX) | 224, 34a, 200a, 199a*, 128b, 214, 99b, 214, 99b, 181b, 24, 27b, 23a, 23b, 125b |
188, 145, 203, 92, 361, 122, 30d, 26b 28, 126 |
|
| Hepatocyte nuclear factors (HNF) | 146b, 214, 23b | 617, 375, 92b, 26b | |
| Protein synthesis and processing |
Eukaryotic translation initiation factor (eIF) | 23a, 23b, 146b, 128a, 128b, 199a*, 100 125b, 13b, 27b, 16, 139, 214, 181b |
122, 188, 191*, 92b, 26b, 145, 139 |
| Ubiquitin conjugating enzymes (UBE) | 16, 23b, 146b, 27b, 199a*, 16, 128a, 128b 125b, 214 |
122, 139, 145, 92b, 188, 191*, 26b | |
| X-box binding protein 1 (XBP1), EDEM | 34a, 125b, 200a, 214 | ||
| Oxidative stress response | Cytochrome C-oxidase | 99b, 423, 27b, 127, 128a, 128b | 601, 198, 361, 563 |
| Biliverdin reductase | 99b, 100, 221 | ||
| Cell growth and cell cycle | Interferon regulatory factor (IRF) | 16, 24, 23a, 23b, 125b, 128a, 128b, 214 | 145, 26b |
| Cyclin dependent kinases (CDK) | 34a, 199a*, 99b | 26, 122 | |
| Phosphatidylinositol kinases (PIK) | 23b, 27b | 26b, 145 | |
| MYCN | 122 | ||
| Cell differentiation | FAD104, AEBP2, MMD | 23b, 125b, 181a, 214, 146b, 23b, 146b 16, 27b, 30d |
26b, 122, 145, 139 122, 375, 92b |
| Anti-apoptosis | BCL2L (1, 2), AVEN | 16, 24, 214, 200a | 145, 92b |
| Pro-apoptosis | BCL2L (7, 11) | 27b, 125b, 16, 24, 181, 199a*, 224, 24, 214, 221, 222 |
26b, 92b |
| PDCD4, GAS1 | 16, 21, 199a*, 200a, 34a | 122, 145 | |
| PHLDA2 | 16, 24, 128a, 128b, 181b, 199a*, 423 | 188, 375 | |
| Anti-inflammatory | Suppressor of cytokine signaling (SOCS), IL4 | 16, 199a*, 214, 23a, 23b, 27b, 125b 128a, 128b, 181b |
139, 188, 191* |
| Pro-inflammatory | Mitogen activated protein kinases (MAPK) | 23b, 125b, 199a*, 214, 27b, 128a, 128b 16, 181b, 23a |
145, 188, 191*, 92b, 139 |
| C-jun kinase | 27b, 128a, 128b, 214 | ||
| Interleukin precursors | 125, 214, 16, 128a, 128b, 23b | 122, 188, 191* | |
| RAS related proteins | 16, 23a, 23b, 27b, 214, 146b, 125b, 127 199a*, 128a, 128b |
149, 26b, 122, 139, 126, 145 | |
| Cholesterol metabolism | Oxysterol binding proteins | 128b, 146b, 214, 181b, 23a, 23b, 199a* 200a, 221, 125b, 27b, 224 |
145, 26b, 188, 191* |
| HMGCR, ACAT | 125b, 224 | 122, 145, 188, 375 | |
| Oxysterol receptor LXR | 423 | 145, 191*, 375, 574, 92b, 139 | |
| Fatty acid metabolism | PPAR, ACSL, ACC, DGAT, SREBP, ACLY, FAS | 128a, 128b, 146, 24, 125b, 214, 23b, 16 | 188, 122, 26b, 145, 191* |
| AMPK, SCD, FABP, LDLR, VLDLR, ELOV | 30d, 199a*, 23a, 181b, 200a | 203 | |
| Carbohydrate metabolism | ALDOA, GYS, glycogenin, PRKC, PYGL | 23b, 27b, 34a, 221, 21, 125b, 128b, 181b 222 |
122, 145, 375 |
| Insulin signaling | IRS1, myotrophin, Islet1 | 23a, 16, 27b, 128a, 128b | 375 |
Gene abbreviations were adopted from Ensembl and NCBI
Functional validation of a differentially expressed miRNA (miR-122)
miR-122, the most abundant miRNA in the liver was under-expressed in NASH (p< 0.05) (19), has been shown to be involved in lipid and cholesterol metabolism (6, 20), which are at the core of fatty liver disease. This miRNA was therefore chosen for functional validation study using both HepG2 (time course) and Huh7 cells (24 hrs transfection) by both silencing and over-expressing miR-122 (anti-miR and pre-miR, Ambion) using reverse transfection as recommended by the manufacturer (catalog# AM1540, Ambion). Control experiments were conducted simultaneously using negative control RNA duplex (Ambion) and optiMEM culture medium (Invitrogen). The mRNA and protein expression of predicted lipogenic gene targets of miR-122 including FAS, HMGCR and their respective transcription factors SREBP-1c and SREBP-2 was measured by real time PCR and Western blot respectively. A common internal calibrator was used across all experiments.
Western blot analysis
Cells were lysed and human liver tissue homogenized using lysis buffer (Sigma, St. Louis MO, Cat # C2978). Cell and tissue lysate (25μg protein/lane for cells and 20ug protein/lane for liver tissue lysate) was separated by 4-12% Bis-Tris Nu-PAGE gel (Invitrogen) and transferred using a standard protocol. The membranes were incubated with antibodies against FAS, HMGCR, SREBP-1c and SREBP-2 (Santa Cruz Biotechnology Inc, Santa Cruz, CA). Signals obtained were normalized to beta-actin (Santa Cruz) for both nuclear (SREBP-1c and SREBP-2) and cytoplasmic extracts as previously published and used as a loading control (21-23).
Data analysis
The signal value for each probe was considered to be detectable if it met two conditions: (1) signal intensity > 3x background standard deviation, and (2) spot CV< 0.5 where CV=standard deviation/signal intensity. For repeating probes, transcript was listed as detectable only if ≥ 50% of the repeating probes were above detection level. Following subtraction of background signal, data for individual probes were normalized to remove system-related variations. Normalization was performed using cyclic LOWESS (locally-weighted regression) method as previously described (24). Additional data adjustment included data filtering, log2 transformation and gene centering. Data filtering was used to remove miRNAs with normalized intensity values < 32 across all samples (25). The intensities of individual signals were converted to a log2 scale and transformed as follows: value= [(value)-mean(gene)/[standard deviation(gene)] (26). The relative expression of differentially expressed miRNAs (p< 0.05) was presented as a log2 ratio of (mean signal intensity of NASH vs. control). T-tests were performed between “control” and “test” groups and T-values were calculated for each miRNA. P-values were computed from the theoretical t-distribution (26). Differentially expressed miRNAs with significant p-values (< 0.05) were selected for cluster analysis using a hierarchical method with average linkage and Euclidean distance metric (27). Clustering plots were generated using TIGR MeV (Multiple Experimental Viewer) software from the Institute for Genomic Research. Significant analysis of microarrays (SAM) were also employed to assess “significant” by chance and used to calculate a score for each miRNA on the basis of the change in expression relative to the standard deviation of all measurements. The score was presented as a q-value and expressed in % (q-value < 5% by SAM test corresponds to p-value < 0.05 by T-test) (28).
RESULTS
Patient characteristics (table 2)
Table 2.
Clinical and demographic data of subjects with NASH and matched controls with normal liver histology
| NASH (n=25) Mean ± S.D. |
Normal controls (n=25) Mean ± S.D. |
|
|---|---|---|
| Mean age (years) | 52.5 ** | 40.3 |
| Body mass index (kg/m2) | 35 | 39.54 |
| Gender | ||
| # Female | 19/25 | 22/25 |
| # Male | 6/25 | 3/25 |
| Ethnicity | ||
| # African American | 3/25 | 4/25 |
| # Caucasian | 21/25 | 20/25 |
| # Hispanic/Other | 1/25 | 1/25 |
| Metabolic risks | ||
| # Diabetes mellitus type II | 11/25 | 7/25 |
| # Dyslipidemia | 8/25 | 7/25 |
| Laboratory values | ||
| Aspartate aminotransferase (U/L) | 69.7 *** | 30.3 |
| Alanine aminotransferase (U/L) | 106.3 *** | 35.9 |
| Alkaline phosphatase (U/L) | 104 ** | 80.4 |
| Total bilirubin (mg/dl) | 0.55 | 0.43 |
| Albumin (mg/dl) | 4.43 | 4.44 |
| Fasting blood glucose (mg/dl) | 115 | 119 |
| Total cholesterol (mg/dl) | 214 | 176 |
| Low density lipoprotein (mg/dl) | 140 * | 94 |
| High density lipoprotein (mg/dl) | 57 | 51 |
| Triglyceride (mg/dl) | 177 ** | 67 |
| Liver histology | ||
| Steatosis | 2.5 ± 0.3*** | 0 |
| Cytologic ballooning | 1.8 ± 0.3*** | 0 |
| Mallory hyaline | 0.9 ± 0.4*** | 0 |
| Lobular inflammation | 1.8 ± 0.4*** | 0 |
| Pericellular fibrosis | 0.9 ± 0.2*** | 0 |
Hyperlipidemia is present if total cholesterol is greater than 200 mg/dl based on the Adult Treatment Plan III criteria and the American Heart Association guidelines
P < 0.0005
P < 0.02
P < 0.05
Two groups of subjects were screened: (1) those with metabolic syndrome with abnormal liver enzymes or hepatic imaging suggestive of NAFLD and (2) those with metabolic syndrome and clinical factors that led them to be referred for evaluation for NAFLD e.g. hepatomegaly, body mass index (BMI) > 35 or diabetes. Of the first group, none of the 23 subjects screened refused a biopsy. Of the latter, 32 subjects were screened and 27 underwent a biopsy. All 5 subjects who did not get a biopsy refused the procedure. Test and control subjects were matched with respect to gender, race, BMI and features of the metabolic syndrome. As expected, subjects with NASH had higher aspartate aminotransferase and alanine aminotransferase levels than control subjects. NASH subjects were older than matched controls (52.5 yrs vs. 40.3 yrs, p< 0.02), and had significantly higher low density lipoprotein and triglyceride levels compared to the control group.
miRNA expression profile in subjects with NASH (figure 1, table 3)
Figure 1. Cluster analysis of differentially expressed miRNAs (p< 0.05).
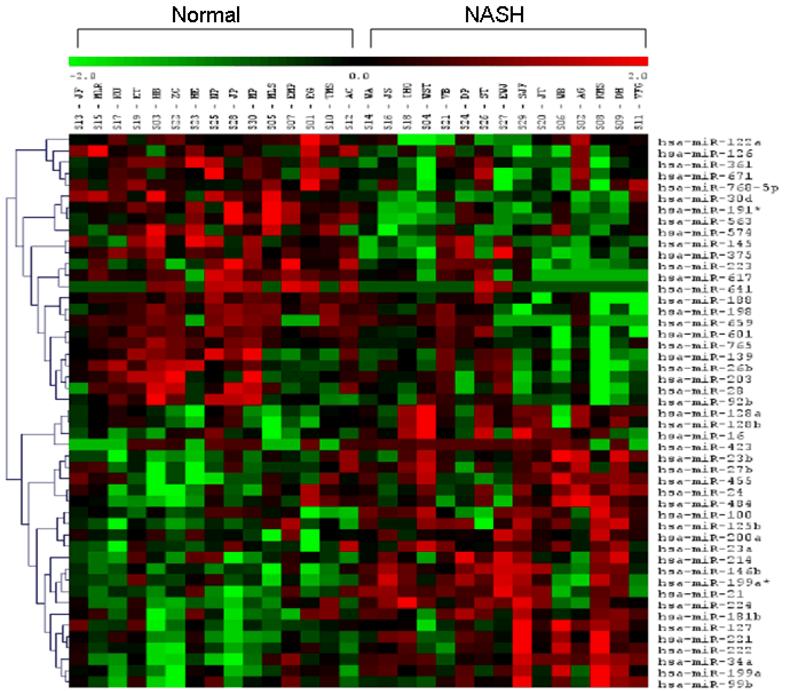
miRNA signature in liver from patients with NASH and normal controls. Signal intensity was expressed as log2 ratio between NASH and controls. Bright green, under-expression; black, no change; bright red, over-expression.
Table 3.
Log2 (NASH/normal) ratio of differentially expressed miRNAs that reached statistical significance by T-test (p< 0.05) and further confirmed by SAM test (q< 5%)
| Under-expressed microRNAs (n=23) | Over-expressed microRNAs (n=23) | ||||
|---|---|---|---|---|---|
| miRNAs | Log2 (NASH/normal) ratio |
q value (%) |
miRNAs | Log2 (NASH/normal) ratio |
q value (%) |
| miR-126 | -0.21 | 0 | miR-125b | 0.18 | 0 |
| miR-28 | -0.22 | 3.44 | miR-23a | 0.18 | 2.87 |
| miR-26b | -0.25 | 0 | miR-23b | 0.20 | 0 |
| miR-30d | -0.27 | 0 | miR-16 | 0.22 | 2.22 |
| miR-122 | -0.29 | 3.44 | miR-100 | 0.23 | 2.22 |
| miR-361 | -0.31 | 3.82 | miR-27b | 0.26 | 2.22 |
| miR-574 | -0.31 | 4.8 | miR-24 | 0.28 | 3.93 |
| miR-92b | -0.33 | 4.49 | miR-181b | 0.28 | 2.22 |
| miR-768-5p | -0.33 | 3.44 | miR-99b | 0.33 | 3.93 |
| miR-375 | -0.50 | 0 | miR-214 | 0.37 | 2.22 |
| miR-203 | -0.55 | 3.44 | miR-127 | 0.40 | 3.93 |
| miR-223 | -0.60 | 4.59 | miR-128a | 0.43 | 2.87 |
| miR-145 | -0.61 | 0 | miR-21 | 0.44 | 0 |
| miR-671 | -0.65 | 4.59 | miR-128b | 0.47 | 2.22 |
| miR-139 | -0.91 | 4.91 | miR-455 | 0.48 | 2.22 |
| miR-191* | -1.00 | 0 | miR-199a* | 0.50 | 0 |
| miR-563 | -1.05 | 0 | miR-221 | 0.65 | 0 |
| miR-188 | -1.11 | 0 | miR-199a | 0.75 | 0 |
| miR-601 | -1.19 | 0 | miR-222 | 0.90 | 0 |
| miR-765 | -1.29 | 0 | miR-146b | 1.21 | 0 |
| miR-198 | -1.76 | 0 | miR-200a | 1.25 | 3.93 |
| miR-641 | -1.77 | 4.91 | miR-34a | 1.27 | 0 |
| miR-617 | -2.06 | 0 | miR-224 | 1.35 | 0 |
A q-value of < 5% by SAM test corresponds to a p-value of < 0.05 by T-test
Expression of miR-199a excised from the 5′ arm was validated in zebrafish, and the ends mapped by cloning. miR-199a* (excised from the 3′ arm) (miRBase)
Of the 474 miRNAs that were probed, 46 were differentially expressed in subjects with NASH. These are shown visually in the cluster analysis (figure 1). 23/46 were over-expressed (log2 (NASH/control) range: 0.18-1.35) while 23/46 were under-expressed (log2 (NASH/normal) range: -0.21 to -2.06) (table 3). All 46 differentially expressed miRNAs had a q-value < 5% (SAM test) corroborating that the observed changes were indeed significantly different compared to controls. Thus, NASH was associated with differential expression of 46 miRNAs that met significance both by T-test and SAM test.
Validation of miRNA CHIP data (figure 2)
Figure 2. Quantitative RT-PCR validation of miRNA expression.
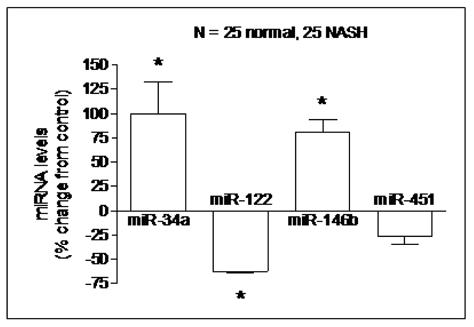
The relative abundance of four specific miRNAs (25 NASH vs. 25 controls) was measured using RT-PCR and expressed as mean % change ± S.E.M. after normalization to GAPDH. miR-34a and miR-146b were confirmed to be overexpressed by 99% and 80% respectively while miR-122 was confirmed to be underexpressed by 63% (p< 0.02 for all). The expression of miR-451, which was not differentially expressed by microarray, was confirmed not to be significantly different between the two groups.
RT-PCR was used to validate the microarray analysis findings. The relative expressions, expressed as % change from controls of the four chosen miRNAs (miR-34a, miR-122, miR-146b, and miR-451) are shown in figure 2. These data confirmed that miR-34a and miR-146b were over-expressed in NASH while miR-122 expression was decreased (p< 0.02 for all). The expression of miR-451, which was not significantly different from controls, was also confirmed not to be significantly different between the two groups. The expression levels of these miRNAs did not correlate with the severity of individual histologic features of NASH.
Multiplicity and cooperativity in miRNA-target interactions (figure 3)
Figure 3. Multiplicity and cooperativity of miRNA-target interactions of differentially expressed miRNAs (p< 0.05).

One miRNA can target more than one gene (multiplicity) and one gene can be regulated by more than one miRNA (cooperativity). The distributions for multiplicity and cooperativity were based on (1) log2 rank of differentially expressed miRNAs vs. number of gene targets (based on targets presented in tables S1-S6), and (2) log2 rank of gene targets vs. number of miRNAs directed at them, respectively. Multiplicity and cooperativity of differentially over-expressed miRNAs were shown in panels a, c respectively, and differentially under-expressed miRNAs were shown in (b) and (d) respectively. Distributions decayed exponentially. Very few over- and under-expressed miRNAs regulated over 40 predicted targets (top left a-b), but most miRNAs controlled only a few genes (bottom right a-b). A few targets appeared to be under highly cooperative miRNA regulation (top left c-d), but most genes were targeted by fewer than four differentially expressed miRNAs (bottom right c-d).
One miRNA can target multiple genes (multiplicity) and multiple miRNAs may target a single gene (cooperativity). As shown in figure 3, these were evaluated by plotting (1) log2 rank of all 46 differentially expressed miRNAs (23 over-expressed, 23 under-expressed) vs. their corresponding number of selected gene targets as presented in tables S1-S6 (multiplicity), and (2) log2 rank of these gene targets vs. number of differentially miRNAs directed at them (cooperativity). Two over-expressed miRNAs (miR-23b, miR-16) and one under-expressed miRNA (miR-122) had > 40 selected targets (figures 3a, 3b respectively). 11/23 over-expressed and 17/23 under-expressed miRNAs had < 10 selected targets. Of the selected genes whose products could be potentially affected by altered miRNA expression in NASH, most were targeted by < 4 differentially expressed miRNAs (figures 3c, 3d).
Potential gene targets of differentially expressed miRNAs (table 4, supplementary tables S1-S6 for online display)
Some potential targets of differentially expressed miRNAs are specifically pertinent to the pathogenesis of NASH. These included a number of transcription factors, key elements of protein translation and processing, apoptosis, cellular growth and differentiation, inflammation and metabolism (table 4, supplementary tables S1-S6). Key metabolic targets included cytochrome oxidase, biliverdin reductase and several hepatic lipogenic enzymes. Sleep apnea and intermittent hypoxia has been postulated as a cofactor for liver injury in NASH (29, 30). Interestingly, all of the known hypoxia-inducible miRNAs were over-expressed in NASH with the exception of miR-26b (31). Cyclin-dependent kinases, DNA repair enzymes were predicted targets of several differentially expressed miRNAs. Stress response enzymes e.g. MAP kinase and c-jun-n-terminal kinase were also predicted targets of several differentially expressed miRNAs (miR-128a, 128b, 23a, 23b, 125b, 27b).
Effects of silencing and over-expressing miR-122 on targets involved in lipid synthesis and comparison with pattern of expression of the targets in NASH (figures 4, 5, 6, 7)
Figure 4. Hepatic mRNA and protein expression of lipogenic genes in human subjects with NASH and matched controls.
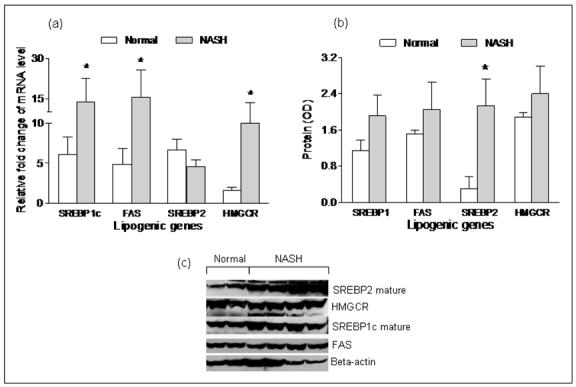
mRNA levels of hepatic lipogenic genes were expressed as relative fold change from a single human liver sample used as the internal calibrator across all RT-PCR experiments. Overall, the hepatic mRNA levels of FAS, SREBP-1c and HMGCR were increased significantly in subjects with NASH compared to controls (p< 0.05), while the hepatic mRNA level of SREBP-2 was not different between the two groups. As shown in panels b and c, SREBP-2, HMGCR, SREBP-1c and FAS protein were increased in NASH subjects (p< 0.02 for SREBP-2, p=ns for the rest).
Figure 5. Silencing of miR-122 in HepG2 cells.
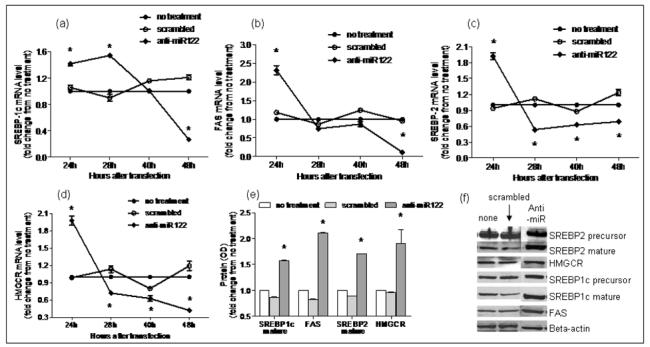
Using RT-PCR, mRNA expression of miR-122 targets involved in lipogenesis in subjects with NASH vs. controls was evaluated following silencing miR-122 in cell culture. As shown in a-d, mRNA levels of FAS, HMGCR, SREBP-1c and SREBP-2 increased significantly at 24hrs (p< 0.05 for all) after silencing of miR-122. The mRNA levels of these lipogenic genes then dropped significantly below baseline values by 48hrs (p< 0.02 for all). This was accompanied by a significant increase in protein expression of HMGCR, FAS and mature SREBP1c and SREBP2 (p< 0.02 for all) at 48hrs as shown in panels e and f (None: no treatment; scrambled: transfection with RNA duplex containing a scrambled sequence without known gene targets; anti: transfection with miR-122 silencing RNA).
Figure 6. Over-expression of miR-122 in HepG2 cells.
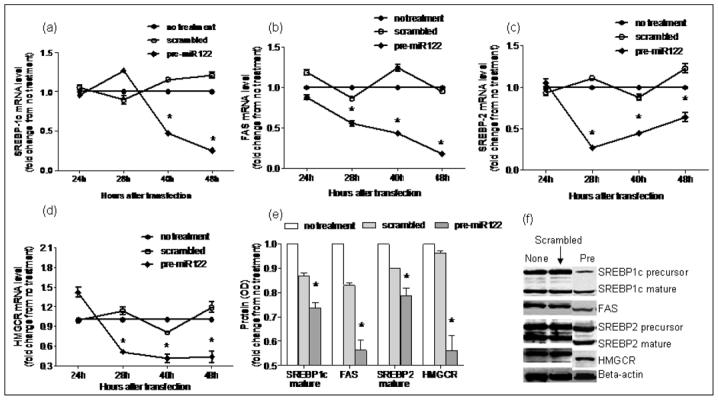
Using RT-PCR, mRNA expression of miR-122 targets involved in lipogenesis was evaluated following over-expression of miR-122 in vitro. As shown in a-d, mRNA levels of FAS, HMGCR, SREBP-1c and SREBP-2 remained unchanged at 24hrs after over-expression. This was followed by a significant decrease in mRNA expression by 48hrs (p< 0.03 for all). Protein expression of HMGCR, FAS and mature SREBP1c and SREBP2 decreased significantly (p< 0.003 for all) at 48hrs after miR-122 over-expression as shown in panels e and f (None: no treatment; scrambled: transfection with RNA duplex containing a scrambled sequence without known gene targets; pre: transfection with miR-122 RNA).
Figure 7. Functional validation of miR-122 in Huh7 cells.
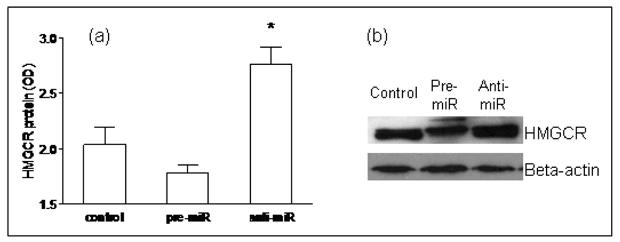
Silencing of miR-122 resulted in a significant increase in HMGCR protein (p= 0.03), while over-expression of miR-122 led to decreased HMGCR protein expression.
There is a paucity of data on the pattern of expression of lipogenic genes in human NASH. The hepatic mRNA and protein expression of FAS, SREBP-1c, HMGCR, and SREBP-2 was therefore first measured to provide reference data for studies of miR-122. As shown in figure 4, the mRNA levels of SREBP-1c, FAS and HMGCR were significantly increased in subjects with NASH (p< 0.05 for all). Their protein levels were also increased. While SREBP-2 mRNA was not increased, the levels of mature protein were increased in subjects with NASH. Upon silencing of miR-122 in cell culture, there was a significant increase in the mRNA levels of FAS, HMGCR, SREBP-1c and SREBP-2 by 24hrs, which dropped below baseline values by 48hrs (p< 0.02 for all) (figures 5a-d). This was followed by a significant increase in protein levels which peaked at 48hrs (p< 0.02 for all) (figures 5e-f). On the other hand, following over-expression of miR-122, the mRNA levels of these target genes did not change initially but decreased by 48hrs (p< 0.03 for all) (figures 6a-d). This was accompanied by a corresponding decrease in levels of mature SREBP-1c and SREBP-2 and their downstream targets FAS and HMGCR respectively (p< 0.003 for all) (figures 6e-f). These findings were further validated by measuring the effects of over-expression and silencing miR-122 on HMGCR in Huh7 cells (figure 7).
DISCUSSION
miRNAs are important regulators of gene expression and affect mRNA stability and function (2, 3). The current study provides evidence that NASH is associated with altered hepatic miRNA expression. The potential targets of differentially expressed miRNAs are known to play a role in lipid metabolism, cell growth and differentiation, apoptosis and inflammation; all these are key processes involved in the development and progression of NASH (11). While our findings do not provide direct proof of the involvement of these differentially expressed miRNAs in the pathogenesis of NASH, they serve as a broad blueprint and resource for future hypothesis generation and hypothesis-driven studies of the role of miRNAs in the development and progression of NASH. This was indeed a principal objective of this study.
It should be noted that the field of miRNA research, while relatively young, is growing rapidly. Since the time of performance of the microarray studies about 12 months ago, several hundred new miRNA species have been identified (miRbase 11.0, April 2008, total 873 human miRs). The functions of most of these remain to be experimentally verified. In the current study, about 10% (46/474) of the tested miRNAs were differentially expressed in NASH. Most of the differentially expressed miRNAs were either over- or under-expressed by at least 50%. Furthermore, the majority of differentially expressed miRNAs had a very limited number of targets (based on pertinent targets selected for presentation in supplementary tables). Conversely, the great majority of targets were affected by < 4 differentially expressed miRNAs. While these suggest that the observed changes are likely to have a biological effect, this possibility needs to be confirmed by specific hypothesis-driven studies.
It is interesting to note that the pattern of protein expression of key lipogenic genes seen in human NASH can be reproduced by silencing miR-122 in cell culture. These data are in line with and further extend previously published observations in mice (6, 20). The mRNA expression of FAS, SREBP-1c, HMGCR and SREBP-2 increased initially after silencing miR-122 and then declined. It is possible that miR-122 degrades the mRNA of its target genes and the initial increase in mRNA levels reflected silencing of this effect. Conversely, the decrease in mRNA levels of these genes after over-expression may reflect increased mRNA degradation by miR-122. FAS, HMGCR, SREBP-1c and SREBP-2 protein levels increased over a similar time course and peaked at 48hrs after miR-122 silencing. While precursor SREBP1c and SREBP2 protein levels did not change significantly after miR-122 silencing, the mature forms showed a significant increase by 48hrs post transfection, suggesting a possible role of miR-122 in the post-translational regulation of SREBP maturation. Also, the progressive increase in protein levels of its targets after silencing miR-122 suggests the possibility that this was due to de-repression of the inhibitory effects of miR-122 on protein translation. These possibilities now need to be explored in future studies designed to clarify the mechanisms by which miR-122 regulates its targets.
The pattern of miRNA expression could be affected by the development of cirrhosis. This possibility was minimized by excluding those with bridging fibrosis or cirrhosis from this study. It is also important to note that the focus of this study was to determine, in the background of the metabolic syndrome, whether NASH was associated with altered hepatic miRNA expression. Therefore only subjects with the metabolic syndrome with either a normal liver (defined by enzymes, ultrasound and liver biopsy) or NASH were studied. Consequently, these data do not provide any information on hepatic miRNA expression in lean normal individuals without the metabolic syndrome or those with isolated hepatic steatosis.
In summary, NASH is associated with changes in the hepatic expression of miRNAs. The potential consequences of these changes can affect insulin signaling, lipid metabolism, cellular responses to stress and apoptosis, inflammation and response to tissue injury. Silencing miR-122 in vitro reproduced a pattern of key hepatic lipogenic gene mRNA and protein expression that is similar to that seen in human NASH. The mechanisms by which miR-122 affects lipid homeostasis need to be defined further. It is hoped that these data will lead to specific hypothesis-generated studies, which will define the role of miRNAs in the genesis of fatty liver and progression to steatohepatitis and further add to the knowledge regarding the pathogenesis of this condition.
Supplementary Material
Acknowledgments
This is original work and is not being considered for publication elsewhere. This work was accepted for presentation at the European Association for the Study of Liver Disease in Milan, Italy 2008. This work was supported in part by two grants from the NIH to Dr. Sanyal K 24 DK 02755-06 and T-32 DK 007150-32 as well as a grant to the VCU Medical Center GCRC (MO1 RR 00065-45).
ABBREVIATIONS
- NASH
nonalcoholic steatohepatitis
- NAFLD
nonalcoholic fatty liver disease
- miRNA
microRNA
- RT-PCR
quantitative real time PCR
- FAS
fatty acid synthetase
- HMGCR
HMG CoA reductase
- SREBP-1c
sterol responsive element binding protein 1c
- SREBP-2
sterol responsive element binding protein 2
Footnotes
Conflicts of interest: None to report.
REFERENCES
- 1.Adams LA, Sanderson S, Lindor KD, Angulo P. The histological course of nonalcoholic fatty liver disease: a longitudinal study of 103 patients with sequential liver biopsies. J Hepatol. 2005;42:132–138. doi: 10.1016/j.jhep.2004.09.012. [DOI] [PubMed] [Google Scholar]
- 2.Ambros V. The functions of animal microRNAs. Nature. 2004;431:350–355. doi: 10.1038/nature02871. [DOI] [PubMed] [Google Scholar]
- 3.Nilsen TW. Mechanisms of microRNA-mediated gene regulation in animal cells. Trends Genet. 2007;23:243–249. doi: 10.1016/j.tig.2007.02.011. [DOI] [PubMed] [Google Scholar]
- 4.Lagos-Quintana M, Rauhut R, Yalcin A, Meyer J, Lendeckel W, Tuschl T. Identification of tissue-specific microRNAs from mouse. Curr Biol. 2002;12:735–739. doi: 10.1016/s0960-9822(02)00809-6. [DOI] [PubMed] [Google Scholar]
- 5.Houbaviy HB, Murray MF, Sharp PA. Embryonic stem cell-specific MicroRNAs. Dev Cell. 2003;5:351–358. doi: 10.1016/s1534-5807(03)00227-2. [DOI] [PubMed] [Google Scholar]
- 6.Esau C, Davis S, Murray SF, Yu XX, Pandey SK, Pear M, Watts L, et al. miR-122 regulation of lipid metabolism revealed by in vivo antisense targeting. Cell Metab. 2006;3:87–98. doi: 10.1016/j.cmet.2006.01.005. [DOI] [PubMed] [Google Scholar]
- 7.Esau C, Kang X, Peralta E, Hanson E, Marcusson EG, Ravichandran LV, Sun Y, et al. MicroRNA-143 regulates adipocyte differentiation. J Biol Chem. 2004;279:52361–52365. doi: 10.1074/jbc.C400438200. [DOI] [PubMed] [Google Scholar]
- 8.Meng F, Henson R, Wehbe-Janek H, Smith H, Ueno Y, Patel T. The MicroRNA let-7a modulates interleukin-6-dependent STAT-3 survival signaling in malignant human cholangiocytes. J Biol Chem. 2007;282:8256–8264. doi: 10.1074/jbc.M607712200. [DOI] [PubMed] [Google Scholar]
- 9.Thompson BJ, Cohen SM. The Hippo pathway regulates the bantam microRNA to control cell proliferation and apoptosis in Drosophila. Cell. 2006;126:767–774. doi: 10.1016/j.cell.2006.07.013. [DOI] [PubMed] [Google Scholar]
- 10.Alvarez-Garcia I, Miska EA. MicroRNA functions in animal development and human disease. Development. 2005;132:4653–4662. doi: 10.1242/dev.02073. [DOI] [PubMed] [Google Scholar]
- 11.Reddy JK, Rao MS. Lipid metabolism and liver inflammation. II. Fatty liver disease and fatty acid oxidation. Am J Physiol Gastrointest Liver Physiol. 2006;290:G852–858. doi: 10.1152/ajpgi.00521.2005. [DOI] [PubMed] [Google Scholar]
- 12.Executive Summary of The Third Report of The National Cholesterol Education Program (NCEP) Expert Panel on Detection, Evaluation, And Treatment of High Blood Cholesterol In Adults (Adult Treatment Panel III) Jama. 2001;285:2486–2497. doi: 10.1001/jama.285.19.2486. [DOI] [PubMed] [Google Scholar]
- 13.Kleiner DE, Brunt EM, Van Natta M, Behling C, Contos MJ, Cummings OW, Ferrell LD, et al. Design and validation of a histological scoring system for nonalcoholic fatty liver disease. Hepatology. 2005;41:1313–1321. doi: 10.1002/hep.20701. [DOI] [PubMed] [Google Scholar]
- 14.Singh R, Maganti RJ, Jabba SV, Wang M, Deng G, Heath JD, Kurn N, et al. Microarray-based comparison of three amplification methods for nanogram amounts of total RNA. Am J Physiol Cell Physiol. 2005;288:C1179–1189. doi: 10.1152/ajpcell.00258.2004. [DOI] [PMC free article] [PubMed] [Google Scholar]
- 15.Choi Y, Qin Y, Berger MF, Ballow DJ, Bulyk ML, Rajkovic A. Microarray analyses of newborn mouse ovaries lacking nobox. Biol Reprod. 2007;77:312–319. doi: 10.1095/biolreprod.107.060459. [DOI] [PubMed] [Google Scholar]
- 16.Gao X, Gulari E, Zhou X. In situ synthesis of oligonucleotide microarrays. Biopolymers. 2004;73:579–596. doi: 10.1002/bip.20005. [DOI] [PubMed] [Google Scholar]
- 17.Zhu Q, Hong A, Sheng N, Zhang X, Jun K-Y, Srivannavit O, Gulari E, Gao X, Zhou X.Microfluidic biochip for nucleic acid and protein analysis Methods Mol. Biol. Ed 2006;in press. [DOI] [PubMed] [Google Scholar]
- 18.Griffiths-Jones S. The microRNA Registry. Nucleic Acids Res. 2004;32:D109–111. doi: 10.1093/nar/gkh023. [DOI] [PMC free article] [PubMed] [Google Scholar]
- 19.Chang J, Nicolas E, Marks D, Sander C, Lerro A, Buendia MA, Xu C, et al. miR-122, a mammalian liver-specific microRNA, is processed from hcr mRNA and may downregulate the high affinity cationic amino acid transporter CAT-1. RNA Biol. 2004;1:106–113. doi: 10.4161/rna.1.2.1066. [DOI] [PubMed] [Google Scholar]
- 20.Krutzfeldt J, Rajewsky N, Braich R, Rajeev KG, Tuschl T, Manoharan M, Stoffel M. Silencing of microRNAs in vivo with ‘antagomirs’. Nature. 2005;438:685–689. doi: 10.1038/nature04303. [DOI] [PubMed] [Google Scholar]
- 21.Ren S, Li X, Rodriguez-Agudo D, Gil G, Hylemon P, Pandak WM. Sulfated oxysterol, 25HC3S, is a potent regulator of lipid metabolism in human hepatocytes. Biochem Biophys Res Commun. 2007;360:802–808. doi: 10.1016/j.bbrc.2007.06.143. [DOI] [PMC free article] [PubMed] [Google Scholar]
- 22.Yin J, Kwon YT, Varshavsky A, Wang W. RECQL4, mutated in the Rothmund-Thomson and RAPADILINO syndromes, interacts with ubiquitin ligases UBR1 and UBR2 of the N-end rule pathway. Hum Mol Genet. 2004;13:2421–2430. doi: 10.1093/hmg/ddh269. [DOI] [PubMed] [Google Scholar]
- 23.Dundr M, Ospina JK, Sung MH, John S, Upender M, Ried T, Hager GL, et al. Actin-dependent intranuclear repositioning of an active gene locus in vivo. J Cell Biol. 2007;179:1095–1103. doi: 10.1083/jcb.200710058. [DOI] [PMC free article] [PubMed] [Google Scholar]
- 24.Bolstad BM, Irizarry RA, Astrand M, Speed TP. A comparison of normalization methods for high density oligonucleotide array data based on variance and bias. Bioinformatics. 2003;19:185–193. doi: 10.1093/bioinformatics/19.2.185. [DOI] [PubMed] [Google Scholar]
- 25.Wang X, Hessner MJ, Wu Y, Pati N, Ghosh S. Quantitative quality control in microarray experiments and the application in data filtering, normalization and false positive rate prediction. Bioinformatics. 2003;19:1341–1347. doi: 10.1093/bioinformatics/btg154. [DOI] [PubMed] [Google Scholar]
- 26.Pan W. A comparative review of statistical methods for discovering differentially expressed genes in replicated microarray experiments. Bioinformatics. 2002;18:546–554. doi: 10.1093/bioinformatics/18.4.546. [DOI] [PubMed] [Google Scholar]
- 27.Eisen MB, et al. Cluster analysis and display of genome-wide expression patterns. Proceedings of the National Academy of Sciences USA. 1998;95:14863–14868. doi: 10.1073/pnas.95.25.14863. [DOI] [PMC free article] [PubMed] [Google Scholar]
- 28.Tusher VG, Tibshirani R, Chu G. Significance analysis of microarrays applied to the ionizing radiation response. Proc Natl Acad Sci U S A. 2001;98:5116–5121. doi: 10.1073/pnas.091062498. [DOI] [PMC free article] [PubMed] [Google Scholar]
- 29.Jouet P, Sabate JM, Maillard D, Msika S, Mechler C, Ledoux S, Harnois F, et al. Relationship between obstructive sleep apnea and liver abnormalities in morbidly obese patients: a prospective study. Obes Surg. 2007;17:478–485. doi: 10.1007/s11695-007-9085-3. [DOI] [PubMed] [Google Scholar]
- 30.Savransky V, Nanayakkara A, Vivero A, Li J, Bevans S, Smith PL, Torbenson MS, et al. Chronic intermittent hypoxia predisposes to liver injury. Hepatology. 2007;45:1007–1013. doi: 10.1002/hep.21593. [DOI] [PubMed] [Google Scholar]
- 31.Kulshreshtha R, Ferracin M, Wojcik SE, Garzon R, Alder H, Agosto-Perez FJ, Davuluri R, et al. A microRNA signature of hypoxia. Mol Cell Biol. 2007;27:1859–1867. doi: 10.1128/MCB.01395-06. [DOI] [PMC free article] [PubMed] [Google Scholar]
Associated Data
This section collects any data citations, data availability statements, or supplementary materials included in this article.