Abstract
It is well known that in fMLP-stimulated neutrophils, phosphatidyl inositol 3,4,5-trisphosphate [PI(3,4,5)P3] localizes at the leading edge of the cells. However, no effort has been made to study the PI 4,5-bisphosphate [PI(4,5)P2] distribution in these cells. In fact, it has been suggested that PI(4,5)P2 is unlikely to localize, as its basal level is orders of magnitude higher than that of PI(3,4,5)P3. We developed an optimized immunostaining protocol for studying the endogenous distribution of PI(4,5)P2 in neutrophil-like HL-60 cells. We show that PI(4,5)P2 localizes sharply at the leading edge with an intensity gradient similar to that for PI(3,4,5)P3. The enzymes for the production of PI(4,5)P2, namely, PI5KIα and PI5KIγ, were also found to localize at the leading edge, further supporting our finding that PI(4,5)P2 localizes at the leading edge. These results imply that complementary regulation of PI3K and phosphate and tensin homolog (PTEN) is not the sole or dominant mechanism of PI(3,4,5)P3 polarization in HL-60 cells.
Keywords: chemotaxis, gradient sensing, phosphoinositides
INTRODUCTION
A key problem of eukaryotic cell movement is the signaling mechanism of gradient sensing [1]. Soon after motile cells are exposed to a chemoattractant gradient, “frontness” molecules, such as Cdc42, Rac, F-actin, and phosphatidyl inositol 3,4,5-trisphosphate [PI(3,4,5)P3], localize at the front of the cell, and “backness” molecules, such Rho, phosphate and tensin homolog (PTEN), and myosin II, accumulate at the back of the cell. Gradient sensing refers to the entire train of signaling events resulting in the formation of this front-back polarity.
Upon chemoattractant stimulation, the membrane-resident phospholipid PI(3,4,5)P3 is one of the first signaling components to localize at the leading edge [2,3,4,5]. Signaling components upstream of PI(3,4,5)P3, such as receptors and heterotrimeric G-proteins, are not polarized significantly [6,7,8].
The polarization of PI(3,4,5)P3 is an important process in the gradient-sensing mechanism. Inhibition of PI(3,4,5)P3 synthesis results in cells that do not orient properly along the gradient [9, 10].
The central role of PI(3,4,5)P3 polarization in gradient sensing has spurred the development of several conceptual and mathematical models [11]. The goal of the experiments described in this work was to test the implications of one of these models, namely, the complementary regulation of PI3K and PTEN (referred to hereafter as the CR model).
The CR model is based on the following observation. Soon after motile cells are exposed to a chemoattractant gradient, PI3K and PTEN localize to the front and back of the cell, respectively [12,13,14]. As PI3K catalyzes the phosphorylation of PI 4,5-bisphosphate [PI(4,5)P2] to PI(3,4,5)P3, and PTEN catalyzes the dephosphorylation of PI(3,4,5)P3 to PI(4,5)P2 [15], one is led to the hypothesis that the polarizing action of PI3K is complemented by PTEN. More precisely, the localization of PI3K at the front of the cell causes the formation of a PI(3,4,5)P3 concentration gradient, which is complemented by localization of PTEN to the back of the cell.
The CR model implies that in polarized cells, the concentration profiles of PI(4,5)P2 and PI(3,4,5)P3 will be out-of-phase; i.e., PI(3,4,5)P3 will accumulate at the front, and PI(4,5)P2 will accumulate at the back. To be sure, it is conceivable that the PI(4,5)P2 gradient is imperceptibly small, as the basal levels of PI(4,5)P2 are relatively high compared with those of PI(3,4,5)P3 [16, 17]. However, the PI(4,5)P2 and PI(3,4,5)P3 concentration profiles certainly cannot be in-phase. Mathematical models of the CR mechanism corroborate this conclusion (see, for instance, Figs. 3–6 of ref. [18]).
The foregoing argument implies that the validity of the CR model can be tested by studying the distribution of PI(4,5)P2 and PI(3,4,5)P3 in polarized cells. It turns out, however, that although the localization of PI(3,4,5)P3 is widely accepted, the spatial distribution of PI(4,5)P2 remains the subject of considerable debate. As we elaborate below, attempts to observe the localization of PI(4,5)P2 have often yielded contradictory results. Moreover, in neutrophils that are similar to HL-60 cells [19], the basal level of PI(4,5)P2 is 1000 times higher than that of PI(3,4,5)P3 [16]. Similar concentrations have been observed in several other cell types [20]. The high basal level of PI(4,5)P2 has led some to argue that the localization of PI(4,5)P2 is implausible [21, 22].
In this study, we used immunostaining to study the spatial distributions of PI(4,5)P2, PI(3,4,5)P3, and PI5Ks in HL-60 cells exposed to a uniform fMLP stimulus. We find that PI(4,5)P2 and PI(3,4,5)P3 localize at the leading edge of fMLP-stimulated cells, and the fluorescence intensity gradient for PI(4,5)P2 is comparable with that for PI(3,4,5)P3. Also, the localization of PI(4,5)P2 is corroborated by the observation that PI5KIα and PI5KIγ also localize at the leading edge.
The colocalization of PI(4,5)P2 and PI(3,4,5)P3 implies that in HL-60 cells, the CR model is not the sole or dominant mechanism of PI(3,4,5)P3 polarization.
MATERIALS AND METHODS
Materials
Paraformaldehyde (PFA; reagent grade), glutaraldehyde (GTA; 50% solution in water; reagent grade), and Triton X-100 were from Fisher Scientific (Suwanee, GA, USA); digitonin, fMLP, and RPMI-1640 medium were from Sigma-Aldrich (St. Louis, MO, USA). Mouse monoclonal anti-PI(3,4,5)P3 IgG and PI-phosphate (PIP) strips were from Echelon Biosciences (Salt Lake City, UT, USA); rabbit peptide antibodies, anti-PIP 5 kinase (PIP5K)Iα, and anti-PIP5KIγ pan were gifts from Richard A. Anderson (University of Wisconsin-Madison, WI, USA) and Pietro De Camilli (Yale University, New Haven, CT, USA), respectively. Anti-PI(4,5)P2 mAb, clone KT-10 [23], and clone AM-212 [24] were kindly provided by Kiyoko Fukami (University of Tokyo, Japan) and Masato Umeda (Institute for Chemical Research, Kyoto University, Japan). Membrane dyes (DiO/DiI Vybrant), secondary antibodies, Alexa Fluor 488 (green fluorescent), and Alexa Fluor 594 (red fluorescent) goat anti-mouse or rabbit and nuclear stain (Hoechst 33258) were from Invitrogen (Carlsbad, CA, USA).
Cell culture and differentiation
Culture and differentiation of HL-60 cells were performed as described [6]. Briefly, cells were grown in RPMI-1640 culture media supplemented with 10% FBS, 1% Amphotericin B, and 1% pen-strep/glutamine in a humid chamber at 37°C with 5% CO2. In a T-75 flask, cells reach a density of 1.0–1.5 × 10⁶ cells/ml in 3–4 days. For differentiation, 4 × 10⁶ cells were seeded in 19.75 ml (final volume)-supplemented culture media, and then 0.25 ml (1.25%) DMSO was added. The cells were propagated for 6 days without changing the medium.
Dot-blot assay
The PIP strip was blocked with 3% BSA in TBS overnight at 4°C and incubated with primary antibody for 1 h. After extensive washing in TBS containing 0.05% Tween 20, the strip was incubated with HRP-conjugated secondary antibody for 1 h and then visualized with the ECL kit (Amersham Biosciences, Piscataway, NJ, USA).
ELISA
The wells of the high-binding polystyrene microtiter plates (Thermo Scientific, Waltham, MA, USA) were coated with various phospholipids (1 μg/well) in ethanol. Plates were left at room temperature until complete ethanol evaporation. The wells were blocked with 3% BSA solution in TBS for 1 h at room temperature. Serial dilution of AM-212 serum in 3% BSA was applied to each phospholipid row for 1 h at room temperature. After washing four times in 0.05% TBS-Tween, alkaline phosphatase-conjugated goat anti-mouse IgG (Sigma-Aldrich) was applied at a dilution of 1:2000 for 1 h at room temperature. Wells were washed four times in 0.05% TBS-Tween, 100 μl phospho (p)-nitrophenyl-phosphate substrate solution (Sigma-Aldrich) was added, and absorbance was measured at 405 nm.
Chemotaxis assay
Differentiated HL-60 cells were washed once in RPMI-1640/25 mM HEPES and resuspended at a concentration of 3.0 × 10⁶ cells/ml in modified HBSS (mHBSS) containing 150 mM NaCl, 4 mM KCl, 1.2 mM MgCl2, 10 mg/ml glucose, and 20 mM HEPES, pH 7.2. The cells (3×10⁵ in 100 μl) were plated on the fibronectin-coated (0.05 mg/ml), sterile no. 1 coverslips, rimmed with a square agarose spacer, 10 mm in length and 1 mm in height. Cells were then incubated in a humid chamber at 37°C with 5% CO2 for 15–20 min, and nonadherent cells were removed by two washes in mHBSS.
Immunostaining and microscopy
The cells were stimulated with fMLP uniformly with a bath application of 1 μM fMLP or nonuniformly by delivering 10 μM fMLP through a micropipette fitted with an Eppendorf Femtotip II. After stimulating the cells for 2–3 min, they were fixed for 10 min at room temperature in various fixative solutions (described in Results). The cells were then permeabilized and blocked for 30 min in various detergent solutions (described in Results) containing 5% goat serum, followed by overnight incubation with appropriate primary antibodies at 4°C. After three successive washes in TBS, the cells were incubated with secondary antibodies (Alexa Fluor 488 and Alexa Fluor 594 goat anti-mouse or rabbit) for 4–5 h, washed three times in TBS, and mounted on a glass slide. Fluorescence microscopy was done on a deconvolution microscope (DeltaVision RT from Applied Precision, Issaquah, WA, USA), and the following filter sets were used: FITC (excitation: 490/20 nm, emission: 528/38), RD-TR-PE (excitation: 555/28 nm, emission: 617/73), Cy5 (excitation: 640/20 nm, emission: 685/40), and 4′,6-diamidino-2-phenylindole (excitation: 360/40 nm, emission: 457/50). No bleed-through of fluorescence signal was observed from one channel to another channel. Images were analyzed using softWoRx (Applied Precision) and ImageJ (National Institutes of Health, Bethesda, MD, USA) softwares.
Plasma membrane labeling
Differentiated HL-60 cells were resuspended in RPMI-1640/25 mM HEPES. DiO Vybrant or DiI (5 μl) was added, and cells were incubated at 37°C for 5–7 min. Cells were washed once with RPMI-1640/25 mM HEPES to remove the excess dye, resuspended in mHBSS, and then plated on fibronectin-coated coverslips for the chemotaxis assay.
RESULTS
The AM-212 antibody is a specific marker for PI(4,5)P2
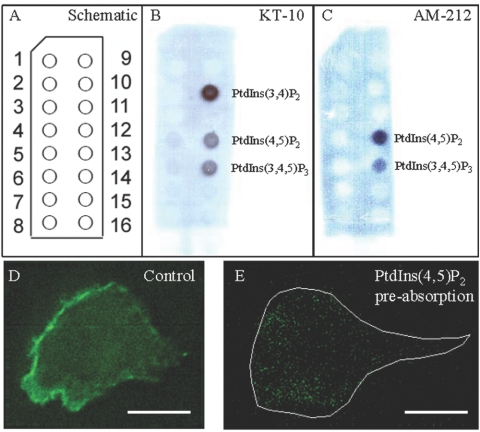
The mAb KT-10 [23] and AM-212 [24] are the two most commonly used anti-PI(4,5)P2 antibodies. To check the specificity of these antibodies against various phospholipids, we performed a dot-blot assay on a PIP strip (Echelon Biosciences), which has 15 different phospholipids spotted on a nitrocellulose membrane (Fig. 1A). The dot-blot assay shows that the KT-10 antibody has a surprisingly high binding for PI(3,4)P2 and relatively low binding for PI(4,5)P2 and PI(3,4,5)P3 (Fig. 1B). In contrast, the AM-212 antibody binds almost entirely to PI(4,5)P2, with only a marginal reactivity with PI(3,4,5)P3 (Fig. 1C). The cross-reactivity with various phospholipids, including all other phosphoinositides, is negligibly small. Intensity analysis of the blots showed that ∼70% of the KT-10 binding is for PI(3,4)P2, whereas ∼85% of the AM-212 binding is for PI(4,5)P2 (data not shown). As PI(4,5)P2 levels are 10–1000 times PI(3,4,5)P3 levels under all conditions (stimulated or unstimulated), the antibody AM-212 can be considered a specific marker for PI(4,5)P2. In addition to using PIP strips from Echelon Biosciences, we spotted various phospholipids on nitrocellulose membranes and did the dot-blot assay. We obtained results similar to those obtained with the commercial PIP strips (data not shown).
Fig. 1.
The AM-212 antibody is a specific marker for PI(4,5)P2. Dot-blot assay was done on PIP strips (Echelon Biosciences) to check the specificity of two commonly used PI(4,5)P2 antibodies, KT-10 [23] and AM-212 [24], against 15 phospholipids. (A) Schematic diagram of a PIP strip showing all the phospholipid spots: 1, lysophosphatidic acid; 2, lysophosphatidycholine; 3, PI; 4, PI 3-phosphate [PI(3)P]; 5, PI(4)P; 6, PI(5)P; 7, PE; 8, phosphatidylcholine; 9, sphingosine-1-phosphate; 10, PI(3,4)P2; 11, PI(3,5)P2; 12, PI(4,5)P2; 13, PI(3,4,5)P3; 14, phosphatidic acid; 15, phosphatidylserine; 16, blank. (B) KT-10 binds primarily to PI(3,4)P2 and exhibits slight cross-reactivity with PI(4,5)P2 and PI(3,4,5)P3. (C) AM-212 binds specifically to PI(4,5)P2 and very slightly with PI(3,4,5)P3. The data are representative of five independent dot-blot experiments for each of the antibodies. (D) Immunostaining of differentiated and fMLP-stimulated HL-60 cells with 2 μl AM-212 antibody (0.89 μg/μl) shows clear leading-edge localization. (E) Immunostaining of differentiated and fMLP-stimulated HL-60 cells with 2 μl AM-212 antibody (0.89 μg/μl), which was first preabsorbed with 1 μl PI(4,5)P2 (0.5 μg/μl) for 10 min at room temperature. Optimized immunostaining protocols (see Materials and Methods) were used for control and the PI(4,5)P2 preabsorption experiments. Notice the diminished fluorescence signal in the PI(4,5)P2-preabsorbed immunostaining of the cell compared with the control. Boundary of the polarized cell is drawn in a white line. Original scale bars, 5 μm.
As most of the PI(4,5)P2 localization data presented in this manuscript is using immunostaining, we did control immunostaining experiments to make sure AM-212 is binding to PI(4,5)P2. When AM-212 antibody was preabsorbed with PI(4,5)P2 at room temperature for 10 min, the subsequent fluorescence staining reduced significantly compared with the control (Fig. , 1Dand 1E).
As a further test of AM-212 specificity, we also used ELISA to check the binding of AM-212 antibody with the following four phospholipids: PI(4,5)P2, PI(3,4,5)P3, PI(3,4)P2, and PI(4)P. Again, AM-212 showed a strong affinity for PI(4,5)P2, slight cross-reactivity with PI(3,4,5)P3, and marginal cross-reactivity with PI(3,4)P2 and PI(4)P (Supplemental Fig. 1). All of the immunostaining data for PI(4,5)P2 presented in this manuscript were generated with the AM-212 antibody.
Optimization of the immunostaining protocols
In the literature, many different fixing and permeabilization protocols have been used, resulting in diverse immunostaining patterns for PI(4,5)P2 and PI5KIα. Several studies have reported that PI(4,5)P2 is detected on the plasma and subcellular membranes [25,26,27,28]. Yet, others have observed PI(4,5)P2 and PI5KIα primarily in the nucleus [29]. To identify the effect of the fixing and permeabilization protocol on the staining pattern, we performed systematic studies with two fixatives (4% PFA; 4% PFA+varying amounts of GTA) and two detergents (Triton X-100; digitonin).
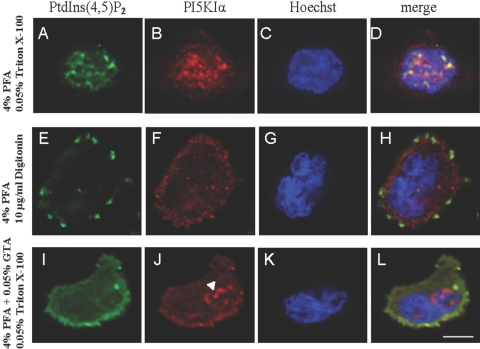
When we used 4% PFA as the fixative and Triton X-100 as the detergent, there was no signal at the plasma membrane. Instead, we observed punctate distributions of PI(4,5)P2 and PI5KIα in the nucleus (Fig. 2, top panel) similar to those observed by Boronenkov et al. [29]. The literature suggests that this is a result of the harshness of Triton X-100. Hannah et al. 30 compared the staining patterns of several proteins with PFA as the fixative and Triton X-100 or digitonin as the detergents. In many cases, only the membrane was stained when digitonin was used, whereas Triton X-100 resulted in markedly reduced membrane staining and pronounced intracellular staining. It was concluded that digitonin permeabilizes only the plasma membrane, whereas Triton X-100 solubilizes a significant part of the plasma membrane and permeabilizes the subcellular membranes. Our experiments support these observations. Indeed, when we replaced Triton X-100 with digitonin, anti-PI(4,5)P2 and anti-PI5KIα antibodies stained only the plasma membrane (Fig. 2, middle panel).
Fig. 2.
Immunostaining patterns of PI(4,5)P2 and PI5KIα vary depending on the fixation and permeabilization protocols. Differentiated HL-60 cells were plated on glass coverslips and then stimulated with 1 μM fMLP for 2 min. A variety of fixative and permeablizing agents was used for immunostaining with anti-PI(4,5)P2 antibody (AM-212) and anti-PI5KIα antibody. (Top panel) PFA fixation (4%) and 0.05% Triton X-100 permeabilization result in nuclear localization of PI(4,5)P2 (A) and PI5KIα (B). (Middle panel) PFA fixation (4%) and 10 μg/ml digitonin solution permeablization result in patchy distributions of PI(4,5)P2 (E) and PI5KIα (F) at the plasma membrane. (Bottom panel) PFA + 0.05% GTA fixation (4%) and 0.05% Triton X-100 permeablization result in leading-edge localization of PI(4,5)P2 (I) and PI5KIα (J). Note also the intracellular localization of PI5KIα (arrow head). Hoechst 33258 stains for nucleus (C, G, and K). Merged view for each panel is shown (D, H, and L). Original scale bar, 5 μm. Immunostaining patterns of PI(4,5)P2 and PI5KIα with optimized reagents (4% PFA+0.05% GTA for fixation and 10 μg/ml digitonin solution for permeablization; see Fig. 6, A and B, respectively). Note the clear leading-edge colocalization of PI(4,5)P2 and PI5KIα (see Fig. 6C).
Although the use of digitonin preserved the membrane signal, the PI(4,5)P2 and PI5KIα immunostaining consisted of patchy distributions at the plasma membrane. We reasoned that this was because PFA fixation failed to produce complete cross-linking of the proteins. Nakamura 31 has shown that significant amounts of proteins are extracted when the cells are fixed with 4% PFA for as long as 30 min. In contrast, almost no proteins are extracted when 4% PFA is supplemented with 0.05% or 1% GTA. The addition of GTA is thought to accelerate protein cross-linking as a result of the presence of additional aldehyde groups [32]. When we used 4% PFA + 0.05% GTA as the fixative, the PI(4,5)P2 and PI5KIα staining became contiguous, and gradients could be discerned even if Triton X-100 was used as the detergent (Fig. 2, bottom panel).
The addition of GTA to PFA unmasked the PI(4,5)P2 and PI5KIα gradients, but there was significant intracellular staining. We inferred that this is partly a result of the autofluorescence caused by unreacted aldehyde groups of GTA and partly as a result of the permeabilization of intracellular membranes by Triton X-100 (resulting in especially pronounced intracellular staining of PI5KIα; Fig. 2J). We mitigated the first problem by using the smallest concentration of GTA (0.05%) that yielded contiguous, rather than patchy, distributions and eliminated the latter problem by reverting to the use of digitonin as the permeabilizing agent. The optimized combination consisting of 4% PFA + 0.05% GTA as fixative and 10 μg/mL digitonin as a permeabilizing agent yields sharp gradients of PI(4,5)P2 and PI5KIα (see Figs. , 6Aand 6B). All immunostaining data described below were generated using this optimized combination.
Fig. 6.
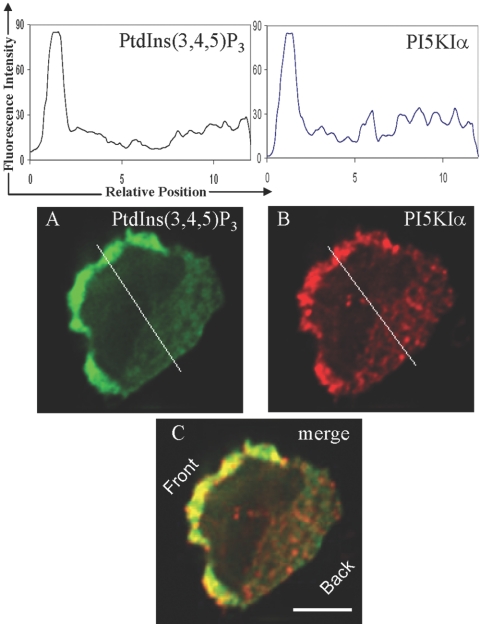
PI(3,4,5)P3 and PI5KIα colocalize at the leading edge of fMLP-stimulated HL-60 cells. Differentiated HL-60 cells were stimulated with fMLP, fixed and permeablized with optimized reagents (refer to Fig. 2), and then immunostained with anti-PI(3,4,5)P3 antibody (A) and anti-PI5KIα antibody (B). PI(3,4,5)P3 and PI5KIα colocalize at the leading edge of the HL-60 cells (C). The intensity profiles of PI(3,4,5)P3 and PI5KIα along the white lines are shown above the corresponding stains. The data are representative of 24 cells analyzed in three independent experiments. Original scale bar, 5 μm.
PI(3,4,5)P3 and PI(4,5)P2 localize at the leading edge
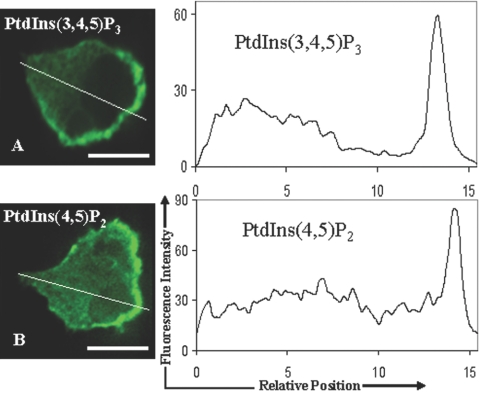
The spontaneous polarization of PI(3,4,5)P3 in HL-60 cells subjected to a uniform fMLP stimulus is well established [33]. We confirmed the existence of such PI(3,4,5)P3 localization in our experiments (Fig. 3A). We were particularly interested in studying the distribution of PI(4,5)P2. We found that in contrast to the prediction of the CR model, PI(4,5)P2 also localizes at the leading edge (Fig. 3B). Importantly, the intensity gradient of PI(4,5)P2 is comparable with that for PI(3,4,5)P3. As fluorescence intensities of PI(4,5)P2 and PI(3,4,5)P3 are proportional to their concentrations (with possibly different constants of proportionality), the intensity profiles for PI(4,5)P2 and PI(3,4,5)P3 imply that the percent change of the PI(4,5)P2 level from the front to the back is comparable with that for PI(3,4,5)P3. Thus, a significant gradient of PI(4,5)P2 develops despite its high basal levels.
Fig. 3.
Comparison of PI(3,4,5)P3 and PI(4,5)P2 immunostaining. fMLP-stimulated HL-60 cells were fixed and permeablized with optimized reagents (refer to Fig. 2) and immunostained with anti-PI(3,4,5)P3 antibody (A) or anti-PI(4,5)P2 antibody, AM-212 (B). Fluorescence intensity profiles, along the white lines passing through the cell, are also shown for both of the antibodies. Note the similar patterns of localizations of PI(3,4,5)P3 and PI(4,5)P2. Original scale bars, 5 μm.
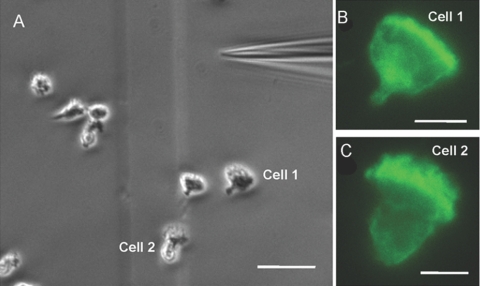
In the above experiment, the cells were subjected to a spatially uniform stimulus. To check if the staining pattern of PI(4,5)P2 is preserved even in the presence of a chemoattractant gradient, we stimulated the cells with a micropipette containing 10 μM fMLP. We found that the cells formed the classical front-back morphological polarity and moved toward the pipette tip (Fig. 4A and Supplemental Movie). To determine the PI(4,5)P2 staining pattern, the cells were fixed and stained with the PI(4,5)P2 antibody (AM-212) 3 min after the application of the fMLP gradient. We observed a clear localization of PI(4,5)P2 at the leading edge (Fig. , 4Band 4C), which was similar to the localization found in uniformly stimulated cells (Figs. 3B and 5, F5G5H5I, and see Fig. , 7Aand 7D). Thus, the PI(4,5)P2 localization in nonuniformly fMLP-stimulated cells is similar to that observed in uniformly stimulated cells.
Fig. 4.
PI(4,5)P2 localizes at the leading edge of HL-60 cells under fMLP gradient. Differentiated HL-60 cells were plated on fibronectin matrix and stimulated with 10 μM fMLP delivered through an Eppendorf Femtotip II attached to a micropipette system. After 3 min of fMLP stimulation, the cells were fixed and stained with PI(4,5)P2 antibody (AM-212) using the optimized immunostaining protocols. (A) Polarized cells oriented toward the pipette from the last frame of the chemotaxis movie (see supplement for the full movie). Original scale bar, 20 μm. (B and C) Two representative cells from the movie showing AM-212 staining. The leading-edge localization of AM-212 in this experiment is similar to the localization found in uniformly stimulated cells (Fig. 3B, and see Figs. 5F5G5H5I, and 7, A and D). Original scale bars, 5 μm.
Fig. 5.
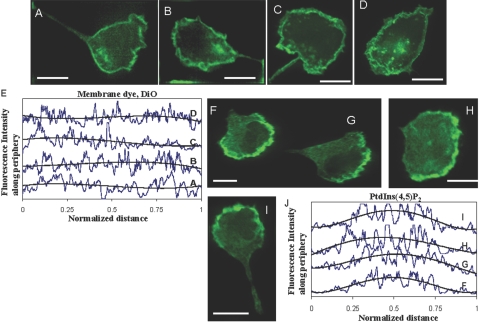
The localization of PI(4,5)P2 is not an artifact as a result of membrane folds. Differentiated HL-60 cells were stained with membrane dye, DiO, or immunostained with PI(4,5)P2 antibody, AM-212. (A–D) Four representative cells of DiO staining in fMLP-stimulated HL-60 cells and the corresponding fluorescence intensity profiles along the periphery (E). Trend of the intensity profile is shown by a thick, black line (E). (F–I) Four representative cells of PI(4,5)P2 antibody staining in fMLP-stimulated HL-60 cells and the corresponding fluorescence intensity profiles along the periphery (J). Trend of the intensity profile is shown by a thick, black line (J). Original scale bars, 10 μm.
Fig. 7.
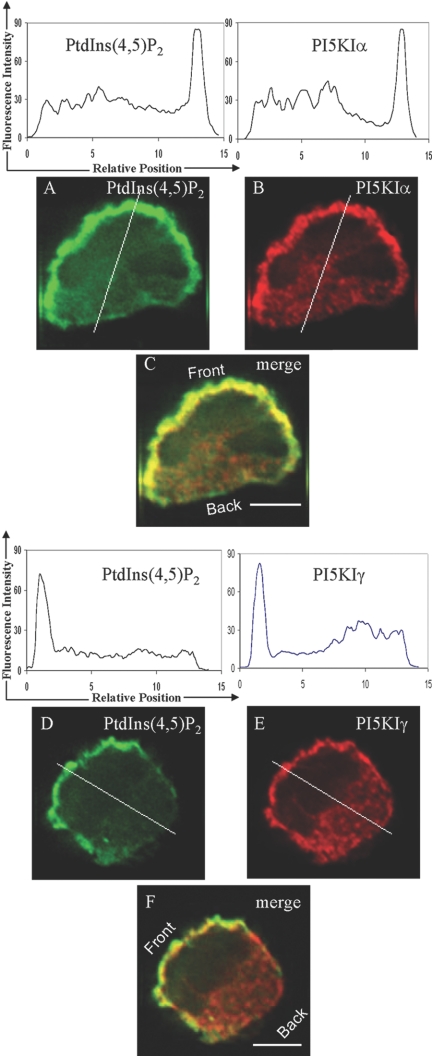
PI(4,5)P2, PI5KIα, and PI5KIγ colocalize at the leading edge of fMLP-stimulated HL-60 cells. Differentiated HL-60 cells were stimulated with fMLP, fixed, and permeablized with optimized reagents (4% PFA+0.05% GTA for fixation and 10 μg/ml digitonin solution for permeablization). Cells were immunostained with anti-PI(4,5)P2 (A) and anti-PI5KIα (Β) antibodies or anti-PI(4,5)P2 (D) and anti-PI5KIγ (E) antibodies. Colocalization of PI(4,5)P2, PI5KIα, and PI5KIγ is shown in the merged images (C and F). The fluorescence intensity profiles of PI(4,5)P2, PI5KIα, and PI5KIγ along the white lines passing through the cell are shown above the corresponding stains. PI(4,5)P2 and PI5KIα colocalization data are representative of 29 cells analyzed in three independent experiments. PI(4,5)P2 and PI5KIγ colocalization data are representative of 26 cells analyzed in three independent experiments. Original scale bars, 5 μm.
It has been observed previously that phosphoinositide localization can be an artifact resulting from membrane folding [34]. To check if this is the case, we looked at the distribution of the membrane marker DiO in polarized HL-60 cells (Fig. 5A5B5C5D) and compared it with anti-PI(4,5)P2 immunostaining of HL-60 cells (Fig. 5F5G5H5I). The intensity profiles along the periphery of the DiO-stained cells were more or less uniform (Fig. 5E), whereas those of the anti-PI(4,5)P2-stained cells had a marked maximum at the leading edge (Fig. 5J). We also looked at the distribution of an alternative lipophilic membrane marker, DiI. We found a similar, near-uniform distribution along the cell periphery (Supplemental Fig. 2). Thus, the localization of PI(4,5)P2 is not an artifact as a result of membrane folding.
We also tried membrane dye and anti-PI(4,5)P2 costaining, but these experiments were not successful. We found that the treatment of cells with membrane dye interferes with PI(4,5)P2 as well as PI(3,4,5)P3 immunostaining. When exposed to a uniform fMLP stimulus, dye-treated cells polarize and look morphologically similar to nontreated cells but fail to stain for anti-PI(4,5)P2 or anti-PI(3,4,5)P3 antibodies.
PI5KIα and PI5KIγ colocalize with PI(4,5)P2 and PI(3,4,5)P3 at the leading edge
We also studied the spatial distribution of type I PI5K. Although there are three isoforms of PI5KI (designated Iα, Iβ, and Iγ), the evidence suggests that only the 1α and 1γ play a role in membrane ruffling and motility. Doughman et al. [25] studied the distribution of PI5KIα and PI5KIβ in resting and platelet-derived growth factor (PDGF)-stimulated MG-63 fibroblasts. In resting cells, endogenous PI5KIα and PI5KIβ were detected in the cytosol and perinuclear vesicular structures, respectively. Upon PDGF stimulation, PI5KIα translocated to the ruffles, whereas the distribution of PI5KIβ remained unchanged. Thus, the 1α, but not the Iβ, isoform plays a role in membrane ruffling. Insofar as the Iγ isoform is concerned, there are two splice variants, namely, PI5KIγ87 and PI5KIγ90 [35]. Recent experiments show that the γ87 splice variant is enriched at the plasma membrane and is a major contributor to the synthesis of the PI(4,5)P2 pool involved in G-protein-coupled receptor-mediated inositol 1,4,5-trisphosphate [Ins(1,4,5)P3] production [27]. Thus, we were led to consider the spatial distributions of the Iα and Iγ isoforms.
We found that when HL-60 cells are stimulated with a uniform fMLP stimulus, PI5KIα and PI5KIγ colocalize with PI(3,4,5)P3 (Fig. 6) and PI(4,5)P2 (Fig. 7) at the leading edge of the cells. The overlap was essentially perfect.
These results corroborate the PI(4,5)P2 localization observed in the previous experiment, as the recruitment of PI5KIα and PI5KIγ to the leading edge is likely to cause enhanced synthesis of PI(4,5)P2 at the leading edge.
DISCUSSION
Localization of PI(4,5)P2 at the leading edge
A common theme in the literature is regulation of various processes by PI(4,5)P2 levels. Yet, whole-cell analyses show only modest changes in PI(4,5)P2 levels. In the particular case of neutrophils, exposure to fMLP causes the whole-cell PI(4,5)P2 levels to decrease from 5 to 3.5 mM before their subsequent recovery to prestimulus levels [16]. This has led to the suggestion that these processes are regulated by local changes in PI(4,5)P2 levels. However, the localization of PI(4,5)P2 remains the subject of considerable debate. The controversy stems from two main issues.
First, there are concerns regarding the specificity of pleckstrin homology-phopholipase C (PH-PLC)δ as a marker for PI(4,5)P2. Early studies showed that in unstimulated, rat basophilic leukemia cells, PH-PLCδ was bound to the membrane, and stimulation with agonists led to the release of GFP-PH-PLCδ into the cytosol [36]. It was concluded that this reflected the PLC-mediated hydrolysis of PI(4,5)P2. However, Hirose et al. 37 found that that GFP-PH-PLCδ binds to Ins(1,4,5)P3 with an affinity that is 20-fold higher than its affinity for PI(4,5)P2. Given this fact, it is not clear whether the migration of PH-PLCδ from the membrane to the cytosol reflects a decrease in PI(4,5)P2 levels or an increase in the cytosolic Ins(1,4,5)P3 levels. Based on the analysis of a kinetic model, Xu et al. 38 have argued that the answer depends on the concentration of GFP-PH-PLCδ in the cell. Thus, it can be difficult to interpret the results obtained from experiments involving PH-PLCδ as a marker for PI(4,5)P2.
Second, the observed localization of PI(4,5)P2 can be an artifact resulting from membrane folding. Tall et al. 39 studied the spatiotemporal dynamics of PH-PLCδ in NIH-3T3 fibroblasts. They observed colocalization of PH-PLCδ and actin in highly dynamic structures, which were identified as ruffles. However, van Rheenen and Jalink [34] showed subsequently that these ruffle-like structures were in fact membrane-rich microdomains.
In this work, we used immunostaining to study the localization of PI(4,5)P2 and PI5Ks. We found that a slight modification of the standard fixation and permeabilization protocols reveals sharp gradients of PI(4,5)P2 despite its high basal levels, and these gradients are not a result of membrane enrichment. Furthermore, these modified protocols also reveal the colocalization of PI(4,5)P2 and PI5Ks much more clearly than the standard immunostaining protocols. Indeed, Doughman et al. [25] used the standard immunostaining protocols (4% PFA fixation for 10 min, followed by permeabilization with 0.2% Triton X-100 for 10 min) to investigate the colocalization of PI(4,5)P2 and PI5KIα at the membrane ruffles of PDGF-stimulated fibroblasts. Comparison of Figure 7 of this work with Figure 2C of ref. [25] shows that the colocalization is much clearer with the modified protocol.
The localization of PI(4,5)P2 was also observed by Watt et al. [40], who circumvented the problems associated with transfection of PH-PLCδ by using an on-section labeling approach in which ultrathin-thawed cryosections were incubated with PLCδ-PH-GST, followed by antibodies against GST and Protein A-gold. The labeling was found to be markedly concentrated in the lamellipodium.
CR model
The colocalization of PI(4,5)P2 and PI(3,4,5)P3 at the leading edge implies that in HL-60 cells, the CR model is not the sole or dominant mechanism of fMLP-induced polarization of PI(3,4,5)P3. As noted in Introduction, this mechanism implies reciprocal (out-of-phase) distributions of PI(4,5)P2 and PI(3,4,5)P3. As the basal levels of PI(4,5)P2 are ∼100 times the basal levels of PI(3,4,5)P3, it is conceivable that the depletion of PI(4,5)P2 at the leading edge, predicted by the model, is imperceptibly small. But the pronounced accumulation of PI(4,5)P2 at the leading edge cannot be reconciled with a picture in which the CR model is the sole or dominant mechanism of PI(3,4,5)P3 polarization.
The evidence shows that PTEN certainly plays an important role in PI(3,4,5)P3 polarization. In Dictyostelium, PTEN null mutants exposed to cAMP develop a broad PI(3,4,5)P3 localization [12, 13]. In neutrophils, suppression of PTEN expression with PTEN-specific small interfering RNA results in pronounced elevation of p-Akt activity, a sensitive and specific marker for PI(3,4,5)P3 levels [41]. Yet, the localization of PI(4,5)P2 at the leading edge suggests that the role of PTEN is more complex than that implied by the CR model.
In earlier work, we proposed a mechanism in which phophoinositide localization was produced by a positive-feedback loop consisting of PI(4,5)P2 and PI(3,4,5)P3 [42]. The data presented above are consistent with this model. However, it remains to verify the existence of positive feedback. Indeed, if PI(4,5)P2 and PI(3,4,5)P3 belong to the same positive-feedback loop, then agents that inhibit (resp., activate) PI(3,4,5)P3 synthesis should also inhibit (resp., activate) the synthesis of PI(4,5)P2. These experiments will be the subject of future studies.
In summary, we studied the spatial distribution of PI(4,5)P2, PI(3,4,5)P3, PI5KIα, and PI5KIγ in HL-60 cells exposed to uniform fMLP concentrations. We found that not only PI(3,4,5)P3 but also PI(4,5)P2 localize at the leading edge of the cell, and the fluorescent intensity gradient of PI(4,5)P2 is comparable with that of PI(3,4,5)P3, and the enzymes PI5KIα and PI5KIγ, which catalyze the synthesis of PI(4,5)P2, colocalize with PI(4,5)P2.
These results imply that the CR model cannot be the sole or dominant mechanism of PI(3,4,5)P3 polarization. In contrast to the data, this mechanism implies depletion or at best, no change of the PI(4,5)P2 levels at the leading edge.
Supplementary Material
Acknowledgments
This research was supported in part with funds from the National Science Foundation (NSF) under contract NSF DMS-0517954. V. D. was supported by grant GM38511 to J. Condeelis (Albert Einstein School of Medicine, Bronx, NY, USA). We are grateful to Dr. K. K. Subramanian (Harvard University) for discussion regarding the protocols throughout the course of this project. We thank Professors R. A. Anderson (University of Wisconsin-Madison), P. De Camilli (Yale University), K. Fukami (University of Tokyo, Japan), and M. Umeda (Kyoto University) for the anti-PI5KIα, anti-PI5KIγ, KT-10, and AM-212 antibodies, respectively.
References
- Ridley A J, Schwartz M A, Burridge K, Firtel R A, Ginsberg M H, Borisy G, Parsons J T, Horwitz A R. Cell migration: integrating signals from front to back. Science. 2003;302:1704–1709. doi: 10.1126/science.1092053. [DOI] [PubMed] [Google Scholar]
- Parent C A, Blacklock B J, Froehlich W M, Murphy D B, Devreotes P N. G protein signaling events are activated at the leading edge of cells. Cell. 1998;95:81–91. doi: 10.1016/s0092-8674(00)81784-5. [DOI] [PubMed] [Google Scholar]
- Meili R, Ellsworth C, Lee S, Reddy T B K, Ma H, Firtel R A. Chemoattractant-mediated transient activation and membrane localization of Akt/PKB is required for efficient chemotaxis to cAMP in Dictyostelium. EMBO J. 1999;18:2092–2105. doi: 10.1093/emboj/18.8.2092. [DOI] [PMC free article] [PubMed] [Google Scholar]
- Haugh J M, Codazzi F, Teruel M, Meyer T. Spatial sensing in fibroblasts mediated by 3′-phosphoinositides. J Cell Biol. 2000;151:1269–1279. doi: 10.1083/jcb.151.6.1269. [DOI] [PMC free article] [PubMed] [Google Scholar]
- Servant G, Weiner O D, Herzmark P, Balla T, Sedat J W, Bourne H R. Polarization of chemoattractant receptor signaling during neutrophil chemotaxis. Science. 2000;287:1037–1040. doi: 10.1126/science.287.5455.1037. [DOI] [PMC free article] [PubMed] [Google Scholar]
- Servant G, Weiner O D, Neptune E R, Sedat J W, Bourne H R. Dynamics of a chemoattractant receptor in living neutrophils during chemotaxis. Mol Biol Cell. 1999;10:1163–1178. doi: 10.1091/mbc.10.4.1163. [DOI] [PMC free article] [PubMed] [Google Scholar]
- Janetopoulos C, Jin T, Devreotes P. Receptor-mediated activation of heterotrimeric G-proteins in living cells. Science. 2001;291:2408–2411. doi: 10.1126/science.1055835. [DOI] [PubMed] [Google Scholar]
- Jin T, Zhang N, Long Y, Parent C A, Devreotes P N. Localization of the G protein βγ complex in living cells during chemotaxis. Science. 2000;287:1034–1036. doi: 10.1126/science.287.5455.1034. [DOI] [PubMed] [Google Scholar]
- Li Z, Jiang H, Xie W, Zhang Z, Smrcka A V, Wu D. Roles of PLC-β2 and -β3 and PI3Kγ in chemoattractant-mediated signal transduction. Science. 2000;287:1046–1049. doi: 10.1126/science.287.5455.1046. [DOI] [PubMed] [Google Scholar]
- Niggli V, Keller H. The phosphatidylinositol 3-kinase inhibitor wortmannin markedly reduces chemotactic peptide-induced locomotion and increases in cytoskeletal actin in human neutrophils. Eur J Pharmacol. 1997;335:43–52. doi: 10.1016/s0014-2999(97)01169-2. [DOI] [PubMed] [Google Scholar]
- Devreotes P, Janetopoulos C. Eukaryotic chemotaxis: distinctions between directional sensing and polarization. J Biol Chem. 2003;278:20445–20448. doi: 10.1074/jbc.R300010200. [DOI] [PubMed] [Google Scholar]
- Iijima M, Devreotes P N. Tumor suppressor PTEN mediates sensing of chemoattractant gradients. Cell. 2002;109:599–610. doi: 10.1016/s0092-8674(02)00745-6. [DOI] [PubMed] [Google Scholar]
- Funamoto S, Meili R, Lee S, Parry L, Firtel R A. Spatial and temporal regulation of 3-phosphoinositides by PI 3-kinase and PTEN mediates chemotaxis. Cell. 2002;109:611–623. doi: 10.1016/s0092-8674(02)00755-9. [DOI] [PubMed] [Google Scholar]
- Li Z, Dong X, Wang Z, Liu W, Deng N, Ding Y, Tang L, Hla T, Zeng R, Li L, Wu D. Regulation of PTEN by Rho small GTPases. Nat Cell Biol. 2005;7:399–404. doi: 10.1038/ncb1236. [DOI] [PubMed] [Google Scholar]
- Janetopoulos C, Ma L, Devreotes P N, Iglesias P A. Chemoattractant-induced phosphatidylinositol 3,4,5-trisphosphate accumulation is spatially amplified and adapts, independent of the actin cytoskeleton. Proc Natl Acad Sci USA. 2004;101:8951–8956. doi: 10.1073/pnas.0402152101. [DOI] [PMC free article] [PubMed] [Google Scholar]
- Stephens L R, Jackson T R, Hawkins P T. Agonist-stimulated synthesis of phosphatidylinositol(3,4,5)-trisphosphate: a new intracellular signaling system? Biochim Biophys Acta. 1993;1179:27–75. doi: 10.1016/0167-4889(93)90072-w. [DOI] [PubMed] [Google Scholar]
- Vanhaesebroeck B, Leevers S J, Ahmadi K, Timms J, Katso R, Driscoll P C, Woscholski R, Parker P J, Waterfield M D. Synthesis and function of 3-phosphorylated inositol lipids. Annu Rev Biochem. 2001;70:535–602. doi: 10.1146/annurev.biochem.70.1.535. [DOI] [PubMed] [Google Scholar]
- Krishnan J, Iglesias P A. A modeling framework describing the enzyme regulation of membrane lipids underlying gradient perception in Dictyostelium cells. J Theor Biol. 2004;229:85–99. doi: 10.1016/j.jtbi.2004.03.005. [DOI] [PubMed] [Google Scholar]
- Hauert A B, Martinelli S, Marone C, Niggli V. Differentiated HL-60 cells are a valid model system for the analysis of human neutrophil migration and chemotaxis. Int J Biochem Cell Biol. 2002;34:838–854. doi: 10.1016/s1357-2725(02)00010-9. [DOI] [PubMed] [Google Scholar]
- Nasuhoglu C, Feng S, Mao J, Yamamoto M, Yin H L, Earnest S, Barylko B, Albanesi J P, Hilgemann D W. Nonradioactive analysis of phosphatidylinositides and other anionic phospholipids by anion-exchange high-performance liquid chromatography with suppressed conductivity detection. Anal Biochem. 2002;301:243–254. doi: 10.1006/abio.2001.5489. [DOI] [PubMed] [Google Scholar]
- Insall R H, Weiner O D. PIP3, PIP2, and cell movement—similar messages, different meanings? Dev Cell. 2001;1:743–747. doi: 10.1016/s1534-5807(01)00086-7. [DOI] [PMC free article] [PubMed] [Google Scholar]
- Rickert P W, Orion D, Wang F, Bourne H R, Servant G. Leukocytes navigate by compass: PI3K and its lipid products. Trends Cell Biol. 2000;10:466–473. doi: 10.1016/s0962-8924(00)01841-9. [DOI] [PMC free article] [PubMed] [Google Scholar]
- Fukami K, Matsuoka K, Nakanishi O, Yamakawa A, Kawai S, Takenawa T. Antibody to phosphatidylinositol 4,5-bisphosphate inhibits oncogene-induced mitogenesis. Proc Natl Acad Sci USA. 1988;85:9057–9061. doi: 10.1073/pnas.85.23.9057. [DOI] [PMC free article] [PubMed] [Google Scholar]
- Miyazawa A, Umeda M, Horikoshi T, Yanagisawa K, Yoshioka T, Inoue K. Production and characterization of monoclonal antibodies that bind to phosphatidylinositol 4,5-bisphosphate. Mol Immunol. 1988;25:1025–1031. doi: 10.1016/0161-5890(88)90010-7. [DOI] [PubMed] [Google Scholar]
- Doughman R L, Firestone A J, Wojtasiak M L, Bunce M W, Anderson R A. Membrane ruffling requires coordination between type I phosphatidylinositol phosphate kinase and Rac signaling. J Biol Chem. 2003;278:23036–23045. doi: 10.1074/jbc.M211397200. [DOI] [PubMed] [Google Scholar]
- Laux T, Fukami K, Thelen M, Golub T, Frey D, Caroni P. GAP43, MARCKS, and CAP23 modulate PI(4,5)P(2) at plasmalemmal rafts, and regulate cell cortex actin dynamics through a common mechanism. J Cell Biol. 2000;149:1455–1472. doi: 10.1083/jcb.149.7.1455. [DOI] [PMC free article] [PubMed] [Google Scholar]
- Wang Y J, Li W H, Wang J, Xu K, Dong P, Luo X, Yin H L. Critical role of PIP5KIγ87 in InsP3-mediated Ca2+ signaling. J Cell Biol. 2004;167:1005–1010. doi: 10.1083/jcb.200408008. [DOI] [PMC free article] [PubMed] [Google Scholar]
- Chen R, Kang V H, Chen J, Shope J C, Torabinejad J, DeWald D B, Prestwich G D. A monoclonal antibody to visualize PtdIns(3,4,5)P(3) in cells. J Histochem Cytochem. 2002;50:697–708. doi: 10.1177/002215540205000511. [DOI] [PubMed] [Google Scholar]
- Boronenkov I V, Loijens J C, Umeda M, Anderson R A. Phosphoinositide signaling pathways in nuclei are associated with nuclear speckles containing pre-mRNA processing factors. Mol Biol Cell. 1998;9:3547–3560. doi: 10.1091/mbc.9.12.3547. [DOI] [PMC free article] [PubMed] [Google Scholar]
- Hannah M J, Weiss U, Huttner W B. Differential extraction of proteins from paraformaldehyde-fixed cells: lessons from synaptophysin and other membrane proteins. Methods. 1998;16:170–181. doi: 10.1006/meth.1998.0664. [DOI] [PubMed] [Google Scholar]
- Nakamura F. Biochemical, electron microscopic and immunohistological observations of cationic detergent-extracted cells: detection and improved preservation of microextensions and ultramicroextensions. BMC Cell Biol. 2001;2:10. doi: 10.1186/1471-2121-2-10. [DOI] [PMC free article] [PubMed] [Google Scholar]
- Kiernan J A. Formaldehyde, formalin, paraformaldehyde and glutaraldehyde: what they are and what they do. Microscopy Today. 2000;8:8–12. [Google Scholar]
- Weiner O D, Neilsen P O, Prestwich G D, Kirschner M W, Cantley L C, Bourne H R. A PtdInsP3- and Rho GTPase-mediated positive feedback loop regulates neutrophil polarity. Nat Cell Biol. 2002;4:509–513. doi: 10.1038/ncb811. [DOI] [PMC free article] [PubMed] [Google Scholar]
- van Rheenen J, Jalink K. Agonist-induced PIP2 hydrolysis inhibits cortical actin dynamics: regulation at a global but not at a micrometer scale. Mol Biol Cell. 2002;13:3257–3267. doi: 10.1091/mbc.E02-04-0231. [DOI] [PMC free article] [PubMed] [Google Scholar]
- Doughman R L, Firestone A J, Anderson R A. Phosphatidylinositol phosphate kinases put PI4,5P2 in its place. J Membr Biol. 2003;194:77–89. doi: 10.1007/s00232-003-2027-7. [DOI] [PubMed] [Google Scholar]
- Stauffer T P, Ahn S, Meyer T. Receptor-induced transient reduction in plasma membrane PtdIns(4,5)P2 concentration monitored in living cells. Curr Biol. 1998;8:343–346. doi: 10.1016/s0960-9822(98)70135-6. [DOI] [PubMed] [Google Scholar]
- Hirose K, Kadowaki S, Tanabe M, Takeshima H, Iino M. Spatiotemporal dynamics of inositol 1,4,5-trisphosphate that underlies complex Ca2+ mobilization patterns. Science. 1999;284:1527–1530. doi: 10.1126/science.284.5419.1527. [DOI] [PubMed] [Google Scholar]
- Xu C, Watras J, Loew L M. Kinetic analysis of receptor-mediated phosphoinositide turnover. J Cell Biol. 2003;161:779–791. doi: 10.1083/jcb.200301070. [DOI] [PMC free article] [PubMed] [Google Scholar]
- Tall E G, Spector I, Pentyala S N, Bitter I, Rebecchi M J. Dynamics of phosphatidylinositol 4,5-biphosphate in actin-rich structures. Curr Biol. 2000;10:743–746. doi: 10.1016/s0960-9822(00)00541-8. [DOI] [PubMed] [Google Scholar]
- Watt S A, Kular G, Fleming I N, Downes P C, Lucocq J M. Subcellular localization of phosphatidylinositol 4,5-bisphosphate using the pleckstrin homology domain of phospholipase C. Biochem J. 2002;363:657–666. doi: 10.1042/0264-6021:3630657. [DOI] [PMC free article] [PubMed] [Google Scholar]
- Li Z, Dong X, Wang Z, Liu W, Deng N, Ding Y, Tang L, Hla T, Zeng R, Li L, Wu D. Regulation of PTEN by Rho small GTPases. Nat Cell Biol. 2005;7:399–404. doi: 10.1038/ncb1236. [DOI] [PubMed] [Google Scholar]
- Subramanian K K, Narang A. A mechanistic model for eukaryotic gradient sensing: spontaneous and induced phosphoinositide polarization. J Theor Biol. 2004;231:49–67. doi: 10.1016/j.jtbi.2004.05.024. [DOI] [PubMed] [Google Scholar]
Associated Data
This section collects any data citations, data availability statements, or supplementary materials included in this article.


