

Abstract
The rates and patterns of spontaneous mutation are fundamental parameters of molecular evolution. Current methodology either tries to measure such rates and patterns directly in mutation-accumulation experiments or tries to infer them indirectly from levels of divergence or polymorphism. While experimental approaches are constrained by the low rate at which new mutations occur, indirect approaches suffer from their underlying assumption that mutations are effectively neutral. Here I present a maximum-likelihood approach to estimate mutation rates from large-scale polymorphism data. It is demonstrated that the method is not sensitive to demography and the distribution of selection coefficients among mutations when applied to mutations at sufficiently low population frequencies. With the many large-scale sequencing projects currently underway, for instance, the 1000 genomes project in humans, plenty of the required low-frequency polymorphism data will shortly become available. My method will allow for an accurate and unbiased inference of mutation rates and patterns from such data sets at high spatial resolution. I discuss how the assessment of several long-standing problems of evolutionary biology would benefit from the availability of accurate mutation rate estimates.
NUCLEOTIDE mutations are the ultimate source of genetic variation within populations and between species. Mutations initially occur in individuals, yet some might subsequently become fixed in the population. Such substitution events underlie the evolution of species. Precise knowledge of the rates and patterns of spontaneous nucleotide mutation is hence of essential importance for our understanding of the evolutionary process.
The characteristics of mutations can be analyzed by mutation-accumulation experiments (Luria and Delbrck 1943; Denver et al. 2004; Haag-Liautard et al. 2008; Lynch et al. 2008). These approaches are confined, however, to experimentally feasible organisms. Their accuracy is also limited by the generally low rate at which new mutations occur in individuals. Mutation patterns might furthermore be peculiar in specific analyzed strains. An accurate estimation of mutation rates and patterns on local genomic scales by mutation-accumulation experiments is clearly beyond the scope of present-day experimental capabilities.
For practical purposes, one therefore often uses indirect approaches to investigate mutation characteristics. Indirect approaches are based on predictions from population genetics theory that quantitatively link the mutational processes to the expected levels of divergence between species or polymorphism within a population. They typically rely on the assumption that mutations are effectively neutral.
For example, population genetics theory predicts that the amount of polymorphism in a population is related to the quantity θ = 4Neμ, where μ is the rate of spontaneous mutation in an individual genome and Ne is the effective population size. A variety of different estimators for θ from polymorphism data exist (Ewens 2004), but all either depend on the neutrality assumption or require explicit knowledge about the distribution of selection coefficients among new mutations.
Polymorphism-based approaches are also particularly sensitive to demography, especially when they utilize polymorphism data over the full range of population frequencies. A population bottleneck, for instance, can remove a large amount of polymorphism from the population. Mutation rates estimated from the amount of polymorphism under the assumption of constant population size might then substantially underestimate the true rates (Tajima 1989b).
Population genetics theory also links mutations and substitutions. Here it is predicted that substitution rates equal mutation rates if mutations are effectively neutral (Kimura 1968). The rates and patterns of substitution between species can thus provide a proxy for rates and patterns of mutation in individuals under the above assumption.
Such divergence-based approaches underlie most of our present estimates of mutational parameters (Nachman and Crowell 2000; Kumar and Subramanian 2002; Ellegren et al. 2003). Primarily this might be due to the greater availability of divergence compared to polymorphism data. Divergence-based analyses should also be less affected by demography than polymorphism-based approaches, yet they rely more crucially on the assumption of selective neutrality.
The widespread acceptance of divergence-based approaches relates to Kimura's influential “neutral theory of molecular evolution,” which surmises that most substitutions and observed polymorphisms are indeed effectively neutral (Kimura 1968). On a genomewide scale, the effects of selection on the population dynamics of new mutations can hence safely be neglected, even more so when restricting analyses to presumably unconstrained regions of genomes like pseudogenes, inactivated transposable elements, or fourfold degenerate codons.
In recent years the neutral theory has been strongly challenged. There is accumulating evidence that in many species selection is far more prevalent than previously thought (Fay et al. 2002; Andolfatto 2005; Bustamante et al. 2005; Eyre-Walker 2006; Begun et al. 2007; Nielsen et al. 2007; Macpherson et al. 2007; Cai et al. 2009). In addition, biased gene conversion (BGC), which with regard to allele frequency dynamics operates identically to selection, seems to be acting in many higher organisms (Nagylaki 1983; Galtier and Duret 2007). In the light of such evidence it remains questionable to what extent indirect approaches that measure levels of divergence or polymorphism at “presumably neutrally” evolving sequence regions may still provide accurate estimates for the true rates and patterns of mutation.
In principle, many of the biases that result when mutations are not effectively neutral should vanish when utilizing polymorphism data at very low population frequencies. This is because the population dynamics of low-frequency alleles are predominantly governed by stochastic, rather than selective forces. In this regime, all mutations should behave similarly, irrespective of their particular selection coefficients. Moreover, mutations at low population frequencies should also be less affected by past demographic events because on average they are younger than mutations at higher frequencies (Kimura and Ohta 1973).
A more intuitive example of why low-frequency mutations should become less sensitive to both selection and demography is to consider the extreme limit of mutations that are present in only one individual of the population. These mutations are likely to have just occurred in the parental germline. They will neither be influenced by the species demography nor be influenced by selection—except for dominant lethals. One can therefore expect such mutations to reflect the “true” rates and characteristics of the underlying mutational processes.
Single-nucleotide polymorphism (SNP) data at sufficiently low population frequency should hence allow for the inference of rates and patterns of spontaneous nucleotide mutation in a way that is less affected by the distribution of selection coefficients among new mutations and the particular demographic history of the species. Such an approach has not been feasible so far due to the lack of genomewide SNP data at the required low population frequencies.
This restriction will shortly be overcome. Several large-scale sequencing projects are presently being conducted, for example, the 1000 genomes project in humans (Kaiser 2008). These experiments will provide large amounts of genomewide SNP data at sufficiently high population resolution, finally making the regime of low-frequency variation accessible for quantitative investigation. To utilize such data for an unbiased inference of mutational parameters, one requires estimators that isolate particular frequency classes from the frequency spectrum of SNPs.
Here I develop a maximum-likelihood (ML) method for measuring θ from the observed numbers of SNPs at particular population frequencies. When applied to low-frequency SNPs, it allows for an unbiased inference of mutation rates and patterns at high regional resolution and accuracy. The method does not require prior knowledge of the distribution of selection coefficients among new mutations or the demographic history of the species. I demonstrate that ML estimates always converge to the true rates as long as investigated population frequencies are sufficiently low. Analytical formulas for the deviations between ML estimates and the true rates in the presence of selection and demography are also provided, and it is discussed how these deviations, in turn, can be used to infer selection and demography.
The method is expected to yield accurate and robust mutation rate estimates from the anticipated SNP data sets. For the 1000 genomes project in humans I estimate that the expected spatial resolution of the method should allow for a regional inference of mutation rates on genomic length scales <100 kbp.
The availability of regionally resolved rates and patterns of spontaneous mutation would encourage the assessment of many important problems in evolutionary biology (Duret 2009). Examples include the elucidation of the relative contributions of drift and selection to evolution, the investigation of extent and characteristics of BGC, and the characterization of inherent biases of mutation processes. The application of my ML approach and its potential advantages over substitution-based approaches for such analyses is discussed at the end of this article.
BACKGROUND
The aim of this study is to establish a ML methodology for inferring the rates of spontaneous mutation from the numbers of low-frequency SNPs in polymorphism data sets. To compute likelihoods of observed counts given particular mutational parameters one requires a probabilistic model of the expected numbers of such counts. The starting point for this probabilistic model is the expected frequency distribution of mutations in the source population from which the SNP data have been obtained. Fortunately, an analytic formula for this distribution already exists. It is discussed in the following.
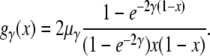
Let us consider a panmictic population of N diploid individuals. Mutations are characterized by their selection coefficients s, and codominance is assumed. Individuals heterozygous for a mutation have fitness 1 + s, homozygotes have fitness 1 + 2s, and individuals without the mutation have fitness 1. Mutations are modeled according to an infinite-sites model. Mutations with selection coefficient s arise in individuals by a Poisson process with rate μγ, where γ = 2Ns determines the strength of selection associated with a mutation. Different mutations evolve independently of each other. Segregating sites in the population can be classified according to the γ's of their mutant alleles. For each class γ, we define with gγ(x) the expected average number of segregating sites in the population at which the mutant allele is present at population frequency x, the so-called site frequency spectrum (SFS). Under mutation-selection equilibrium, Wright (1938) has shown that
 |
(1) |
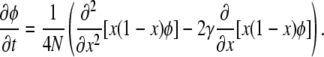
The SFS can also be deduced from Kimura's seminal diffusion approximation for the stochastic dynamics of allele frequencies in a population under the influence of random genetic drift and selection (Kimura 1964; Sawyer and Hartl 1992; Ewens 2004). As this framework will prove instructive for my further analysis, it is shortly outlined here. Let φ(p, x, t) be the conditional probability density that a mutation from class γ is at frequency x in the population at time t, given that its initial frequency is p at time t = 0. The stochastic dynamics of φ(p, x, t) per generation in the diffusion approximation are then determined by
 |
(2) |
The first term on the right-hand side describes the stochastic influence of random genetic drift on φ(p, x, t), and the second term specifies the average deterministic rate of change in x due to selection. In the limit of low frequencies x, Equation 2 is dominated by the drift term and the relative contribution of selection to the variance in allele frequency between generations becomes negligible. Consequently, one can also expect the distribution (1) to converge to its neutral asymptotics gγ→0(x) for small x. Indeed, Taylor series approximations yield
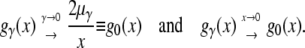 |
(3) |
Examples for the rate of convergence can be seen in Figure 1, where distributions gγ(x) are shown for several exemplary values of γ.
Figure 1.—

Expected number of mutant alleles present at frequency x in a population. Distributions gγ(x) are shown for several different selection classes, always using μγ = 1. The solid line is the neutral asymptotics, g0(x) = 2/x, which in the double-logarithmic plot appear as a straight line with slope −1. Compared with neutral mutations, deleterious mutations (γ < 0) are systematically suppressed from reaching higher frequencies in the population, and beneficial mutations (γ > 0) are enriched at high frequencies. In the low-frequency limit all distributions converge to the neutral SFS, although convergence occurs substantially faster for beneficial than for deleterious mutations.
From the SFS for class γ one can calculate the expected overall number of segregating sites in the population from that class,
 |
(4) |
Here the sum is taken over all possible frequencies in a diploid population of N individuals,  . The normalized distribution of mutant frequencies is then
 |
(5) |
Note that ργ(x) does not depend on μγ because both numerator and denominator are proportional to the mutation rate.
It needs to be pointed out that the diffusion approximation, and thus the SFS derived from it, are valid only in a restricted regime of population parameters. This regime is specified by the conditions  and
and  . The latter condition implies that lethal and semilethal mutations cannot be treated in terms of the diffusion approximation. Such mutations therefore need to be excluded from further analysis.
RESULTS
In principle, the rate of spontaneous mutation can be calculated from the SFS (1) by measuring gγ(x) at given frequencies x, provided that one knows the selection coefficients of mutations and that the population can be assumed to be in mutation–selection equilibrium.
Both prerequisites will often not be fulfilled. SNP frequency data are typically obtained from genomic regions for which one has no prior knowledge about the distribution of selection coefficients among new mutations. And the SFS can substantially deviate from mutation–selection equilibrium for nonstationary demographic histories. In addition, one also has to account for possible sampling biases resulting from the fact that SNP frequency data will be estimated from only a sample of genotyped individuals from the population.
In this section I first describe a ML approach to infer mutation rates μγ for SNPs from a given selection class γ that assumes mutation–selection equilibrium, yet accounts for sampling biases due to a finite number of sequenced strains. I then show how this approach can be applied to SNP data from mutations with an unknown distribution of selection coefficients by restricting the analysis to very low-frequency SNPs. Quantitative expressions for the expected errors are also derived. I finally discuss how my method is affected by a breach of mutation–selection equilibrium due to demographic forces such as recent population expansions and bottlenecks. It is demonstrated that the influence of demography on my estimates is effectively reduced to only very recent population size changes when focusing on low-frequency SNPs.
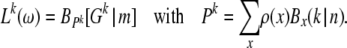
ML estimation of μγ for a given selection coefficient:
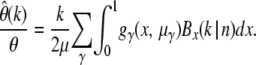
Let us assume a sequence region was genotyped in n individual haploid genomes. The true frequency of a mutation from class γ in the population that is observed in k of n genotyped sequences will not be exactly x = k/n. Instead, x will be specified in terms of a probability distribution. One can calculate this distribution via Bayes' theorem,
 |
(6) |
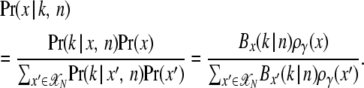
Here I used ργ(x) from Equation 5 as a prior. Bx(k | n) denote binomial distributions to incorporate the effects of sampling. In Figure 2, Pr(x | k, n) is shown for neutral mutations and exemplary values of k. Depending on the value of γ, the true population frequency of a mutation can be substantially overestimated by simply using x = k/n as a proxy for x.
Figure 2.—

Probability density Pr(x | k, n) that a neutral mutation has population frequency x in a population of size N = 104 if it is observed in k of n = 1000 genotyped sequences.
The denominator of (6) defines the marginal probability to observe a mutation from class γ in k of n genotyped sequences,
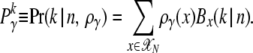 |
(7) |
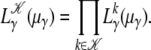
Let  be the measured overall number of mutations from class γ that are observed in k of the n genotyped sequences. The probability to observe
  , given that mγ(μγ) sites are segregating in the population, is then again a binomial distribution. This probability defines a likelihood function for the underlying mutation rate μγ,
 |
(8) |
By maximizing  (μγ) over μγ the ML estimate for the data can be derived. One can also measure values
  for a set of sample frequencies,
  , and calculate
  for the entire set,
 |
(9) |
Here it is assumed that likelihoods  for different k are independent of each other, which should be a reasonable approximation as long as
  .
.
ML estimation of μ for arbitrary distributions of selection coefficients:
From Equations 8 and 9 one can derive ML estimates of μγ from measuring counts of mutations from class γ in a sample of n genotyped individuals. This approach is of limited practicality because SNPs in a given sequence region will comprise mutations with several different selection coefficients, the distribution of which we are unlikely to have prior knowledge of. When measuring the number of mutations present in k of n genotyped sequences, an overall count for mutations from all different classes of selection coefficients will be obtained,
 |
(10) |
The rate of spontaneous mutation in the investigated region can be defined by summing over all individual rates μγ,
 |
(11) |
The true likelihood function for μ is again a binomial distribution. Formally it is given by
 |
(12) |
Here m(μ) is the (unknown) expected number of segregating sites and Pk is the (unknown) probability to find a mutant allele in k of n sequences at a segregating site.
In the following I show that even without knowledge of the particular distributions of selection coefficients, and thus the precise values of m(μ) and Pk, one can still infer accurate ML estimates of μ by restricting the analysis to mutations at low population frequency ( ) and approximating Lk(μ) by the neutral-likelihood function
 |
(13) |
Mathematically it is not immediately obvious that this neutral approximation always works. After all, both parameters m0(μ) and  of the neutral-likelihood function can substantially differ from their true values m(μ) and Pk if selection coefficients are not zero. For example, if many mutations are deleterious, then there will be fewer segregating sites compared to the neutral expectation. One will therefore overestimate the expected overall number of SNPs in the population by using m0(μ) as a proxy. The SFS at those sites, on the other hand, will be skewed toward smaller frequencies compared to the neutral expectation. Hence one will underestimate the probability to observe a mutation at low frequency at a given segregating site. In the next paragraph I show analytically that both deviations compensate for each other in the limit x → 0.
Let us assume that selection coefficients among new mutations are distributed according to an (unspecified) distribution ω = {ωγ} in terms of the individual ratios ωγ = μγ/μ. To start my derivation, I first point out that an accurate calculation of Lk and L0k relies on large-enough numbers Gk. The expectation value of Gk can be calculated by
 |
(14) |
with θ = 4Nμ. The corresponding expectation of Gk under the assumption of neutrality yields
 |
(15) |
In the third line I exchanged the summation over all frequencies from the set  by an integral over the interval [0, 1], which is feasible if
  . Note that
  is independent of the number of genotyped strains.
The low-frequency asymptotics of the likelihood functions (12) and (13) are technically obtained by evaluating L1(μ) and  (μ) in the limit n → ∞, and I hence require that
  and
and  . In this regime, the central limit theorem states that the binomial distribution
  converges to a normal distribution with mean m0
 = θ and variance
  . Accordingly, the true-likelihood function L1(μ) will converge to a normal distribution with mean and variance
  . A normal distribution is unambiguously defined by its mean and variance. To prove that the true-likelihood function always converges to the neutral-likelihood function in the low-frequency limit, it thus suffices to show that
 |
(16) |
To calculate the limit let us first consider products of the form
 |
(17) |
The last integral can be expressed in terms of incomplete gamma functions,  ,
,
 |
(18) |
This result applies for arbitrary ωγ; therefore
 |
(19) |
From the central limit theorem it then immediately follows that
 |
(20) |
I have shown above that the true-likelihood function converges to the neutral-likelihood function in the limit x → 0 for arbitrary distributions of selection coefficients. One can hence expect ML estimates derived by the neutral-likelihood function from low-frequency SNPs in a given genomic region to approximate the true rates for that region. If observed values Gk are sufficiently large, the neutral-likelihood function converges to a Gaussian distribution
 |
(21) |
For a given k, my ML estimator for θ will hence be of the simple form
 |
(22) |
When both alleles at a polymorphic site are counted, i.e., the folded spectrum  is measured, then the estimator
  is consistent with the expectation value
 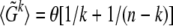 derived in Tajima (1989a). Note that for unfolded spectra,
  does not depend on the overall number n of genotyped strains, yet the expected error of
  resulting from nonneutral mutations will. The magnitude of such errors is calculated below. For neutral mutations the estimator is correct for all k and also consistent with Watterson's commonly used estimator
  (Watterson 1975), which is based on the overall number
  of segregating sites observed in a sample of n genotyped sequences,
 |
(23) |
Sensitivity to selection:
What will be the error of the estimator  if mutations are not neutral? My ML approach provides a straightforward way to calculate the expected error for an assumed distribution ω of selection coefficients: Analogously to Equation 21 one can also approximate the true-likelihood function (12) by a Gaussian distribution. Its mean and variance are given by
  . From Equations 14 and 15 it then follows that
 |
(24) |
In Figure 3 values of the expected relative errors  are shown for different strengths of selection and different values of k in an assay of 1000 genotyped sequences. For simplicity it is assumed that all mutations have the same selection coefficient γ. Hence, the distribution ω of selection coefficients has only one nonzero value ωγ = 1. Figure 3 confirms the expectation that the relative error of
  increases for more negative selection coefficients and higher sample frequencies k. But it will still be sufficiently small for practicable sample frequencies as long as selection is not too strong. For example, when estimating
  at k = 5 with n = 1000, the true rate will be underestimated by <10% for γ = −10 and still only ∼40% for γ = −50. Deviations due to positive selection are very small and limited by an upper bound that does not depend on the actual strength of selection.
Figure 3.—

Expected relative errors  according to Equation 24 for nonneutral mutations as a function of γ for three different k = 2, 5, and 10 in a sample of n = 1000 genotyped sequences.
In Figure 4 full-likelihood curves  are shown for several mutation scenarios. I thereby first calculated, for a given mutation scenario ω, the average number
  of mutants one expects to observe in k of n samples according to Equation 14. From rounded values Gk = round
 neutral-likelihood curves
  were calculated as defined by Equation 13. The maxima of the likelihood curves approach the correct mutation rate as k becomes smaller. Errors
  accurately coincide with the values predicted by Equation 24.
Figure 4.—

Neutral-likelihood curves  for several mutation scenarios. The mutation rate is always μ = 0.005. The distribution of selection coefficients for a particular scenario is specified by the parameters ωγ. The expected counts of mutations to be observed in k of n = 1000 samples,
  , were estimated from Equation 14 for each mutation scenario. Likelihoods
  were calculated according to Equation 13. The size of the source population was N = 104.
Equation 24 also allows one to calculate the expected error of the estimator  if selection coefficients among new mutations are specified in terms of their distribution. However, the shape of this distribution is much debated and hypotheses vary widely (Keightley 1994; Fay et al. 2001; Nielsen and Yang 2003; Piganeau and Eyre-Walker 2003; Yampolsky et al. 2005; Boyko et al. 2008). Clearly one will also expect distinct distributions for different species and different classes of mutational events. Nonsynonymous mutations, for example, are likely to have different distributions of selective effects than synonymous mutations (Akashi and Schaeffer 1997). And mutations in noncoding regions will again differ from both of the above.
For calculating error bounds of  due to nonneutral mutations one does not require full knowledge of the distribution of selection coefficients. It suffices to have upper limits for one or more of its quantiles. We have already seen in Figure 3 that positive selection will not significantly influence the error. Hence, if we know that maximally a fraction δγ of new mutations is more deleterious than a particular γ < 0, then the limit for the expected error can be calculated by
 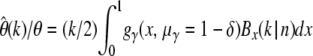 according to Equation 24. This means one would very conservatively assume that a fraction 1 − δ of mutations has selection coefficient γ, and the remaining mutations would be so deleterious that they are never observed as SNPs. Information on additional quantiles can be incorporated analogously.
Sensitivity to demography:
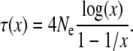
Demographic events can cause substantial deviations of the SFS from its equilibrium shape. A recent population expansion, for example, will lead to a SFS that is skewed toward lower frequencies because new mutations that emerged after the expansion have not yet had enough time to reach higher population frequencies (Slatkin and Hudson 1991). Population bottlenecks can substantially reduce the overall number of polymorphic sites in a population and lead to a more uniform SFS. Bottlenecks and expansions are common demographic patterns in several species, including Drosophila melanogaster (Li and Stephan 2006; Thornton and Andolfatto 2006) and human (Harpending et al. 1998). It is therefore essential to investigate how the SFS, and consequently my ML estimates, are affected by such demographic events.
For neutral polymorphism, the expected shape of the SFS in demographic histories with population size changes can be calculated analytically following the approach outlined in Williamson et al. (2005). The key idea is to segment the demographic history into a sequence of time intervals where population size is constant within each interval, but changes instantaneously between intervals. The demographic history is then specified by the sequence N1, N2,…, Nn of population sizes in the successive intervals and the numbers of generations τ1, τ2,…, τn each interval lasted.
The transition probability density φi(p, x, τi) that an allele, initially present at population frequency p at the end of stage i − 1, has frequency x at the end of stage i is given by the transient solution of Equation 2 for γ = 0. It has been calculated by Kimura as
 |
(25) |
Here Ti−1(x) are Gegenbauer polynomials, which can be defined in terms of hypergeometric functions, Ti−1(x) = (i/2)(i + 1)F[i + 2, 1 − i, 2, (1 − x)/2]. See, e.g., Crow and Kimura (1970) for a discussion of Equation 25 and its derivation.
New mutations arise at rate 2μNi during stage i and have initial population frequency 1/(2Ni). We can express gi(x), the SFS at the end of stage i, as a function of gi−1(x) at the end of stage i − 1 plus the contribution of new mutations that entered the population during stage i,
 |
(26) |
This allows for an iterative calculation of the present-day g(x) given an initial g0(x), usually chosen as the SFS at one point in the past when equilibrium was assumed to hold. Note that the farther back in time g0(x) lies, the less influence its particular shape will have on g(x). Especially the most relevant low-frequency part of g(x) will be governed predominantly by recent mutations and hence will be less affected by ancient demographic events.
Kimura also succeeded in deriving analytic solutions for the diffusion Equation 2 in the presence of selection (Crow and Kimura 1970), but expressions for the transition probabilities become very complex. However, for small frequencies x the diffusion equation is always dominated by the drift term, and so will be the transition probabilities φ(p, x, t) when both p and x are small. The influence of selection on g(x) should therefore become negligible for small x irrespective of the particular demographic scenario.
If the precise demographic history of a population is known, one can obtain the expected present-day SFS g(x) by iterative application of Equation 26. In practice, though, estimates of the demographic history of a population are often unknown or at least surrounded by considerable uncertainty. How accurate will it be in such cases to apply the simple estimator  from Equation 22 to infer the present-day value θc = 4Ncμ with the contemporary population size Nc? For a given demographic scenario one can easily calculate the expected relative error by
 |
(27) |
Note the structural analogy to Equation 24, where the relative error of  under constant population size but in the presence of selection was calculated.
I investigated the magnitude of the expected error for three prominent demographic scenarios to show that  provides accurate estimates for θc when evaluated at small k. The first model (Figure 5A) is a scenario suggested for the African-American human subpopulation that features an instantaneous population growth (Boyko et al. 2008). The second and third models are two scenarios proposed for the European D. melanogaster subpopulation. The model of Li and Stephan (2006) supposes an ancient population expansion followed by a severe population bottleneck (Figure 5B). The comparatively simpler model of Thornton and Andolfatto (2006) supposes only a population bottleneck (Figure 5C). All three demographic scenarios can be expected to yield present-day SFS that substantially deviate from the equilibrium of Equation 3.
Figure 5.—

Analysis of the expected errors  for three exemplary demographic scenarios. The time arrows in the three scenarios (A–C) go from the past to the present (tips of the arrows). Intervals of constant population size are specified by their respective population sizes Ni and durations τi. Population size changes instantaneously between intervals. Dotted lines specify ancient points in time at which an equilibrium SFS was assumed. The sample size in D was n = 1000.
I numerically estimated the expected present-day SFS g(x) for the three demographic scenarios by performing extensive forward simulations. For practical application, the simulation approach turns out to be more efficient compared to a semianalytical approach based on the calculation of Equation 26 because the infinite sums in the transition probabilities (25) converge only very slowly if initial frequencies p are small.
For my simulations I assumed that the SFS was in equilibrium (3) at an ancient point in time (dotted lines in Figure 5, A–C). Expected numbers of segregating neutral sites at that time, m0, and their normalized frequency distribution were calculated according to Equations 3–5 for a chosen value of μ. Then m0 sites were drawn randomly from the frequency distribution and their trajectories were simulated by binomial sampling under a Wright–Fisher model for the particular demographic scenario.
New mutations arising in stage i were modeled by a Poisson process with rate 2μNi. Their frequency dynamics were also simulated by binomial sampling starting from the respective initial frequencies p = 1/(2Ni). The expected present-day SFS g(x) for each demographic scenario was then obtained by combining the present-day frequencies of all simulated segregating sites. I chose values μ = 10.0 for scenario A, μ = 1.0 for scenario B, and μ = 0.01 for scenario C, which resulted in sufficiently large numbers of segregating sites to approximate g(x) in each scenario with high accuracy.
The simulation algorithm was implemented in C++. Runs were performed on up to 250 CPUs of the Bio-X2 cluster at Stanford University. All software is available from the corresponding author upon request.
In Figure 5D error ratios  according to Equation 27 using the numerically estimated g(x) are shown for the three demographic models. As expected,
  converges to the correct θc in all three demographic scenarios if k is chosen sufficiently small. For scenario A, the proposed demographic model for African-American humans, the relative error will be <5% when estimated at k = 5. Errors for the two demographic models of the European D. melanogaster subpopulation are larger, but still converge to the correct present-day estimates for small enough k.
DISCUSSION
Low-frequency polymorphism contains valuable information on the characteristics of mutational processes. At low population frequencies, the dynamics of derived alleles closely resemble those of effectively neutrally evolving mutations. Low-frequency alleles will also be comparatively young. Methods that infer mutational parameters from low-frequency variation should thus be less affected by selective and demographic effects compared to divergence-based methods or those based on the full frequency spectrum of polymorphism.
Deep and large-scale SNP data sets comprising sufficient numbers of sequenced individuals to allow for a comprehensive analysis of low-frequency SNPs will shortly become available. Hence there is clearly a need for analysis methods that can focus on genetic variation at particular population frequency classes for such inference.
I presented a ML method for the estimation of mutation rates from polymorphism data that can be applied to every frequency class separately. My approach works by comparing the measured counts Gk of mutations that are present in a particular number k of n genotyped sequences to their expectation for a given underlying mutation parameter θ in terms of the simple neutral estimator  . It can be applied specifically to low-frequency SNPs, and above I showed that the neutral approximation is valid for this regime. This way my ML approach does not require prior knowledge of the distribution of selection coefficients among new mutations and, in addition, becomes less sensitive to past demographic events.
Error sources and their evaluation:
The expected errors of the estimator  in a practical analysis can be divided into four categories: (i) stochastic errors due to sampling, (ii) errors resulting from inaccuracy of the SNP data set, (iii) SNP polarization errors, and (iv) systematic errors due to violation of my assumptions. They are discussed in order.
Stochastic sampling errors are fully incorporated in my likelihood analysis. The magnitude of such errors can be derived by calculating confidence intervals around ML estimates from the likelihood function (13) or its Gaussian approximation (21).
Data set inaccuracies will primarily result from sequencing errors or misalignment. They can lead to wrongly identified or missed SNPs and incorrect estimation of SNP frequencies in the sample (Hellmann et al. 2008; Lynch 2008; Liu et al. 2009). The resulting errors in my ML estimates will be determined by the probability of such errors in the data set. One can substantially reduce their magnitude by disregarding singletons (k = 1) or setting an even higher threshold for the minimum k used in the analysis. For example, assuming a sequencing error rate of 10−5, a genome size of 3 × 10⁹, and 1000 sequenced genomes, the expected number of in fact nonpolymorphic sites that are erroneously identified as being polymorphic with k = 4 would be on the order of only one.
-
It has been assumed so far that all SNPs in the data set are perfectly polarized; i.e., for every polymorphic site we have exact knowledge of which is the derived allele and which is the ancestral allele. Although such information can in principle be obtained from comparison with an out-group species, it might be prone to error. However, given that my analysis intends to focus on variation at very low population frequency, it is presumably much safer to simply assume that the low-frequency allele is always the derived allele and not to refer to an out-group species for such classification.
The expected number of wrongly classified alleles by this approximation can be easily estimated from the SFS (1). Let us consider a SNP with minor allele frequency x and assume that the derived allele is neutral. Then the probability that the derived allele is actually the one at the larger frequency is g0(1 − x)/[g0(x) + g0(1 − x)] = x. And thus this error will be small for low-frequency SNPs. For deleterious mutations it will be even yet smaller. For beneficial mutations, on the other hand, the error probability can ultimately become as large as 0.5. If a substantial number of beneficial mutations are expected in the data set, SNP polarization by an out-group species might indeed be advisable.
-
Systematic errors can arise in my analysis if one or more of its underlying assumptions are violated. One basic assumption is the applicability of an infinite-sites model. It might be violated in large SNP data sets if sites with more than two alleles are observed. Having decided on a threshold minimum k, alleles that occur in less than the minimum k sequences can simply be masked. In the rare case that more than two alleles are present at a polymorphic site above the threshold one can either disregard these sites and estimate the resulting error from the fraction of such sites in the data or treat all individual low-frequency alleles at one site as independently derived alleles at different sites.
More critical are systematic biases due to selection or demography. With Equations 24 and 27 I provided analytic expressions for the expected errors of
 when the full distribution of selection coefficients among new mutations, respectively the particular demographic history of the species, is known. I quantitatively investigated the magnitude of these errors for a wide range of selection coefficients (Figure 3), as well as several prominent demographic scenarios (Figure 5), showing that
  becomes insensitive to both selection and demography when estimated at small enough k.
My ML method provides a simple test to check the robustness of the estimator  directly from the data. The key observation for this test is that
  should be constant for all k if the underlying assumptions of neutrality and unvarying population size are sufficiently met. Both nonneutral mutations and past demographic events will lead to characteristic biases in
  that depend on k in a systematic manner: In the presence of many deleterious mutations, for example, one expects
  to decrease with increasing k because the SFS for deleterious mutations is skewed toward smaller frequencies compared to the neutral spectrum. Prevalent positive selection, on the other hand, should lead to a systematic increase of
  at larger k. Similar arguments hold for violations of the assumption of constant population size as discussed earlier.
When combining the effects of demography and selection, complex interactions can arise. Yet it is highly unlikely that selective and demographic effects compensate for each other in a way that makes the present-day SFS appear unaffected by both. Therefore, if no strong systematic changes of  are observed for the data when varying k, assumptions are most likely appropriate.
Interpretation of  for complex demographic histories:
From  one obtains estimates of the rates of spontaneous mutation only in terms of the population parameter θ = 4Nμ, as is typical for methods that utilize polymorphism data for such inference. Absolute values of μ thus cannot be obtained, unless one knows the precise value of N. This raises the question which N the estimator refers to, especially in the presence of complex demographic histories.
In population genetic analyses this problem is usually tackled by the introduction of an effective population size, Ne, specifying the actual rate of change of allele frequencies in the population due to random genetic drift. Effective population sizes are influenced by a variety of factors, including population substructure, selection, and demography (Charlesworth 2009). Often Ne is much lower than the current number of individuals in a species (Frankham 2007).
If only effects of demography are taken into account and we assume that all sites in a genome evolve independently of each other, then Ne for neutral variation can be expressed in terms of the demographic history N(t) of the species. Here N(t) is the actual number of individuals in the species at time t, measured backward in time from t = 0 at present. The effective population size for a neutral allele that emerged τ generations ago will be given by the harmonic mean of N(t) over its time of existence (Charlesworth 2009),
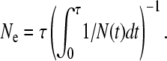 |
(28) |
Note that the harmonic mean of N(t) over an interval is dominated by its smallest values in that interval. The average age of a derived allele, however, is itself a function of population frequency x and effective population size (Kimura and Ohta 1973), determined by
 |
(29) |
The effective population size corresponding to a derived allele present at population frequency x will therefore be a function Ne(x). It can be obtained by simultaneously solving the combined system (28) and (29) for the given demographic history N(t).
When estimating  at different k we are comparing segregating sites at different population frequencies x. The effective population size corresponding to a small k will hence not be affected by demographic events that occurred more than τ(k/n) generations ago. SNPs at population frequency x = 0.5%, for example, will have Ne ∼ Nc if the population size did not change substantially from its contemporary size during the last 0.1 × Nc generations.
The relation between k and the corresponding Ne also explains why decreasing ratios  are observed for the three demographic scenarios of Figure 5; they all feature smaller population sizes in the past compared with current sizes Nc. Low-frequency SNPs have not “felt” these smaller population sizes, whereas the population dynamics of SNPs contributing to
  at larger k might be entirely dominated by the smaller population sizes in the past. In fact, for the simple two-stage scenario A, the estimator
  converges precisely to 4Naμ for large k (data not shown).
Background selection and selective sweeps:
Besides demography, also other evolutionary forces can decrease the effective population size. Adaptive substitution events, for instance, can lower Ne for SNPs in their genomic vicinity as a consequence of linkage disequilibrium (Kaplan et al. 1989). A similar reduction is expected to result from background selection (Charlesworth et al. 1993). In contrast to demography, which should affect Ne genomewide, background selection and selective sweeps can cause local variation of Ne along a genome.
Again, it holds that the lower the frequency of a SNP, the lower is the probability that it has been affected by such events. I illustrate this by a rough calculation for the expected effects of genetic hitchhiking in Drosophila. Macpherson et al. (2007) estimated that a neutral polymorphism destined for fixation will, on average, experience two selective sweeps in its genomic vicinity. If we assume a constant population size N, then the average time to fixation of a neutral polymorphism is 4N generations (Ewens 2004). One can thus roughly estimate the rate at which SNPs are affected by sweeps to be 1/(2N) per generation. A SNP at population frequency x has then been affected by a sweep with probability τ(x)/(2N). For a frequency x = 0.5% this yields a probability of only ∼5%.
Inferring selection and demography:
The present-day SFS g(x) is a function of the mutation parameter θ, the distribution of selection coefficients among new mutations, and the demographic history of the species. I have shown that my estimator  allows one to infer accurate estimates of θc = 4Ncμ, which become insensitive to selection and demography when estimated at very low population frequencies. This is because deviations between the true SFS and its asymptotic form (3) vanish for small k. At higher population frequencies, such deviations become more and more profound. The particular shape of g(x) at larger x should in turn provide information on selection and demography. Various studies have used this approach to estimate the distribution of selection coefficients among new mutations, the demographic history of species, or both simultaneously by analyzing observed SFS from population genetic data sets (Williamson et al. 2005; Thornton and Andolfatto 2006; Eyre-Walker et al. 2006; Li and Stephan 2006; Keightley and Eyre-Walker 2007; Boyko et al. 2008; Gonzalez et al. 2009).
These approaches suffer from the general problem that selection and demography can never be unambiguously inferred from the shape of the SFS alone (Myers et al. 2008). There are always different distributions of selection coefficients, or different demographic scenarios, that give rise to the same SFS. Moreover, both selection and demography can lead to similar deviations, making it difficult to disentangle their individual contributions. In practice, inference of selection and demography from the SFS is therefore usually restricted to fitting simple parameterized models to the data in a ML framework.
Such ML inference of demography or selection is straightforward to incorporate into my method if one can parameterize the expected SFS g in terms of the variables of the particular model to be estimated. For example, when assuming constant population size but a particular distribution ω of selection coefficients among new mutations that one wants to infer, then g can be calculated by  , using the gγ defined in Equation 1. The SFS can thus be expressed as a function of ω. From g the expected number of segregating sites,
  , and the normalized distribution ρ = g/m can be calculated. Analogously to Equation 12, where g was parameterized by μ and a likelihood function for μ was obtained, the likelihood of a particular distribution ω is
 |
(30) |
For cases where one wants to infer the parameters of a particular demographic model and can assume that mutations are selectively neutral, g can be expressed as a function of the variables of the demographic model either analytically according to Equation 26 or numerically by simulations. Simulations will clearly be the approach of choice for analyses where neither constant population size nor neutral mutations can be assumed.
The crucial advantage of my approach is again the capability to calculate likelihoods for different frequency classes separately. This can provide substantial improvements to previous approaches, as it allows one to focus on the particularly informative low-frequency part of the SFS. Consider, for example, the two different scenarios B and C for the demographic history of the European D. melanogaster subpopulation shown in Figure 5. Both scenarios cause similar reduction in overall heterozygosity in the European population compared to the African population because their bottleneck strengths tb/Nb are comparable. Yet the two models can be clearly distinguished by the large differences of  at small k between them (see Figure 5D).
Focusing on low-frequency SNPs might also be particularly helpful for disentangling demography and selection. This problem has often been approached by dividing SNPs into two classes, the first comprising presumably neutrally evolving SNPs, and the second comprising SNPs of which the distribution of selection coefficients is to be estimated. The rationale is that demography can be inferred from the SFS of the neutral class, which is then used as a proxy when fitting distributions of selection coefficients to the SFS of the latter class (Williamson et al. 2005; Eyre-Walker and Keightley 2007; Boyko et al. 2008). The approach hinges of course on the availability of a set of reliably neutral SNPs. Often synonymous SNPs are used for this purpose. But it is presently not clear to what degree synonymous mutations are indeed selectively neutral (Hershberg and Petrov 2008). At higher frequencies, also small selection coefficients can substantially affect the SFS, potentially causing misleading demographic estimates.
In my analysis this problem can be addressed by simply investigating the functional dependence of the estimator  on k for the different classes of SNPs to check the robustness of assumptions for each class. This is illustrated in Figure 6, where theoretically expected curves
  are shown for three classes of sites. The three classes could depict, for instance, nonsynonymous (Figure 6, squares), synonymous (Figure 6, triangles), and noncoding SNPs (Figure 6, circles).
Figure 6.—

Example of  estimated for three different classes of sites. All classes have θ = 1, but selection coefficients differ between classes. For simplicity, all mutations within a class are modeled to have the same selection coefficient.
  was then calculated by
 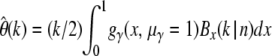 . The sample size was n = 1000.
From the observed curves we would conclude that assumptions of neutrality and constant population size are robust for noncoding and synonymous mutations at the investigated frequencies, as indicated by the fact that  does not change substantially as a function of k for both classes (note that the systematic biases resulting from the slightly deleterious selection coefficients for noncoding and synonymous SNPs are very weak). This observation implies in particular that demography is unlikely to be a major issue for SNPs at these low population frequencies. And SNPs in all classes should have been subject to the same demographic history of the species. In fact, nonneutral SNPs, irrespective of whether they are deleterious or beneficial, should be affected by even fewer demographic events than neutral SNPs because they are on average younger (Maruyama and Kimura 1974).
For nonsynonymous SNPs, on the other hand, we see a systematic decline of  with increasing k, indicating that they are under selective constraint. One can then simply fit Equation 25 to the observed
  to infer the best-fitting distribution of selection coefficients among nonsynonymous mutations for the data.
Spatial resolution:
The practical applicability of the estimator  relies on sufficiently large counts Gk to reduce finite-sample inaccuracies. We can estimate the expectation value
  for a given genomic region according to Equation 15. The mutation rate μ is thereby specified as the rate for the entire investigated region. The requirement of a large-enough Gk consequently poses a limit on the minimum length of the investigated sequence region. Next I calculate roughly the expected spatial resolution of my method for the 1000 genomes project.
A common estimate for the per site mutation rate in humans is 2.5 × 10⁻⁸ per generation (Nachman and Crowell 2000). Obtaining an accurate estimate of the effective population size is more intricate. Widely used values Ne ∼ 104—∼105 times smaller than the actual size of the human population at present—presumably reflect the effects of strong population bottlenecks in ancient history. These small estimates might be valid when averaging over SNPs in all frequency classes, but they will underestimate the effective population size associated with low-frequency SNPs, unless a bottleneck occurred so recently that low-frequency SNPs have still been affected by it. According to Equation 29 the average age of a derived allele at population frequency x = 0.5% is on the order of 0.1 × Ne. This corresponds to only 103 generations for the above estimate of Ne = 104. It is unlikely that humans have experienced a severe enough bottleneck within the last 103 generations that would justify the small estimate of Ne = 104 during this interval. Let us therefore assume that Ne for SNPs at population frequency x = 0.5% is at least on the order of 105.
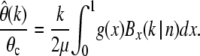
With the above estimates one obtains  , where L is the length of the investigated sequence region. As was already argued earlier, a threshold k = 5 should suffice to eliminate severe biases due to sequencing errors from my analysis. For a 100-kbp-long genomic region we would expect to observe
  ∼ 200 SNPs to be present in 5 of the genotyped sequences and still
  ∼ 20 SNPs to be present in 50 sequences. This should clearly allow for an accurate estimation of θ and its robustness for windows of the given size. One would even expect to yield good estimates of θ for windows of size 10 kbp from data of the 1000 genomes project, but then the robustness estimation in terms of measuring
  for larger k will become less accurate. Note also that species with larger effective population size, for instance Drosophila, will generally permit even higher spatial resolution.
Application in an evolutionary context:
The availability of regionally resolved rates of spontaneous mutation would make a multitude of important problems in contemporary evolutionary genomics accessible for quantitative investigation (Baer et al. 2007; Duret 2009). For example, it is not clear at present whether the observed regional variations in substitution rates along genomes mainly reflect regional variations in mutation rates or differing degrees of selection, BGC, and other forces that influence the probabilities of fixation of new alleles (Eyre-Walker and Hurst 2001; Duret and Arndt 2008).
Regional mutation rates could be compared with regional values of various other genomic quantities, e.g., recombination rate, GC content, nucleosome positioning, etc. In a partial-correlation analysis determinant factors for regional variations in mutation rate could possibly be elucidated.
The rates of spontaneous mutation are expected to depend on biochemical factors like accessibility of a genomic region to mutagenic influences, error proneness during DNA replication, and rate and accuracy of damage repair (Baer et al. 2007). As a result, the basic mutation process could in fact turn out to be rather universal and its local rate could be primarily determined by a few basic regional features. A low GC content, for example, may make the two DNA strands more prone to separate, which could increase the mutation rate in GC-poor regions (Frederico et al. 1993).
It is straightforward within my method to resolve mutation rates into the rates of all 12 possible transitions between nucleotides. A regional analysis between the individual mutation rates and the corresponding substitution rates should prove informative in many aspects, for instance to identify possible mutational biases, estimate the magnitude of BGC, or test hypotheses about selection for a particular GC content. My method can also be easily extended to mutational processes other than single-nucleotide mutations. Potential examples include DNA insertions and deletions, segmental duplications, and insertions of transposable elements.
A combined analysis of divergence and polymorphism at different population frequency classes should provide insight into the interplay between distinct evolutionary forces. Low-frequency polymorphism closely reflects the rates and patterns of spontaneous mutations, while polymorphism at intermediate population frequencies is shaped, in addition, by selective constraints. Substitutions finally comprise least constrained and also adaptive mutations. Knowing the relative proportions of deleterious, neutral, and adaptive mutations is fundamental for our understanding of the evolutionary process, yet still much is to be learned about the precise shape of the distribution of selection coefficients among new mutations (Eyre-Walker and Keightley 2007).
The ratio between neutral and adaptive mutations is often estimated by comparing levels of polymorphism and divergence in McDonald and Kreitman-type analysis (McDonald and Kreitman 1991). The underlying rationale of these tests is that polymorphism observed at intermediate population frequencies should mainly constitute neutral variation. Low-frequency SNPs are often intentionally discarded from such analyses to diminish possible biases due to deleterious mutations (Charlesworth and Eyre-Walker 2008).
My estimator  should perfectly complement McDonald and Kreitman tests by shedding light on the other side of the spectrum, the amount and characteristics of deleterious mutations. This class of mutations is naturally hidden from divergence-based estimates. So far, it has been accessible only in mutation-accumulation experiments, along with all the natural limitations of such analyses. Our present knowledge about deleterious mutations is hence rather limited. With assays of at least 1000 genotyped sequences, as anticipated for the upcoming large-scale polymorphism data sets, estimation of
  at k = 5 should clearly be within reach. I demonstrated that this will allow for a reasonably accurate estimation of θ that captures >90% of deleterious mutations with γ = −10 and still ∼60% of deleterious mutations with γ = −50. One can therefore expect to obtain, for the first time, estimates of θ from polymorphism data sets that also comprise a substantial fraction of strongly deleterious mutations.
Acknowledgments
This work was carried out in the Petrov lab at Stanford University. I thank Dmitri Petrov for helpful discussions throughout the project and carefully proofreading the manuscript. Two anonymous reviewers provided constructive comments. This work was supported by a long-term postdoctoral fellowship from the Human Frontier Science Program Organization. Computational resources were provided by the Stanford Bio-X2 compute cluster, supported by National Science Foundation award CNS-0619926.
References
- Akashi, H., and S. W. Schaeffer, 1997. Natural selection and the frequency distributions of “silent” DNA polymorphism in Drosophila. Genetics 146 295–307. [DOI] [PMC free article] [PubMed] [Google Scholar]
- Andolfatto, P., 2005. Adaptive evolution of non-coding DNA in Drosophila. Nature 437 1149–1152. [DOI] [PubMed] [Google Scholar]
- Baer, C. F., M. M. Miyamoto and D. R. Denver, 2007. Mutation rate variation in multicellular eukaryotes: causes and consequences. Nat. Rev. Genet. 8 619–631. [DOI] [PubMed] [Google Scholar]
- Begun, D. J., A. K. Holloway, K. Stevens, L. W. Hillier, Y. P. Poh et al., 2007. Population genomics: whole-genome analysis of polymorphism and divergence in Drosophila simulans. PLoS Biol. 5 e310. [DOI] [PMC free article] [PubMed] [Google Scholar]
- Boyko, A. R., S. H. Williamson, A. R. Indap, J. D. Degenhardt, R. D. Hernandez et al., 2008. Assessing the evolutionary impact of amino acid mutations in the human genome. PLoS Genet. 4 e1000083. [DOI] [PMC free article] [PubMed] [Google Scholar]
- Bustamante, C. D., A. Fledel-Alon, S. Williamson, R. Nielsen, M. T. Hubisz et al., 2005. Natural selection on protein-coding genes in the human genome. Nature 437 1153–1157. [DOI] [PubMed] [Google Scholar]
- Cai, J. J., J. M. Macpherson, G. Sella and D. A. Petrov, 2009. Pervasive hitchhiking at coding and regulatory sites in humans. PLoS Genet. 5 e1000336. [DOI] [PMC free article] [PubMed] [Google Scholar]
- Charlesworth, B., 2009. Fundamental concepts in genetics: effective population size and patterns of molecular evolution and variation. Nat. Rev. Genet. 10 195–205. [DOI] [PubMed] [Google Scholar]
- Charlesworth, B., M. T. Morgan and D. Charlesworth, 1993. The effect of deleterious mutations on neutral molecular variation. Genetics 134 1289–1303. [DOI] [PMC free article] [PubMed] [Google Scholar]
- Charlesworth, J., and A. Eyre-Walker, 2008. The McDonald-Kreitman test and slightly deleterious mutations. Mol. Biol. Evol. 25 1007–1015. [DOI] [PubMed] [Google Scholar]
- Crow, J. F., and M. Kimura, 1970. An Introduction to Population Genetics Theory. Harper & Row, New York.
- Denver, D. R., K. Morris, M. Lynch and W. K. Thomas, 2004. High mutation rate and predominance of insertions in the Caenorhabditis elegans nuclear genome. Nature 430 679–682. [DOI] [PubMed] [Google Scholar]
- Duret, L., 2009. Mutation patterns in the human genome: more variable than expected. PLoS Biol. 7 e28. [DOI] [PMC free article] [PubMed] [Google Scholar]
- Duret, L., and P. F. Arndt, 2008. The impact of recombination on nucleotide substitutions in the human genome. PLoS Genet. 4 e1000071. [DOI] [PMC free article] [PubMed] [Google Scholar]
- Ellegren, H., N. G. Smith and M. T. Webster, 2003. Mutation rate variation in the mammalian genome. Curr. Opin. Genet. Dev. 13 562–568. [DOI] [PubMed] [Google Scholar]
- Ewens, W. J., 2004. Mathematical Population Genetics, Ed. 2. Springer, New York.
- Eyre-Walker, A., 2006. The genomic rate of adaptive evolution. Trends Ecol. Evol. 21 569–575. [DOI] [PubMed] [Google Scholar]
- Eyre-Walker, A., and L. D. Hurst, 2001. The evolution of isochores. Nat. Rev. Genet. 2 549–555. [DOI] [PubMed] [Google Scholar]
- Eyre-Walker, A., and P. D. Keightley, 2007. The distribution of fitness effects of new mutations. Nat. Rev. Genet. 8 610–618. [DOI] [PubMed] [Google Scholar]
- Eyre-Walker, A., M. Woolfit and T. Phelps, 2006. The distribution of fitness effects of new deleterious amino acid mutations in humans. Genetics 173 891–900. [DOI] [PMC free article] [PubMed] [Google Scholar]
- Fay, J. C., G. J. Wyckoff and C. I. Wu, 2001. Positive and negative selection on the human genome. Genetics 158 1227–1234. [DOI] [PMC free article] [PubMed] [Google Scholar]
- Fay, J. C., G. J. Wyckoff and C. I. Wu, 2002. Testing the neutral theory of molecular evolution with genomic data from Drosophila. Nature 415 1024–1026. [DOI] [PubMed] [Google Scholar]
- Frankham, R., 2007. Effective population size/adult population size ratios in wildlife: a review. Genet. Res. 89 491–503. [DOI] [PubMed] [Google Scholar]
- Frederico, L. A., T. A. Kunkel and B. R. Shaw, 1993. Cytosine deamination in mismatched base pairs. Biochemistry 32 6523–6530. [DOI] [PubMed] [Google Scholar]
- Galtier, N., and L. Duret, 2007. Adaptation or biased gene conversion? Extending the null hypothesis of molecular evolution. Trends Genet. 23 273–277. [DOI] [PubMed] [Google Scholar]
- Gonzalez, J., J. M. Macpherson, P. W. Messer and D. A. Petrov, 2009. Inferring the strength of selection in Drosophila under complex demographic models. Mol. Biol. Evol. 26 513–526. [DOI] [PMC free article] [PubMed] [Google Scholar]
- Haag-Liautard, C., N. Coffey, D. Houle, M. Lynch, B. Charlesworth et al., 2008. Direct estimation of the mitochondrial DNA mutation rate in Drosophila melanogaster. PLoS Biol. 6 e204. [DOI] [PMC free article] [PubMed] [Google Scholar]
- Harpending, H. C., M. A. Batzer, M. Gurven, L. B. Jorde, A. R. Rogers et al., 1998. Genetic traces of ancient demography. Proc. Natl. Acad. Sci. USA 95 1961–1967. [DOI] [PMC free article] [PubMed] [Google Scholar]
- Hellmann, I., Y. Mang, Z. Gu, P. Li, F. M. de la Vega et al., 2008. Population genetic analysis of shotgun assemblies of genomic sequences from multiple individuals. Genome Res. 18 1020–1029. [DOI] [PMC free article] [PubMed] [Google Scholar]
- Hershberg, R., and D. A. Petrov, 2008. Selection on codon bias. Annu. Rev. Genet. 42 287–299. [DOI] [PubMed] [Google Scholar]
- Kaiser, J., 2008. DNA sequencing. A plan to capture human diversity in 1000 genomes. Science 319 395. [DOI] [PubMed] [Google Scholar]
- Kaplan, N. L., R. R. Hudson and C. H. Langley, 1989. The “hitchhiking effect” revisited. Genetics 123 887–899. [DOI] [PMC free article] [PubMed] [Google Scholar]
- Keightley, P. D., 1994. The distribution of mutation effects on viability in Drosophila melanogaster. Genetics 138 1315–1322. [DOI] [PMC free article] [PubMed] [Google Scholar]
- Keightley, P. D., and A. Eyre-Walker, 2007. Joint inference of the distribution of fitness effects of deleterious mutations and population demography based on nucleotide polymorphism frequencies. Genetics 177 2251–2261. [DOI] [PMC free article] [PubMed] [Google Scholar]
- Kimura, M., 1964. Diffusion models in population genetics. J. Appl. Probab. 1 177–232. [Google Scholar]
- Kimura, M., 1968. Evolutionary rate at the molecular level. Nature 217 624–626. [DOI] [PubMed] [Google Scholar]
- Kimura, M., and T. Ohta, 1973. The age of a neutral mutant persisting in a finite population. Genetics 75 199–212. [DOI] [PMC free article] [PubMed] [Google Scholar]
- Kumar, S., and S. Subramanian, 2002. Mutation rates in mammalian genomes. Proc. Natl. Acad. Sci. USA 99 803–808. [DOI] [PMC free article] [PubMed] [Google Scholar]
- Li, H., and W. Stephan, 2006. Inferring the demographic history and rate of adaptive substitution in Drosophila. PLoS Genet. 2 e166. [DOI] [PMC free article] [PubMed] [Google Scholar]
- Liu, X., T. J. Maxwell, E. Boerwinkle and Y. X. Fu, 2009. Inferring population mutation rate and sequencing error rate using the SNP frequency spectrum in a sample of DNA sequences. Mol. Biol. Evol. 26 1479–1490. [DOI] [PMC free article] [PubMed]
- Luria, S. E., and M. Delbruck, 1943. Mutations of bacteria from virus sensitivity to virus resistance. Genetics 28 491–511. [DOI] [PMC free article] [PubMed] [Google Scholar]
- Lynch, M., 2008. Estimation of nucleotide diversity, disequilibrium coefficients, and mutation rates from high-coverage genome-sequencing projects. Mol. Biol. Evol. 25 2409–2419. [DOI] [PMC free article] [PubMed] [Google Scholar]
- Lynch, M., W. Sung, K. Morris, N. Coffey, C. R. Landry et al., 2008. A genome-wide view of the spectrum of spontaneous mutations in yeast. Proc. Natl. Acad. Sci. USA 105 9272–9277. [DOI] [PMC free article] [PubMed] [Google Scholar]
- Macpherson, J. M., G. Sella, J. C. Davis and D. A. Petrov, 2007. Genomewide spatial correspondence between nonsynonymous divergence and neutral polymorphism reveals extensive adaptation in Drosophila. Genetics 177 2083–2099. [DOI] [PMC free article] [PubMed] [Google Scholar]
- Maruyama, T., and M. Kimura, 1974. A note on the speed of gene frequency changes in reverse directions in a finite population. Evolution 28 161–163. [DOI] [PubMed] [Google Scholar]
- McDonald, J. H., and M. Kreitman, 1991. Adaptive protein evolution at the Adh locus in Drosophila. Nature 351 652–654. [DOI] [PubMed] [Google Scholar]
- Myers, S., C. Fefferman and N. Patterson, 2008. Can one learn history from the allelic spectrum? Theor. Popul. Biol. 73 342–348. [DOI] [PubMed] [Google Scholar]
- Nachman, M. W., and S. L. Crowell, 2000. Estimate of the mutation rate per nucleotide in humans. Genetics 156 297–304. [DOI] [PMC free article] [PubMed] [Google Scholar]
- Nagylaki, T., 1983. Evolution of a finite population under gene conversion. Proc. Natl. Acad. Sci. USA 80 6278–6281. [DOI] [PMC free article] [PubMed] [Google Scholar]
- Nielsen, R., and Z. Yang, 2003. Estimating the distribution of selection coefficients from phylogenetic data with applications to mitochondrial and viral DNA. Mol. Biol. Evol. 20 1231–1239. [DOI] [PubMed] [Google Scholar]
- Nielsen, R., I. Hellmann, M. Hubisz, C. Bustamante and A. G. Clark, 2007. Recent and ongoing selection in the human genome. Nat. Rev. Genet. 8 857–868. [DOI] [PMC free article] [PubMed] [Google Scholar]
- Piganeau, G., and A. Eyre-Walker, 2003. Estimating the distribution of fitness effects from DNA sequence data: implications for the molecular clock. Proc. Natl. Acad. Sci. USA 100 10335–10340. [DOI] [PMC free article] [PubMed] [Google Scholar]
- Sawyer, S. A., and D. L. Hartl, 1992. Population genetics of polymorphism and divergence. Genetics 132 1161–1176. [DOI] [PMC free article] [PubMed] [Google Scholar]
- Slatkin, M., and R. R. Hudson, 1991. Pairwise comparisons of mitochondrial DNA sequences in stable and exponentially growing populations. Genetics 129 555–562. [DOI] [PMC free article] [PubMed] [Google Scholar]
- Tajima, F., 1989. a Statistical method for testing the neutral mutation hypothesis by DNA polymorphism. Genetics 123 585–595. [DOI] [PMC free article] [PubMed] [Google Scholar]
- Tajima, F., 1989. b The effect of change in population size on DNA polymorphism. Genetics 123 597–601. [DOI] [PMC free article] [PubMed] [Google Scholar]
- Thornton, K., and P. Andolfatto, 2006. Approximate Bayesian inference reveals evidence for a recent, severe bottleneck in a Netherlands population of Drosophila melanogaster. Genetics 172 1607–1619. [DOI] [PMC free article] [PubMed] [Google Scholar]
- Watterson, G. A., 1975. On the number of segregating sites in genetical models without recombination. Theor. Popul. Biol. 7 256–276. [DOI] [PubMed] [Google Scholar]
- Williamson, S. H., R. Hernandez, A. Fledel-Alon, L. Zhu, R. Nielsen et al., 2005. Simultaneous inference of selection and population growth from patterns of variation in the human genome. Proc. Natl. Acad. Sci. USA 102 7882–7887. [DOI] [PMC free article] [PubMed] [Google Scholar]
- Wright, S., 1938. The distribution of gene frequencies under irreversible mutation. Proc. Natl. Acad. Sci. USA 24 253–259. [DOI] [PMC free article] [PubMed] [Google Scholar]
- Yampolsky, L. Y., F. A. Kondrashov and A. S. Kondrashov, 2005. Distribution of the strength of selection against amino acid replacements in human proteins. Hum. Mol. Genet. 14 3191–3201. [DOI] [PubMed] [Google Scholar]