Abstract
Binding-induced biomolecular switches are used throughout nature and, increasingly, throughout biotechnology for the detection of chemical moieties and the subsequent transduction of this detection into useful outputs. Here we show that the thermodynamics of these switches are quantitatively described by a simple 3-state population-shift model, in which the equilibrium between a nonbinding, nonsignaling state and the binding-competent, signaling state is shifted toward the latter upon target binding. Because of this, their performance is determined by the tradeoff inherent to their switching thermodynamics; while a switching equilibrium constant favoring the nonbinding, nonsignaling, conformation ensures a larger signal change (more molecules are poised to respond), it also reduces affinity (binding must overcome a more unfavorable conformational free energy). We then derive and employ the relationship between switching thermodynamics and switch signaling to rationally tune the dynamic range and detection limit of a representative structure-switching biosensor, a molecular beacon, over 4 orders of magnitude. These findings demonstrate that the performance of biomolecular switches can be rationally tuned via mutations that alter their switching thermodynamics and suggest a mechanism by which the performance of naturally occurring switches may have evolved.
Keywords: allostery; ligand-induced conformational change; pre-existing equilibrium; rational design, sensitivity; riboswitches
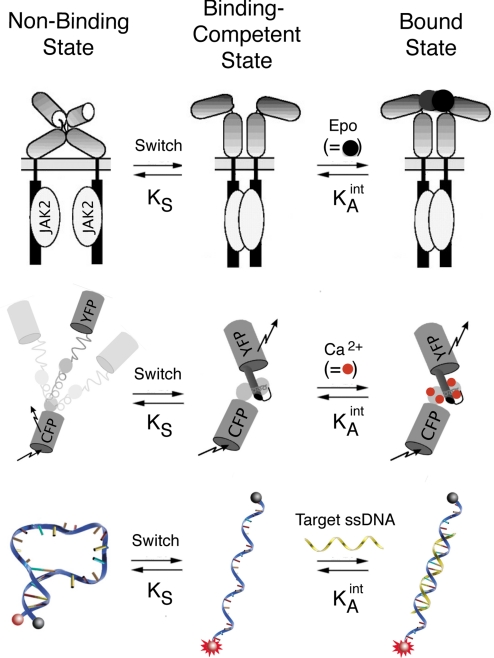
Binding-induced conformational changes are used in nature and, increasingly, in biotechnology for the detection of chemical moieties and the subsequent transduction of that recognition into useful outputs. Among the many examples offered by nature (1, 2) are the calmodulin proteins, which regulate cellular processes via a calcium-triggered conformational change (3, 4), and the cytokine receptors, which signal through the cell membrane via a hormone-induced conformational change (5, 6) (Fig. 1, Top). Other examples include intrinsically disordered proteins, which regulate multiple cellular processes when they fold upon binding to their target ligands (7–9), and riboswitches, which regulate translation via a metabolite-induced conformational change in the mRNA leader sequence (10). Similar structure-switching biomolecules, either naturally occurring (11–14), artificially selected (15–21), or rationally designed examples (21–30), have been used for diagnostic applications (31) in synthetic biology (32, 33) and in situ real time imaging (34). Examples of these include synthetic riboswitches for the control of gene expression (26) and metabolic pathways (33), fluorescent sensors for the detection of intracellular calcium (11) (Fig. 1, Middle), and molecular beacons for the detection of specific oligonucleotide sequences (22) (Fig. 1, Bottom).
Fig. 1.
The thermodynamics of binding-induced biomolecular switches can be described via a 3-state population-shift model, in which target binding shifts a preexisting equilibrium between the binding-competent and nonbinding states. As such, the signaling properties of these switches embody a tradeoff: While a switch equilibrium favoring the nonbinding state increases the potential signal change (more molecules are poised to respond), it also reduces the observed affinity (binding must overcome a more unfavorable conformational free energy). Shown here are 3 examples. (Top) The binding of erythropoietin (Epo) to its membrane receptor (a dimeric protein) activates the autophosphorylation of the intracellular JAK kinases by shifting the population of receptors to a conformation in which the kinases are in proximity (5). (Middle) Calmodulin, a naturally occurring calcium responsive switch, has been converted by Tsien and coworkers into a fluorescent calcium sensor (11). (Bottom) DNA molecular beacon in which the equilibrium between a nonfluorescent, nonbinding “stem-loop” conformation and an extended, binding-competent conformation is perturbed when a target sequence hybridizes with the latter, leading to a large increase in fluorescence emission (22).
Ligand-induced biomolecular switches are generally thought to function via a 3-state population-shift mechanism (Fig. 1) in which the naturally occurring equilibrium between a nonbinding, nonsignaling state, and the binding-competent signaling state, is shifted toward the latter upon target binding (35–41) [n.b., their kinetics may be equally simple (14) or significantly more complex (42, 43)]. Because of this, the function of binding-induced switches embodies a tradeoff: While a switching equilibrium constant shifted toward the nonbinding conformation ensures a larger signal change (more molecules are poised to respond), it also reduces affinity (binding must overcome a more unfavorable conformational free energy). This, in turn, implies that, as previously noted, the thermodynamics of switching will affect the switch's dynamic range (28, 37, 44) and detection limit (28, 45). Starting from these qualitative arguments, we derive here a quantitative population-shift model and employ it to: (i) Describe and test the relationship between switch signaling and switching thermodynamics and (ii) rationally optimize the performance of a representative switch. The implications of these findings for the evolution of natural biomolecular switches are also discussed.
Results
To elucidate the relationship between switching thermodynamics and signaling, we have studied molecular beacons (Fig. 1, Bottom), synthetic biomolecular switches developed by Kramer and coworkers (22), and widely used in the diagnosis of genetic and infectious diseases (31, 46, 47). Consisting of a stem-loop DNA modified with a fluorophore/quencher pair, molecular beacons provide an ideal test bed for our studies; their simple, stem-loop structure separates the determinants that define affinity (the loop) from those that define the switching equilibrium (the stem). From the perspective of the population-shift model, the mechanism of molecular beacons relies on the equilibrium between the non-emissive stem-loop conformation (the nonbinding state) and the emissive extended conformation (the binding-competent state) that is shifted to the latter upon hybridization with a complementary oligonucleotide (Fig. 1, Bottom).
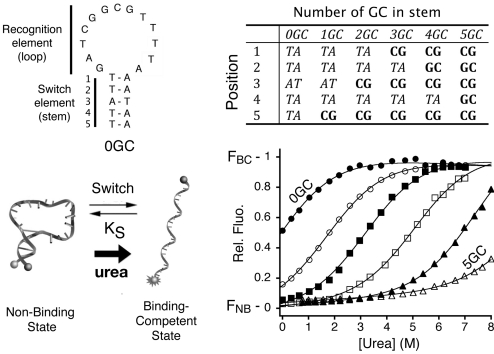
We have constructed a set of 6 molecular beacons that retain a common loop sequence (and thus maintain a constant intrinsic affinity, KDint, for their target) but differ in their stem sequences (thus modulating the switching equilibrium constant, KS). To determine the switching equilibrium constant of each variant, we used urea denaturation (Fig. 2), a method that has seen widespread use in the determination of folding free energies (48, 49). The unfolding curves of all 6 of our molecular beacons are well-fitted as 2-state unfolding transitions with switching equilibrium constants ranging from 1.1 (±0.2) (stem 0GC) to 5.5 (±0.7) × 10−5 (stem 5GC).
Fig. 2.
To explore the relationship between switching thermodynamics and switch performance, we have fabricated a set of molecular beacons differing only in the stability of their nonbinding, stem-loop conformation. We did so by varying the GC content of their stems while retaining a constant recognition loop sequence. We determined the switching equilibrium constant (KS) of each sensor using urea melting (48) (except for molecular beacon 5GC; see Fig. S1) and found that they span the range from 1.1 (0.2) (0GC) to 5.5 (0.7) × 10−5 (5GC) (corresponding to free energies of 0.2 (0.5) to −26.0 (1.0) kJ mol−1, respectively).
The Relationship Between the Switching Equilibrium Constant and Switch Dynamic Range.
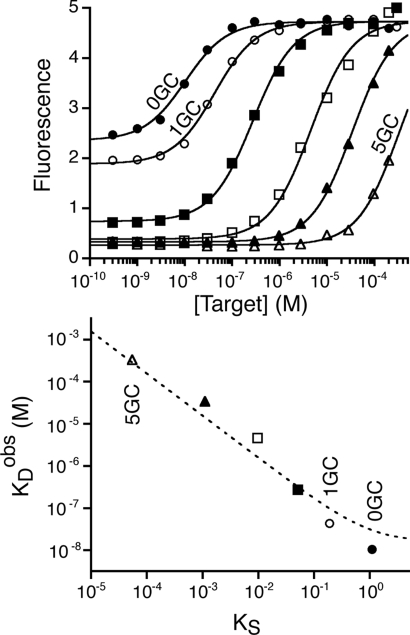
Because target binding to the loop must compete with the unfavorable cost of breaking the stem, the observed binding affinities (KDobs) of our switches differ from the intrinsic affinity (KDint) of the 13-base loop that serves as our recognition element (Fig. 3, Top). Specifically, the observed affinities of our molecular beacons range from 10.4 (±1.4) nM to 330 (±74) μM, as the switching equilibrium, KS, varies from 1.1 to 5.5 × 10⁻⁵. Of note, while all 6 molecular beacons are similarly fluorescent in their bound state, the less stable molecular beacons (those containing 0 or 1 GC base pair in their stems) fluoresce significantly even in the absence of target (Fig. 3, Top). This occurs because their switching equilibria are relatively large (KS > 0.05), and thus a significant fraction of these molecules are in the extended (and thus emissive), binding-competent state even in the absence of target.
Fig. 3.
The dynamic range (and observed affinity) of a binding-induced biomolecular switch is directly coupled to its switching equilibrium constant, KS. (Top) Molecular beacon 0GC, for example, which exhibits the highest switching equilibrium constant (i.e., has the least stable stem), exhibits the greatest apparent affinity for the target DNA sequence (KDobs = 10.4 ± 1.4 nM). As the equilibrium constant is reduced (i.e., as the nonbinding stem-loop conformation is stabilized), the dynamic range of the switch shifts to higher target concentrations. Switching equilibrium constants higher than 0.05 (molecular beacons 0GC and 1GC) however, lead to reduced fluorescence changes since the population of the binding-competent signaling conformation observed in the absence of target increases. (Bottom) The relationship between the switching equilibrium constant and the affinity, KDobs, is well-described (dotted line; R2 = 0.95) by the 3-state “population-shift” model with KDint=15 ± 6 nM (Eq. 1).
The 3-state population-shift model (Fig. 1) predicts a specific relationship between switching thermodynamics and observed affinities, KDobs (50). In this model, KDobs is given by:
where KDint is the intrinsic affinity of the binding-competent state. Consistent with this prediction, we find that the switching equilibrium constants (Fig. 2) and observed affinities (Fig. 3, Top) of our 6 molecular beacons are well-fitted by this equation (Fig. 3, Bottom). That is, if the switching equilibrium constant shifts toward the nonbinding state by 1 order of magnitude (approximately equivalent to one AT to GC base pair substitution), the observed affinity of the switch, and therefore its dynamic range, shifts by the same factor toward higher target concentrations. This relationship thus quantitatively describes how the dynamic range of a biomolecular switch may be tuned to respond to different target concentrations by simply changing its switching equilibrium constant (44). Moreover, because changes to the switching equilibrium constant do not alter the binding motif itself, they provide a means of shifting the observed affinity without affecting the specific interactions that the recognition site makes with its target (44).
Optimizing Switching Thermodynamics.
The range of concentrations over which a switch robustly responds to its target can be pushed arbitrarily high by shifting the switching equilibrium constant arbitrarily low. The converse, however, is not true: As KS increases, the population of molecules that are in the nonbinding, nonsignaling, state in the absence of target also decreases, ultimately leading to not enough switches left to generate sufficient population shift upon target binding. Because of this, the lowest concentrations over which a switch will respond robustly (i.e., the lowest detection limits for structure-switching sensors) are achieved at intermediate values of KS. To determine the optimal value, we have derived the equation describing the readout of a binding-induced switch, F(T), as a function of the switching equilibrium constant, KS, the target concentration, [T], the intrinsic association constant KAint (equivalent to 1/KDint), and the signals of the nonbinding, binding-competent, and bound states (FNB, FBC, and FB). (Note that although the signals of the binding-competent and bound states should be, in principle, identical, our experience with structure-switching biosensors indicates that target binding often affects the signaling of the binding-competent state, and thus we have generalized our model to cases in which FBC ≠ FB). For the molecular beacons used here, the bound state is ≈10% more fluorescent than the binding-competent state (22) (see Fig. 4). Using the 3-state population-shift model (Fig. 1), the fluorescence as a function of target concentration is given by:
where XNB([T]), XBC([T]), and XB([T]) represent the fraction of molecules in each of the 3 states at target concentration [T]. Using the relationships:
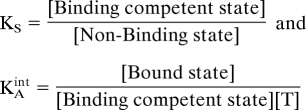 |
we then obtain:
 |
where ΔFBC-NB reflects the difference in the fluorescence of the binding-competent and nonbinding states (FBC-FNB), ΔFB-NB the difference in the fluorescence of the bound and nonbinding states (FB-FNB), and FBG the background fluorescence of the sample and fluorimeter. The signal change obtained upon addition of target, ΔF = F(T)-F (0), is then given by:
 |
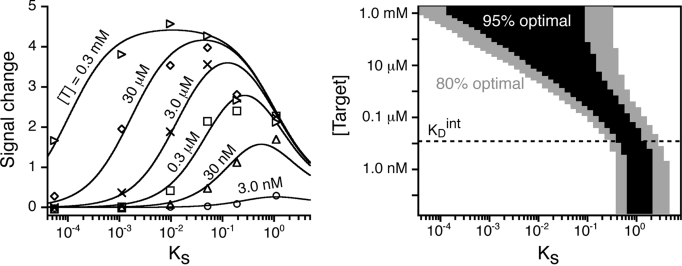
Consistent with the 3-state population shift model, the signal changes produced by our 6 molecular beacon switches are accurately fitted by Eq. 3 (Fig. 4, Left), with a bell-shaped relationship between signaling intensity and switching equilibrium constant that reflects the compromise required to obtain the optimal signaling. At relatively high target concentrations, we note that the observed signal change remains within 95% of its optimal value over a fairly broad range of KS (at 10 μM target, for example, which is 1,000 times KDint, signaling remains near optimal as KS varies from 0.004 to 0.15; Fig. 4, Right). At lower target concentrations, however, the optimal range of KS is narrower and is shifted to higher values (e.g., for 1 nM target, which is 1/10 KDint, KS between 0.7 and 2 are all near optimal). And while nontrivial affinity between the fluorophore and quencher (51) prevents us from exploring values of KS > 1 experimentally (Fig. S1), simulations indicate that, as anticipated, the signal change diminishes at higher-than-optimal values of KS (Fig. 4, Right).
Fig. 4.
Optimal signal change is achieved at intermediate values of the switching equilibrium constant, KS. (Left) This is readily seen in the change in fluorescence observed when molecular beacons differing in KS are challenged at given target concentrations. The fitted curves represent the relationship predicted by the population-shift model (Eq. 3). (Right) An alternative representation of the same curves using a simulation of the molecular beacon signaling indicates that signaling is a stronger function of KS at lower target concentrations. Shown is the range of switching equilibrium constants over which near-optimal signaling is obtained (gray, >80%; black, >95% of the maximum signal change) as a function of target concentration. The fits were performed by fixing ΔFB-NB (4.5; Fig. 3, Top), and KAint (6.7 × 10⁷ M−1; derived from Fig. 3, Bottom). The best simultaneous fit gave ΔFBC-NB = 4.05 [or FBC = 0.9FB, i.e., the molecular beacon bound state is significantly more fluorescent than its unfolded state (22)] and estimated the different target concentrations used (different symbols) within 3-fold of the experimental values.
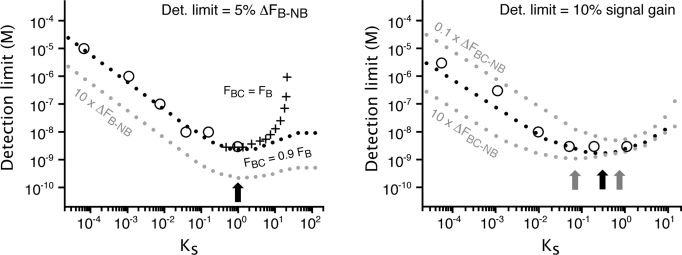
Detection limits are often expressed in different forms and depend on many parameters, including, for example, the background arising from the instrumentation. Nevertheless, we can explore the relationship between KS and detection limit under our own specific experimental conditions. If, for example, we define the detection limit as the minimum target concentration that produces a given change in absolute fluorescence, ΔF, then Eq. 3 indicates that optimal signaling will be reached at KS = 1, when 50% of the switches are in the nonbinding states, irrespective of the fluorescence change between the bound and nonbinding states, ΔFB-NB (Fig. 5, Left, black and gray dotted lines). Consistent with this, if we define the detection limit as the minimum concentration producing 5% of the maximum possible signal change (ΔF = 0.05ΔFB-NB), which is the smallest change that we can robustly measure using molecular beacons on our fluorimeter, we achieve a minimum detection limit of 3 nM using molecular beacon 0GC, for which KS ≈ 1 (Fig. 5, Left, black dotted line and large circles). In comparison, the detection limit of molecular beacon 5GC, for which KS = 5.5 × 10⁻⁵, is 4 orders of magnitude poorer (large circles).
Fig. 5.
Optimal detection limits are achieved at intermediate values of the switching equilibrium constant, KS. Shown are experimentally determined (open circles) or predicted (black dotted lines) detection limits for our molecular beacons as a function of their KS when using different detection limit definitions. (Left) When the detection limit is defined as the target concentration that produces an absolute signal, ΔF, that is 5% of the maximum possible signal change (ΔF = 0.05ΔFB-NB, which reflects a realistic detection limit for our fluorimeter), the optimal switching equilibrium constant is near unity (arrow). This optimal value is also independent of the relative fluorescence of the bound and nonbinding states (gray dotted line). At still higher values of KS, the detection limit becomes poorer, although the magnitude of this effect depends on the difference in the fluorescence of the bound and binding-competent states (compare crosses and dotted line). (Right) If, in contrast, the detection limit is defined as the target concentration that produces a 10% change in relative fluorescence (a realistic detection limit for our fluorimeter), the optimal switching equilibrium constant is near 0.3. Under this definition of detection limit, however, the optimal value of KS is obviously sensitive to ΔFBC-NB; the higher this latter value is, the lower the optimal KS will be to minimize the population of switches in the binding-competent state that signal in absence of target [i.e., minimize F (0); see Eq. 4]. All simulations were performed using FBG = 0.23 (background fluorescence), FNB = 0.04 (obtained using Fig. 3, Top), and KAint = 6.7 × 10⁷ M−1 (Fig. 3, Bottom). ΔFBC-NB was set to 0.9 ΔFB-NB for all simulations (unless specified), as it is observed experimentally for our molecular beacons (Fig. 4).
For some applications, it may be preferable to define the detection limit using relative signal gain, [F(T)-F (0)]/F(0), rather than, as discussed above, absolute signal change. For example, while a change from 10 to 11 units and a change from 100 to 101 units both represent a 1 unit absolute signal change, the relative gain in the former case is an order of magnitude larger (10% versus 1%, respectively) and thus, typically, much easier to measure. To quantify signal gain we apply Eq. 2 and find that:
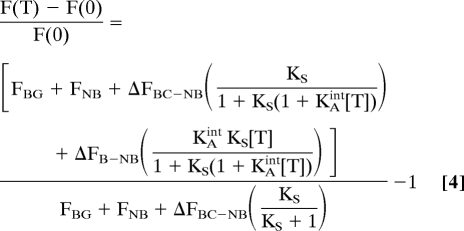 |
This definition of detection limit is therefore more dependent on F(0), the fluorescence in absence of target, and takes into account the background fluorescence, FBG, which depends on the fluorescence of any contaminants, the residual fluorescence of the nonbinding state, FNB, and is more sensitive to the fluorescence of any switch that is in the binding-competent state in the absence of target (see denominator in Eq. 4). Under these conditions, the optimal value of KS is no longer fixed at unity, as it was for the absolute signal gain, but will generally necessitate lower KS values as FBC increases relative to FNB (or as ΔFBC-NB increases) to minimize the background signal arising from molecules that are in the binding-competent state even in the absence of target. For example, within our experimental and instrumental setups, we can typically measure a signal gain of 10% which, given ΔFBC-NB, produces the optimal detection limit at KS = 0.3 (Fig. 5, Right, black dots and black arrow). If, however, ΔFBC-NB were larger, the optimal gain would be achieved at still lower values of KS, as this minimizes the signal observed in absence of target and thus reduces the denominator in Eq. 4 (Fig. 5, Right, gray dotted line).
Discussion
The population-shift model accurately describes the thermodynamics of molecular beacons and, presumably, other structure-switching biosensors and biomolecular switches. As predicted by the model, the dynamic range of a switch is changed by an order of magnitude toward higher target concentrations for each order of magnitude that the switching equilibrium shifts toward the nonbinding state (Fig. 3). Likewise, as predicted, the lowest detection limits of a switch are achieved at intermediate values of the switching equilibrium constant, which provide the optimal compromise between achieving a large population shift (low Ks) without overstabilizing the nonbinding state and thus reducing the switch affinity (high KS) (Figs. 4 and 5). Specifically, KS values near 1 are optimal if detection limits are defined in terms of absolute signal change (Figs. 4 and 5, Left), while lower KS values are optimal if detection limits are defined in terms of relative signal gain (Fig. 5, Right).
The findings described here provide a route to tuning the binding and signaling properties of binding-induced biomolecular switches and structure-switching biosensors without changing the specific complementarities of their binding interfaces [see also (44)]. This approach is likely quite general. For example, as illustrated here, the equilibrium constants of DNA or RNA switches can be rationally varied by altering the strength of their Watson-Crick base pairing. In support of this, nucleic acid folding and hybridization prediction programs, such as mfold, provide relatively accurate estimates of specific RNA or DNA conformations (52). Similar approaches can be, and indeed, have already been used to tune the switching thermodynamics of protein-based switches. And while the lack of a simple base-pairing code renders the rational optimization of their switching thermodynamics more complex, several approaches to tuning the switching equilibria of proteins have been reported (37). For example, Marvin and Hellinga identified a key residue that controls the switching thermodynamics of the bacterial perisplasmic binding protein superfamily simply by comparing the structures of their bound and unbound states (44). Abadou and Desjarlais have stabilized the nonbinding conformation of the N-terminal EF-hand domain of calmodulin—and thus reducing its calcium binding affinity—by replacing partially buried polar residues with hydrophobic residues (53). Springer, Mayo, and colleagues have used computational redesign of hydrophobic cores to specifically stabilize the open “binding-competent” or closed “nonbinding” states of the Mac1 integrin I (54). Lockless and Ranganathan have developed a technique termed statistical coupling analysis that employs evolutionary data to map residues that control conformational switching (55, 56). Finally, we have shown that binding-induced protein folding, which is perhaps a more generic protein-based switching mechanism (7–9, 57), is readily tuned via substitutions distant from the binding interface that stabilize or destabilize the native state (14).
In addition to providing a rational framework to guide the design of optimized structure-switching biosensors, the thermodynamic principles presented here may also improve our understanding of the mechanisms behind the evolution of naturally occurring biomolecular switches. An example of this is provided by the 2 homologous calcium binding EF-hand domains of calmodulin which, despite 75% sequence homology, differ significantly in their calcium affinity (58–60). The apo form of the lower affinity domain adopts a closed, nonbinding conformation that is stabilized by a well-buried phenylalanine (3, 60). In contrast, in the higher affinity domain, this residue is replaced by the more hydrophilic tyrosine, which is thought to promote a partially open, binding-competent state that, in turn, leads to improved calcium binding (3, 60). The distinct calcium affinities of the 2 domains, in turn, are thought to play an important role in the “wrap around” mechanism by which calmodulin binds many of its polypeptide targets by supporting the sequential attachment of the domains as the calcium concentration increases (4, 60). A second set of examples is provided by the intrinsically disordered proteins, proteins that only fold upon binding to their specific target (7–9). This binding-induced folding-switch mechanism, which has been used in several protein-based biosensors (14, 57), has been proposed as an efficient strategy by which nature reduces the affinity of biomolecules without simultaneously reducing their specificity (8, 61). As our knowledge of the thermodynamics of natural biomolecular switches progresses, it will be interesting to uncover how their switching thermodynamics have evolved to achieve optimal performance in vivo.
Materials and Methods
HPLC-purified molecular beacons modified with a 5′-FAM and a 3′-BHQ-1 and aliquots of the 13-nucleotide target were purchased from Sigma-Genosys (all constructs possess an additional Adenine nucleotide, after the FAM, and Guanine nucleotide, before the BHQ-1). Ultrapure urea was obtained from USB Corporation. All experiments were conducted at pH 7.0 in 50 mM sodium phosphate buffer, 150 mM NaCl, at 45 °C. All fluorescence measurements were obtained using a Cary Eclipse Fluorimeter (Varian) with excitation at 480 (± 5) nm and acquisition between 514 and 520 nm using either 5 nm (unfolding curves) or 20 nm (binding curves) bandwidths. Urea unfolding curves were obtained using 500 nM of molecular beacon by sequentially increasing (or decreasing for 4GC, 5GC) the urea concentration of a 0 M urea sample (8 M for 4GC, 5GC) with 8 M urea (0 M for 4GC, 5GC) containing the same concentration of molecular beacon. The fluorescence of the open state was set relative to 1. The switching equilibrium constants of all molecular beacons (stability of the nonbinding state) were obtained by global fitting the unfolding curves with a 2-state folding/unfolding model (48) using the same average m-value (2.4 kJ mol−1 M−1) and same values for the effect of the urea on the fluorescence of the folded (0.011 M−1) and unfolded-state (−0.0087 M−1) as obtained for the molecular beacons 5GC and 0GC, respectively. The 5GC molecular beacon is relatively stable to denaturation by 8 M urea (Fig. 2), and thus its free energy was estimated using the mfold prediction algorithm (51) (see Fig. S1). Binding curves were obtained using 3 nM molecular beacon by sequentially increasing the target concentration via the addition of small volumes of solutions with increasing concentration of target and the same molecular beacon concentration. All binding curves (Fig. 3, Top) were normalized by setting the bound state fluorescence to the FB obtained for 0GC (4.5), and the observed KD were obtained using:
Simulations (Figs. 4, Right, and 5) were generated using Eq. 3 (absolute signal change) or Eq. 4 (signal gain) by determining the signal change or signal gain produced by the addition of various concentrations of target for each molecular beacon.
Supplementary Material
Acknowledgments.
We thank Prof. Fred Kramer, Prof. Stephen Michnick, and members of our research group for helpful discussions and comments on the manuscript. This work was supported by the National Institutes of Health Grant R01EB007689. A.V.-B. is a Fonds Québécois de la Recherche sur la Nature et les Technologies Fellow.
Footnotes
The authors declare no conflict of interest.
This article is a PNAS Direct Submission.
This article contains supporting information online at www.pnas.org/cgi/content/full/0904005106/DCSupplemental.
References
- 1.Gerstein M, Krebs W. A database of macromolecular motions. Nucleic Acids Res. 1998;26:4280–4290. doi: 10.1093/nar/26.18.4280. [DOI] [PMC free article] [PubMed] [Google Scholar]
- 2.Goh CS, Milburn D, Gerstein M. Conformational changes associated with protein-protein interactions. Curr Opin Struct Biol. 2004;14:104–109. doi: 10.1016/j.sbi.2004.01.005. [DOI] [PubMed] [Google Scholar]
- 3.Swindells MB, Ikura M. Pre-formation of the semi-open conformation by the apo-calmodulin C-terminal domain and implications binding IQ-motifs. Nat Struct Biol. 1996;3:501–504. doi: 10.1038/nsb0696-501. [DOI] [PubMed] [Google Scholar]
- 4.Chin D, Means AR. Calmodulin: A prototypical calcium sensor. Trends Cell Biol. 2000;10:322–328. doi: 10.1016/s0962-8924(00)01800-6. [DOI] [PubMed] [Google Scholar]
- 5.Remy I, Wilson IA, Michnick SW. Erythropoietin receptor activation by a ligand-induced conformation change. Science. 1999;283:990–993. doi: 10.1126/science.283.5404.990. [DOI] [PubMed] [Google Scholar]
- 6.Stroud RM, Wells JA. Mechanistic diversity of cytokine receptor signaling across cell membranes. Sci STKE. 2004;2004:re7. doi: 10.1126/stke.2312004re7. [DOI] [PubMed] [Google Scholar]
- 7.Wright PE, Dyson HJ. Intrinsically unstructured proteins: Re-assessing the protein structure-function paradigm. J Mol Biol. 1999;293:321–331. doi: 10.1006/jmbi.1999.3110. [DOI] [PubMed] [Google Scholar]
- 8.Dunker AK, et al. Intrinsically disordered protein. J Mol Graphics Model. 2001;19:26–59. doi: 10.1016/s1093-3263(00)00138-8. [DOI] [PubMed] [Google Scholar]
- 9.Dunker AK, Silman I, Uversky VN, Sussman JL. Function and structure of inherently disordered proteins. Curr Opin Struct Biol. 2008;18:756–764. doi: 10.1016/j.sbi.2008.10.002. [DOI] [PubMed] [Google Scholar]
- 10.Roth A, Breaker RR. The structural and functional diversity of metabolite-binding riboswitches. Annu Rev Biochem. 2009;78:305–334. doi: 10.1146/annurev.biochem.78.070507.135656. [DOI] [PMC free article] [PubMed] [Google Scholar]
- 11.Miyawaki A, et al. Fluorescent indicators for Ca2+ based on green fluorescent proteins and calmodulin. Nature. 1997;388:882–887. doi: 10.1038/42264. [DOI] [PubMed] [Google Scholar]
- 12.Marvin JS, et al. The rational design of allosteric interactions in a monomeric protein and its applications to the construction of biosensors. Proc Natl Acad Sci USA. 1997;94:4366–4371. doi: 10.1073/pnas.94.9.4366. [DOI] [PMC free article] [PubMed] [Google Scholar]
- 13.Benson DE, Conrad DW, de Lorimier RM, Trammell SA, Hellinga HW. Design of bioelectronic interfaces by exploiting hinge-bending motions in proteins. Science. 2001;293:1641–1644. doi: 10.1126/science.1062461. [DOI] [PubMed] [Google Scholar]
- 14.Kohn JE, Plaxco KW. Engineering a signal transduction mechanism for protein-based biosensors. Proc Natl Acad Sci USA. 2005;102:10841–10845. doi: 10.1073/pnas.0503055102. [DOI] [PMC free article] [PubMed] [Google Scholar]
- 15.Nutiu R, Li Y. Aptamers with fluorescence-signaling properties. Methods. 2005;37:16–25. doi: 10.1016/j.ymeth.2005.07.001. [DOI] [PubMed] [Google Scholar]
- 16.Stojanovic MN, de Prada P, Landry DW. Aptamer-based folding fluorescent sensor for cocaine. J Am Chem Soc. 2001;123:4928–4931. doi: 10.1021/ja0038171. [DOI] [PubMed] [Google Scholar]
- 17.Buskirk AR, Liu DR. Creating small-molecule-dependent switches to modulate biological functions. Chem Biol. 2005;12:151–161. doi: 10.1016/j.chembiol.2004.11.012. [DOI] [PubMed] [Google Scholar]
- 18.Guntas G, Mansell TJ, Kim JR, Ostermeier M. Directed evolution of protein switches and their application to the creation of ligand-binding proteins. Proc Natl Acad Sci USA. 2005;102:11224–11229. doi: 10.1073/pnas.0502673102. [DOI] [PMC free article] [PubMed] [Google Scholar]
- 19.Ostermeier M. Engineering allosteric protein switches by domain insertion. Protein Eng Des Sel. 2005;18:359–364. doi: 10.1093/protein/gzi048. [DOI] [PubMed] [Google Scholar]
- 20.Tang Z, et al. Aptamer switch probe based on intramolecular displacement. J Am Chem Soc. 2008;130:11268–11269. doi: 10.1021/ja804119s. [DOI] [PubMed] [Google Scholar]
- 21.Wright CM, Heins RA, Ostermeier M. As easy as flipping a switch? Curr Opin Chem Biol. 2007;11:342–346. doi: 10.1016/j.cbpa.2007.04.011. [DOI] [PubMed] [Google Scholar]
- 22.Tyagi S, Kramer FR. Molecular beacons: Probes that fluoresce upon hybridization. Nat Biotechnol. 1996;14:303–308. doi: 10.1038/nbt0396-303. [DOI] [PubMed] [Google Scholar]
- 23.Ambroggio XI, Kuhlman B. Design of protein conformational switches. Curr Opin Struct Biol. 2006;16:525–530. doi: 10.1016/j.sbi.2006.05.014. [DOI] [PubMed] [Google Scholar]
- 24.Hall B, Hesselberth JR, Ellington AD. Computational selection of nucleic acid biosensors via a slip structure model. Biosens Bioelectron. 2007;22:1939–1947. doi: 10.1016/j.bios.2006.08.019. [DOI] [PubMed] [Google Scholar]
- 25.Sallee NA, Yeh BJ, Lim WA. Engineering modular protein interaction switches by sequence overlap. J Am Chem Soc. 2007;129:4606–4611. doi: 10.1021/ja0672728. [DOI] [PubMed] [Google Scholar]
- 26.Win MN, Smolke CD. Higher-order cellular information processing with synthetic RNA devices. Science. 2008;322:456–460. doi: 10.1126/science.1160311. [DOI] [PMC free article] [PubMed] [Google Scholar]
- 27.Strickland D, Moffat K, Sosnick TR. Light-activated DNA binding in a designed allosteric protein. Proc Natl Acad Sci USA. 2008;105:10709–10714. doi: 10.1073/pnas.0709610105. [DOI] [PMC free article] [PubMed] [Google Scholar]
- 28.Beisel CL, Bayer TS, Hoff KG, Smolke CD. Model-guided design of ligand-regulated RNAi for programmable control of gene expression. Mol Syst Biol. 2008;4:224. doi: 10.1038/msb.2008.62. [DOI] [PMC free article] [PubMed] [Google Scholar]
- 29.Lee J, et al. Surface sites for engineering allosteric control in proteins. Science. 2008;322:438–442. doi: 10.1126/science.1159052. [DOI] [PMC free article] [PubMed] [Google Scholar]
- 30.Xiao Y, Qu X, Plaxco KW, Heeger AJ. Label-free electrochemical detection of DNA in blood serum via target-induced resolution of an electrode-bound DNA pseudoknot. J Am Chem Soc. 2007;129:11896–11897. doi: 10.1021/ja074218y. [DOI] [PubMed] [Google Scholar]
- 31.Marras SA, Tyagi S, Kramer FR. Real-time assays with molecular beacons and other fluorescent nucleic acid hybridization probes. Clin Chim Acta. 2006;363:48–60. doi: 10.1016/j.cccn.2005.04.037. [DOI] [PubMed] [Google Scholar]
- 32.Isaacs FJ, Dwyer DJ, Collins JJ. RNA synthetic biology. Nat Biotechnol. 2006;24:545–554. doi: 10.1038/nbt1208. [DOI] [PubMed] [Google Scholar]
- 33.Keasling JD. Synthetic biology for synthetic chemistry. ACS Chem Biol. 2008;3:64–76. doi: 10.1021/cb7002434. [DOI] [PubMed] [Google Scholar]
- 34.Giepmans BN, Adams SR, Ellisman MH, Tsien RY. The fluorescent toolbox for assessing protein location and function. Science. 2006;312:217–224. doi: 10.1126/science.1124618. [DOI] [PubMed] [Google Scholar]
- 35.Monod J, Wyman J, Changeux JP. On the nature of allosteric transitions: A plausible model. J Mol Biol. 1965;12:88–118. doi: 10.1016/s0022-2836(65)80285-6. [DOI] [PubMed] [Google Scholar]
- 36.Tsai CJ, Ma B, Nussinov R. Folding and binding cascades: Shifts in energy landscapes. Proc Natl Acad Sci USA. 1999;96:9970–9972. doi: 10.1073/pnas.96.18.9970. [DOI] [PMC free article] [PubMed] [Google Scholar]
- 37.Mizoue LS, Chazin WJ. Engineering and design of ligand-induced conformational change in proteins. Curr Opin Struct Biol. 2002;12:459–463. doi: 10.1016/s0959-440x(02)00348-2. [DOI] [PubMed] [Google Scholar]
- 38.James LC, Roversi P, Tawfik DS. Antibody multispecificity mediated by conformational diversity. Science. 2003;299:1362–1367. doi: 10.1126/science.1079731. [DOI] [PubMed] [Google Scholar]
- 39.Cui Q, Karplus M. Allostery and cooperativity revisited. Protein Sci. 2008;17:1295–1307. doi: 10.1110/ps.03259908. [DOI] [PMC free article] [PubMed] [Google Scholar]
- 40.Okazaki K, Takada S. Dynamic energy landscape view of coupled binding and protein conformational change: Induced-fit versus population-shift mechanisms. Proc Natl Acad Sci USA. 2008;105:11182–11187. doi: 10.1073/pnas.0802524105. [DOI] [PMC free article] [PubMed] [Google Scholar]
- 41.Gsponer J, et al. A coupled equilibrium shift mechanism in calmodulin-mediated signal transduction. Structure. 2008;16:736–746. doi: 10.1016/j.str.2008.02.017. [DOI] [PMC free article] [PubMed] [Google Scholar]
- 42.Weikl TR, von Deuster C. Selected-fit versus induced-fit protein binding: Kinetic differences and mutational analysis. Proteins. 2009;75:104–110. doi: 10.1002/prot.22223. [DOI] [PubMed] [Google Scholar]
- 43.Shoemaker BA, Portman JJ, Wolynes PG. Speeding molecular recognition by using the folding funnel: The fly-casting mechanism. Proc Natl Acad Sci USA. 2000;97:8868–8873. doi: 10.1073/pnas.160259697. [DOI] [PMC free article] [PubMed] [Google Scholar]
- 44.Marvin JS, Hellinga HW. Manipulation of ligand binding affinity by exploitation of conformational coupling. Nat Struct Biol. 2001;8:795–798. doi: 10.1038/nsb0901-795. [DOI] [PubMed] [Google Scholar]
- 45.Kim JR, Ostermeier M. Modulation of effector affinity by hinge region mutations also modulates switching activity in an engineered allosteric TEM1 beta-lactamase switch. Arch Biochem Biophys. 2006;446:44–51. doi: 10.1016/j.abb.2005.11.014. [DOI] [PubMed] [Google Scholar]
- 46.Wang K, et al. Molecular engineering of DNA: Molecular beacons. Angew Chem Int Ed Engl. 2009;48:856–870. doi: 10.1002/anie.200800370. [DOI] [PMC free article] [PubMed] [Google Scholar]
- 47.El-Hajj HH, et al. Use of sloppy molecular beacon probes for identification of mycobacterial species. J Clin Microbiol. 2009;47:1190–1198. doi: 10.1128/JCM.02043-08. [DOI] [PMC free article] [PubMed] [Google Scholar]
- 48.Pace CN. Determination and analysis of urea and guanidine hydrochloride denaturation curves. Methods Enzymol. 1986;131:266–280. doi: 10.1016/0076-6879(86)31045-0. [DOI] [PubMed] [Google Scholar]
- 49.Shelton VM, Sosnick TR, Pan T. Applicability of urea in the thermodynamic analysis of secondary and tertiary RNA folding. Biochemistry. 1999;38:16831–16839. doi: 10.1021/bi991699s. [DOI] [PubMed] [Google Scholar]
- 50.Sosnick TR, Krantz BA, Dothager RS, Baxa M. Characterizing the protein folding transition state using psi analysis. Chem Rev. 2006;106:1862–1876. doi: 10.1021/cr040431q. [DOI] [PubMed] [Google Scholar]
- 51.Marras SA, Kramer FR, Tyagi S. Efficiencies of fluorescence resonance energy transfer and contact-mediated quenching in oligonucleotide probes. Nucleic Acids Res. 2002;30:e122. doi: 10.1093/nar/gnf121. [DOI] [PMC free article] [PubMed] [Google Scholar]
- 52.SantaLucia J., Jr A unified view of polymer, dumbbell, and oligonucleotide DNA nearest-neighbor thermodynamics. Proc Natl Acad Sci USA. 1998;95:1460–1465. doi: 10.1073/pnas.95.4.1460. [DOI] [PMC free article] [PubMed] [Google Scholar]
- 53.Ababou A, Desjarlais JR. Solvation energetics and conformational change in EF-hand proteins. Protein Sci. 2001;10:301–312. doi: 10.1110/ps.33601. [DOI] [PMC free article] [PubMed] [Google Scholar]
- 54.Shimaoka M, et al. Computational design of an integrin I domain stabilized in the open high affinity conformation. Nat Struct Biol. 2000;7:674–678. doi: 10.1038/77978. [DOI] [PubMed] [Google Scholar]
- 55.Lockless SW, Ranganathan R. Evolutionarily conserved pathways of energetic connectivity in protein families. Science. 1999;286:295–299. doi: 10.1126/science.286.5438.295. [DOI] [PubMed] [Google Scholar]
- 56.Hatley ME, Lockless SW, Gibson SK, Gilman AG, Ranganathan R. Allosteric determinants in guanine nucleotide-binding proteins. Proc Natl Acad Sci USA. 2003;100:14445–14450. doi: 10.1073/pnas.1835919100. [DOI] [PMC free article] [PubMed] [Google Scholar]
- 57.Oh KJ, Cash KJ, Plaxco KW. Beyond molecular beacons: Optical sensors based on the binding-induced folding of proteins and polypeptides. Chemistry. 2009;15:2244–2251. doi: 10.1002/chem.200701748. [DOI] [PMC free article] [PubMed] [Google Scholar]
- 58.Minowa O, Yagi K. Calcium binding to tryptic fragments of calmodulin. J Biochem. 1984;96:1175–1182. doi: 10.1093/oxfordjournals.jbchem.a134935. [DOI] [PubMed] [Google Scholar]
- 59.Linse S, Helmersson A, Forsen S. Calcium binding to calmodulin and its globular domains. J Biol Chem. 1991;266:8050–8054. [PubMed] [Google Scholar]
- 60.Bhattacharya S, Bunick CG, Chazin WJ. Target selectivity in EF-hand calcium binding proteins. Biochim Biophys Acta. 2004;1742:69–79. doi: 10.1016/j.bbamcr.2004.09.002. [DOI] [PubMed] [Google Scholar]
- 61.Schulz GE. Nucleotide binding proteins. In: Balaban M, editor. Molecular Mechanism of Biological Recognition. New York, NY: Elsevier/North-Holland Biomedical Press; 1979. pp. 79–94. [Google Scholar]
Associated Data
This section collects any data citations, data availability statements, or supplementary materials included in this article.


