

Abstract
Identifying the cortical areas activated by illusory contours provides valuable information on the mechanisms of object perception. We applied fMRI to identify the visual areas of the human brain involved in the perception of a moving Kanizsa-type illusory contour. Our results indicate that, in addition to other cortical regions, areas V5 and V1 are activated. Activity in area V1 was particularly prominent.
Keywords: Adult, Brain Mapping, Female, Form Perception, physiology, Humans, Magnetic Resonance Imaging, Male, Optical Illusions, physiology, Photic Stimulation, Visual Cortex, physiology
Introduction
One of the essential operations carried out by the visual system is the segmentation of the visual scene into different components. This process requires the identification of borders between different surfaces which may be signaled by differences in luminance, in texture and/or in chrominance. Border perception can also be induced between distant colinear discontinuities that signal the presence of an opaque object with the same optical characteristics as the background (Petry and Meyer, 1987). Borders which are perceived in the absence of differences in luminance or chrominance are usually called illusory or subjective contours. One class of illusory contours (Figure 1a) is generated by the alignment of high contrast borders that act as inducers of the illusory perception of a dark shape placed over a set of white disks (Kanizsa, 1979).
Figure 1.
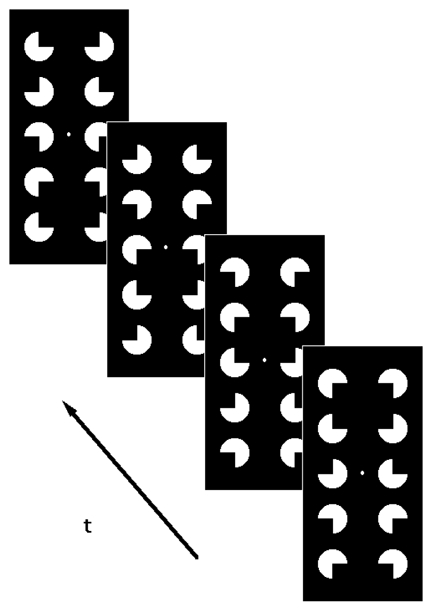
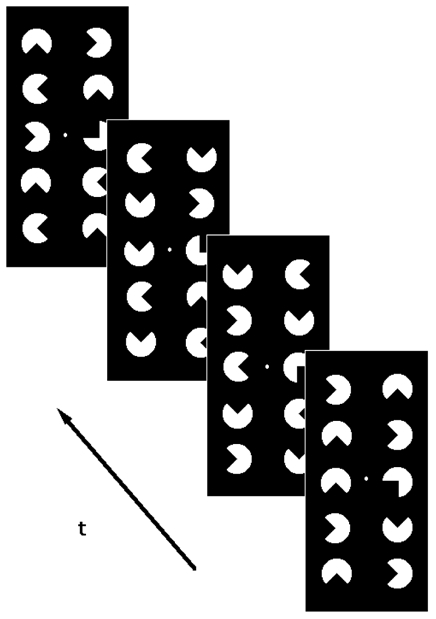
Figure 1-a. Stimuli presented during the “stimulation” epochs.
Four frames are shown. The arrow indicates the direction of the succession of the frames. The saccadic rotation of the pacmen provokes the illusion of a downward motion of the illusory rectangle. A small white circle at low contrast served as a fixation mark.
Figure 1-b. Stimuli presented during the “reference” epochs.
The pacmen are titled with respect to the “stimulation” epochs in order to avoid the perception of illusory edges. All the pacmen are animated with a rotational movement. A small white circle at low contrast served as a fixation mark.
Illusory contours have been extensively used to test different hypotheses about how the information is processed within the visual system (see (Purghé and Coren, 1992; Spillman and Dresp 1995) for an extended bibliography). Illusory contours provide good models, in particular, for investigating the mechanisms involved in perceptual grouping (Marr, 1982) and in the segregation of forms and objects from a background (Kojo et al., 1993).
One of the issues which are currently debated is the level at which illusory contours are encoded (Gregory, 1972; Smith and Over, 1975; Rock and Anson, 1979; von der Heydt et al., 1984; Grosof et al., 1993; Shapley, 1994; Hirsch et al., 1995; Ffytche and Zeki, 1996; Mendola et al., 1999). Imaging studies in humans have suggested that static illusory contours activate neuronal populations at the earliest levels of cortical processing. In a PET study, activation was shown mostly in area V2 (Ffytche and Zeki, 1996). In one fMRI investigation, activation of extrastriate areas has been reported with a possible weak participation at the border of areas V1 and V2 (Hirsch et al., 1995). In another fMRI study, similar static illusory contours have been shown to induce mainly activation of higher-order organized areas including V3A, V4v, V7 and V8. The activation of low level areas (V1 and V2) however was not ruled out (Mendola et al., 1999).
It is well known that processing within the visual system occurs along two main pathways, the occipito-temporal ventral stream and the occipito-parietal dorsal stream. Previous studies of cortical activation by illusory contours have used static stimuli which are likely to preferentially trigger neurons of the ventral stream (Hirsch et al., 1995; Ffytche and Zeki, 1996; Mendola et al., 1999).
Much less is known concerning the processing of moving illusory contours and the involvement of the dorsal stream. Two imaging studies have focused on the perception of illusory movement during viewing of static stimuli (Zeki et al. 1993; Tootell et al., 1995b). Strong activation was found within and around area V5, a cortical region known to be important for the perception of motion. In another imaging study, the apparent motion of illusory contours (Ramachandran, 1985) has been reported to evoke activation in V5 (Goebel et al. 1998).
It was therefore of interest to assess whether moving illusory contours mainly activate area V5, as most moving stimuli do, and/or whether they activate areas V1 and V2 like at least some of the static illusory contours do (Hirsch et al., 1995; Ffytche and Zeki, 1996). Moving illusory contours were generated by means of rotating pacman inducers (Bravo et al., 1988) configured in such a way that the subject perceives an illusory rectangle moving vertically across the visual field in a saccadic fashion (Figure 1a). Activations were assessed by means of functional fMRI. Part of this work has previously appeared in abstract form (Seghier et al. 1999).
Materials and Methods
Subjects
Thirteen healthy volunteers (age 32±10) were examined. All subjects (twelve males and one female) gave their informed consent to participate to the study. They had normal (n=11) or corrected-to-normal (n=2) vision. Nine among the volunteers were trained fMRI subjects.
Experiments
All subjects performed a first fMRI experiment (Experiment 1) aimed at identifying the functional responses to a moving illusory rectangle. Three additional control experiments were performed on two subjects: one to obtain the responses to stationary illusory contours (Experiment 2), another to localize the border between functional areas V1 and V2 (Experiment 3) and a third to identify with certainty the functional area V5 (Experiment 4). On these two subjects, whom we will refer to as the Control subjects C1 and C2, the four experiments were performed during the same session, without repositioning.
Paradigms
For all experiments, a block paradigm was applied, which alternated between “reference” and “stimulation” epochs.
Visual stimuli
Visual stimuli were generated by means of a PC equipped with VisionWorks software (Vision Research Graphics, Durham, USA). They were transmitted to the subjects by means of an LCD videoprojector (Eiki LC 6000, Eiki Industrial Company, Japan), a backprojection screen and a system of mirrors. The visual field spanned by this setup was approximately 15° and 11° in the horizontal and vertical directions respectively.
Experiment 1
The visual stimuli presented during the “stimulation” epochs aimed at inducing the perception of an illusory rectangle moving vertically (Figure 1a). Ten white pacman inducers (henceforth referred to as pacmen) were positioned on a dark background on the edges of a rectangular grid. Four adjacent pacmen among them were configured so as to induce the perception of the illusory Kanizsa rectangle. Vertical movement of this rectangle was achieved by the sequential display of four different configurations of the ten pacmen. Sequential configurations differed in a 90° rotation of the individual pacmen, clockwise for those in the left column and counterclockwise for those in the right column. Thus, while individual pacmen rotated, the illusory rectangle appeared to move downwards, in a saccadic fashion (Figure 1a). Refreshment rate of the sequential configurations was 1.7 Hz, corresponding to an angular velocity of the illusory rectangle as viewed by the subjects of 3.2°/s.
During the “reference” epochs, sequential configurations of pacmen were presented which were similar to those displayed during the “stimulation” epochs (Figure 1b). The sequential configurations differed from those presented during the “stimulation” epochs mainly in that most of the pacmen were tilted. In the experiments on the control subjects (C1 and C2) they were tilted by 10° and in all other experiments by 45°. Thus, the perception of illusory “staircase” shapes during the “reference” epochs was avoided. As during the “stimulation” epochs, sequential configurations differed in a 90° clockwise rotation of the individual pacmen in the left column and a 90° counterclockwise rotation of those in the right column. In order to reduce possible visual aftereffects, a black “transition” screen was presented when switching from “stimulation” to “reference” epochs. The MR measurements performed while viewing the “transition” screen were discarded during data processing. A white fixation dot was presented all over the experiment.
The illusory rectangle as viewed by the subjects extended over 2° and 1.7° in the horizontal and vertical directions respectively. They were displayed symetrically with respect to the vertical meridian. The radius of the pacmen extended over 0.45°. Thus the support ratio of these contours (Shipley and Kellman, 1992), i.e. the ratio of the total length of the borders actually drawn to the perimeter of the rectangle, is 0.48. Luminances of the pacmen and of the dark background were respectively 201 and 56 cd/m2, as measured on the projection screen.
Experiment 2
The visual stimulus presented during the “stimulation” epochs was a single static Kanizsa rectangle, centrally placed. During the “reference” epochs, the four pacmen were tilted by 10° to avoid the perception of the illusory rectangle. During “stimulation” and “reference” epochs, the pacmen flickered synchronously at 4 Hz (Hirsch et al., 1995).
In this experiment, the illusory contour as viewed by the subjects (C1 and C2), extended over 3.3° and 2.6° in the horizontal and vertical directions respectively, the radius of the pacmen extended over 0.7°, and the support ratio was 0.48. Luminances of the pacmen and of the dark background were respectively 201 and 56 cd/m2, as measured on the projection screen.
Attentional tasks
In order to maintain the subject’s attention, attentional tasks were built into the paradigm in Experiments 1 and 2. The fixation point (0.09°) was intermittently dimmed and subjects were instructed to report the occurrence of these (rare) events by means of a button press. Furthermore, during the “stimulation” epochs in Experiment 1, the vertical movement of the illusory rectangle, while occurring usually from top to bottom, occurred four times from bottom to top. Subjects were also instructed to report these reversals.
Experiment 3
The visual stimulus presented during the “stimulation” epochs aimed at inducing functional responses at the borders of areas V1 and V2. This was achieved by using a hourglass-shaped stimulus centered on the vertical meridian. The latter is known to be represented at the border between areas V1 and V2. The stimulus was composed of two segments filled with a contrast-reversing checkerboard pattern (8 Hz flickering). The two segments had their apices at the fixation point and were centered on the upper and lower vertical meridian respectively. The angle of the segments was 40°. Maximum eccentricity was 7° (Hasnain et al., 1998, Engel et al., 1997). During the “reference” epochs, only the fixation point was displayed.
Experiment 4
The visual stimulus presented during the “stimulation” epochs aimed at inducing robust functional responses in V5. A stimulus composed of a set of low-contrast (gray on white, 16% contrast), continuously expanding, concentric rings was presented (Tootell et al., 1995b). Maximum eccentricity of the rings was 10°. The expansion rate of the rings was 7 °/s. During the “reference” epochs, a snapshot of the rings was shown continuously. In order to prevent the perception of a motion aftereffect (Tootell et al 1995b), a transition screen was presented during the first 4 s of each “reference” epoch. The screen presented the same concentric rings, this time continuously contracting.
MR acquisition
Subjects were examined at 1.5T on a clinical MR scanner (Philips ACS II). The body coil was used for excitation. A circular surface coil (diameter = 13 cm) was used for detection. This coil was centered just beneath the occipital pole of the subject’s head. Positioning of the volume was performed on scout images acquired in the sagittal plane.
Subsequent to the functional MR scans, a high resolution 3D phase-contrast (PC) (Dumoulin et al., 1989) MR angiography scan was eventually ran from the volume functionally examined. This scan provided anatomical (T1-weighted) as well as vascular information about the volume of interest.
For the 11 subjects having performed Experiment 1 only, the volume of interest imaged in the functional scans was composed of 6 adjacent, axial, slices (5mm thickness each). It was oriented parallel to the bicommissural plane and centered so as to encompass most of the calcarine sulcus. The volume was measured five and four times during the “reference” and “stimulation” epochs respectively. This sequencing was repeated 4 times (total measurement time about 9 min).
Presentation time of the transition screen was about 15 sec. The functional scans applied a conventional gradient-recalled echo (GRE) MR sequence. The major parameters of this sequence were: TR=80 ms, TE=40 ms, acquisition matrix=45×64, FOV=154×220 mm2, flip angle=10°, bandwidth per pixel=14 Hz, acquisition time per slice=2.45 sec, reconstruction matrix=128×128. For the experiments performed with the two control subjects (C1 and C2), a single shot EPI GRE MR sequence was used. The major parameters of this sequence were: TR=2s, TE=50 ms, acquisition matrix=64×64, FOV=192×192 mm2, flip angle=80°, reconstruction matrix=64×64. The volume of interest imaged in the functional scans was composed of 8 adjacent, coronal, slices (5mm thickness each). This volume was oriented orthogonal to the bicommissural plane and also centered so as to encompass most of the calcarine sulcus. In experiments 1 and 2, the volume was measured seventeen times during each of the “reference”, “stimulation” and “transition screen” epochs. This sequencing was repeated five times (total measurement time 8′36″). In experiments 3 and 4, the volume was measured sixteen times during the “control” and “stimulation” epochs. This sequencing was repeated four times (total measurement time about 4′22″).
Data processing
MRI images were analyzed off line by means of a software package developed under the IDL 5.2 programming language (Research Systems Inc., Boulder, USA). Following image coregistration (Roth et al., 1996) and pixelwise baseline correction, functional responses were detected by means of cross correlation analysis (Bandettini et al., 1993). The cross-correlation coefficient was calculated pixelwise between a box-car function (representing the paradigm) and the set of measurements. In practice, we first identified pixels which presented a cross-correlation coefficient above a predefined threshold (typically .4). We retained only the pixels which were members of clusters counting a minimum number of “activated” pixels (typically 6) (Forman et al., 1995). In a second step, the cross-correlation coefficient of the average signal intensity within each cluster was determined. We kept only the clusters with an average cross-correlation coefficient above a second threshold (typically 0.5). The functional maps were obtained by superimposing the “activated” pixel clusters onto the anatomical images derived from the 3D PC MR scan. The functional areas were identified in each subject on the basis of the Talairach atlas (Talairach and Tournoux, 1988).
For the sake of presentation, the functional maps (corresponding to individual slices) were also combined into a single functional projection map. This projection map was obtained by superimposing the maximum intensity projections of the activation clusters onto averaged intensity projections of the corresponding anatomical images. The projections were performed perpendicularly to the individual image planes (projection maps thus were also oriented transversally). Following radiological practice, the left and right hemispheres are displayed on the right and left, respectively.
Results
A typical pattern of activation obtained with Experiment 1 is shown in Figure 2 (Subject S9). The four functional maps centered within this figure are from the central four slices (slices 2–5) of the volume explored. Positioning of this volume with respect to the calcarine sulcus is shown on the left, on a medio-sagittal scout MR image. For the sake of clarity, the calcarine sulcus has been manually darkened on this image. Relative positioning of the transverse images with respect to the antero-posterior direction may be appreciated by means of the reference levels drawn on the scout image and on the functional maps (dotted lines). The image on the right represents the functional projection map obtained from the four functional maps. We interpret the activation in and around the calcarine sulcus as representing areas V1–V2 and that located far laterally as corresponding to area V5, as documented in previous publications (Goebel et al. 1998). A third cluster of activation has been detected in the GOm (Gyrus Occipitalis medius, i.e. Brodmann areas 18/19). This cluster was found within the slices 2 to 4 (positioned symetrically with respect to the AC-PC plane). It was centered approximately 20 mm posteriorly and medially to V5. Thus the cluster detected within GOm included part of area KO, Kinetic Occipital (van Oostende et al. 1997) and region LOS, Lateral Occipital Sulcus, (Sunaert et al. 1999). Henceforth, we identify this region as LOS/KO (Sunaert et al. 1999).
Figure 2.
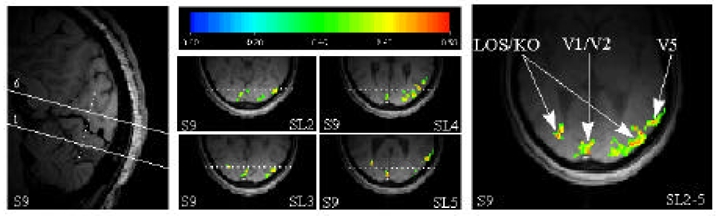
Typical functional map obtained in response to the moving illusory contours (subject S9).
Left. Scout image in the sagittal plane. The position of the volume (6 slices) acquired during the functional scans has been delineated. For the sake of clarity, the calcarine sulcus has been manually darkened.
Center. Four functional maps corresponding to slices 2 to 5. The color code represents the cross-correlation value of the voxels (red for 0.8 and 0.5 for green). The dashed line on the functional maps represents the intersection of the image planes with the coronal plane represented by the dashed line on the scout image.
Right. Projection map corresponding to the four functional maps shown in the center.
The individual results obtained on subjects S1–S11 in response to the moving illusory contour perception are summarized in Table 1. The number of pixels are presented which were found activated in the areas of interest, namely V1/V2, V5 and LOS/KO. Also, the mean cross-correlation coefficients in those areas are indicated. Functional responses were detected in V1/V2 and LOS/KO for all subjects, and in V5 in all but two subjects. The volume of the activated areas was on average 0.3 ± 0.2 cm3 in V1/V2, 0.6 ± 0.5 cm3 in LOS/KO and 0.2 ± 0.2 cm3 in V5.
Table 1.
Perception of moving illusory contours.
Activations obtained in areas V1/V2, LOS/KO (Lateral Occipital Sulcus/Kinetic Occipital) and V5 for 11 subjects (S1–S11).
| V1/V2 | LOS/KO | V5 | ||||
|---|---|---|---|---|---|---|
| Subjects | n | cc | n | cc | n | cc |
| S1 | 7 | 0.50 | 37 | 0.60 | 0 | - |
| S2 | 19 | 0.60 | 54 | 0.70 | 0 | - |
| S3 | 39 | 0.90 | 172 | 0.95 | 26 | 0.90 |
| S4 | 53 | 0.70 | 35 | 0.60 | 12 | 0.75 |
| S5 | 12 | 0.75 | 25 | 0.60 | 15 | 0.50 |
| S6 | 13 | 0.75 | 18 | 0.60 | 46 | 0.76 |
| S7 | 9 | 0.75 | 85 | 0.80 | 28 | 0.60 |
| S8 | 15 | 0.73 | 56 | 0.75 | 49 | 0.70 |
| S9 | 29 | 0.70 | 129 | 0.80 | 45 | 0.80 |
| S10 | 40 | 0.80 | 32 | 0.75 | 28 | 0.65 |
| S11 | 50 | 0.80 | 25 | 0.60 | 7 | 0.70 |
| Mean | 26 | 0.72 | 61 | 0.70 | 23 | 0.70 |
| SD | 16 | 0.1 | 47 | 0.1 | 17 | 0.1 |
n: the number of pixels activated, cc: the cross-correlation coefficient for the region of interest; SD: standard deviation.
The inter-individual variability in the functional responses from V1/V2 can be appreciated in Figure 3 which presents the activation in that region for six subjects (S4, S5, S7, S8, S10, and S11). The mean cross-correlation thresholds applied for producing these figures have been increased compared to those used for pixel counting (Table 1), so that only the strongest activations are shown. As with Figure 2, positioning of the transverse images with respect to the calcarine sulcus is indicated by a reference level in the antero-posterior direction.
Figure 3.
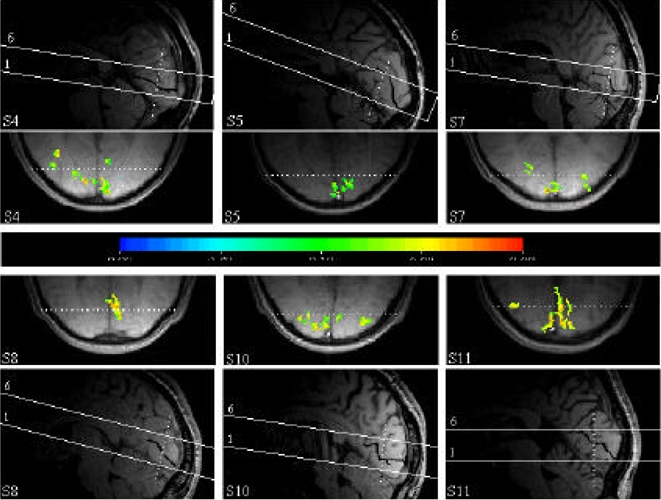
Functional projection maps obtained in response to the moving illusory contours for six subjects (S4, S5, S7, S8, S10 and S11).
Top and bottom. Scout images in the sagittal plane for each of the six subjects. The positioning of the volume acquired during the functional scans has been delinated. For the sake of clarity, the calcarine sulcus has been manually darkened.
Center. The functional projection maps obtained for each subject. Those projection maps were obtained by projecting the functional maps corresponding to slices 2 to 5.
The dashed line on the functional projection maps represents the intersection of these maps with the coronal plane represented by the dashed line on the corresponding scout image.
In the two experiments performed on control subjects C1 and C2, we wanted to verify the location of the activations with respect to areas V1, V2 and V5 and to determine whether moving illusory contours activate the same regions as static illusory contours. Figure 4 shows the maps obtained for one of the two subjects (C1). The upper part of the figure (Figs. 4a–c) shows the activities recorded in response to the static illusory contour (Fig. 4a), to stimulation of the vertical meridian (Fig. 4b) and to the moving illusory contour (Fig. 4c). The border between areas V1 is found in response to stimulation of the vertical meridian. On the basis of the activations displayed in Fig. 4b, we thus have delineated V1 and the border areas V1–V2 in Figs. 4a and 4c. The activations in Fig. 4c clearly demonstrate, with this subject, that the moving illusory contours activate cortical regions inside area V1. Although less strong, the activation during the perception of the static illusory contour is also present in area V1, near the border with V2 (Fig. 4a). Similar results were obtained with subject C2.
Figure 4.
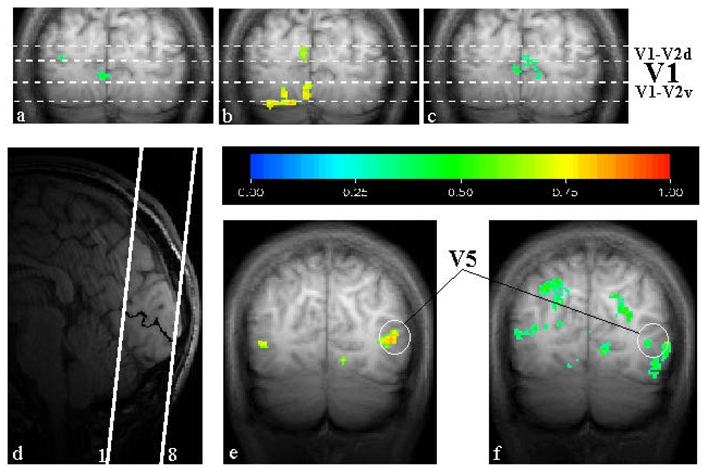
Functional projection maps for the control subject C1.
The upper part of the figure (Fig. 4a–c) shows the activations recorded in response to the static illusory contour (Fig. 4a), to the hourglass-shaped stimulus aimed at delineating the border between areas V1 and V2 (Fig. 4b) and to the moving illusory contours (Fig. 4c). These maps represent a projection of two coronal slices (4–5).
The position of the volume (8 slices) acquired during the functional scans has been delineated on the scout image in the sagittal plane (Fig. 4d). For the sake of clarity, the calcarine sulcus has been manually darkened.
The activations induced by the moving illusory contour near the V5 region are shown in Fig. 4f. The activations induced by expanding rings is shown in Fig. 4e. Figs. 4e and 4f represent the projection maps obtained from three coronal slices (1–3)
The region activated by the moving illusory contour nearby V5 is shown in Figure 4f, and may be compared with the activation resulting from expanding rings (Fig. 4e). This comparison demonstrates that moving illusory contours activate a region corresponding to area V5 as well as some neighbouring areas. In addition, proper registration of the activities evoked by the moving illusory contours and the expanding rings within and around V5 was also tested and found in two other subjects (S3 and S4) among the 11 subjects having performed Experiment 1 only.
The results obtained for the 2 control subjects in response to moving (Experiment 1) and to static illusory contours (Experiment 2) are summarized in Table 2. Again, the number of pixels are presented which were found activated within the areas of interest namely V1/V2, LOS/KO and V5, together with the mean cross-correlation coefficients in those areas. Activation was also found in the Cuneus, the Lingual Gyrus, the superior parietal gyrus and the Cerebellum. Note that the number of pixels and the cross correlation coefficients are larger for moving than for static illusory contours in areas V1/V2 as is also apparent in Figure 4. The volume of the activated areas was on average 1.4 ± 0.4 cm3 in V1/V2 and 0.4 ± 0.2 cm3 in V5 for the moving illusory contours and 0.5 ± 0.05 cm3 in V1/V2 for the static illusory contours.
Table 2.
Perception of moving versus stationary illusory contours.
Activations obtained in areas V1/V2, LOS/KO (Lateral Occipital Sulcus/Kinetic Occipital) and V5 for two control subjects (C1–C2) during the perception of moving illusory contours (MIC) and static illusory contours (SIC).
| V1/V2 | LOS/KO | V5 | |||||
|---|---|---|---|---|---|---|---|
| Subjects | n | cc | n | cc | n | cc | |
| C1 | MIC | 156 | 0.70 | 131 | 0.70 | 54 | 0.70 |
| SIC | 38 | 0.70 | 48 | 0.65 | - | - | |
| C2 | MIC | 86 | 0.80 | 53 | 0.80 | 17 | 0.70 |
| SIC | 47 | 0.75 | 38 | 0.70 | - | - | |
| Mean | MIC | 121 | 0.75 | 92 | 0.75 | 35 | 0.70 |
| SD | 35 | 0.05 | 39 | 0.05 | 18 | 0 | |
| Mean | SIC | 42.5 | 0.72 | 43 | 0.67 | - | - |
| SD | 4.5 | .02 | 5 | 0.02 | - | - | |
n: the number of pixels activated, cc: the cross-correlation coefficient for the region of interest; SD: standard deviation.
Discussion
The Experiment 1 performed on the eleven subjects S1–S11 has yielded functional responses to moving illusory contours within V1/V2 (undifferentiated). The Experiment 2 performed on control subjects C1 and C2 has allowed us to refine the localization of these responses. The involvement of the primary visual area was clearly demonstrated. In addition, activations were found in a region containing area V5 and its satellites. Other activations were found in a region corresponding to LOS/KO (Sunaert et al. 1999), probably included in the large area V3A as defined in (Tootell et al., 1997). The region LOS/KO has been reported to respond to moving stimuli and kinetic contours (Orban et al., 1995; Reppas et al., 1997; van Oostende et al. 1997, Sunaert et al. 1999).
In Experiment 1, the stimuli presented during the “reference” and the “stimulation” epochs differed in the 45° tilt of the pacmen. A priori, part of the activations detected could be ascribed to this mere difference. The continuous rotation of the pacmen in “reference” and “stimulation” epochs lowers the perception of this difference, however. Moreover, in the two experiments on the control subjects, pacmen were tilted by only 10° and similar results were obtained. Since most cortical neurons respond similarly to orientations differing by 10 degrees, we therefore assume that the activations observed in Experiment 1 are not to be ascribed to a greater sensitivity to vertical and horizontal elements than to oblique ones.
Because the fixation task was the same during the “reference” and the “stimulation” epochs, it is also unlikely that the activations reported here result from differences in spatial attention. Artefactual activations due to eye movements appear unlikely since the subjects were instructed to report the dimming of the fixation spot, a task which is difficult to perform without precise fixation of the spot. From monkey studies, this task is known to provide an efficient means to stabilize the eye position (Wurtz, 1969). There is motion correspondence between pacmen in the the “stimulation” epochs which is not perfectly matched in the “reference” epochs. Therefore, a contribution from this effect to the activations detected may not be ruled out completely.
For all these reasons, we consider that the activations observed are due without ambiguity to the perception of moving illusory contours. The inter-subject variability observed (Table 1) may furthermore reflect functional and anatomic differences in visual areas between subjects (Hasnain et al., 1998) and/or differences in the ability of the brain to perform perceptual grouping (McCourt and Paulson, 1994). The volumes activated with the control subjects (Table 2) were found larger than with the eleven subjects having performed only Experiment 1 (Table 1). This may be ascribed partly to the larger cerebral volume explored with the control subjects and partly to the difference in MR acquisition techniques used in these two series of experiments.
The additional control experiments demonstrate that moving illusory contours, in contrast to kinetic boundaries, activate area V5 and its satellites. Involvement of area V5 has been confirmed by the co-registration of the activity evoked by the moving illusory contours (Figure 4e) and that generated by an expanding set of concentric rings (Figure 4f), a stimulus known to activate area V5 and its surrounding areas (Tootell et al., 1995b). Activation of that region is not surprising, given the strong perception of movement generated by the stimulus and the fact that the V5 area has repeatedly been shown to be activated by real (Zeki et al., 1991; Watson et al., 1993; Tootell et al., 1995a), by illusory (Zeki et al. 1993; Tootell et al., 1995b) and by apparent (Goebel et al. 1998) moving stimuli. Surprising in our results is that the activity in area V5 is often weaker (in terms of cross correlation coefficients) than in areas V1/V2 (Table 1 and Table 2) and that it was not observed for all subjects (Table 1).
Activation in low level areas has been reported with static illusory contours (Kanizsa type) in two earlier studies, one using PET (Ffytche and Zeki, 1996) and one using fMRI (Hirsch et al., 1995). In their recent fMRI studies, Mendola et al. (1999) do not rule out these findings but they insist on the predominant activations obtained in high level cortical regions, including V3A, V4v, V7 and V8. The activation patterns obtained in our study show that moving as well as static illusory contours activate low-order retinotopically organized visual areas, especially V1. Involvement of area V1 during the perception of moving illusory contours is clearly shown in Figures 2 and 3 where activations are located along the calcarine sulcus, the location of area V1 (Holmes 1918; Tootell et al 1998). The activation of area V1 has furthermore been confirmed by the co-registration, for the two control subjects, of the activities evoked by a static illusory contour (Figure 4a), by the moving illusory contour (Figure 4c) and by the hourglass-shaped stimulus centered on the vertical meridian (Figure 4b), a stimulus known to activate neurons located at the frontier between areas V1 and V2 (Tootell et al. 1995a, Engel et al. 1997).
The patterns of activity obtained here differ from those reported by Hirsch et al. (1995) and by Ffytche and Zeki (1996) for static illusory contours. In these studies, the activations which were assigned to V2 (Hirsch et al., 1995; Ffytche and Zeki, 1996) and possibly to V3 (Ffytche and Zeki, 1996) were located more laterally than in our study. It could be argued that the area labeled LOS/KO in our data corresponds to the cortex assigned to V2 and/or V3 in these earlier reports. In contrast, the active area labeled V1/V2 in our results is located more medially and overlaps the calcarine sulcus in most instances (Figures 2, 3 and 4), thus including area V1.
In their report on the regions activated by apparent motion of illusory contours, Goebel and his collaborators (Goebel et al. 1998) observed a weak activation in V1, contrasting with a robust activity in V5. The discrepancy with our results is likely due to differences in the stimuli used. In their study the two illusory contours were positioned 9° apart, symetrically with respect to the vertical meridian, thus stimulating alternatively each hemisphere. We used a distance of 1.7° to separate the four positions of the illusory contours which straddled the vertical meridian. The motion with our stimulus was less saccadic and it involved activation of regions representing the vertical meridian. In the study of Goebel and collaborators, apparent motion must involve neurons located in both hemispheres along the representation of the horizontal meridian. A difference in stimulus velocity, 3°/s in our study and 17°/s in Goebel’s study, could also have contributed to the stronger activation of V1 in our study. This interpretation is consistent with the findings of a recent fMRI study showing that the V1 activation decreases linearly as speed increases during the perception of real motion (Chawla et al. 1998). In preliminary measurements, we have also observed that the activation within V1 is stronger with 3°/s than with 10°/s.
With static illusory contours, V1 activation was not observed with PET (Ffytche and Zeki, 1996), but was not entirely dismissed with fMRI (Hirsch et al., 1995; Mendola et al. 1999). Our results (see Table 2) on the two subjects tested with the static illusory contours confirm that area V1 is activated by these stimuli but suggest that the activation by moving illusory contours is stronger than with static illusory stimuli. Thus, animation such as 4Hz flickering (Hirsch et al. 1995), reversal of contrast polarity (Mendola et al, 1999) or movement seems to enhance activation in V1.
The detection of activations in low order visual areas for static as well as for moving illusory contours suggests that perceptual grouping involves neural processing in these areas. This is consistent with the results of animal studies showing activations in areas V1 and V2 by illusory contours (von der Heydt et al., 1984; Redies et al., 1986; Grosof et al. 1993; Shapley 1994; Sheth, et al., 1996; Baumann et al., 1997; Leventhal et al. 1998). Moreover, activation of the primary visual cortex with Kanisza-type illusory contours is in keeping with results from psychophysical studies that argue for local mechanisms in the perception of such figures (Dresp and Bonnet, 1991; Dresp and Bonnet, 1993; Davis and Driver, 1994) and with a recent report of perception of illusory contours in patients with spatial neglect (Vuilleumier and Landis, 1998).
The observation of activity in area V1 due to illusory stimuli is of particular interest in the context of the debate concerning the cortical regions activated by mental images, with several reports claiming that only areas outside area V1 are activated (Roland and Gulyas, 1994; D’Esposito et al., 1997; Mellet et al., 1998; Braun et al., 1998), while others report evidence that area V1 is involved in visual imagery (Kosslyn et al., 1993; Le Bihan, 1993; Kosslyn et al., 1995, Chen et al, 1998). Although perception related to illusory contours differs from mental imagery, the strong activation of area V1 by moving illusory contours in our results is in keeping with the idea that low-order visual areas are activated by high-order processes such as visual imagery or illusory perception. These results suggest that V1 is a distributing center, rather than simply a spatially transformed replication of the retina (Zeki and Shipp, 1988).
In conclusion, these fMRI results provide additional ground to the hypothesis that low-level processes are involved in perceptual grouping and in illusory contour perception. This supports the idea that visual information processing is a cooperative task distributed over several interconnected brain modules (Bullier and Novak, 1995). Whether such activity is generated through local computations involving horizontal connections or whether they require feedback input (Hupé et al., 1998) from higher order areas remains a subject for future investigation.
Acknowledgments
M. Seghier has a PhD grant from the French Ministry of Research and Technology. We are grateful to C. Icardo who participated to preliminary experiments. Financial support from the Groupement d’Intérêt Scientifique “Sciences de la Cognition” (1995) and from the European Commission (Biomed 2 PL950870) is gratefully acknowledged.
References
- Bandettini PA, Jesmanowicz A, Wong EC, Hyde J. Processing strategies for time-course data sets in functional MRI of the human brain. MRM. 1993;30:161–173. doi: 10.1002/mrm.1910300204. [DOI] [PubMed] [Google Scholar]
- Baumann R, van der Zwan R, Peterhans E. Figure-ground segregation at contours: a neural mechanism in the visual cortex of the alert monkey. Eur J Neurosci. 1997;9:1290–1303. doi: 10.1111/j.1460-9568.1997.tb01484.x. [DOI] [PubMed] [Google Scholar]
- Braun AR, Balkin TJ, Wesensten NJ, Gwadry F, Carson RE, Varga M, Baldwin P, Belenky G, Herscovitch P. Dissociated pattern of activity in visual cortices and their projections during human rapid eye movement sleep. Science. 1998;279:91–95. doi: 10.1126/science.279.5347.91. [DOI] [PubMed] [Google Scholar]
- Bravo M, Blake R, Morrison S. Cats see subjective contours. Vision Res. 1988;28:861–965. doi: 10.1016/0042-6989(88)90095-8. [DOI] [PubMed] [Google Scholar]
- Bullier J, Novak LG. Parallel versus serial processing: new vistas on the distributed organization of the visual system. Curr Opin Neurobiol. 1995;5:497–503. doi: 10.1016/0959-4388(95)80011-5. [DOI] [PubMed] [Google Scholar]
- Chawla D, Philips J, Buechel C, Edwards R, Friston KJ. Speed-dependent motion sensitive responses in V5: an FMRI study. NeuroImage. 1998;7:86–96. doi: 10.1006/nimg.1997.0319. [DOI] [PubMed] [Google Scholar]
- Chen W, Kato T, Zhu X, Ogawa S, Tank D, Ugurbil K. Human primary visual cortex and lateral geniculate nucleus activation during visual imagery. NeuroReport. 1998;9:3669–3674. doi: 10.1097/00001756-199811160-00019. [DOI] [PubMed] [Google Scholar]
- D’Esposito M, Detre JA, Aguirre GK, Stallcup M, Alsop DC, Tippet LJ, Farah MJ. A functional MRI study of mental image generation. Neuropsychologia. 1997;35:725–30. doi: 10.1016/s0028-3932(96)00121-2. [DOI] [PubMed] [Google Scholar]
- Davis G, Driver J. Parallel detection of Kanizsa subjective figures in the human visual system. Nature. 1994;371:791–793. doi: 10.1038/371791a0. [DOI] [PubMed] [Google Scholar]
- Dresp B, Bonnet C. Psychophysical evidence for low-level processing of illusory contours and surfaces in the Kanizsa square. Vision Res. 1991;31:1813–17. doi: 10.1016/0042-6989(91)90028-4. [DOI] [PubMed] [Google Scholar]
- Dresp B, Bonnet C. Psychophysical measures of illusory form perception: further evidence for local mechanisms. Vision Res. 1993;33:759–66. doi: 10.1016/0042-6989(93)90195-3. [DOI] [PubMed] [Google Scholar]
- Dumoulin CL, Souza SP, Walker MF, Wagle W. Three dimensional phase contrast angiography. MRM. 1989;9:139–149. doi: 10.1002/mrm.1910090117. [DOI] [PubMed] [Google Scholar]
- Engel S, Glover G, Wandell B. Retinotopic organisation in human visual cortex and the spatial precision of fMRI. Cereb Cortex. 1997;7:181–192. doi: 10.1093/cercor/7.2.181. [DOI] [PubMed] [Google Scholar]
- Ffytche DH, Zeki S. Brain activity related to the perception of illusory contours. NeuroImage. 1996;3:104–108. doi: 10.1006/nimg.1996.0012. [DOI] [PubMed] [Google Scholar]
- Forman S, Cohen J, Fitzgerald M, Eddy W, Mintun M, Noll D. Improved assessment of significant activation in functional magnetic resonance imaging (fMRI): use of cluster-size threshold. MRM. 1995;33:636–647. doi: 10.1002/mrm.1910330508. [DOI] [PubMed] [Google Scholar]
- Goebel R, Khorram-Sefat D, Mucli L, Hacker H, Singer W. The constructive nature of vision: direct evidence from functional magnetic resonance imaging studies of apparent motion and motion imagery. Eur J Neurosci. 1998;10:1563–1573. doi: 10.1046/j.1460-9568.1998.00181.x. [DOI] [PubMed] [Google Scholar]
- Gregory R. Cognitive contours. Nature. 1972;238:51–52. doi: 10.1038/238051a0. [DOI] [PubMed] [Google Scholar]
- Grosof DH, Shapley RM, Hawken MJ. Macaque V1 neurons can signal ‘illusory’ contours. Nature. 1993;365:550–552. doi: 10.1038/365550a0. [DOI] [PubMed] [Google Scholar]
- Hasnain MK, Fox PT, Woldorff MG. Intersubject variability of functional areas in the human visual cortex. Hum Brain Mapp. 1998;6:301–315. doi: 10.1002/(SICI)1097-0193(1998)6:4<301::AID-HBM8>3.0.CO;2-7. [DOI] [PMC free article] [PubMed] [Google Scholar]
- Hirsch J, DeLaPaz RL, Relkin NR, Victor J, Kim K, Li T, Borden P, Rubin N, Shapley R. Illusory contours activate specific regions in human visual cortex: evidence from functional magnetic resonance imaging. Proc Natl Acad of Sci USA. 1995;92:6469–6473. doi: 10.1073/pnas.92.14.6469. [DOI] [PMC free article] [PubMed] [Google Scholar]
- Hupé JM, James AC, Payne BR, Lomber SG, Girard P, Bullier J. Cortical feedback improves discrimination between figure and background by V1, V2 and V3 neurons. Nature. 1998;394:784–787. doi: 10.1038/29537. [DOI] [PubMed] [Google Scholar]
- Holmes G. Disturbances of vision by cerebral lesions. Br J Ophthal. 1918;2:353–384. doi: 10.1136/bjo.2.7.353. [DOI] [PMC free article] [PubMed] [Google Scholar]
- Kanizsa G. Organization in vision. New York: Praeger; 1979. [Google Scholar]
- Kojo I, Liinasuo M, Rovamo J. Spatial and temporal properties of illusory figures. Vision Res. 1993;33:897–901. doi: 10.1016/0042-6989(93)90072-5. [DOI] [PubMed] [Google Scholar]
- Kosslyn SM, Alpert NM, Thompson WL, Maljkovic V, Weise SB, Chabris CF, Hamilton SE, Rauch SL, Buonanno FS. Visual mental imagery activates topographically organized visual cortex: PET investigations. J Cognitive Neurosci. 1993;5:263–287. doi: 10.1162/jocn.1993.5.3.263. [DOI] [PubMed] [Google Scholar]
- Kosslyn SM, Thompson WL, Klim IJ, Alpert NM. Topographical representations of mental images in primary visual cortex. Nature. 1995;378:496–498. doi: 10.1038/378496a0. [DOI] [PubMed] [Google Scholar]
- Le Bihan D. Activation of human primary visual cortex during visual recall: a magnetic resonance imaging study. Proc Natl Acad Sci USA. 1993;90:11802–11805. doi: 10.1073/pnas.90.24.11802. [DOI] [PMC free article] [PubMed] [Google Scholar]
- Leventhal AG, Wang Y, Schmolesky MT, Zhou Y. Neural correlates of boundary perception. Vis Neurosci. 1998;15:1107–1118. doi: 10.1017/s0952523898156110. [DOI] [PubMed] [Google Scholar]
- Marr D. Vision. New York: Freeman; 1982. [Google Scholar]
- McCourt ME, Paulson K. The influence of illusory contours on the detection of luminance increments and decrements. Vision Res. 1994;34:2469–75. doi: 10.1016/0042-6989(94)90290-9. [DOI] [PubMed] [Google Scholar]
- Mellet E, Tzouri N, Denis M, Mazoyer B. Cortical anatomy of mental imagery of concrete nouns based on their dictionary definition. NeuroReport. 1998;9:803–808. doi: 10.1097/00001756-199803300-00007. [DOI] [PubMed] [Google Scholar]
- Mendola JD, Dale AM, Fischl B, Liu AK, Tootell RBH. The representation of illusory and real contours in human cortical visual areas revealed by functional magnetic resonance imaging. J Neurosci. 1999;19:8560–72. doi: 10.1523/JNEUROSCI.19-19-08560.1999. [DOI] [PMC free article] [PubMed] [Google Scholar]
- Orban GA, Dupont P, Debruyn B, Vogels R, Vandenberghe R, Mortelmans L. A motion area in human visual cortex. Proc Nat Acad Sci USA. 1995;92:993–997. doi: 10.1073/pnas.92.4.993. [DOI] [PMC free article] [PubMed] [Google Scholar]
- Petry S, Meyer G. The perception of illusory contours. New York: Springer; 1987. [Google Scholar]
- Purghé F, Coren S. Subjective contours 1900–1990: Research trends and bibliography. Percept Psychophys. 1992;51:291–304. doi: 10.3758/bf03212255. [DOI] [PubMed] [Google Scholar]
- Ramachandran VS. Apparent motion of subjective surfaces. Perception. 1985;14:127–34. doi: 10.1068/p140127. [DOI] [PubMed] [Google Scholar]
- Redies C, Crook JM, Creutzfeldt OD. Neuronal responses to borders with and without luminance gradients in cat visual cortex. Expl Brain Res. 1986;61:469–481. doi: 10.1007/BF00237572. [DOI] [PubMed] [Google Scholar]
- Reppas JB, Niyogi S, Dale AM, Sereno MI, Tootell RB. Representation of motion boundaries in retinotopic human visual cortical areas. Nature. 1997;388:175–9. doi: 10.1038/40633. [DOI] [PubMed] [Google Scholar]
- Rock I, Anson R. Illusory contours as the solution to a problem. Perception. 1979;8:665–681. doi: 10.1068/p080665. [DOI] [PubMed] [Google Scholar]
- Roland PE, Gulyas B. Visual imagery and visual representation. Trends Neurosci. 1994;17:281–287. doi: 10.1016/0166-2236(94)90057-4. [DOI] [PubMed] [Google Scholar]
- Roth M, Delon-Martin C, Rubin C, Bourgeois M, Graveron D, Segebarth C, Décorps M. Coregistration of 2D MR images by means of a direct Fourier method applied in k-space. 13th Annual Meeting of the European Society of Magnetic Resonance in Medicine and Biology; 1996. p. 164. [Google Scholar]
- Seghier M, Dojat M, Delon-Martin C, Segebarth C, Bullier J. V1 activation induced by illusory contours: Evidence from fMRI. NeuroImage. 1999;9:S854. [Google Scholar]
- Shapley RM. Linearity and non-linearity in cortical receptive fields. In: Bock GR, Goode JA, editors. Highly-order processing in the visual system. Chichester: Wiley; 1994. pp. 71–87. [Google Scholar]
- Sheth B, Sharma J, Rao S, Sur M. Orientation maps of subjective contours in visual cortex. Science. 1996;214:2110–2115. doi: 10.1126/science.274.5295.2110. [DOI] [PubMed] [Google Scholar]
- Shipley T, Kellman P. Strength of visual interpolation depends on the physically specified to total edge length. Perception and Psychophysics. 1992;521:97–106. doi: 10.3758/bf03206762. [DOI] [PubMed] [Google Scholar]
- Smith A, Over R. Tilt aftereffects with subjective contours. Nature. 1975;257:581–582. doi: 10.1038/257581a0. [DOI] [PubMed] [Google Scholar]
- Spillmann L, Dresp B. Phenomena of illusory form: can we bridge the gap between levels of explanation? Perception. 1995;24:1333–64. doi: 10.1068/p241333. [DOI] [PubMed] [Google Scholar]
- Sunaert S, van Hecke P, Marchal G, Orban GA. Motion-responsive regions of the human brain. Exp Brain Res. 1999;127:355–370. doi: 10.1007/s002210050804. [DOI] [PubMed] [Google Scholar]
- Talairach J, Tournoux P. Co-planar stereotaxic atlas of the human brain. New York: Thieme Medical; 1988. [Google Scholar]
- Tootell R, Reppas J, Kwong K, Malach R, Born R, Brady T, Rosen B, Belliveau J. Functional analysis of human MT and related visual cortical areas using magnetic resonance imaging. J Neurosci. 1995a;15:3215–3230. doi: 10.1523/JNEUROSCI.15-04-03215.1995. [DOI] [PMC free article] [PubMed] [Google Scholar]
- Tootell RBH, Reppas JB, MDA, Look RB, Sereno MI, RM, Brady TJ, Rosen B. Visual motion after-effect in human cortical area MT revealed by functional magnetic resonance imaging. Nature. 1995b;375:139–141. doi: 10.1038/375139a0. [DOI] [PubMed] [Google Scholar]
- Tootell RB, Mendola JD, Hadjikhani NK, Ledden PJ, Liu AK, Reppas JB, Sereno MI, Dale AM. Functional analysis of V3A and related areas in human visual cortex. J Neurosci. 1997;17:7060–78. doi: 10.1523/JNEUROSCI.17-18-07060.1997. [DOI] [PMC free article] [PubMed] [Google Scholar]
- Tootell RB, Hadjikhani NK, Vanduffel W, Liu AK, Mendola JD, Sereno MI, Dale AM. Functional analysis of primary visual cortex (V1) in humans. Proc Natl Acad Sci USA. 1998;95:811–817. doi: 10.1073/pnas.95.3.811. [DOI] [PMC free article] [PubMed] [Google Scholar]
- van Oostende S, Sunaert S, Van Hecke P, Marchal G, Orban G. The kinetic occipital (KO) region in man: an fMRI study. Cerebral Cortex. 1997;7:690–701. doi: 10.1093/cercor/7.7.690. [DOI] [PubMed] [Google Scholar]
- von der Heydt R, Peterhans E, Baumgartner G. Illusory contours and cortical neuron responses. Science. 1984;224:1260–62. doi: 10.1126/science.6539501. [DOI] [PubMed] [Google Scholar]
- Vuilleumier P, Landis T. Illusory contours and spatial neglect. NeuroReport. 1998;9:2481–2484. doi: 10.1097/00001756-199808030-00010. [DOI] [PubMed] [Google Scholar]
- Watson J, Myers R, Frackowiak R, Hajnal J, Woods R, Maziotta J, Shipp S, Zeki S. Area V5 of the human brain: evidence from a combined study using PET and MRI. Cereb Cortex. 1993;3:79–94. doi: 10.1093/cercor/3.2.79. [DOI] [PubMed] [Google Scholar]
- Wurtz R. Visual receptive fields of strate cortex neurons in awake monkeys. J Neurophysiol. 1969;32:727–742. doi: 10.1152/jn.1969.32.5.727. [DOI] [PubMed] [Google Scholar]
- Zeki S, Shipp S. The functional logic of cortico-cortical connections. Nature. 1988;335:311–317. doi: 10.1038/335311a0. [DOI] [PubMed] [Google Scholar]
- Zeki S, Watson D, Lueck C, Friston K, Kennard C, Frackowiak RS. A direct demonstration of functional specialization in human visual cortex. J Neurosci. 1991;11:641–649. doi: 10.1523/JNEUROSCI.11-03-00641.1991. [DOI] [PMC free article] [PubMed] [Google Scholar]
- Zeki S, Watson JD, Frackowiak RS. Going beyond the information given: the relation of illusory visual motion to brain activity. Proc R Soc Lond B Biol Sci. 1993;252:215–22. doi: 10.1098/rspb.1993.0068. [DOI] [PubMed] [Google Scholar]