Abstract
Resonance energy transfer (RET) is widely used to detect proximity between biomolecules. In transparent solution the maximum donor-to-acceptor distance for RET is about 70Å. We measured the effects of metallic silver island films on RET from the intrinsic tryptophan of a protein to a bound probe as the acceptor. These preliminary experiments revealed a dramatic increase in the apparent Förster distance increasing from 28.6 to 63 Å. These results suggest the use of silver island films for detecting long range proximity between biomolecules and for biotechnology applications based on RET.
Fluorescence resonance energy transfer (RET) is a through-space interaction in which a donor (D) fluorophore transfers energy to an acceptor (A). Because of the well-known dependence of RET on D-to-A distance, and because the characteristic Förster distances (R0) are comparable to the dimensions of proteins, these phenomena have been widely used to measure distance between sites or macromolecules [1,2]. More recently, there has been a dramatic increase in the use of RET in biotechnology to develop assays based on molecular proximity. As example, the phenomena of RET are used to measure DNA hybridization [3,4], detection of DNA amplification [5,6], advanced dyes for DNA sequencing [7,8], and is the basis of enhanced fluorescence from molecular beacons and some aptamers [9–12]. RET is also used as the basis for immunoassay [13,14], physiological indicators and sensors [15–18]. In all these applications of RET the detection of proximity is limited to distances below 100 Å. This limitation is the result of Förster distances near 50 Å and in the most favorable cases near 70 Å [19,20].
In the present report we examined RET in the presence of metallic particles, in particular, silver island films. These films consist of sub-wavelength size silver particles deposited on an inert non-metallic substrate. It is known that the spectral properties of fluorophores can be changed when near a metallic surface, typically within 200 Å [21–24]. These effects include change in the quantum yields, lifetimes, and the radiative and non-radiative decay rates. Additionally, theoretical reports have predicted that proximity to subwavelength metallic particles can also increase the rates of energy transfer at distances up to 700 Å [25,26], or 10-fold larger than typical Förster distances. Other reports have suggested that placement of donors and acceptors in microcavities can increase the rate of energy transfer [27–30], and that the transfer rates can be increased by two orders of magnitude near the tip of a scanning near field microscope with resonant illumination [31]. A recent report detected an increase in the transfer rate with an optical microcavity [32]. This report also stated that the mechanism was not completely understood.
We tested these predictions of increased RET using a protein-bound donor and acceptor. The donors were the two intrinsic tryptophan residues of bovine serum albumin (BSA). This protein spontaneously binds a variety of hydrophobic fluorophores. We used the well-known fluorophore 1-anilinonapthlene-8-sulfonic acid (ANS) which is essentially non-fluorescent in water but highly fluorescent when bound to BSA [33]. We found the apparent Förster distance R0 to be increased by more than twofold near the metal islands.
Materials and methods
Procedure for making silver nanoparticle films
Silver islands were formed on quartz microscope slides using a published procedure [34]. The use of quartz provided UV transmission and less autofluorescence than glass. The quartz slides were soaked in a 10:1 (v/v) mixture of H2SO4 (95–98%) and H2O2 (30%) overnight before the deposition, washed with distilled water, and air-dried prior to use. Silver deposition was carried out in a clean beaker equipped with a Teflon-coated stir bar. Eight drops of fresh 5% NaOH solution were added to a fast stirring silver nitrate solution (0.22 g in 26ml of water). Dark-brownish precipitates were formed immediately. Less than 1ml of ammonium hydroxide was then added drop by drop to redissolve the precipitate. The clear solution was cooled to 5 °C in an ice bath, followed by placing the clean quartz slides in the solution. At 5 °C, a fresh solution of D-glucose (0.35 g in 4 ml of water) was added. The mixture was stirred for 2 min at that temperature. The beaker was removed from the ice bath and allowed to warm up to 30 °C. As the color of the mixture turned from yellow-greenish to yellow-brown the color of the slides became greenish. The slides were removed and rinsed with water and bath sonicated for 1 min at room temperature. After rinsing with water the slides were stored in water for several hours prior to the experiments.
Samples
BSA and ANS were obtained from Sigma and used without further purification. The concentration of BSA and ANS in the PBS buffer was calculated using the extinction coefficient of ε(280) = 43, 500M−1 cm−1 and ε(360) = 7800M−1 cm−1, respectively. From the absorption spectra the concentration of BSA was 1.5 × 10⁻³M and the ANS to BSA molar ratio was 1.2. Experiments were performed at 20 °C in equilibrium with the atmosphere. The BSA–ANS solutions were examined in three geometries, a 0.1mm demountable cuvette, between two unsilvered quartz plates, and between two silver island films (SIFs). These SIFs displayed a surface plasmon absorption with a maximum near 440 nm, indicating sub-wavelength size particles. The absorption of the SIFs alone was about 0.095, 0.023, and 0.021 at 450, 350, and 280 nm, respectively. From previous studies with the quartz plates and SIFs, we estimate the sample thickness to be about 1 μm [35].
Emission spectra were obtained using a SLM 8000 spectrofluorometer. Intensity decays were measured in the frequency-domain using instrumentation described previously [36,37]. The excitation wavelength of 288nm was obtained from the frequency-doubled output of a 3.80MHz cavity dumped rhodamine 6G dye laser with a 10 ps or less pulse width. For the frequency-domain measurements the protein emission was observed through a 340nm interference filter. For all steady-state and frequency-domain measurements the excitation was vertically polarized and the emission observed through a horizontally oriented polarizer to minimize scattered light. The FD intensity decay were analyzed in terms of the multi-exponential model
| (1) |
where τi are the lifetimes with amplitudes αi and Σαi = 1.0. Fitting to the multi-exponential model was performed as described previously [38]. The contribution of each component to the steady-state intensity is given by
| (2) |
The mean decay time is given by
| (3) |
Theory
We used a phenomenological approach to analyze the frequency-domain intensity decays. We first analyzed the tryptophan intensity decay of the BSA–ANS complexes in terms of a distribution of donor-to-acceptor distances [39,40]. The D-to-A distribution is assumed to be Gaussian with a mean distance of r̄ and standard deviation σ
| (4) |
The standard deviation σ is relative to the full width at half-maximum to hw = 2.354σ. This distribution was recovered by using the donor-alone intensity decay as a known quantity. The donor decay in the presence of acceptor was interpreted in terms of the distance distribution, as described in detail elsewhere [41]. Briefly let ID(kt) be the multiexponential intensity decay of the donor in the absence of acceptor,
| (5) |
In the presence of acceptor the intensity decay for D–A pair at a distance r is given by
| (6) |
where the decay times of each component of the donor decay are given by
| (7) |
Since there is a range of D-to-A distances the observed donor decay is given by
| (8) |
This expression, along with the usual sine and cosine transforms, is used to analyze the FD data in terms of an apparent distance distribution. The recovered values of r̄ and hw are only apparent values because of the presence of two tryptophan donors in BSA and the presence of a heterogeneous population of bound ANS molecules.
In the present experiments we assume there are two populations of donor–acceptor pairs, one in the bulk solution and a second adjacent to the silver islands. We further assume that the Förster distances (R0i) are different for the two populations. For the bulk solution the value of R01 is known from the spectral properties of the donor and acceptor [41]. For the population adjacent to the metal island we assumed a different unknown value R02. The intensity decay of the sample is thus given by
| (9) |
where g1 and g2 are the fractional steady-state intensities of each population, g1 and g2 = 1.0. Each intensity decay is given by Eq. (8) but with different values of R01 and R02. To decrease the number of variable parameters we assumed the values of r̄ and hw were the same for both populations, which is equivalent to assuming that the BSA–ANS molecules were not perturbed by contact with the silver islands. For the donor-alone intensity decay we used the αi and τi values obtained from the multi-exponential analysis of BSA between quartz plates. At present we cannot justify this assumption. However, it seems that proximity to the silver island films would shorten the donor decay times and decrease the time for RET. Hence any estimate of the value of R02 is likely to be an underestimate of the actual value near the silver islands.
The donor intensity decays in the presence of SIFs were also analyzed in terms of a single apparent R0 value. In this case the previously recovered values of r̄ and hw were held constant and R0 was a floating parameter. The recovered value reflects a weighted value representative of the two populations.
Results
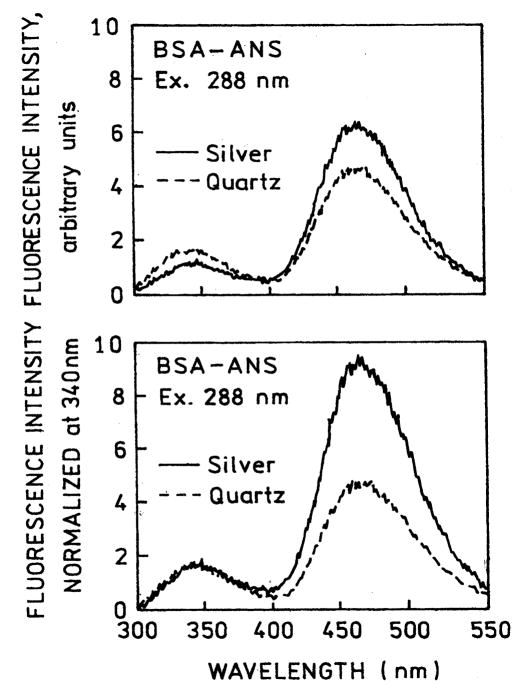
Fig. 1 shows the emission spectra of BSA and the BSA–ANS complex in a cuvette. Binding of ANS to BSA resulted in an approximate 60% decrease in the intrinsic tryptophan emission. We next examined the emission spectra of BSA–ANS between unsilvered quartz plates and between silver island films (Fig. 2). These results show a decrease in the tryptophan intensity and an increase in the ANS intensity (top), suggesting increased energy transfer. The spectral changes is more easily seen in the donor-normalized emission spectra (bottom). We note that the silver island films absorb more strongly at 450nm than at 288 and 340 nm, so the change in relative amplitude of the tryptophan and ANS cannot be due to attenuation of the emission by the SIFs. From the known concentration of the sample and the estimated 1 μm sample thickness we estimate the sample absorbance to be below 7 × 10⁻³ from 270 to 450 nm. Hence the decreased tryptophan emission is not due to an inner filter effect.
Fig. 1.
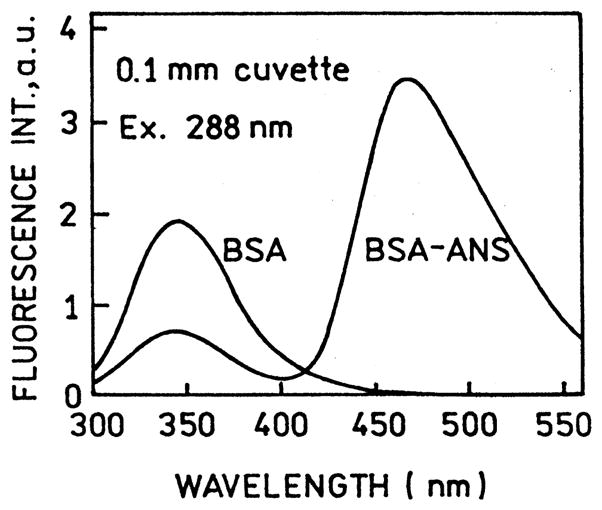
Emission spectra of BSA and BSA–ANS in a cuvette with no SIFs. The quenching of tryptophan emission (340 nm) is due to energy transfer to ANS.
Fig. 2.
Emission spectra of BSA–ANS between quartz plates (–––) and SIFs (—). In the lower panel the spectra are normalized to the tryptophan emission.
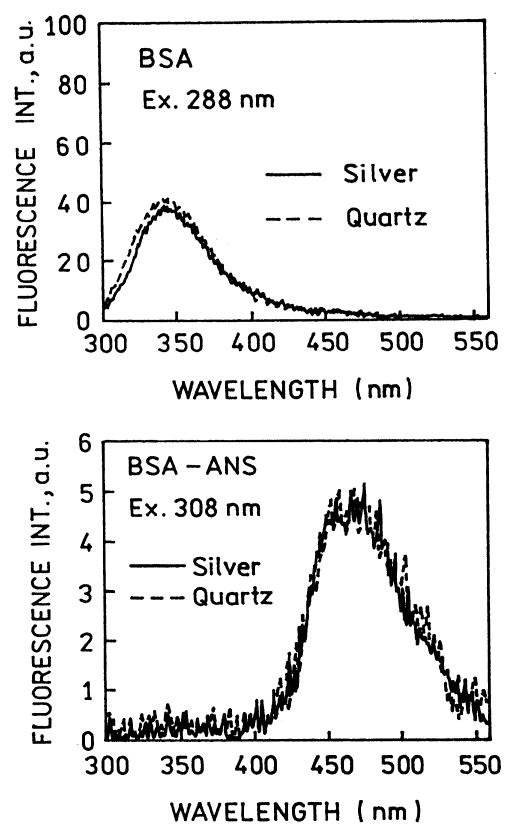
We questioned whether the change in the relative intensity of tryptophan and ANS was due to an effect of the SIFs on these fluorophores. Hence each species was examined separately between quartz plates between silver island films (Fig. 3). In both cases the SIFs did not affect the emission intensities. This result agrees with our previous studies which showed that the intensities of fluorophores with good quantum yields are not strongly altered by the SIFs [35].
Fig. 3.
Top: Emission spectrum of BSA between quartz plates (–––) and SIFs (—). Bottom: Emission spectrum of BSA–ANS excited at 308 nm, outside the tryptophan absorption.
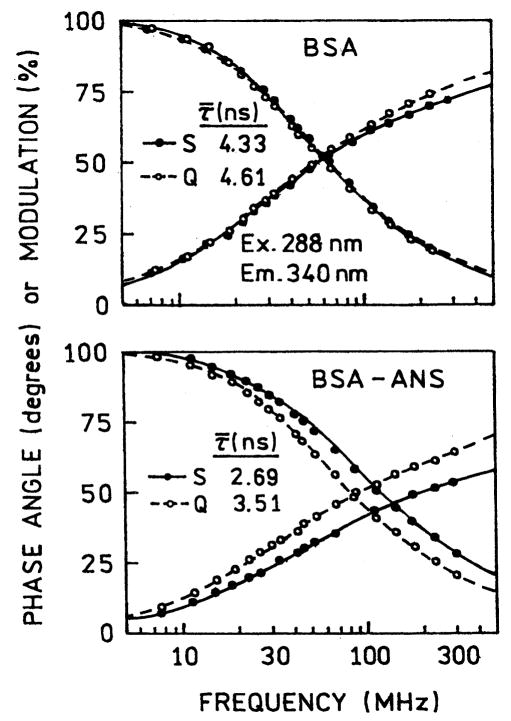
Because of variations in the thickness of the sample between the plates, and variations in the SIF absorbance, it is difficult to obtain reliable intensity measurements. We examined the donor intensity decays, which are mostly independent of the overall intensity. The SIFs had only a small effect on the intrinsic tryptophan decay of BSA (Fig. 4, top). We expected proximity to the SIFs to decrease the lifetime [42], but only a minor change was observed. In contrast to BSA alone, the SIFs had a dramatic effect on the tryptophan intensity decay in the BSA–ANS complex (Fig. 4, bottom). This effect can be seen from the shift to higher frequencies and a decrease in the mean lifetime from 3.51 to 2.69 ns (Table 1). We believe the decrease tryptophan lifetime in the presence of acceptor and SIFs is due to an effect of the metallic particles on the extent of energy transfer. We analyzed the tryptophan intensity decay data in terms of a distance distribution. We first recovered the apparent tryptophan-to-ANS distance distribution using R0 = 28.6 Å, which is characteristic of tryptophan-to-ANS energy transfer [41]. We call this distribution “apparent” because BSA possesses two tryptophan residues and ANS may not be bound to a unique site on the protein.
Fig. 4.
Frequency-domain intensity decays of BSA (top) and BSA–ANS (bottom) between quartz plates (–––) and SIFs (—).
Table 1.
Multiexponential analysis of BSA intensity decay in absence and presence of ANS
| Conditionsa | τ̄ (ns) | α1 | τ1 (ns) | α2 | τ2 (ns) | α3 | τ1 (ns) | ||
|---|---|---|---|---|---|---|---|---|---|
| BSA, C | 4.91b | 0.214 | 1.10 | 0.250 | 2.94 | 0.536 | 5.68 | 1.4 (55.1)c | |
| BSA, Q | 4.61 | 0.307 | 0.81 | 0.379 | 2.82 | 0.313 | 6.12 | 1.5 (140.6) | |
| BSA, S | 4.33 | 0.325 | 0.52 | 0.365 | 2.38 | 0.310 | 5.67 | 1.3 (192.8) | |
| BSA–ANS, C | 3.99 | 0.364 | 0.66 | 0.484 | 2.92 | 0.152 | 6.42 | 1.5 (172.1) | |
| BSA–ANS, Q | 3.51 | 0.459 | 0.48 | 0.317 | 2.03 | 0.223 | 4.96 | 1.4 (306.5) | |
| BSA–ANS, S | 2.69 | 0.615 | 0.23 | 0.277 | 1.37 | 0.108 | 4.47 | 1.0 (506.2) |
C-cuvette, Q-quartz, S-silver islands.
τ̄ = Σfiτi, fi = αiτi/Σαiτi.
value in parentheses are for best single exponential fit. The values were calculated using uncertainities in the phase angle of 0.3 and 0.007 in the modulation.
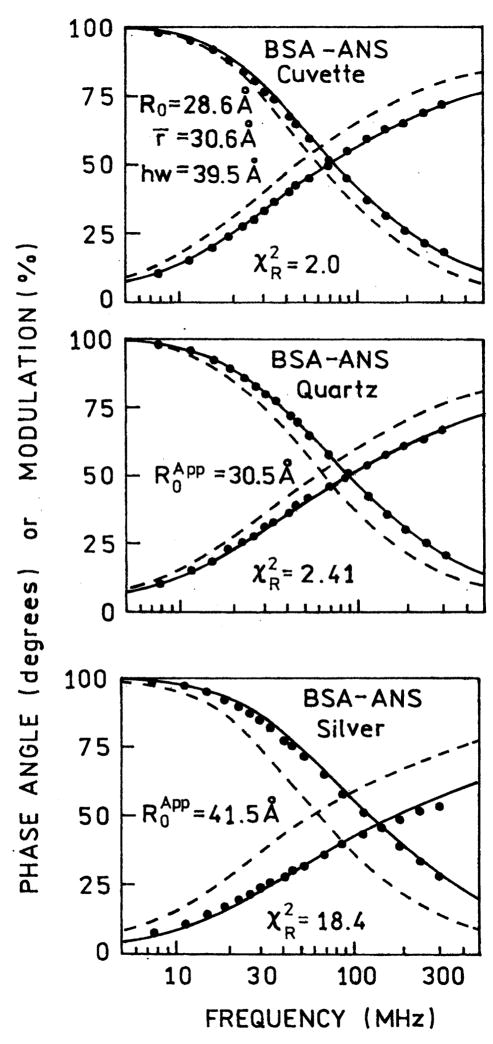
We assumed that placing BSA–ANS between quartz plates or silver islands did not perturb the structure. Hence the same distance distribution should be present when the sample is placed between the silvered or unsilvered plates. The frequency-domain data were then analyzed for the samples between quartz plates and SIFs keeping the values of r̄ and hw fixed, yielding an apparent value of R0 for the entire sample (Fig. 5). There was a modest increase in to 30.5 Å between the quartz plates, and a more dramatic increase in to 41.5 Å between the SIFs. This increase in the apparent value of R0 can be seen from the dramatic shift of the tryptophan intensity decay to higher modulation frequencies. This result indicates that the RET efficiency increased near the SIFs, in agreement with the emission spectra in Fig. 1. However, the intensity decays between the SIFs could not be fit to a single Förster distance, as can be seen from the elevated value of (Fig. 5, lower panel) (see Table 2).
Fig. 5.
Distance distribution fit for BSA–ANS in free solution (top). The same distribution parameters were kept in analysis on quartz (middle) and on silver (bottom) while R0 was floating. The dashed lines represent BSA donor decays in absence of ANS (Table 1).
Table 2.
Distance distribution analysis of BSA–ANS
| Conditions | One R0 Model |
Two R0 Model |
||||||||||
|---|---|---|---|---|---|---|---|---|---|---|---|---|
| R0 (Å) | r̄ (Å) | hw (Å) | R01 (Å) | R02 (Å) | g1a | r̄ (Å) | hw (Å) | |||||
| Cuvette | 〈28.6〉b | 30.6 | 39.5 | 2.0 | ||||||||
| Quartz | 〈28.6〉 | 〈30.6〉 | 〈39.5〉 | 8.2 | ||||||||
| 30.5 | 〈30.6〉 | 〈39.5〉 | 2.4 | |||||||||
| Silver | 〈28.6〉 | 〈30.6〉 | 〈39.5〉 | 366.3 | 〈28.6〉 | 58.8 | 0.707 | 〈30.6〉 | 〈39.5〉 | 0.9 | ||
| 41.5 | 〈30.6〉 | 〈39.5〉 | 18.4 | 32.0 | 63.0 | 0.798 | 〈30.6〉 | 〈39.5〉 | 0.8 | |||
Fractional intensity; g2 = 1 − g1.
Angular brackets indicate of a fixed parameter value.
We next analyzed the FD data in terms of the two populations expected for our sample, the bulk samples and the sample near the SIFs. When interpreting the spectral data, it is important to consider the sample geometry and its 1 μm thickness. We expect the SIFs to affect the fluorophores themselves out to distances of about 200 Å from the metallic surface [42]. At present we do not know if the effects on RET occur over larger distances. A distance of 200 Å between two SIFs encompasses 4% of the sample. We analyzed the intensity decay in terms of two populations, one with the R0 value (R01 = 28.6 Å) know for tryptophan-to-ANS energy transfer, and a second unknown R0 value (R02) for BSA–ANS adjacent to the SIFs (Fig. 6). We found the data could be fit if we included a second population of D–A pair with a Förster distance R02 = 63 Å which contributed 10% to the total donor intensity. The resolution of the second R02 value was surprisingly good, as can be seen from the surface for this parameter. Also, there appeared to be little correlation between the values of R01 and R02 (see Fig. 7).
Fig. 6.
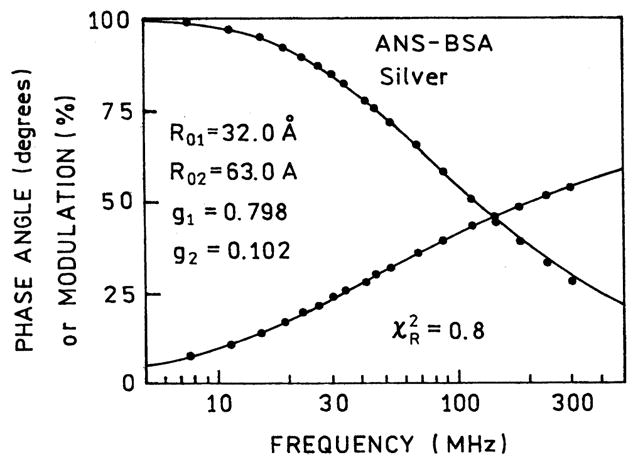
Energy transfer fit to two populations of BSA–ANS with different R0 values.
Fig. 7.
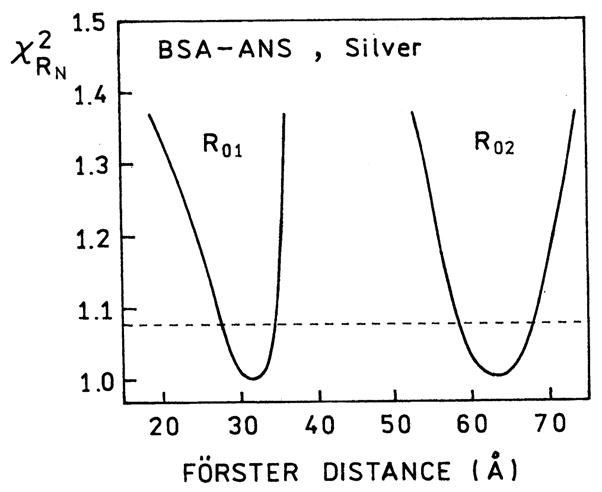
The resolution of recovered Förster distances are seen by the surfaces. The value of R01 (or R02) was kept constant while two other parameters were floating. The distance distribution parameters were kept constant at the values recovered in the cuvette (Table 2).
The range of distances from the BSA–ANS molecules to the metallic silver surfaces complicates the data and its interpretation. While we know about 4% of the metal surface, we do not know how to decide upon the fraction of the observed emission which is due to this fraction. The fractional contribution of the bulk sample (g1) and the sample near the metal (g2) is weighted by the effect of the metal on the donor quantum yield and the extent of energy transfer. It is known that metallic surfaces can increase the local electric field [22–24] which can result in selective excitation of fluorophores near the metal. Metallic surfaces can also quench the emission of fluorophores within 50 Å of the surface [43]. Given these considerations a 10% contribution from molecules near the SIFs seems to be a reasonable result.
Discussion
What are the practical uses of metal-enhanced resonance energy transfer? In the near term most applications are likely to rely on the qualitative rather than quantitative aspects of this phenomenon. The effects of the metallic surfaces will be sensitive to the fluorophore-metal distance and relative orientations. Since it is difficult to fabricate samples with such precise dimensions, the observed effects will reflect some average populations. Thus metal-enhanced RET is not likely to be used for structural determinations. However, there are many instances where the desired information is obtained from the occurrence of energy transfer. Some examples include association of cell surface antigens, protein–protein interactions and DNA hybridization. In these cases the use of SIFs may allow such association phenomena to be detected over distances considerably larger than presently available Förster distances. It is known that Förster distances for some D–A pairs can be as large as 70 Å [44,45]. If the twofold increases observed here occur for other D–A pairs, then Förster distances as large as 140 Å should be readily achievable.
Acknowledgments
This work was supported by the NIH, National Center for Research Resource, RR-08119.
Footnotes
Abbreviations: A, acceptor; ANS, 8-anilinonaphthalene-1-sulfonic acid; BSA, bovine serum albumin; D, donor; RET, resonance energy transfer; SIFs, silver island films.
References
- 1.Wu P, Brand L. Review-resonance energy transfer. Methods and applications. Anal Biochem. 1994;218:1–13. doi: 10.1006/abio.1994.1134. [DOI] [PubMed] [Google Scholar]
- 2.Dos Remedios CG, Moens PDJ. Fluorescence resonance energy transfer spectroscopy is a reliable “ruler” for measuring structural changes in proteins. J Struct Biol. 1995;115:175–185. doi: 10.1006/jsbi.1995.1042. [DOI] [PubMed] [Google Scholar]
- 3.Parkhurst KM, Parkhurst LJ. Detection of point mutations in DNA by fluorescence energy transfer. J Biomed Opt. 1996;1:435–441. doi: 10.1117/12.250674. [DOI] [PubMed] [Google Scholar]
- 4.Ota N, Hirano KI, Warashina M, Andrus A, Mullah B, Hatanaka K, Taira K. Determination of interactions between structured nucleic acids by fluorescence resonance energy transfer (FRET): selection of target sites for functional nucleic acids. Nucleic Acid Res. 1998;26(3):735–743. doi: 10.1093/nar/26.3.735. [DOI] [PMC free article] [PubMed] [Google Scholar]
- 5.Hall JG, Eis PG, Law SM, Reynaldo LP, Prudent JR, Marshall DJ, Allawi HT, Mast AL, Dahlberg JE, Kwiatkowski RW, de Arruda M, Neri BP, Lyamichev VI. Sensitive detection of DNA polymorphisms by the serial invasive signal amplification reaction. PNAS. 2000;97(15):8272–8277. doi: 10.1073/pnas.140225597. [DOI] [PMC free article] [PubMed] [Google Scholar]
- 6.Svanvik N, Ståhlberg A, Sehlstedt U, Sjöback R, Kubista M. Detection of PCR products in real time using light-up probes. Anal Biochem. 2000;287:179–182. doi: 10.1006/abio.2000.4824. [DOI] [PubMed] [Google Scholar]
- 7.Li Y, Glazer AN. Design, synthesis, and spectroscopic properties of peptide-bridged fluorescence energy-transfer cassettes. Bioconjug Chem. 1999;10:241–245. doi: 10.1021/bc980080k. [DOI] [PubMed] [Google Scholar]
- 8.Ju J, Ruan C, Fuller CW, Glazer AN, Mathies RA. Fluorescence energy transfer dye-labeled primers for DNA sequencing and analysis. Proc Natl Acad Sci USA. 1995;92:4347–4351. doi: 10.1073/pnas.92.10.4347. [DOI] [PMC free article] [PubMed] [Google Scholar]
- 9.Tyagi S, Marras SAE, Kramer FR. Wavelength-shifting molecular beacons. Nat Biotechnol. 2000;18:1191–1196. doi: 10.1038/81192. [DOI] [PubMed] [Google Scholar]
- 10.Tyagi S, Kramer FR. Molecular beacons: probes that fluorescence upon hybridization. Nat Biotechnol. 1996;14:303–308. doi: 10.1038/nbt0396-303. [DOI] [PubMed] [Google Scholar]
- 11.Tyagi S, Bratu DP, Kramer FR. Multicolor molecular beacons for allele discrimination. Nat Biotechnol. 1998;16:49–53. doi: 10.1038/nbt0198-49. [DOI] [PubMed] [Google Scholar]
- 12.Stojanovic MN, de Prada P, Landry DW. Fluorescent sensors based on aptamer self-assembly. J Am Chem Soc. 2000;122:11547–11548. doi: 10.1021/ja0022223. [DOI] [PubMed] [Google Scholar]
- 13.Ullman EF, Schwarzberg M, Rubenstein KE. Fluorescent excitation transfer immunoassay: a general method for determination of antigens. J Biol Chem. 1976;251:264–270. [PubMed] [Google Scholar]
- 14.Schobel U, Egelhaaf HJ, Brecht A, Oelkrug D, Gauglitz G. New donor–acceptor pair for fluorescent immunoassays by energy transfer. Bioconjug Chem. 1999;10:1107–1114. doi: 10.1021/bc990073b. [DOI] [PubMed] [Google Scholar]
- 15.Jensen KK, Martini L, Schwartz TW. Enhanced fluorescence resonance energy transfer between spectral variants of green fluorescent protein through zinc-site engineering. Biochemistry. 2001;40:938–945. doi: 10.1021/bi001765m. [DOI] [PubMed] [Google Scholar]
- 16.Miyawaki A, Llopis J, Helm R, McCaffrey JM, Adams JA, Ikura M, Tsien RY. Fluorescent indicators for Ca2+ based on green fluorescent proteins and calmodulin. Nature. 1997;388(28):882–887. doi: 10.1038/42264. [DOI] [PubMed] [Google Scholar]
- 17.Rolinski OJ, Birch DJS, McCartney LJ, Pickup JC. Sensing metabolites using donor–acceptor nanodistributions in fluorescence resonance energy transfer. Appl Phys Lett. 2001;78(18):2796–2798. [Google Scholar]
- 18.Levitsky IA, Krivoshlykov SG, Grate JW. Signal amplification in multichromophore luminescence-based sensors. J Phys Chem B. 2001;105:8468–8473. [Google Scholar]
- 19.Selvin PR. Lanthanide-based resonance energy transfer. IEEE J Sel Top Quantum Electron. 1996;2(4):1077–1087. [Google Scholar]
- 20.Selvin PR, Rana TM, Hearst JE. Luminescence resonance energy transfer. J Am Chem Soc. 1994;116:6029–6030. [Google Scholar]
- 21.Drexhage KH. Interaction of light with monomolecular dye lasers, Chapter IV. In: Wolf E, editor. Progress in Optics XII. North-Holland, Amsterdam, London: 1974. pp. 161–232. [Google Scholar]
- 22.Weitz DA, Garo S. The enhancement of Raman scattering, resonance Raman scattering, and fluorescence from molecules adsorbed on a rough silver surface. J Chem Phys. 1983;78:5324–5338. [Google Scholar]
- 23.Kümmerlen J, Leitner A, Brunner H, Aussenegg FR, Wokaun A. Enhanced dye fluorescence over silver island films: analysis of the distance dependence. Mol Phys. 1993;80(5):1031–1046. [Google Scholar]
- 24.Barnes WL. Topical review: fluorescence near interfaces: the role of photonic mode density. J Mod Opt. 1998;45(4):661–699. [Google Scholar]
- 25.Hua XM, Gersten JI, Nitzan A. Theory of energy transfer between molecules near solid state particles. J Chem Phys. 1985;83:3650–3659. [Google Scholar]
- 26.Gersten JI, Nitzan A. Accelerated energy transfer between molecules near a solid particle. Chem Phys Lett. 1984;104(1):31–37. [Google Scholar]
- 27.Kobayashi T, Zheng Q, Sekiguchi T. Resonant dipole–dipole interaction in a cavity. Phys Rev A. 1995;52(4):2835–2846. doi: 10.1103/physreva.52.2835. [DOI] [PubMed] [Google Scholar]
- 28.Cho M, Sibley RJ. Excitation transfer in the vicinity of a dielectric surface. Chem Phys Lett. 1995;242:291–296. [Google Scholar]
- 29.Agarwal GS, Gupta SD. Microcavity-induced modification of the dipole–dipole interaction. Phys Rev A. 1998;57(1):667–670. [Google Scholar]
- 30.Barnes WL. Spontaneous emission and energy transfer in the optical microactivity. Contemp Phys. 2000;41(5):287–300. [Google Scholar]
- 31.Fiurasek J, Chernobrod B, Prior Y, Averbukh IS. Coherent light scattering and resonant energy transfer in an apertureless scanning near-field optical microscope. Phys Rev B. 2001;63:045420-1–045420-10. [Google Scholar]
- 32.Andrew P, Barnes WL. Förster energy transfer in an optical microactivity. Science. 2000;290:785–788. doi: 10.1126/science.290.5492.785. [DOI] [PubMed] [Google Scholar]
- 33.Daniel E, Weber G. Cooperative effects in binding by bovine serum albumin. I. The binding of 1-anilino-8-naphthalene-sulfonate. Fluorimetric transitions, Cooperative Effects in Binding by Albumin. Biochem. 1966;5:1893–1900. doi: 10.1021/bi00870a016. [DOI] [PubMed] [Google Scholar]
- 34.Ni F, Cotton TM. Chemical procedure for preparing surface-enhanced Raman scattering active silver films. Anal Chem. 1986;58:3159–3163. doi: 10.1021/ac00127a053. [DOI] [PubMed] [Google Scholar]
- 35.Lakowicz JR, Shen Y, D’Auria S, Malicka J, Fang J, Gryczynski Z, Gryczynski I. Radiative decay engineering 2: Effects of silver island films on fluorescence intensity, lifetimes and resonance energy transfer. Anal Biochem. 2002;301:261–277. doi: 10.1006/abio.2001.5503. [DOI] [PMC free article] [PubMed] [Google Scholar]
- 36.Lakowicz JR, Maliwal BP. Construction and performance of a variable-frequency phase modulation fluorometer. Biophys Chem. 1985;21:61–78. doi: 10.1016/0301-4622(85)85007-9. [DOI] [PubMed] [Google Scholar]
- 37.Laczko G, Gryczynski I, Gryczynski Z, Wiczk W, Malak H, Lakowicz JR. A10-GHz frequency-domain fluorometer. Rev Sci Instrum. 1990;61:2331–2337. [Google Scholar]
- 38.Lakowicz JR, Laczko G, Cherek H, Gratton E, Limkeman M. Analysis of fluorescence decay kinetics from variable- frequency phase shift and modulation data. Biophys J. 1994;46:463–477. doi: 10.1016/S0006-3495(84)84043-6. [DOI] [PMC free article] [PubMed] [Google Scholar]
- 39.Grinvald A, Haas E, Steinberg IZ. Evaluation of the distribution of distances between energy donors and acceptors by fluorescence decay. Proc Natl Acad Sci USA. 1972;69:2273–2277. doi: 10.1073/pnas.69.8.2273. [DOI] [PMC free article] [PubMed] [Google Scholar]
- 40.Cheung HC, Wang CK, Gryczynski I, Wiczk W, Laczko G, Johnson ML, Lakowicz JR. Distance distributions and anisotropy decays of troponin C and its complex with troponin I. Biochemistry. 1991;30:5238–5247. doi: 10.1021/bi00235a018. [DOI] [PMC free article] [PubMed] [Google Scholar]
- 41.Lakowicz JR. Principles of Fluorescence Spectroscopy. 2. Kluwer Academic/Plenum Publishers; New York: 1999. p. 698. [Google Scholar]
- 42.Lakowicz JR. Radiative decay engineering: biophysical and biomedical applications. Anal Biochem. 2001;298:1–24. doi: 10.1006/abio.2001.5377. [DOI] [PMC free article] [PubMed] [Google Scholar]
- 43.Axelrod D, Hellen EH, Fulbright RM. Total internal reflection fluorescence. In: Lakowicz JR, editor. Topics in Fluorescence Spectroscopy, vol. 3: Biochemical Applications. Plenum Press; New York: 1992. pp. 289–343. [Google Scholar]
- 44.Selvin PR. Lanthanide-based resonance energy transfer. J Sel Top Quantum Electron. 1996;2(4):1077–1087. [Google Scholar]
- 45.Schobel U, Egelhaaf HJ, Brecht A, Oelkrug D, Gauglitz G. New donor–acceptor pair for fluorescent immunoassays by energy transfer. Bioconjug Chem. 1999;10:1107–1114. doi: 10.1021/bc990073b. [DOI] [PubMed] [Google Scholar]


