

Abstract
Using single-molecule force spectroscopy, we investigated the effect of single point mutations on the energy landscape and unfolding pathways of the transmembrane protein bacteriorhodopsin. We show that the unfolding energy barriers in the energy landscape of the membrane protein followed a simple two-state behavior and represent a manifestation of many converging unfolding pathways. Although the unfolding pathways of wild-type and mutant bacteriorhodopsin did not change, indicating the presence of same ensemble of structural unfolding intermediates, the free energies of the rate-limiting transition states of the bacteriorhodopsin mutants decreased as the distance of those transition states to the folded intermediate states decreased. Thus, all mutants exhibited Hammond behavior and a change in the free energies of the intermediates along the unfolding reaction coordinate and, consequently, their relative occupancies. This is the first experimental proof showing that point mutations can reshape the free energy landscape of a membrane protein and force single proteins to populate certain unfolding pathways over others.
Keywords: atomic force microscopy, energy landscape, Hammond effect, single-molecule force spectroscopy, transition states
Introduction
Protein folding remains one of the major challenges in molecular biology,1–5 as it is central to structure prediction, protein design and for understanding the etiology of many diseases. For example, a number of proteins are known to misfold and misassemble in diseases such as Alzheimer's, Parkinson's, and Creutzfeldt–Jakob to mention a few.6,7 Misfolding of membrane proteins is also a major factor in diseases such as cystic fibrosis.8 To understand understand these processes, it is necessary to understand the underlying physical driving forces. It is, therefore, crucial to explore how intra- and intermolecular interactions act on and within a protein.
The sensitivity of single-molecule force spectroscopy (SMFS) based on the atomic force microscope (AFM) provides a unique opportunity to study membrane protein (un)folding under an applied force in the native lipid bilayer with piconewton sensitivity and subnanometer resolution.9 The forced unfolding of membrane proteins tethered to an AFM cantilever stylus is, however, directional, and occurs via sequential unfolding steps of well-defined structural segments composed of hydrophilic interhelical loops, transmembrane α-helices or α-helical pairs. Each such structural segment has a certain probability of unfolding individually or together with adjacent segments. The unfolding pathway of a membrane protein describes the sequence of unfolding steps taken from the functional folded state to the fully unfolded polypeptide. Since each unfolding step has a certain probability to be taken, this is also the case for the unfolding pathway.9 Experiments on bacteriorhodopsin (BR),10,11 NhaA12 and bovine rhodopsin13,14 have shown that small changes in the environment can alter interactions stabilizing the structural segments within membrane proteins. We have recently shown that inter- and intramolecular interactions contribute differently towards stabilizing these structural segments. For example, changing the oligomeric assembly10 or shifting the temperature within physiological relevant range11 changed the interactions stabilizing the structural segments but not the positions of these structural segments in BR. Interactions acting on individual structural segments within the protein alter the probability of the protein to choose certain unfolding pathways. Thus, SMFS can elucidate how major (occurring with a higher probability) and minor (occurring with a lower probability) unfolding pathways are populated under different conditions.
The influence of alanine substitutions on the structure and thermodynamic stability of BR has been examined in detergent solution.15 In these experiments, unfolding was induced by increasing SDS concentration in a micellar environment rather than pulling. Mutants were found that increased, decreased or had no effect on thermodynamic stability. The most destabilizing mutation, Y57A, altered the unfolding free energy, ΔΔGu, by−3.7±0.5 kcal/mol.15 M56A, on the other hand, was found to be the most stabilizing mutation (ΔΔGu = 1.4±0.1 kcal/mol). The stabilization by M56Awas not accompanied by major structural alterations. A number of proline residues at transmembrane α-helix kinks were also replaced by alanine.16 P50A had no effect on stability, whereas P91A and P186Awere found to be somewhat destabilizing with associated changes in ΔΔGu of −1.3±0.3 and −0.9±0.1 kcal/mol, respectively. None of the proline substitutions altered the structure of the proteins beyond local adjustments near the kinks.15,16 Figure 1 shows the positions of the five mutations, P50A, M56A, Y57A in transmembrane α-helix B, P91A in α-helix C, and P186A in α-helix F of BR.
Fig. 1.

Mapping the point mutations on the BR trimer. (a) Top view from the extracellular surface emphasizes that none of the mutations were at the monomeric interface within the BR trimer (PDB code 1BRR),17 which may affect the integrity of the BR assembly.10 (b) BR monomer showing the mutations P50A (red), M56A (blue), Y57A (green) in α-helix B (yellow), P91A (orange) in α-helix C (purple), and P186A (cyan) in α-helix F (red). Values in blue denote amino acid positions at which the major force peaks, i.e., peaks occurring with 100% frequency, were detected in the force-distance (F–D) curve. Values in brackets are amino acid positions from the C-terminal, i.e., the direction of pulling by SMFS.
In this work we examine how the mutations affect unfolding of BR in response to mechanical pulling. We investigate how molecular interactions between and within structural segments of BR are changed by mutating an amino acid, and whether the mutations lead to the addition or deletion of structural segments establishing the energy barriers. Using dynamic single-molecule force spectroscopy (DFS) we have characterized the distance of the transition states from the energy minima of the folded states and the associated changes in the heights of energy barriers of the structural segments in the mutants. Results from SMFS and DFS allowed us to reconstruct complete unfolding pathways of the BR mutants, and identify the influence of mutations on the underlying energy landscapes.
Results
Wild-type and mutant BR choose among identical unfolding intermediates
Single BR molecules embedded in native purple membrane were unfolded using SMFS by pulling their C-terminus with a certain velocity.18,19 All BR mutants were unfolded under identical experimental conditions as for unfolding wild-type (WT) BR by SMFS. The stretching and unfolding of a single BR gives rise to the so-called force–distance (F–D) curve with a characteristic sequence of force peaks. The superimposition of F–D spectra (Fig. 2a and Fig 3) strongly enhanced the unfolding peaks occurring with a high probability.19 However, individual F–D curves showed that the major force peaks could exhibit side peaks (Fig. 2c). The amplitude of a force peak in the F–D spectra denoted the force required to mechanically unfold the structural segments, whereas the distance between two force peaks represented stretching of the unfolded polypeptide chain of the preceding structural segments (Fig. 2). The side peaks indicated that a structural segment could unfold not only in one major step but also via alternative pathways. For example, α-helix B could unfold in two ways.20 Preceding the unfolding of α-helix B, either α-helix C and loop BC could unfold individually or α-helix C and loop BC could unfold together in one step (Fig. 2d). All the possible structural segments that were detected previously during the unfolding of WT BR are depicted in Fig. 2.19 These structural segments, when mapped onto the secondary structure of BR, highlight the interactions that have been established within the membrane protein (Fig. 2b).
Fig. 2.

Unfolding pathways of WT and mutant BR. (a) Superimposition of 43 F–D curves of mutant P50A collected at 600 nm/s (same as Fig. 3B). Force peaks with highest density fitted with the WLC model (dark blue curves) at amino acid positions 88, 148 and 219 form the main peaks in the unfolding pathways. F–D curves can show side peaks at a much lower probability (<20%) some of which are masked by the noise in the superimposition. WLC fits to these peaks are shown in light purple. A closer look at individual F–D curves in the superimposition (areas in colored boxes) reveals these side peaks. (b) Secondary structure of BR showing all the intermediates that occurred in different BR unfolding pathways detected by SMFS. Transmembrane α-helices outlined in colored boxes denote secondary structure elements that unfolded pairwise. The structural segments that formed the alternate unfolding pathways of α-helices are shown by the different color shades of the helices. (c) Shows individual peaks in F–D curves fitted by the WLC model denoting different unfolding pathways via which P50A could unfold.19 Values at the top of each WLC fit denote the amino acid positions in the secondary structure of BR shown in (b). The distance between two subsequent peaks denotes the length of the structural segment. The combination of different force peaks detected in an F–D curve constitutes the unfolding pathway of the protein. All possible pathways observed in WT BR were also detected for BR mutants. (d) Denotes the structural segments stabilized by the molecular interactions as detected by the force peaks in (c). Black arrows denote secondary structure elements that unfolded as a pair. These structures could also unfold via alternative pathways as shown by differently colored arrows. Unfolding intermediates for WT and all mutants BR remained the same. Color coding of boxes in (a) corresponds to that in (b) and (c). Color coding of the structural segments in (b) corresponds to that of force peaks in (c) and to that of the arrows denoting the unfolding of different structural segments in (d).
Fig. 3.

Superimpositions of F–D traces recorded upon unfolding WT and mutant BR using SMFS. The superimposition of F–D traces (a–f) enhances similarities among the unfolding patterns detected upon unfolding single BR. The superimpositions were fitted with the WLC model to show the occurrence of main peaks at the same positions in each case. No shift in the peak positions was noticed (Supplementary Fig. 2). The gray scales allowed to statistically interpret the gray values of the superimpositions. All F–D traces superimposed were collected at a speed of 600 nm/s. To show the peaks clearly, only 43 curves were superimposed in each case. The number of curves analyzed at this speed for each BR type was: 165 (WT BR), 102 (P50A), 114 (M56A), 80 (Y57A), 117 (P91A), 74 (P186A).
Since the peak position in an F–D spectrum reflects the structural segments in the membrane protein at which interactions occurred and the force of a peak the strength of those interactions,13,19 as a first step of our analyses we analyzed the force and the position of every force peak detected in every F–D curve recorded upon unfolding a given BR mutant. If a mutation induced sufficiently high changes in interactions within BR, it was expected to manifest itself as a change, addition or deletion, of one or several force peaks in the F–D curve.12,21 Although local changes in molecular interactions in four BR mutants, P50A, P91A, P186A and M56A, have been suggested based on their X-ray structures,16 the superimposition of F–D curves recorded upon unfolding the mutants showed no additional or missing force peaks (Fig. 3). A comparison of peak position values from the WT and the mutants showed that all structural segments establishing the unfolding intermediates for the mutated BR remained the same as for WT BR (Fig. 3, Supplementary Fig. 2).
DFS of BR mutants
DFS using AFM involves unfolding a protein at different pulling speeds.22 A plot of force versus loge (loading rate) gives the most prominent energy barriers in the energy landscape along the direction of the applied force.23 Recently, DFS measurements on WT BR were performed to obtain positions of the transition-state barriers from the folded states, xu, and unfolding rates, ku, of structural segments such as α-helices and polypeptide loops.18,24 Here, we performed DFS on five BR mutants, P50A, P91A, P186A, M56A and Y57A, to obtain a map of their energy landscapes. The unfolding forces of the structural segments of every mutant were determined at six different pulling speeds, 87.2, 300, 600, 1310, 2620 and 5230 nm/s. As expected, the average unfolding forces of these segments increased with increasing pulling speed (Fig. 4, Supplementary Fig. 1).18,25
Fig. 4.

DFS of BR mutants. All five BR mutants were unfolded at six different speeds: 87.2, 300, 600, 1310, 2620 and 5230 nm/s. The slope of a semilogarithmic plot of the unfolding force versus loading rate gave the xu and ku values for each structural segment forming an intermediate in the unfolding pathway. As shown (a–f), the slopes of some structural segments in mutants P50A (red), M56A (blue) and Y57A (green) remained the same when compared to WT BR (black), whereas some structural segments showed an intersection denoting a crossover in their stabilities at a specific loading rate. α-Helix B could unfold through three different pathways denoted as loop BC and α-helix B, α-helix B-1, and α-helix B-2 (Fig. 2). (d) to (f) show the unfolding forces in each of these pathways for all the mutants. α-Helix B in P50A unfolded with higher forces (red points in d–f) at all the speeds. For clarity, the unfolding forces of P91A and P186A are not shown. xu and ku values for all the mutants are given in Table 1. Data points are average values of unfolding forces, and the error bars represent the SEM. The SEM values for all the mutants were similar to that shown for P50A.
Albeit the change in unfolding forces was not drastic for all structural segments, certain mutants caused detectable changes in interactions stabilizing α-helix B (Fig. 4b, d, e and f), and α-helices E and D (Fig. 4a). BR with the P50A mutation, located in the middle of α-helix B, required higher unfolding forces for two structural segments established by transmembrane α-helix B, α-helix B-1 (P<.05 from Student's t test) (Fig. 4e) and α-helix B-2 (P<0.05 from Student's t test) (Fig. 4f), as compared to WT BR. Also, unfolding of α-helix B together with loop BC in one step in mutant P50A required slightly higher unfolding forces compared to WT BR (Fig. 4d). However, such a uniform change in unfolding forces was not observed if α-helices B and C unfolded together with their connecting loop BC (Fig. 4b). On the contrary, a crossover in the stability of α-helices B and C of P50A was observed depending on the loading rate. Below a loading rate of 1000 pN/s α-helices B and C in P50A showed decreased mechanical stability, and above this loading rate the stability increased compared to WT BR. This crossover in stability at different loading rates suggests a load-dependent change in stability. In case of mutant M56A, almost every structural segment of the BR molecule required slightly higher unfolding forces compared to WT BR. However, in some cases this apparent systematic increase in stability remained within the error (standard error of the mean, SEM) of the measurements. A crossover in the stability of structural segments constituted by α-helices B and C, loop BC and α-helix B, α-helix B 1, and α-helix B 2 was also observed for M56A (Fig. 4b, d, e, and f). The loading rate at which the crossover occurred, however, differed in each case. Again, for mutant Y57A we observed a crossover point for the structural segments made up of α-helices E and D, α-helices B and C, loop BC and α-helix B, α-helix B-1, and α-helix B-2, and the stability switched depending on the loading rates (Fig. 4a, b, d, e and f). It is important to mention that the mutations P50A, M56A and Y57Awere located in the aforementioned structural segments except the one constituted by α-helices E and D. However, for the structural segments not hosting the mutations we also observed a loading-rate-dependent crossover in the stability (Supplementary Fig. 1).
The semilogarithmic plots of unfolding force versus loading rate (Fig. 4) allowed the determination of xu and ku values for each structural segment (Table 1). In most cases the xu and ku values did not show sufficiently high changes to be significant. However, some of the mutations significantly changed the xu or ku values for the mutation containing structural segment or for other structural segments (Table 1). In a previous work on BR, we have shown that such small changes of the force slopes can indeed be reproduced by SMFS.18 In some cases, the position of energy barrier of a structural segment of mutant BR (e.g., Y57A) was more than two times larger compared to that of WT BR. Other mutations (e.g., P50A, P91A or P186A) reduced the barrier position of a structural segment by almost 50%. The xu values for unfolding α-helix B in one of the pathways of WT BR was 0.48±0.07 nm (±SD) and that of M56Awas 0.34±0.03 nm. It is interesting to note that M56A is in α-helix B. The xu value for unfolding α-helix C in WT BR was 0.47±0.04 nm as compared to 0.33±0.05 nm in P91A; for unfolding of α-helix C with loop BC, the value in WT BR was 0.38±0.09 nm, whereas in P91A it was 0.63± 0.13 nm. Again, it is worth mentioning that P91A lies in α-helix C. This trend was seen again for mutants P50A and M56A for the paired unfolding of α-helices B and C. The xu value for this structural segment in P50A was 0.34±0.06 nm and 0.39±0.04 nm in M56A, whereas in WT BR the value was 0.69±0.18 nm. Apparently, there was no systematic rule to determine the extent a point mutation could influence the energy barrier established by the structural segment hosting the mutation.
Table 1.
Positions of energy barriers (xu) and the unfolding rates (ku) from DFS
| WT | P50A | M56A | Y57A | P91A | P186A | WT | P50A | M56A | Y57A | P91A | P186A | |
|---|---|---|---|---|---|---|---|---|---|---|---|---|
| ΔΔGu (kcal/mol) | 0.1 | 1.4 | −3.7 | −1.3 | −0.9 | |||||||
| Structural segments | xu±SD (nm) | ku±SD (s−1) | ||||||||||
| Helices E and D | 0.33±0.02 | 0.32±0.04 | 0.26±0.02 | 0.52±0.1 | 0.4±0.1 | 0.38±0.05 | 9.8±7.4×10⁻³ | 2.2±2.8×10⁻² | 5.5±3.5×10⁻² | 9.3±33.1×10 6 | 1±3.4×10⁻³ | 1.2±2.2×10⁻³ |
| Helix E | 0.44±0.07 | 0.52±0.09 | 0.33±0.03 | 0.6±0.15 | 0.29±0.04 | 0.44±0.06 | 2.3± 5.3×10⁻⁴ | 2.8±8×10⁻⁵ | 9.2±8.1×10⁻³ | 1.3±6.9×10⁻⁶ | 4.3±5.2×10⁻² | 2.1±4.7×10⁻⁴ |
| Helix D, pathway 1 | 0.58±0.19 | 0.53±0.12 | 0.37±0.03 | 0.4±0.07 | 0.32±0.06 | 0.35±0.05 | 2.1±9.4×10⁻⁴ | 7.8±23.5×10⁻⁴ | 4.4±2.7×10⁻² | 3.3±5.5×10⁻² | 1.9±2.6×10⁻¹ | 7±9.4×10⁻² |
| Helix D, pathway 2 | 0.36±0.07 | 0.63±0.1 | 0.27±0.04 | 0.38±0.07 | 0.28±0.05 | 0.31±0.04 | 1.1±1.8×10⁻¹ | 7.3±19.1×10⁻⁵ | 4.1±4.3×10⁻¹ | 4.4±7.1×10⁻² | 3.0±3.6×10⁻¹ | 1.5±1.5×10⁻¹ |
| Helices B and C | 0.69±0.18 | 0.34±0.06 | 0.39±0.04 | 0.52±0.12 | 0.57±0.08 | 0.4±0.1 | 4.2±13.6×10⁻⁴ | 1.9±2.2×10⁻¹ | 3.8±3.8×10⁻² | 4.2±10.5×10⁻³ | 1.1±1.9×10⁻³ | 4.6±9.8×10⁻² |
| Helix C, pathway 1 | 0.39±0.05 | 0.58±0.29 | 0.46±0.06 | 0.48±0.15 | 0.5±0.06 | 0.34±0.04 | 5.9±5.1×10⁻² | 6.1±41×10−4 | 1.1±1.6×10⁻² | 1.5±4.6×10⁻² | 3.8±4.8×10⁻³ | 1.4±1.2×10⁻¹ |
| Helix C, pathway 2 | 0.47±0.04 | 0.7±0.24 | 0.46±0.06 | 0.77±0.37 | 0.33±0.05 | 0.7±0.11 | 8.9±6.8×10⁻³ | 2±9.9×10⁻⁴ | 1.6±1.9×10⁻² | 4±31.5×10⁻⁵ | 3±3.2×10⁻¹ | 1.8 ±4×10⁻⁴ |
| Helix C and loop BC | 0.38± 0.09 | 0.61±0.22 | 0.37±0.04 | 1.03±0.34 | 0.63±0.13 | 0.35±0.03 | 7.3±13.4×10⁻² | 3.7±18.7×10⁻⁴ | 13.1±10×10−2 | 3.6±27.8×10⁻⁸ | 1.8±5.4×10⁻⁴ | 1.4±0.9×10⁻¹ |
| Loop BC and helix | 0.37±0.04 | 0.64±0.37 | 0.51±0.03 | 0.66±0.57 | 0.41±0.08 | 0.36±0.06 | 9.1±7.7×10⁻² | 1.8±17.6×10⁻⁵ | 10.3±8.7×10⁻⁴ | 1.6±20.1×10⁻⁴ | 2.2±4.1×10⁻² | 7.8 ±9.8×10⁻² |
| Loop BC | 0.61±0.18 | 0.57±0.11 | 0.43±0.04 | 0.47±0.21 | 0.34±0.06 | 0.67±0.13 | 1.4±4.6×10⁻³ | 3.6±8.1×10⁻³ | 4.2±3.8×10⁻² | 2.1±8.5×10⁻² | 3.1±3.4×10⁻¹ | 3.7±9.7×10⁻⁴ |
| Helix B, pathway 1 | 0.48±0.07 | 0.43±0.07 | 0.34±0.03 | 0.65±0.1 | 0.44±0.07 | 0.4±0.06 | 6.6±6.8×10⁻² | 1.3±2.2×10⁻² | 2.1±1.2×10⁻¹ | 1.9±3.4×10⁻³ | 7.2±9.6×10⁻² | 8±9.3×10⁻² |
| Helix B, pathway 2 | 0.55±0.09 | 0.59±0.09 | 0.52±0.08 | 0.37±0.07 | 0.39±0.05 | 0.91±0.29 | 1.9± 2.7×10⁻² | 8.4±16.3×10⁻⁴ | 7.6±12.5×10⁻³ | 2±2.7×10⁻¹ | 1.4±1.3×10⁻¹ | 3.7±21.6×10⁻⁶ |
| Helix A | 0.68±0.1 | 0.75±0.14 | 0.52±0.05 | 0.68±0.14 | 0.57±0.08 | 0.58±0.08 | 1.9± 3.6×10⁻⁴ | 7.6±21.1×10⁻⁵ | 3.6±3.8×10⁻³ | 3.2 ±8.6×10⁻⁴ | 1.9±3.1×10⁻³ | 1.5±2.6×10⁻³ |
xu and ku values for all BR mutants are compared to those of WT BR. The criteria chosen for determining if there was a significant difference in the xu and ku values was as follows. For the xu values, we determined if these were within the standard errors of each other. We considered a difference in the ku for a structural segment only if the rates were at least two orders of magnitude different between mutant and WT BR. In all, 14 structural segments showed different xu values, and 23 showed different ku values in all the mutants on comparing to WT. Of the 14 structural segments that showed a difference in xu, 12 structural segments (~86%) also showed a change in ku. xu and ku values that showed a significant difference are highlighted in bold.
Although changes in the slopes could be observed for many structural segments in the mutants (Fig. 4, Supplementary Fig. 1), these were independent of the segment in which the mutation was inserted. Thus the mutations could influence the transition barrier positions of structural segments in which they were not located (Table 1). For example, the xu value for the paired unfolding of α-helices E and D in mutant M56A was 0.26±0.02 and 0.52±0.1 nm in Y57A as compared to 0.33±0.02 nm in WT BR. A change in the positions of energy barriers of α-helices E and D induced bymutationsM56Aor Y57Alocated in α-helix B may suggest a possible contribution of long-range interactions. Also, the xu for unfolding of α-helix C with loop BC in Y57A was 1.03±0.34 nm, whereas it was 0.38±0.09 nm in WT BR.
In some cases, the mutations changed the barrier position of a structural segment unfolding via one pathway but not via the other. For example, mutation M56A increased the distance between the unfolding transition barrier and the folded intermediate state of the structural segment formed by α-helix B and loop BC, but not the distance of the barriers of α-helix B alone. The dependency of the unfolding energy barriers on the unfolding pathway was also observed for mutant Y57A, which increased the distance of the unfolding transition barrier of α-helix B in unfolding pathway 1 but not in pathway 2 (Table 1). Thus, at first glance the data reveal that the point mutations inserted in a certain α-helix can have an effect on the energy barrier not only of that helix but also on other regions of the membrane protein that are not in direct contact with the mutant side chain.
The unfolding rates determined for the structural regions of BR changed significantly for a mutant. Such changes could either increase or decrease the unfolding rates of structural segments forming the energy barriers. As for the positions of energy barriers, some mutations had a great influence on the unfolding rates of structural segments in which they were not directly located. For example, mutant Y57A, structurally located in α-helix B, showed the greatest influence on the unfolding rate of α-helix C and loop BC together. P50A, also located in α-helix B, affected the kinetic stability of α-helix D. To be certain about the difference and similarity in the values of xu and ku for WT and mutant BR, we repeated the DFS experiments after 3 months on the mutants M56A, Y57A and P186A at three widely separated speeds. The xu and ku values determined independently from these measurements (data not shown) agreed well within errors with the values of the mutants reported (Table 1).
Transition states of BR mutants exhibit Hammond behavior
According to the Hammond postulate, if the energy difference between the transition and folded states is reduced by mutations the two states approach each other on the reaction coordinate.26 This principle from physical organic chemistry was first shown experimentally by Fersht and coworkers for protein folding transition states in the small ribonuclease barnase.27,28 However, for membrane proteins this principle has not been shown yet. ku obtained from DFS was used to estimate the free energy difference, ΔGu*, between the folded and the transition states of a structural segment. With this we could reconstruct a section through the energy landscape for barriers of WT and mutant BR. Figure 5a gives an example of such an energy profile of α-helices B and C along an unfolding path. The activation energy of α-helices B and C was the maximum for WT BR. Also, the highest point on the energy profile moved with decreasing distance between the energy minimum and the transition-state barrier. Thus, the transition states of α-helices B and C in the mutants exhibited a clear Hammond behavior. A remarkable correlation between xu and ln(ku) was found for all the structural segments in WT and mutant BR. Figure 5b depicts a plot of Δxu/xu_WT versus Δln(ku)/ln(ku_WT), where Δxu=xu_Mutant−xu_WT and Δln(ku)=ln(ku_Mutant)−ln(ku_WT) for the structural segments constituted by α-helices B and C. The slope of this plot is 0.6, implying that with increasing barrier height ΔGu* (i.e., lower ku) the distance of the transition from the folded state becomes longer along the pulling coordinate. This linearity between xu and ln(ku) was also observed for other structural segments of WT and mutant BR, although the behavior was not predictable (Fig. 6). However, these results imply that irrespective of the point mutant, ΔGu* changes proportionally with a change in xu. Previously, a similar relationship between xu and ΔGu* was reported for force measurements on single DNA molecules29 and single antibody–antigen complexes.30
Fig. 5.

Free energy diagram for the mechanical unfolding of α-helices B and C in WT and mutant BR. (a) The scheme was calculated from SMFS experiments described in the text. Free energies were calculated from the unfolding rate constants obtained from the DFS data. xu was determined as described in Materials and Methods. We have assumed that the total distance between the energy minima of the folded (left) and unfolded stretched states (right) represents the length of the fully stretched polypeptide chain of α-helices B and C, ~71 amino acids (0.36 nm×71= 25.56 nm). In addition, we have assumed that all the intermediate states have a common origin. As shown, the positions of the transition states for P50A, P91A, P186A, M56A and Y57Awere significantly shifted towards the folded state of α-helices B and C. All the mutations decreased the heights of the unfolding energy barriers. (b) Quantitative relation between the shift of energy barriers and the decrease in kinetic stabilities.
Fig. 6.

Hammond behavior of structural segments of WT and mutant BR. The plots of Δxu/(xu–WT) versus Δln(ku)/ln(ku–WT) show that in all the structural segments of the mutants xu increased with increasing activation energy. However, the trend followed by a structural segment of a mutant in one pathway was not the same in another pathway.
Preferred unfolding pathways differ for WT and mutant BR
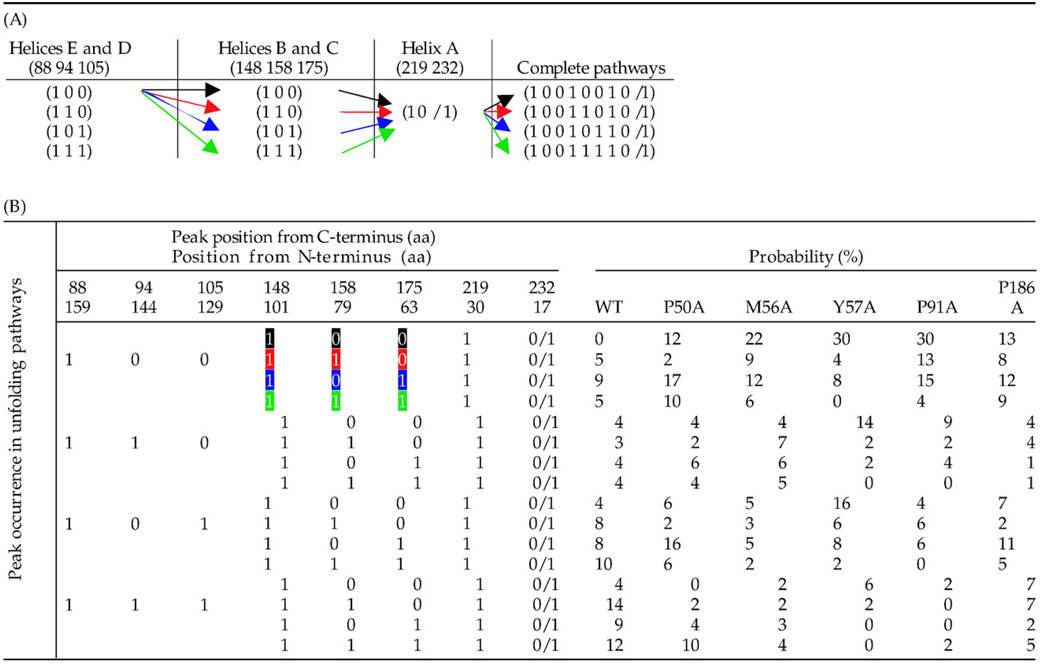
From the force peaks reproducibly detected in all F–D curves it was possible to construct the unfolding pathways of an individual BR molecule (α-helix E to A) (Table 2A). The unfolding pathways and their probabilities determined at all unfolding speeds showed a remarkable difference between WT BR and the five mutants. A comparison of the unfolding pathways and their probabilities between WT and mutant BR at 87.2 nm/s is given in Table 2B. Statistical analyses of all possible unfolding pathways of BR showed the existence of a major pathway and an exponentially decreasing distribution of all other pathways. It became evident that the BR mutants did not unfold via all the pathways occurring during WT BR unfolding. For example, a new pathway, 10010010 (see Materials and Methods), in which α-helices E and D, and B and C unfolded pairwise, and α-helix A in a single step, occurred with a high probability in all the mutants but was absent in WT BR. Removal of kink-inducing prolines, as in P50A, P91A and P186A, and other side-chain deletions as in M56A and Y57A, apparently had a considerable effect on the unfolding pathways of BR. Table 2 shows that, whereas several unfolding pathways were missing for the mutants, they could also unfold via new alternative pathways. Overall, these results suggest that the mutations altered the transition barrier heights in the unfolding energy landscape such that certain unfolding pathways were observed more or less frequently than others.
Table 2.
Probability of unfolding pathways of WT and mutant BR
|
(A) Independent unfolding of α-helices E and D, B and C, and α-helix A can be divided in different small pathways. Numbers 88, 94, 105 denote the peak positions in amino acids. ‘1’ denotes the presence of a peak in the F–D curve and hence the unfolding of the structural segment corresponding to the peak in the unfolding pathway. ‘9’ denotes a missing peak and the absence of a structural segment in the unfolding pathway. All possible combinations of these partial pathways give rise to complete unfolding pathways (B). α-Helix A could unfold independently followed by N-terminus (1 1), or in one step with N-terminus (1 0). For simplicity, we pooled these two pathways in a single pathway (1 0/1). (B) All complete unfolding pathways are shown with their occurrence probabilities. The probability occurrence of the unfolding pathways changed for all the mutants as compared to WT BR. A comparison of the occurrence probabilities between the mutant and WT BR is shown for a pulling speed of 87.2 nm/s. Due to changes in intramolecular interactions (Table 1), these probabilities could vary considerably for certain unfolding pathways. It is important to mention that the presence of a force peak at the same position does not necessarily denote identical unfolding events. For example, the appearance of the force peak at amino acid position 88 followed by a peak at position 148 denotes the unfolding of α-helices E and D together constituting one pathway, whereas a peak at position 88 followed by a peak at position 105 denotes the unfolding of α-helix E alone, thus constituting a different pathway (see Fig. 2). This combination of stochastic unfolding events gives rise to different unfolding pathways the probability of which decrease in an exponential manner. The number of curves analyzed at 87.2 nm/s for different BR types were 79 (WT BR), 52 (P50A), 96 (M56A), 50 (Y57A), 46 (P91A), 75 (P186A). The colored arrows in (A) correspond to the highlighted peaks in (B).
Discussion
DFS measurements were performed to determine the effect of five mutations on the transition barrier positions and kinetic rates characterizing the energy barriers of BR. Given the outstanding sensitivity and precision of SMFS to detect forces at piconewton resolution and to locate these forces at nanometer precision, one of the goals of this study was to detect local changes of interactions in the BR mutants. Such changes may be manifested in the mechanical stability of the mutation-containing helix or of other helices and polypeptide loops. Therefore, we analyzed the unfolding forces of the structural segments of the BR mutants. Additionally, we analyzed the unfolding pathways and determined the probability of each unfolding pathway taken by WT and mutant BR. The results were compared to the BR mutant structures and thermodynamic stabilities from chemical unfolding.15,16
Mutations alter interactions stabilizing structural segments of BR
All the structural segments in WT BR were also detected in the mutants (Fig. 2). Apparently, none of the point mutations introduced a new structural segment in mutant BR. Moreover, the SMFS data revealed that in many cases the forces required to unfold structural segments of WT and mutant BR were scattered within the errors (Fig. 4). These observations suggest that in these cases the changes in interactions that may have occurred upon insertion of a point mutation were too small to be detected by SMFS. However, compared to WT BR, some mutants showed a clear change in the average unfolding forces of certain structural segments. Introduction of a mutation could either increase or decrease the stability of structural regions within BR. From the unfolding forces it is, therefore, difficult to draw a straightforward conclusion on how the mutations changed the interactions stabilizing the BR molecule.
So far, applied to membrane proteins, SMFS detects forces that reflect interactions stabilizing individual structural segments and not the global stability of the membrane protein. Such a global stability may rather be reflected by the force required to unfold water-soluble proteins, which, when compared to similar experimental setups, unfold cooperatively, indicating a two-state behavior. 31 For water-soluble proteins it was indeed demonstrated that SMFS is sensitive enough to detect stability changes induced by point mutations. 32 In apparent agreement, the thermodynamic stability measured by thermal and chemical unfolding experiments may rather reflect the global properties of a protein, and do not enable the direct detection and location of altered interactions within the protein structure.15,33 However, previous results on IgG suggest that this thermodynamic stability may not be an indication of the mechanical stability of a protein and vice versa.34 A similar scenario could be suggested for the BR mutants in this study since SDS denaturation experiments of these mutants showed a clear change in the unfolding free energies.15,16
Mutations change energy barriers of unfolding energy landscape
As determined by DFS, a point mutant could increase, decrease or not change the barrier position and the unfolding rate of a structural segment in which it was inserted. In some cases, the point mutation (e.g., P50A) could change both the position and the unfolding rate, suggesting that it significantly altered the energy barrier of its structural segment. We consider such a change of the energy barrier of the structural segment hosting the mutant as being ‘localized.’ Additionally, some point mutations (e.g., Y57A, P91A, or P186A) could significantly affect structural segments not hosting the mutation. Such changes may be due to cooperative interactions within the membrane protein.
Besides the differences highlighted in Table 1, we noticed small changes in xu and ku for other structural segments on comparing WT BR and BR mutants. Although it could be speculated that these small differences in xu and ku could be real, technical limitations do not allow interpreting small differences unambiguously. However, in some cases xu differed by as much as 60%. While in three of five cases the mutation hosting structural segments increased their kinetic stability, ~45% of the remaining structural segments were stabilized by the mutations. Thus, DFS detected ‘localized’ (short range) and ‘global’ (long range) changes of interactions caused by point mutations within the membrane protein. However, we point out that our DFS measurements may have only detected sufficiently large changes of the energy barriers in the energy landscape. Technological developments allowing for better force resolution may in the future enable the detection of more subtle changes caused by point mutations within membrane proteins.
Mutant proteins favor certain unfolding pathways thereby contouring different areas of the energy landscape
An unfolding pathway of a protein represents the entire route taken on the energy landscape while forcing the protein from the folded to the denatured conformation. Protein unfolding is a stochastic process with the probability of major and side peaks occurring in all possible combinations (Table 2) denoting the coexistence of different unfolding pathways (Fig. 2d and Fig 7). A clear change in the probabilities of unfolding pathways of WT BR and the mutated membrane protein was observed (Table 2). But how do subtle changes in the protein structure influence the unfolding behavior of the entire membrane protein? A protein is stabilized by an ensemble of different interactions in a dynamic energy landscape. Mutations may disturb this dynamic balance of interactions as shown by the apparent change in the energy barrier positions and unfolding rates of the mutant hosting or other segments (Table 1), thus forcing the protein to chart out different regions of its energy landscape (Fig. 7).
Fig. 7.

Changes induced in the mechanical unfolding energy landscape of BR due to point mutations. A schematic representation of the energy landscape showing the crinkled minima denoted by roughness scale ε. The energetically similar minima in the energy landscape give rise to an ensemble of native or intermediate structures. Small perturbations in the protein due to a single mutation may change the relative populations of these native structures or unfolding intermediates forcing the protein to unfold via different energetic pathways (red and green arrows).
The difference in the energy barriers of the various structural segments suggests that unfolding is a statistical process and depends on the transition barrier heights of the structural segments. Hence, if an unfolding pathway is energetically more favorable it will be preferred for a particular protein. Our results suggest that the unfolding of mutants is a nonrobust process where mutations can stabilize or destabilize an intermediate and force a different intermediate to be populated. Alternatively, the mutations may alter the energy barrier heights of the unfolding intermediates such that certain intermediates are more or less likely to be detected with the current experimental setup. In such a scenario, the intermediates whose transition energy barriers are lowered more by the mutations are likely to be detected more frequently than other intermediates.
Taking into account that the difference in thermodynamic stabilities between the WT and the mutant proteins is due to changes in interactions, it is safe to speculate from our results that, in some cases, the populations of major unfolding pathways change with a change in the ΔGu or ΔGu* of the mutants. However, for P50A, which exhibits a thermodynamic stability similar to that of WT, a change in occurrence probabilities of unfolding pathways was still noticed, suggesting a possible kinetic role. Regardless of whether the balance is under thermodynamic or kinetic control, the probability distribution of the unfolding pathways clearly points to a change in the ratios of many unfolding pathways for the mutant versus the WT protein. This also shows that single amino acid changes can significantly reshape the unfolding landscape of a membrane protein by selection of energetically more favorable unfolding pathways over others.
Hammond effect and energy landscape
The presence of multiple intermediates implies a very rough energy landscape with many energetically similar minima (Fig. 7). A consequence of the frustrated energy landscape35,36 of individual trans-membrane α-helices24 is that the relative populations of these energetically similar intermediates may be affected by small perturbations in interactions. The ensemble of intermediates can thus be described as plastic. Such a plastic behavior was recently reported for the intermediates of the ankyrin-repeat protein ankyrinR. 37 Our results suggest that the same mutation, while stabilizing some structural segments, destabilizes other segments in BR. Moreover, transition states of the more stable structural segments were much further from the folded state than those of the less stable ones, suggesting a clear Hammond behavior. In mutants containing a destabilized α-helix, the transition state is expected to be closer to the native folded or intermediate state and unfolding to be energetically less challenging. Thus, in the unfolding of mutants with a destabilized α-helix, the loosening of the α-helix becomes an earlier event. This Hammond behavior observed for all BR mutants is indicative of the counteracting effects determining protein stability. DFS experiments on WT BR at different temperatures showed a clear predictable Hammond effect. With increasing temperature, the distance from the folded state to the transition state decreased and the unfolding rate increased (ΔGu* decreased) for all structural segments of WT BR. 24 Thus, DFS is sensitive enough to dissect small differences occurring in an energy landscape.
The broad maximum representing the unfolded state in an energy landscape allows the protein to populate many different conformations (Fig. 7). As the α-helices travel along the folding pathway, the protein structure becomes increasingly well defined, carving a funneled energy landscape with a narrow energy minimum at the bottom.35,36 In light of the energy landscape model, the observed Hammond behavior can be explained in two ways. A mutation causes the pinnacle on the energy profile to move along the unfolding pathway, which does not change. The protein still passes through the same ensemble of structures but the energies of the structures along the reaction coordinate change. Alternatively, the energy profile can be seen as a manifestation of many converging parallel pathways. The pathways are rather similar but differ in the positions and kinetic rates of the transition states (Fig. 7). The mutations change the energies of the pathways and, thus, their relative occupancies.
Outlook
There may be significant physiological implications of the findings presented in this paper. Protein folding has been studied in part to decipher the mechanisms of how and why proteins misfold in certain cases but not in others. The modest folding efficiency of wild-type eukaryotic integral membrane proteins38,39 indicates that the energetic balance between folding and misassembly pathways for many proteins is delicate enough to be tipped in a pathological direction by many mutations. 8 Since a misfolded protein might be thermodynamically more or less stable than or equally stable as the native folded protein, bulk unfolding measurements alone could sometimes be misleading in determining the mechanistic details of such a complicated process. A clear example is that of the BR mutant P50A, which exhibits the same thermodynamic stability as WT BR and, like other mutants with different stabilities, shows minimal local structural changes. However, an in-depth analysis shows that point mutations can significantly change the population of unfolding pathways. It is of crucial interest in this regard to note that the presence or absence of proline changes helix–bilayer interactions, 40,41 and has been suggested to influence BR folding.42
Since the folding and functional state of individual membrane proteins can be determined with SMFS,43,44 the presented approach may be applied in future to determine which energetic pathway favors membrane protein malfunction, destabilization and misfolding. At present, it is difficult to ascertain which pathways lead to the native folded state and which to the nonnative or misfolded states. More elaborate experimental work in conjunction with molecular dynamic simulations is needed to shed light on the contribution of each pathway in the folding, misfolding and misassembly of a protein.
Materials and Methods
Preparation of mutant proteins
All BR mutants were created and purified as described previously.15 Halobacterium halobium strain L33, devoid of membrane pigments, was used for transfection.45 Purple membrane was purified following the method of Oesterhelt and Stoeckenius.46
Single-molecule force spectroscopy
To mechanically unfold individual BRs using SMFS, the AFM stylus was brought into contact with the membrane protein surface. Applying a constant force of~1–1.5nN for ~1 s ensured that the terminal end of the protein attached to the stylus via nonspecific interactions.13,20 Separation of stylus and membrane stretched this molecular bridge and exerted a force at the protein leading to its unfolding. The F–D spectra recorded during the unfolding process showed characteristic patterns that were assigned to unfolding BR by pulling from its C-terminal end.20,47 The first 20 nm of the F–D traces exhibited higher noise compared to the rest of the trace due to nonspecific AFM stylus–sample interactions.19,20 Thus, force peaks lying within this region are masked by noise and therefore show higher deviations compared to peaks detected at separations above 20 nm. Since unfolding of α-helices G and F fall within the F–D region below 20 nm, we did not take into consideration the unfolding of these α-helices. However, this may be crucial only in the case of P186A (helix F) and not for the other mutants studied here.
DFS was performed on all BR mutants at six different speeds of 87.2, 300, 600, 1310, 2620 and 5230 nm/s. All DFS experiments were conducted under identical physiological conditions, the BR was embedded into the native membrane, and pH, electrolyte and temperature of the buffer solution were kept constant. Spring constants of the 200-µm-long AFM cantilevers (NPS, Veeco Metrology; nominal spring constant ~0.08 N/m) were calibrated in buffer solution using the equipartition theorem.48 All experiments on all the mutants were performed using cantilevers from the same wafer, and the measured spring constants were within ~10% of each other. To minimize errors due to cantilever spring constant deviations in DFS measurements, each BR sample was unfolded at a specific speed using at least three different cantilevers from the same wafer. The number of curves collected for each BR mutant, P50A, P91A, P186A, M56A and Y57A, at 87.2 nm/ s (n=52, 46, 75, 96, 50, respectively), 300 nm/s (118, 106, 73, 76, 83), 600 nm/s (102, 117, 74, 114, 80), 1310 nm/s (122, 111, 107, 128, 86), 2620 nm/s (106, 104, 106, 114, 62) and 5230 nm/s (126, 110, 108, 118, 78). WT BR data were taken from a recent study,18 with the number of curves at 10 nm/ s (n=10), 50 nm/s (84), 87.2 nm/s (79), 654 nm/s (165), 1310 nm/s (121), 2620 nm/s (23), and 5230 nm/s (51).
Calculating xu and ku from DFS
DFS with AFM involves unfolding a protein at different pulling speeds.22 Plotted as the most probable unfolding force versus loge(loading rate), the force spectrum maps the most prominent energy barriers in the energy landscape along the force-driven pathway and exposes the differences in energy between barriers.23 The most probable unfolding force, Fp, can be described as
where kB is the Boltzmann’s constant, T is the temperature, xu is the distance from the free energy minimum to the transition-state barrier, ku denotes the unfolding rate under no applied force and rf is the loading rate. The slope, kBT/xu, and the x intersection, kBTku/xu, of a line fit with this equation to the force versus loading rate plot gives an estimate of xu and ku. The most probable force determined from a Gaussian fit to the force histogram agreed well with the calculated average force. Instead of the most probable force we plotted the mean force versus loge (loading rate).
Estimating transition barrier heights
The barrier height, ΔGu*, for a transition state from a folded state was estimated using the Arrhenius equation
where τ0 denotes the unloaded lifetime of the state and 1/τA is the Arrhenius frequency factor.49 For protein dynamics τA has a value between 10− 7 and 10− 9 s.50,51 We assumed a value of 10− 8 for ΔGu* calculations. The ΔGu* values for all structural segments of WT and mutant BR were estimated using this value.
Selection of force–distance curves and measurement of unfolding forces
For analysis we selected F–D curves recorded on unfolding single BRs from their C-terminal end.19,20 Out of these, only the F–D curves exhibiting an overall length between 60 nm and 70 nm reflected complete unfolding of a BR molecule into a fully stretched polypeptide. Every peak of a single F–D curve exhibiting this length was fitted using the wormlike chain (WLC) model,52
with a persistence length, p, of 0.4 nm and a monomer length, x, of 0.36 nm.53 The contour length, L, obtained from the WLC fits gives the number of extended amino acids at each peak and allows one to assign unfolding events to structural segments of BR as described.19 The amplitude of a force peak in the F–D spectra denotes the force required to mechanically unfold the structural segments. To measure the unfolding force of each structural segment every event of each curve was analyzed.
Probability calculation of unfolding pathways
To determine the effect of mutations on the unfolding pathways, we calculated the probability of all the unfolding pathways of each mutant at every unfolding speed. As a first step, the probability of unfolding pathways for WT BR was determined at a pulling speed of 87.2 nm/s. Each pathway was codified as a string of 0 and 1, where 1 corresponds to the sequence position denoting the presence of a peak and 0 corresponds to the sequence position where the given peak was missing. The pathways were then indexed according to the occurrence probability, the pathway with the highest probability being 0 and the one with the lowest probability being 27. The occurrence probability of the same pathways was determined for all BR mutants at the same speeds.
Supplementary Material
Acknowledgements
This work was supported by the Deutsche For-schungsgemeinschaft, the European Union grant NEST2004 PathSYS29084, and National Institutes of Health grant R01 GM063919.
Abbreviations used
- SMFS
single-molecule force spectroscopy
- AFM
atomic force microscope
- BR
bacteriorhodopsin
- DFS
dynamic single-molecule force spectroscopy
- SEM
standard error of the mean
Footnotes
Supplementary Data
Supplementary data associated with this article can be found, in the online version, at doi:10.1016/ j.jmb.2007.12.027
References
- 1.Daggett V, Fersht A. The present view of the mechanism of protein folding. Nat. Rev. Mol. Cell Biol. 2003;4:497–502. doi: 10.1038/nrm1126. [DOI] [PubMed] [Google Scholar]
- 2.Dill KA, Chan HS. From Levinthal to pathways to funnels. Nat. Struct. Biol. 1997;4:10–19. doi: 10.1038/nsb0197-10. [DOI] [PubMed] [Google Scholar]
- 3.Bowie JU. Solving the membrane protein folding problem. Nature. 2005;438:581–589. doi: 10.1038/nature04395. [DOI] [PubMed] [Google Scholar]
- 4.White SH, Wimley WC. Membrane protein folding and stability: physical principles. Annu. Rev. Biophys. Biomol. Struct. 1999;28:319–365. doi: 10.1146/annurev.biophys.28.1.319. [DOI] [PubMed] [Google Scholar]
- 5.Daggett V, Fersht A. Is there a unifying mechanism for protein folding. Trends Biochem. Sci. 2003;28:19–26. doi: 10.1016/s0968-0004(02)00012-9. [DOI] [PubMed] [Google Scholar]
- 6.Dobson CM. Protein misfolding, evolution and disease. Trends Biochem. Sci. 1999;24:329–332. doi: 10.1016/s0968-0004(99)01445-0. [DOI] [PubMed] [Google Scholar]
- 7.Dobson CM. Protein folding and misfolding. Nature. 2003;426:884–890. doi: 10.1038/nature02261. [DOI] [PubMed] [Google Scholar]
- 8.Sanders CR, Myers JK. Disease-related misassembly of membrane proteins. Annu. Rev. Biophys. Biomol. Struct. 2004;33:25–51. doi: 10.1146/annurev.biophys.33.110502.140348. [DOI] [PubMed] [Google Scholar]
- 9.Kedrov A, Janovjak H, Sapra KT, Muller DJ. Deciphering molecular interactions of native membrane proteins by single-molecule force spectroscopy. Annu. Rev. Biophys. Biomol. Struct. 2007;36:233–260. doi: 10.1146/annurev.biophys.36.040306.132640. [DOI] [PubMed] [Google Scholar]
- 10.Sapra KT, Besir H, Oesterhelt D, Muller DJ. Characterizing molecular interactions in different bacteriorhodopsin assemblies by single-molecule force spectroscopy. J. Mol. Biol. 2006;355:640–650. doi: 10.1016/j.jmb.2005.10.080. [DOI] [PubMed] [Google Scholar]
- 11.Janovjak H, Kessler M, Oesterhelt D, Gaub HE, Müller DJ. Unfolding pathways of native bacteriorhodopsin depend on temperature. EMBO J. 2003;22:5220–5229. doi: 10.1093/emboj/cdg509. [DOI] [PMC free article] [PubMed] [Google Scholar]
- 12.Kedrov A, Ziegler C, Müller DJ. Differentiating ligand and inhibitor interactions of a single antiporter. J. Mol. Biol. 2006;362:925–932. doi: 10.1016/j.jmb.2006.07.049. [DOI] [PubMed] [Google Scholar]
- 13.Sapra KT, Park PS, Filipek S, Engel A, Müller DJ, Palczewski K. Detecting molecular interactions that stabilize native bovine rhodopsin. J. Mol. Biol. 2006;358:255–269. doi: 10.1016/j.jmb.2006.02.008. [DOI] [PubMed] [Google Scholar]
- 14.Park PS, Sapra KT, Kolinski M, Filipek S, Palczewski K, Muller DJ. Stabilizing effect of Zn2+ in native bovine rhodopsin. J. Biol. Chem. 2007;282:11377–11385. doi: 10.1074/jbc.M610341200. [DOI] [PMC free article] [PubMed] [Google Scholar]
- 15.Faham S, Yang D, Bare E, Yohannan S, Whitelegge JP, Bowie JU. Side-chain contributions to membrane protein structure and stability. J. Mol. Biol. 2004;335:297–305. doi: 10.1016/j.jmb.2003.10.041. [DOI] [PubMed] [Google Scholar]
- 16.Yohannan S, Faham S, Yang D, Whitelegge JP, Bowie JU. The evolution of transmembrane helix kinks and the structural diversity of G protein-coupled receptors. Proc. Natl Acad. Sci. USA. 2004;101:959–963. doi: 10.1073/pnas.0306077101. [DOI] [PMC free article] [PubMed] [Google Scholar]
- 17.Mitsuoka K, Hirai T, Murata K, Miyazawa A, Kidera A, Kimura Y, Fujiyoshi Y. The structure of bacteriorhodopsin at 3.0 Å resolution based on electron crystallography: implication of the charge distribution. J. Mol. Biol. 1999;286:861–882. doi: 10.1006/jmbi.1998.2529. [DOI] [PubMed] [Google Scholar]
- 18.Janovjak H, Struckmeier J, Hubain M, Kedrov A, Kessler M, Müller DJ. Probing the energy landscape of the membrane protein bacteriorhodopsin. Structure (Cambridge) 2004;12:871–879. doi: 10.1016/j.str.2004.03.016. [DOI] [PubMed] [Google Scholar]
- 19.Müller DJ, Kessler M, Oesterhelt F, Möller C, Oesterhelt D, Gaub H. Stability of bacterior-hodopsin alpha-helices and loops analyzed by single-molecule force spectroscopy. Biophys. J. 2002;83:3578–3588. doi: 10.1016/S0006-3495(02)75358-7. [DOI] [PMC free article] [PubMed] [Google Scholar]
- 20.Oesterhelt F, Oesterhelt D, Pfeiffer M, Engel A, Gaub HE, Müller DJ. Unfolding pathways of individual bacteriorhodopsins. Science. 2000;288:143–146. doi: 10.1126/science.288.5463.143. [DOI] [PubMed] [Google Scholar]
- 21.Cisneros DA, Oesterhelt D, Müller DJ. Probing origins of molecular interactions stabilizing the membrane proteins halorhodopsin and bacteriorhodopsin. Structure (Cambridge) 2005;13:235–242. doi: 10.1016/j.str.2004.12.005. [DOI] [PubMed] [Google Scholar]
- 22.Evans E. Looking inside molecular bonds at biological interfaces with dynamic force spectroscopy. Biophys. Chem. 1999;82:83–97. doi: 10.1016/s0301-4622(99)00108-8. [DOI] [PubMed] [Google Scholar]
- 23.Evans E. Energy landscapes of biomolecular adhesion and receptor anchoring at interfaces explored with dynamic force spectroscopy. Faraday Discuss. 1998;111:1–16. doi: 10.1039/a809884k. [DOI] [PubMed] [Google Scholar]
- 24.Janovjak H, Knaus H, Muller DJ. Transmembrane helices have rough energy surfaces. J. Am. Chem. Soc. 2007;129:246–247. doi: 10.1021/ja065684a. [DOI] [PubMed] [Google Scholar]
- 25.Evans E. Probing the relation between force-lifetime-and chemistry in single molecular bonds. Annu. Rev. Biophys. Biomol. Struct. 2001;30:105–128. doi: 10.1146/annurev.biophys.30.1.105. [DOI] [PubMed] [Google Scholar]
- 26.Hammond GS. A correlation of reaction rates. J. Am. Chem. Soc. 1955;77:334–338. [Google Scholar]
- 27.Matouschek A, Fersht AR. Application of physical organic chemistry to engineered mutants of proteins: Hammond postulate behavior in the transition state of protein folding. Proc. Natl Acad. Sci. USA. 1993;90:7814–7818. doi: 10.1073/pnas.90.16.7814. [DOI] [PMC free article] [PubMed] [Google Scholar]
- 28.Matthews JM, Fersht AR. Exploring the energy surface of protein folding by structure-reactivity relationships and engineered proteins: observation of Hammond behavior for the gross structure of the transition state and anti-Hammond behavior for structural elements for unfolding/folding of barnase. Biochemistry. 1995;34:6805–6814. doi: 10.1021/bi00020a027. [DOI] [PubMed] [Google Scholar]
- 29.Strunz T, Oroszlan K, Schafer R, Guntherodt HJ. Dynamic force spectroscopy of single DNA molecules. Proc. Natl Acad. Sci. USA. 1999;96:11277–11282. doi: 10.1073/pnas.96.20.11277. [DOI] [PMC free article] [PubMed] [Google Scholar]
- 30.Schwesinger F, Ros R, Strunz T, Anselmetti D, Guntherodt HJ, Honegger A, et al. Unbinding forces of single antibody–antigen complexes correlate with their thermal dissociation rates. Proc. Natl Acad. Sci. USA. 2000;97:9972–9977. doi: 10.1073/pnas.97.18.9972. [DOI] [PMC free article] [PubMed] [Google Scholar]
- 31.Bustamante C, Chemla YR, Forde NR, Izhaky D. Mechanical processes in biochemistry. Annu. Rev. Biochem. 2004;73:705–748. doi: 10.1146/annurev.biochem.72.121801.161542. [DOI] [PubMed] [Google Scholar]
- 32.Li H, Carrion-Vazquez M, Oberhauser AF, Marszalek PE, Fernandez JM. Point mutations alter the mechanical stability of immunoglobulin modules. Nat. Struct. Biol. 2000;7:1117–1120. doi: 10.1038/81964. [DOI] [PubMed] [Google Scholar]
- 33.Booth PJ, Curnow P. Membrane proteins shape up: understanding in vitro folding. Curr. Opin. Struc. Biol. 2006;16:480–488. doi: 10.1016/j.sbi.2006.06.004. [DOI] [PubMed] [Google Scholar]
- 34.Brockwell DJ, Beddard GS, Clarkson J, Zinober RC, Blake AW, Trinick J, et al. The effect of core destabilization on the mechanical resistance of I27. Biophys. J. 2002;83:458–472. doi: 10.1016/S0006-3495(02)75182-5. [DOI] [PMC free article] [PubMed] [Google Scholar]
- 35.Wolynes PG, Onuchic JN, Thirumalai D. Navigating the folding routes. Science. 1995;267:1619–1620. doi: 10.1126/science.7886447. [DOI] [PubMed] [Google Scholar]
- 36.Onuchic JN, Wolynes PG, Luthey-Schulten Z, Socci ND. Toward an outline of the topography of a realistic protein-folding funnel. Proc. Natl Acad. Sci. USA. 1995;92:3626–3630. doi: 10.1073/pnas.92.8.3626. [DOI] [PMC free article] [PubMed] [Google Scholar]
- 37.Werbeck ND, Itzhaki LS. Probing a moving target with a plastic unfolding intermediate of an ankyrin-repeat protein. Proc. Natl Acad. Sci. USA. 2007;104:7863–7868. doi: 10.1073/pnas.0610315104. [DOI] [PMC free article] [PubMed] [Google Scholar]
- 38.Kopito RR. Biosynthesis and degradation of CFTR. Physiol. Rev. 1999;79:S167–S173. doi: 10.1152/physrev.1999.79.1.S167. [DOI] [PubMed] [Google Scholar]
- 39.Seibert FS, Loo TW, Clarke DM, Riordan JR. Cystic fibrosis: channel, catalytic, and folding properties of the CFTR protein. J. Bioenerg. Biomembr. 1997;29:429–442. doi: 10.1023/a:1022478822214. [DOI] [PubMed] [Google Scholar]
- 40.Kobayashi S, Takeshima K, Park CB, Kim SC, Matsuzaki K. Interactions of the novel antimicrobial peptide buforin 2 with lipid bilayers: proline as a translocation promoting factor. Biochemistry. 2000;39:8648–8654. doi: 10.1021/bi0004549. [DOI] [PubMed] [Google Scholar]
- 41.Chia BC, Carver JA, Mulhern TD, Bowie JH. Maculatin 1.1, an anti-microbial peptide from the Australian tree frog, Litoria genimaculata—solution structure and biological activity. Eur. J. Biochem. 2000;267:1894–1908. doi: 10.1046/j.1432-1327.2000.01089.x. [DOI] [PubMed] [Google Scholar]
- 42.Lu H, Marti T, Booth PJ. Proline residues in transmembrane alpha helices affect the folding of bacteriorhodopsin. J. Mol. Biol. 2001;308:437–446. doi: 10.1006/jmbi.2001.4605. [DOI] [PubMed] [Google Scholar]
- 43.Kedrov A, Janovjak H, Ziegler C, Kühlbrandt W, Müller DJ. Observing folding kinetics and pathways of single antiporters. J. Mol. Biol. 2006;355:2–8. doi: 10.1016/j.jmb.2005.10.028. [DOI] [PubMed] [Google Scholar]
- 44.Oberhauser AF, Marszalek PE, Carrion-Vazquez M, Fernandez JM. Single protein misfolding events captured by atomic force microscopy. Nat. Struct. Biol. 1999;6:1025–1028. doi: 10.1038/14907. [DOI] [PubMed] [Google Scholar]
- 45.Cline SW, Doolittle WF. Efficient transfection of the archaebacterium Halobacterium halobium. J. Bacteriol. 1987;169:1341–1344. doi: 10.1128/jb.169.3.1341-1344.1987. [DOI] [PMC free article] [PubMed] [Google Scholar]
- 46.Oesterhelt D, Stoeckenius W. Isolation of the cell membrane of Halobacterium halobium and its fraction into red and purple membrane. Methods Enzymol. 1974;31:667–678. doi: 10.1016/0076-6879(74)31072-5. [DOI] [PubMed] [Google Scholar]
- 47.Kessler M, Gaub H. Unfolding barriers in bacteriorhodopsin probed from the cytoplasmic and the extracellular side by AFM. Structure. 2006;14:521–527. doi: 10.1016/j.str.2005.11.023. [DOI] [PubMed] [Google Scholar]
- 48.Florin E-L, Rief M, Lehmann H, Ludwig M, Dornmair C, Moy VT, Gaub HE. Sensing specific molecular interactions with the atomic force microscope. Biosens. Bioelectron. 1995;10:895–901. [Google Scholar]
- 49.Dietz H, Rief M. Exploring the energy landscape of GFP by single-molecule mechanical experiments. Proc. Natl Acad. Sci. USA. 2004;101:16192–16197. doi: 10.1073/pnas.0404549101. [DOI] [PMC free article] [PubMed] [Google Scholar]
- 50.Bieri O, Wirz J, Hellrung B, Schutkowski M, Drewello M, Kiefhaber T. The speed limit for protein folding measured by triplet–triplet energy transfer. Proc. Natl Acad. Sci. USA. 1999;96:9597–9601. doi: 10.1073/pnas.96.17.9597. [DOI] [PMC free article] [PubMed] [Google Scholar]
- 51.Yang WY, Gruebele M. Folding at the speed limit. Nature. 2003;423:193–197. doi: 10.1038/nature01609. [DOI] [PubMed] [Google Scholar]
- 52.Bustamante C, Marko JF, Siggia ED, Smith S. Entropic elasticity of lambda-phage DNA. Science. 1994;265:1599–1600. doi: 10.1126/science.8079175. [DOI] [PubMed] [Google Scholar]
- 53.Rief M, Gautel M, Oesterhelt F, Fernandez JM, Gaub HE. Reversible unfolding of individual titin immunoglobulin domains by AFM. Science. 1997;276:1109–1112. doi: 10.1126/science.276.5315.1109. [DOI] [PubMed] [Google Scholar]
Associated Data
This section collects any data citations, data availability statements, or supplementary materials included in this article.