

Abstract
Factors that trigger and sustain self-renewal divisions in tissue stem cells remain poorly characterized. By modulating the levels of Hoxb4 and its co-factor Pbx1 in primary hematopoietic cells (Hoxb4hiPbx1locells), we report an in vitro expansion of mouse hematopoietic stem cells (HSCs) by 105-fold over 2 weeks, with subsequent preservation of HSC properties. Clonal analyses of the hematopoietic system in recipients of expanded HSCs indicate that up to 70% of Hoxb4hiPbx1lo stem cells present at initiation of culture underwent self-renewal in vitro. In this setting, Hoxb4 and its co-factor did not promote an increase in DNA synthesis, or a decrease in doubling time of Sca1+Lin− cells when compared to controls. Q-PCR analyses further revealed a down regulation of Cdkn1b (p27Kip1) and Mxd1 (Mad1) transcript levels in Hoxb4hiPbx1lo primitive cells, accompanied by a more subtle increase in c-myc and reduction in Ccnd3 (Cyclin D3). We thus put forward this strategy as an efficient in vitro HSC expansion tool, enabling a further step into the avenue of self-renewal molecular effectors.
Keywords: Hematopoietic stem cells, Self-renewal, Cell cycle, Hoxb4, Pbx1
INTRODUCTION
Integration of cell-autonomous factors and microenvironmental signals is believed to dictate the final outcome of HSC division (reviewd in [1]), namely to self-renew with preservation of stemness, or to engage in differentiation pathways. Dissection of the molecular mechanisms that regulate this delicate balance would greatly increase the probability of successful ex vivo expansion of HSCs. Following myeloablative HSC transplantation, the total stem cell reservoir of a recipient is replenished to only approximately 10% of the pre-transplantation levels ([2, 3], see also supplementary Fig. 1)), indicating that HSCs present in the bone marrow (BM) graft display a limited expansion potential in vivo in this particular biological setting, probably in response to both intrinsic (cell-autonomous [3]) and extrinsic (growth factors, cell-cell contact [4]) cues. In the same context HSCs engineered to overexpress Hoxb4 can fully replenish the stem cell pool of recipients, and then maintain a normal supply of HSCs (~20,000 per mouse) for the duration of life [5]. Hoxb4-transduced HSCs can also expand in vitro by at least ~40-fold in a period of 12 days [6], and by ~4–6-fold in 4 days in response to the recombinant TAT-HOXB4 protein [7, 8].
Although HOXB4 binding to DNA is essential for HSC expansion [9], other potential molecular interactions involved in this process remain undefined. The demonstrated effects of Hoxb4 retroviral overexpression on stem cells in vivo can be enhanced by concomitantly decreasing intracellular levels of PBX1, a homeoprotein of the TALE subfamily and known DNA-binding cofactor of HOXB4 and other Hox proteins [10–14]. Upon transplantation, these Hoxb4 + antisense Pbx1 doubly transduced HSCs (thereafter called Hoxb4hiPbx1lo HSCs) are significantly (20–50 times) more competitive than control Hoxb4hi cells [15], and interestingly, their functional integrity and responsiveness to in vivo signals that regulate HSC pool size appear unperturbed (see supplementary Fig. 1).
The in vivo repopulating activity of Hoxb4hiPbx1lo HSCs thus appears to be tightly controlled by as yet non-identified physiological mechanisms. To circumvent these constraints, and to reveal the intrinsic potential for self-renewal (SR) divisions of HSCs, Hoxb4hiPbx1lo cells were cultured ex vivo for prolonged periods of time. We now present novel findings that document essentially exclusive induction of HSC self-renewal divisions in vitro, associated with slow proliferation rates in primitive cells, thus supporting the emerging evidence that these processes are ultimately linked [16–20]. The levels of in vitro HSC expansion achieved parallel those documented in an accompanying paper using Hox fusion genes. Together these results provide potent methods to enable sustained triggering of HSC self-renewal in vitro and open up new approaches to elucidate the key mechanisms involved.
RESULTS
Ex vivo expansion potential of HSC
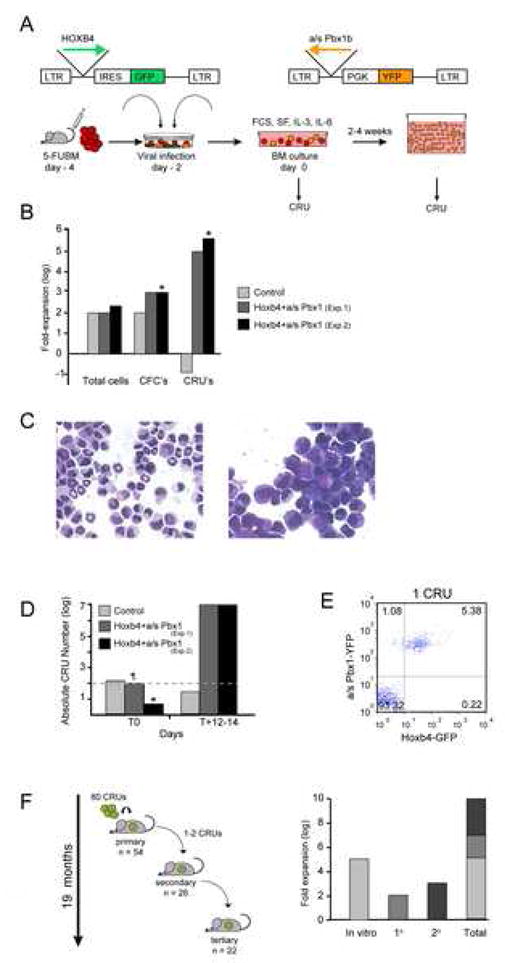
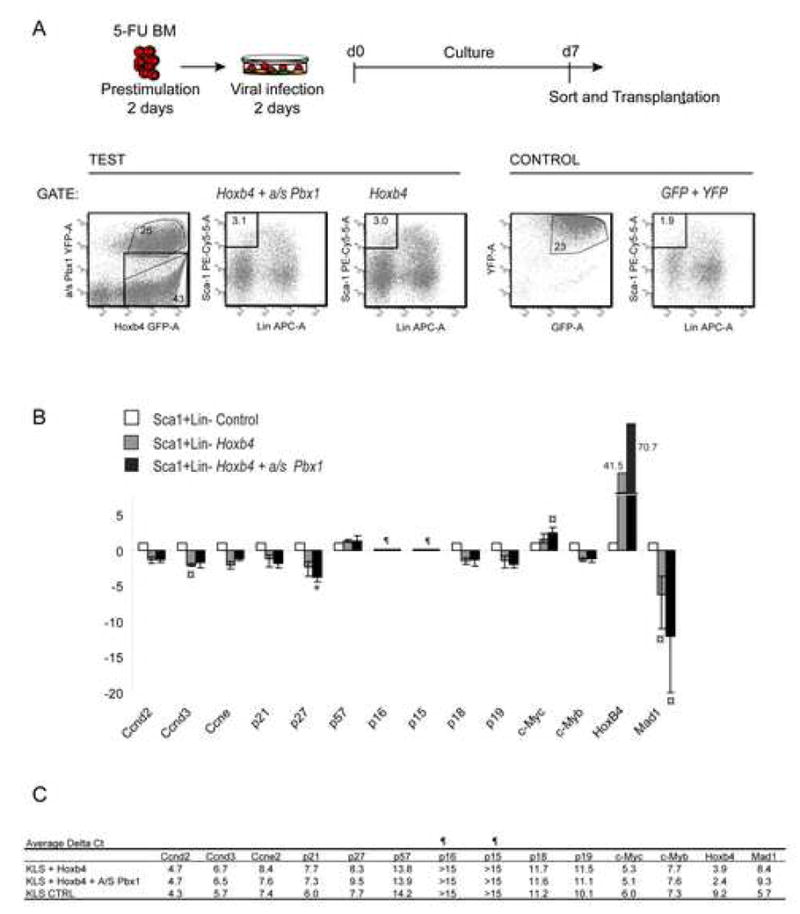
The potential of Hoxb4hiPbx1lo engineered HSCs to proliferate and expand under ex vivo conditions was investigated using the experimental strategy outlined in Fig. 1A (see figure legend for details). At initiation of culture, HSC or competitive repopulating unit (CRU) frequency [21] in the Hoxb4hiPbx1lo group was 1 in 50,000 cells, or 0.002%, for an absolute number of 100 doubly transduced stem cells, in the same range as for the starting number of GFP control HSCs (i.e. 1 in 25,000 cells, or 150 CRUs). In a 12-day time span, total cell number expansion was comparable in 2 independent experiments between cultures initiated with Hoxb4hiPbx1lo or control GFP cells, averaging 2–3 logs (Fig. 1B). However, morphologically undifferentiated cells were more prevalent in cultures initiated with Hoxb4hiPbx1lo cells compared to control (Fig. 1C). This was reflected in the clonogenic progenitor frequencies, as assessed by plating cultured cells in semi-solid media, which were identical at initiation of culture for both groups (in the order of 1 colony-forming cell (CFC) per 150 cells). This frequency remained constant in the control group after 2 weeks, with an overall 100-fold CFC increase, as opposed to a 1000–1500-fold CFC expansion in the Hoxb4hiPbx1lo groups, where the frequency increased to 1 in 3–15 cells (n=4 independent cultures, see Fig. 1B). In sharp contrast also, the stem cell frequency differed markedly between these 2 conditions. After 12 days of in vitro expansion, CRUs represented 1 in 50 cells or 2% of the Hoxb4hiPbx1lo culture, for an absolute number of 1.2 x 10⁷ CRUs in Exp. 1 and 1.9 x 10⁷ in Exp. 2 (Fig. 1D), and a net 100,000-fold in vitro increment. In parallel, the CRU frequency in the GFP control group declined to 1 in 2 x 10⁷ cells, or 25 CRUs, over the same time period, for a net 6-fold reduction (Fig. 1B, D). The in vitro stem cell enrichment in the Hoxb4hiPbx1lo culture is illustrated in Fig. 1E where peripheral blood reconstitution by GFP and YFP (ie, Hoxb4hiPbx1lo) cells at 4 months post transplantation, of a primary recipient of 5 expanded T+14 cells (Exp. 2), is presented. In order to unambiguously conclude about the stem cell nature of the expanded CRUs, their in vivo functional properties were further investigated.
Figure 1.
In vitro expansion of Hoxb4hiPbx1lo HSC
(A) Diagrammatic representation of retroviral vectors and experimental strategy used in these experiments. In total 3 independent experiments (Exp. 1–3) were performed. CRU frequency in cultures were assessed at different times (T) using limit dilution assays as follows: Exp. 1: T0; T+12, T+19; Exp. 2: T+3; T+14; Exp. 3: T0, T+7, T+16, T+21*; T+28;. At each time point, between 20–35 primary recipients were transplanted per condition, except for * where only 3 mice were used.
FCS: Fetal Calf Serum; SF: Steel Factor
(B) Differential impact of Hoxb4 over-expression on the expansion of distinct cell fractions following 2 weeks of ex vivo culture. From Exp. 1 and 2. CFC: colony-forming cell, CRU: competitive repopulating unit. *To calculate fold-expansion in Exp. 2, CFCs and CRUs at initiation of culture were considered to be equivalent to those of Exp. 1, even though 1/3 of mice or 1/10 of BM cells were used to begin the experiment. Hence, the fold-increase may be an underestimate.
(C) Wright stain of cellular preparations obtained from T+14 cultures initiated with GFP-transduced cells (left panel) or Hoxb4hiPbx1lo cells (right panel). Note the reduction of differentiated cells (e.g., ring neutrophils) in right panel. Representative example shown from Exp. 2.
(D) Histogram depicting the absolute HSC (CRU) numbers increment in the cultures initiated with GFP-transduced cells versus those with Hoxb4hiPbx1lo cells. X-axis refers to number of days cells from Exp. 1 and 2 were kept in culture. ¶ Total CRU value at T0 also includes untransduced and singly transduced cells. * Estimated value according to CRU frequency of Exp. 1, see legend of (B).
(E) Representative FACS profile of GFP and YFP expression in peripheral blood (PB) cells from a primary mouse recipient of 5 Hoxb4hiPbx1lo expanded cells after 14 days of culture. Recipient (Exp. 2) was analyzed at 16 weeks post transplant.
(F) Summary of CRU expansion in serial transplantations of Hoxb4hiPbx1lo BM cells revealing a cumulative 1010-fold in vitro and in vivo expansion over a period of 19 months. From Exp. 1.
Preservation of functional integrity of expanded HSCs
The in vivo regenerative capacity of Hoxb4hiPbx1lo HSCs that had undergone a 105-fold expansion in vitro was first evaluated. These experiments involved serial passages of transduced cells over several recipients during a 19-month period as depicted in Fig. 1F. As estimated by the CRU assay performed on secondary recipients, the Hoxb4hiPbx1lo HSC frequency in a primary recipient of 4,000 cultured cells (ie 80 CRUs) was 1 in 7,000 (average of two CRU assays), for a total stem cell pool size of ~28,000 cells per mouse, representing a net 300-fold expansion in vivo (Fig. 1F, second column of graphic). Bone marrow clonogenic progenitor activity of these primary animals was within normal limits, and the majority (>90%) of myeloid progenitors in these mice were derived from Hoxb4hiPbx1lo cells as assessed by epifluorescence and Southern blot analyses (data not shown). To quantify the in vivo CRU expansion in secondary recipients, a secondary mouse that was transplanted with 4000 BM cells (ie 1–2 CRUs) served as a donor for a series of tertiary recipients to perform a CRU assay (Fig. 1F, see 2° mouse). The Hoxb4hiPbx1lo CRU frequency in this secondary animal was hence calculated to be 1 in 100 000 (ie 2000 CRUs), implying an additional 1000-fold in vivo expansion in this secondary recipient (Fig. 1F, 3rd column of graphic). Overall, the doubly transduced HSCs underwent a cumulative 1010 expansion following serial transplantations, in a time span of 19 months. Despite this level of expansion, the peripheral blood reconstitution in tertiary recipients of a single HSCs was measured to be ~ 4% at 4 months (data not shown). This output is consistent with previous observations [22] and shows that these stem cells probably remained responsive to physiological mechanisms that regulate HSC proliferation.
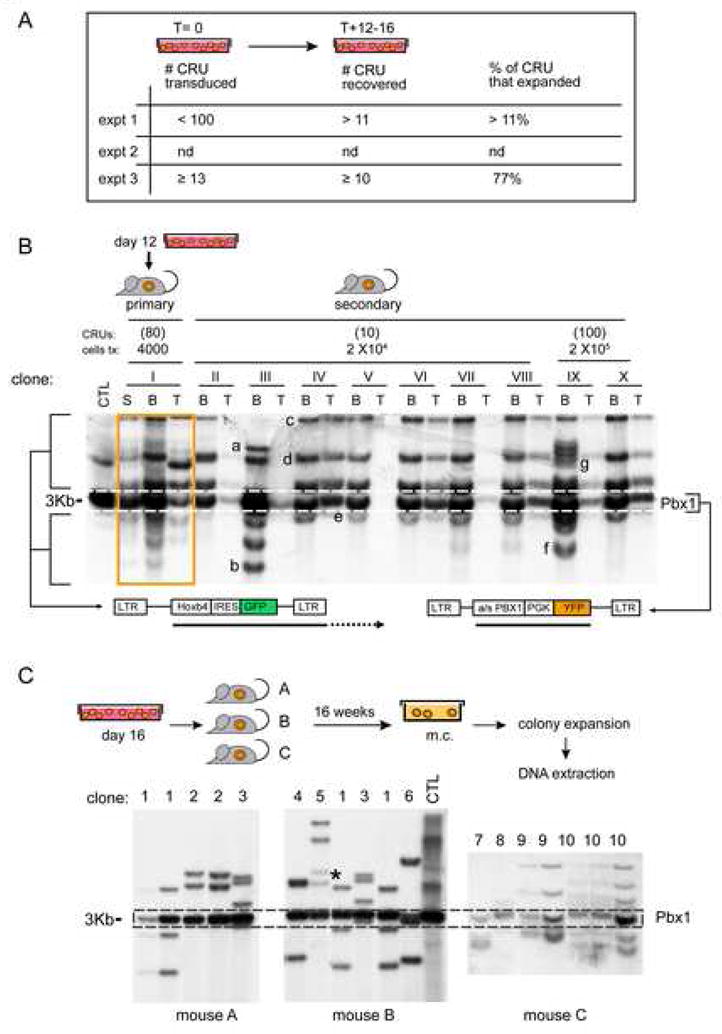
The in vitro stem cell frequency measured after ~2 weeks of culture acquires relevance if the reported expansion is oligo- to poly-clonal in character, rather than secondary to an overtly proliferating single clone. Clonal analysis revealed at most 100 doubly-transduced CRU (likely fewer, see Fig. 2A legend) at initiation of culture in Exp. 1 and the recovery of at least 11 expanded HSCs in primary and secondary recipients (Fig. 2A–B). This type of analysis was not available for Exp. 2 but repeated in a 3rd experiment where up to 77% of expanded CRU were recovered in recipients analyzed 16 weeks post-transplantation (Fig. 2A, C), a period deemed sufficient for the in vivo exhaustion of transplanted progenitors, hence ensuring that at this time all hematopoietic cells originated from long-term repopulating HSCs (Fig. 2C)
Figure 2.
Polyclonal and pluripotent character of expanded Hoxb4hiPbx1lo HSCs
(A) Summary of Hoxb4hiPbx1lo CRUs present at initiation (T0) and termination (T+12-16) of culture in the reported experiments, with CRUs at output over input numbers expressed as percentages on the far right column. T=0 CRUs calculated using CRU frequencies and transduction rates (Exp. 1) or Southern Blot analyses of BM cells of primary recipients (Exp. 3). Note that CRU numbers at T0 (<100) also include untransduced and singly transduced cells, hence the possible over estimation of Hoxb4hiPbx1lo CRUs. T+12-16 CRUs calculated using Southern Blot analyses of BM cells of secondary recipients (Exp. 1) or individually expanded myeloid colonies derived from BM cells of primary recipients (Exp. 3).
(B) Clonal analyses of hemopoietic reconstitution were also performed on 1° (mouse I) and 2° (mice II-X) recipients of Hoxb4+a/sPbx1 BM cells from Exp. 1. Mice were sacrificed 4 months post transplantation. DNA extracted from BM, spleen and thymus was digested with HindIII and EcoRI, which released a constant fragment of 3 kb representing the integrated Pbx1 provirus (see dotted line) and unique fragments for the integrated Hoxb4 virus (see autoradiographic signals identifying specific integration sites). Hence, a GFP probe generated a single autoradiographic signal for all a/sPbx1 proviral integrations (as indicated by the dotted lines), together with multiple bands denoting each Hoxb4 proviral integration event (see bottom diagram). A primary recipient of 4000 cells of T+12 in vitro culture (0.0007% of the total cell population), mouse I, displayed an oligoclonal pattern of Hoxb4 integration, reflecting the presence of several doubly transduced HSCs in the in vitro culture. Individual clones, labelled from “a” to “g”, can be distinguished among 2° transplant recipients of BM cells from mouse I (clones “h” to “k” are not shown in this blot). Note that a given clone was sometimes present in more than one 2° recipient, see for example clone “f” in mice III and IX, suggesting in vivo self-renewal of this HSC in the 1° donor mouse.
(C) Primary recipients of day 16 in vitro culture Hoxb4hiPbx1lo cells (from Exp. 3) were sacrificed at 4 months post transplantation, their respective BM cells plated in methylcellulose (m.c.), and individual colonies were then expanded. Southern Blot analyses of genomic DNA extracted from these clones are presented; DNA was digested with restriction enzymes (HindIII and EcoRI) as in (B). Individual clones, labeled from “1” to “10”, can be distinguished among 3 transplant recipients of BM cells. Note that a given clone was sometimes present in different recipients, suggesting in vitro self-renewal of the parent HSC. Mice were sacrificed 4 months post transplantation to ensure in vivo exhaustion of transduced progenitors, and thus assure that each colony forming cell (CFC) in methylcellulose (m.c.) was stem cell derived. * Probable contamination from clone no 2.
To further assess the functional integrity of the expanded HSCs, their ability to engage in terminal differentiation in various hematopoietic tissues was evaluated. A preliminary screen of peripheral blood hemoglobin concentration, white blood cell and platelet counts in long-term recipients of high doses of cultured cells reported values within normal limits (Suppl. Fig. 3A–D). Peripheral blood reconstitution of lymphoid (T and B) and myeloid (granulocyte and monocyte) lineages was assessed in selected primary and secondary recipients (Exp. 1) using flow cytometry (Fig. 3A). Final maturation of blood and BM cells in very long-term primary recipients (14 months, Exp. 2) is shown in Fig. 3B. As reported previously [15], Hoxb4hiPbxlo HSCs differentiated into all aforementioned cell types, although in some instances, a significant proportion of recipients manifested a skewing of differentiation towards the myeloid lineage for the transplanted cells, possibly in a dose-dependent effect of Hoxb4 as previously reported [23]. This skewing in myeloid differentiation was not observed in primary recipients (n=138 mice) of long-term culture cells (up to 28 days) from Exp. 3. In this particular experiment, myeloid and T lymphoid differentiation was confirmed in all reconstituted animals from all transplantation intervals (T0; T+7; T+16 and T+28 post initiation of culture) using proviral integration pattern analysis (data not shown).
Figure 3.
Differentiation potential analysis of in vitro and in vivo expanded CRUs.
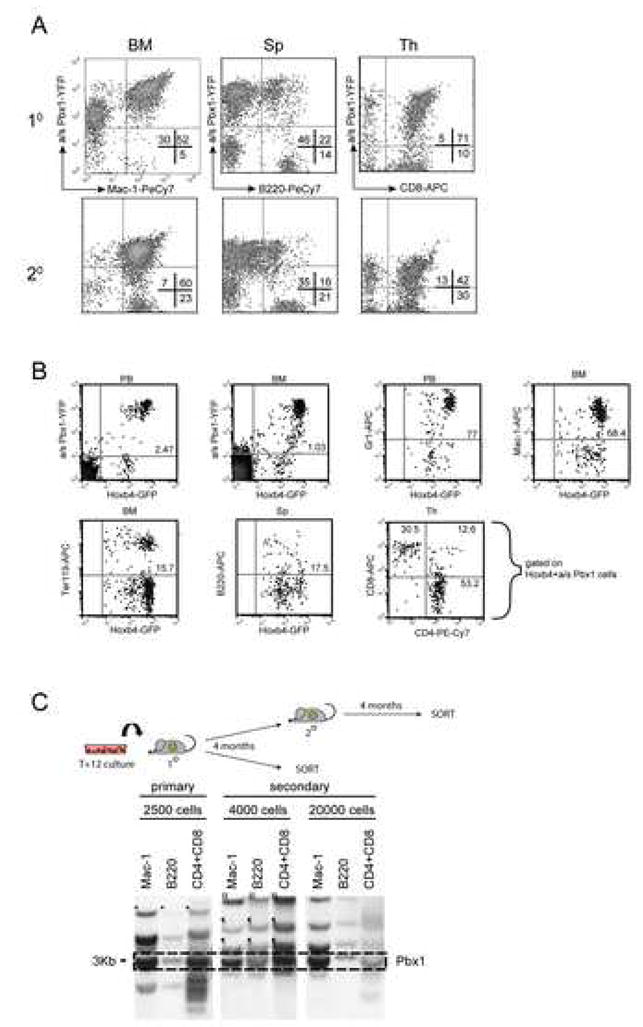
(A) Representative FACS profiles of primary (top) and secondary (bottom) recipients of in vitro cultured T+12 Hoxb4hiPbx1lo cells (Exp. 1) showing myeloid (Mac-1) and lymphoid (B220, CD8) differentiation. Animals were sacrificed 4 months post transplantation. BM: bone marrow, Sp: spleen, Th: thymus.
(B) FACS prolifes of bone marrow (BM) and peripheral blood (PB) cells from a representative primary recipient of 500 T+14 Hoxb4hiPbx1lo expanded cells (Exp. 2), 14 months post transplantation. For the different lineage marker shown on the Y-axis (Gr1, Mac-1, Ter119, B220, CD8) and on the X-axis (CD4), gates are set on double positive GFP:YFP (Hoxb4:a/sPbx1) cells.
(C) Terminal differentiation capacity of in vitro expanded HSCs was further evaluated in a 1° recipient (Exp. 1) of 2,500 T+12 expanded cells and in serially transplanted 2° recipients (left panel). Both, 1° and 2° recipients were sacrificed at 4 months post transplantation, and their hemopoietic cells sorted in B (B220+), T (CD4+/CD8+) lymphoid and (Mac-1+) myeloid lineages. Genomic DNA extracted from these populations was analyzed by Southern blot (right panel) as described in Fig 2A. Within a given animal, a common clone could be identified in all the aforementioned cell types, testifying that a common parental HSC gave rise to this differentiated lympho-myeloid progeny.
To further confirm the ability of expanded cells to differentiate in vivo, selected primary and secondary recipients from Exp. 1 were sacrificed 4 months post transplantation to isolate and sort bone marrow-derived myeloid (Mac-1+), splenic B (B220+) and thymic T (CD4+/CD8+) cells. Clonal analysis of these sorted cell populations revealed that within the same animal, a particular clone could be traced in all of the three aforementioned cell lineages (see legend for Fig. 3C), providing evidence for more than one common pluripotent parent HSC that gave rise to the mature progeny. Phenotypic analysis of myeloid, B- and T-cell compartments of tertiary recipients (n=40) revealed that Hoxb4hiPbxlo HSCs maintained this differentiation potential upon serial transplantation (data not shown).
Together, these observations strongly suggest that despite the apparent maturation arrest observed in bulk expansion cultures (Fig. 1C), in vitro expanded Hoxb4hiPbxlo HSCs retained their ability to engage in differentiation pathways in vivo, as well as their potential for self-renewal divisions.
Hoxb4hiPbx1lo HSCs: Proliferation or cell fate determination?
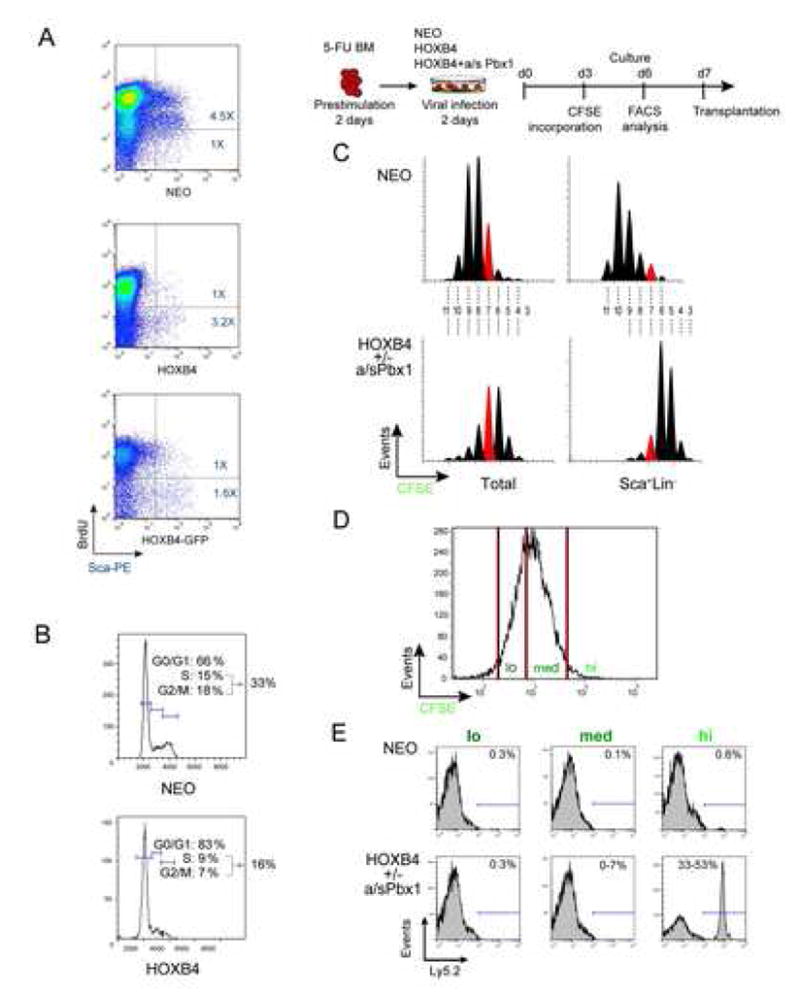
Rates of DNA synthesis and cell cycle progression in primitive fractions of control neo and Hoxb4 over-expressing BM cell populations were examined within the first week of expansion, when control neo cultures still contained detectable repopulating HSCs. At day 8 of culture, similar rates of BrdU incorporation were observed in total cell populations of all groups (Fig. 4A). Within the Sca1+ compartment, however, DNA synthesis appeared accentuated in the control group, where the majority of cells (81%) incorporated BrdU, (Fig. 4A upper panel), while DNA synthesis could only be detected in a minor fraction (24%) of Sca1+ Hoxb4 cells (Fig. 4A middle and lower panel). Cell cycle analyses (Fig. 4B), in parallel, mirrored these findings in that Hoxb4 Sca1+ cell populations comprised similar proportions of cells in the S/G2/M transition compared to controls (16% vs 33% for Hoxb4 and neo, respectively), again with a trend of fewer dividing cells among the Hoxb4 transduced culture. Thus, the reported expansion of Hoxb4hiPbx1lo HSCs could not be attributed to an overtly proliferating precursor pool. HSC depletion associated with certain in vitro culture conditions could also be counteracted by up-regulation of anti-apoptotic mechanisms. Annexin V staining performed on control neo and Hoxb4hiPbx1lo Scal+Lin− cells, however, showed less than 15% positivity in both conditions (data not shown, n=3 expts.).
Figure 4.
Division tracking of primitive hemopoietic cells
(A) In vitro BrdU incorporation assay performed on BM cells transduced with the indicated retroviruses and maintained in culture for 8 days. BrdU incorporation was estimated at ~80% in control and Hoxb4-transduced cells (total population). Hoxb4-transduced Sca1+ cells contained a larger proportion of units that have not engaged in DNA synthesis than comparable controls (see ratio of upper/lower right quadrants in 1st (control) versus 2nd and 3rd (Hoxb4) panels). Representative result from n=1 experiment.
(B) Cell cycle phase distributions of Sca1+Lin− cells in culture initiated with control or Hoxb4-transduced cells reinforce the results obtained in “A” since a smaller proportion of Hoxb4-transduced cells were found in S/G2/M than in control cultures. Representative result from n=3 independent experiments.
(C) CFSE labeling of Hoxb4hiPbx1lo versus control BM cells at day 3 of culture, and FACS profiles of cells analyzed at day 6 are shown. Number of events (y axis) is displayed against CFSE intensity (x axis), for both total cell populations (left panels) and Sca1+Lin− subgroups. Similar patterns of division were observed in Hoxb4hi and Hoxb4hiPbx1lo groups, namely, increased proportions of cells with high fluorescence intensity or low numbers of divisions in the Sca1+Lin− fraction, against a more Gaussian type of fluorescence distribution in the overall cell population (generation 7 peak illustrated in red for comparison), and in the control condition. When comparing Sca1+Lin− subgroups of Hoxb4hiPbx1lo cells to that of control, 95% of cells in the former group had divided ≤7 times, whereas 80% of cells in the latter group divided ≥7 times. Representative result from n=2 independent experiments performed in triplicate.
(D) Gates used to sort CSFE labeled cells on day +7 of culture. Sorted cells were transplanted as depicted in “C” and results of this experiment are reported in “E”.
(E) CFSE treated cells described in ”D” according to CFSE fluorescence intensity levels, with arbitrarily set gates of high, medium and low intensity. The CFSEhigh cell fraction represented 1–2% of cells in all conditions examined (neo, Hoxb4 or Hoxb4+a/sPbx1 transduced cells). Cell subpopulations characterized by a distinct CFSE fluorescence intensity were evaluated for repopulation activity by transplanting between 50 to 5000 cells in myeloablated recipients, which were analyzed 3 months after transplantation. Long-term repopulating cells are found in greatest proportion in the CFSEhigh fractions, irrespective of genotype. Similar results were obtained for Hoxb4 or Hoxb4+a/sPbx1 groups. N=2 independent experiments with 3 recipients transplanted per CSFE fraction with representative shown.
A CFSE high-resolution cell tracking system was used to further characterize the proliferation pattern of cultured cells. This fluorescent dye irreversibly integrates the intracellular environment and distributes evenly between daughter cells, such that with each cell division the intensity of the emitted fluorescence is precisely halved. Sub-populations of Hoxb4 overexpressing cells, with or without additional modulation of Pbx1 levels, displayed characteristic distributions of CFSE intensity following incorporation of the dye at day 3 of culture (Fig. 4C). Indeed, profiles analyzed 72 hours later demonstrated a clear shift of generation peaks to the right, or high CFSE intensity levels, for Sca1+Lin− cells (right lower panel), in contrast to a more Gaussian type of fluorescence distribution for the overall cell culture (left lower panels), again suggesting a slower pace of division in the primitive fraction of Hoxb4-a/sPbx1-transduced cells. Division profiles of Sca1+Lin− fractions of Hoxb4hiPbx1lo and neo control cells were strikingly opposed; whereas 95% of cells in the Hoxb4hiPbx1lo group had undergone less than 7 divisions, 80% of cells in the neo control group divided more than 7 times (compare red peaks in right upper and lower panels in Fig. 4C).
Functional relationship between CFSE retention and stem cell activity was sought in additional experiments. At day 7 of culture, 4 days post CFSE incorporation, sorting gates were arbitrarily set to define cell fractions with high, medium and low levels of fluorescence (Fig. 4D). In all examined populations, the boundaries for the highest CFSE levels encompassed between 1 and 2% of the total in vitro culture. Evaluation of clonogenic progenitor activity revealed that the greatest concentration of CFCs was found within the CFSEhigh fraction of Hoxb4hiPbx1lo containing cells, in a ratio of ~1:7 cells, and the frequency declined to ~1:100 cells in the low fluorescence group (supplementary Fig. 2). High progenitor content also correlated with higher CFSE fluorescent levels in control neo cultures, albeit the absolute CFC numbers in this culture were markedly reduced compared to Hoxb4 populations (supplementary Fig. 2).
Interestingly, when an identical dose of 5000 (day7) Hoxb4hiPbx1lo cells from each fluorescence sub-group was transplanted in primary mice, CFSEhigh cells were most effective in sustaining long-term hematopoietic in vivo reconstitution, as assessed by Ly5.2 reconstitution of peripheral blood at 3 months post transplant (Fig. 4E). Indeed, transplanted cells could be traced in graft recipients up to a limit dilution dose of 50 cells in the CFSEhigh fractions of cultures initiated with Hoxb4hiPbx1lo cells (not shown). It is important to note that CRU frequencies in these experiments are lower than those determined in Exp. 1 and 2 (Fig. 1B) because cultures were not maintained for 12–14 days, but rather for 6–7 days. A CRU assay performed at T+7 of Exp. 2 revealed a CRU frequency of > 1 in 3000 cells at that time point. In contrast, occasional HSC output was measured (≤ 7% of Ly 5.2 cells in PB) from the CFSEmed fraction with 5000 cells transplanted, whereas absolutely no detectable readout could be derived from the CFSElo cells. Low levels of peripheral blood reconstitution activity could also be observed among the CFSEhigh cells of the control group, but only at the highest transplantation dose of 5000 cells (see Fig. 4E).
From a different perspective, transcriptionally regulated and key cell cycle integrators namely cyclin proteins: Ccnd2 (CyclinD2), Ccnd3 (CyclinD3), Ccne2 (Cyclin E1), Cip/Kip proteins: Cdkn1a (p21Cip1/Waf1), Cdkn1b (p27Kip1), Cdkn1c (p57 Kip2), INK4 proteins: Cdkn2a (p16INK4A), Cdkn2b (p15 INK4B), Cdkn2c (p18 INK4C), Cdkn2d (p19 INK4D), c-Myc, Mxd1 (Mad1) and c-Myb, were assessed by quantitative RT-PCR performed on sorted Sca+Lin− BM cells, following a week of culture of both control and test (Hoxb4±a/sPbx1 transduced) cell fractions (Fig. 5A). A comparison of mean delta Ct values for the various transcripts (Fig. 5B) demonstrates a statistically significant 12- and 4-fold decrease in the expression of Mad1 and p27Kip1 in Hoxb4hiPbx1lo cells compared to controls (p values at <0.05 and <0.005, respectively (Fig. 5B)). To a lesser degree, c-myc and cyclin D3 expression was also different in these experiments (Fig. 5B). As a general trend and except for cyclin D3, changes in gene expression were more profound in Hoxb4hiPbx1lo cells than in populations transduced with Hoxb4 alone. Of note, in these independent triplicate cultures, we do not observe a significant decrease in Cdkn1a (p21Cip1/Waf1) [17, 19], or an important change in c-myb [24] or Ccne2 (Cyclin E1) [25] levels as may have been suggested by the literature.
Figure 5.
Expression profiles of cell cycle related genes in primitive cells
(A) Sca+Lin- BM cells were sorted on T+7 of in vitro culture for the single transduced Hoxb4-GFP cell population, the double transduced Hoxb4-GFP + a/s Pbx1-YFP fraction (see test FACS profiles on the left) as well as for control GFP + YFP cells (see control FACS profiles on the right). Retroviral infections and cultures were performed in triplicates according to our standard protocol for 5-FU BM cells as described above (n= total of 60 mice).
(B) Analysis of selected genes by Quantitative RT-PCR. Results are presented as relative fold-differences in m-RNA expression as compared to control Sca+Lin- cell fraction. For all triplicate culture conditions, genes were analyzed in duplicates, and mean delta Ct values were compared between groups and their significance assed by independent t-test. Statistically significant differences are highlighted by a symbol. ¤ p<0.05, * p<0.005. For both Cdkn1a and Cdkn1c, one of the triplicate values was disregarded in the Hoxb4 group because it was considered as an outlier (delta Ct value differed by ≥ 4 units).
(C) Average delta Ct (threshold cycle) values for all genes. As an assessment of RNA quality, Ct values for the endogenous control gene (GAPDH) ranged between 15.3 and 26. ¶ Genes were considered not to be expressed for delta Ct values > 15.
DISCUSSION
Modulation of Pbx1 levels in BM HSCs engineered to overexpress Hoxb4 confers a marked competitive in vivo repopulating advantage to these cells (see Suppl. Fig. 1), yet they remain fully responsive to the intricate interplay of intrinsic and extrinsic physiological cues that regulate the stem cell reservoir [15]. As presented in this study, perturbation of micro environmental conditions modifies the behaviour of theses cells, resulting in unrestrained symmetrical self-renewal divisions ex vivo, with a measured increment spanning several logs in magnitude, reminiscent of the HSC expansion potential displayed during ontogeny in the fetal liver between days ~9.5 and 14.5 post conception [26], when the pool reaches almost its adult and lifelong size. Such manifestations of pure symmetrical divisions of pluripotent cells are time-restricted and presumably highly regulated processes in vivo. Indeed, adult stem cells are highly preserved through asymmetrical divisions, giving rise to both an identical and a differentiated cell. Efforts to induce sustained ex vivo symmetrical divisions of adult tissue stem cells, as opposed to ES cells, remain elusive, with the exception of neural stem cells [27], and functionally defined HSCs as suggested by this work.
A crucial point to ascertain in experiments involving tissue stem cells is the irrefutable assignment of pluripotent properties. In a two-week time span, we report a 100 000-fold in vitro expansion of Hoxb4hiPbx1lo stem cells as functionally determined by CRU assays. Marked HSC enrichment in culture was evidenced by the high frequency (~1/50) at which these cells could long-term reconstitute the hematopoietic compartment of recipient hosts, as compared to the start of culture (1/500 000). According to clonality analyses, multiple doubly transduced CRUs engaged in sustained self-renewal divisions, as reflected by the pattern of retroviral genomic insertions of differentiated tissues in serially transplanted recipients (BM and thymus from Exp. 1, see Fig. 2A), or of individual methylcellulose colonies arising from BM cells of primary animals (see Exp. 3 in Fig. 2A). Indeed calculated ratios of clone recovery, ie comparing numbers of distinct Hoxb4hiPbx1lo CRUs present at cessation of long-term culture to those of input, ranged between 11–77%, testifying that a significant proportion of transduced stem cells present in vitro contributed to the expansion. In Exp. 1 for instance, based on CRU frequencies determined at T0 and corresponding double gene transfer rates assessed by epifluorescence, between 20–100 Hoxb4hiPbx1lo CRUs were present at the start of culture. At least 11 distinct clones (refer to Fig. 2A and 2B) could be identified upon genomic DNA retroviral insertion patterns studies of secondary recipients of T+12 cells, implying that > 11% (up to 11/20, or 50%) of doubly transduced stem cells initially present in vitro engaged in self-renewal, and their progeny still traced upon serial adoptive transfer. This may also reflect the heterogeneity of the in vitro stem cell population regarding self-renewal potential. Given the large volume of cells present in vitro after a 2 week expansion, only a glimpse of total clones can be identified through retroviral signatures analysis, thus estimations can only under evaluate fractions of clones that engaged in self-renewal. Convincingly though, these rates are too significant to be associated with an epiphenomenon and preclude the possibility that a single marginal stem cell aberrantly divided in vitro and contributed exclusively to the read-out of functional assessments. Moreover, if recruitment of progenitors into the stem cell compartment accounted for the marked enrichment of HSCs in vitro, one would expect to distinguish significantly more signatures or clones at the end of culture, given the higher propensity of progenitors to retroviral infection compared to stem cells, and their relative abundance at initiation of culture (>30 000 CFCs vs 20–100 CRUs in Exp. 1).
Given that cultures were initiated with at most ~20 Hoxb4hiPbx1lo CRUs (a total of 100 stem cells were present considering single, double and no gene transfer), and assuming that all these cells maintained their stemness and contributed to the increase in stem cell numbers to some extent, one would assume an average of 17 divisions in a 12-day time span, or one self-renewal division of each stem cell approximately every 17 hours. In our experimental conditions, the vast majority of cultured bone marrow cells had incorporated BrdU within 12 hours, implying that Hoxb4hiPbx1lo stem cells proliferated slower than their more differentiated progeny, but at a pace similar to their genetically non-modified counterparts [28], and interestingly, to neural stem cells in vitro [27], for which 12–14 and 24 hr doubling times have been reported respectively. Following these substantial numbers of HSC divisions in vitro, fundamental stem cell characteristics were preserved, including in vivo engraftment, expansion, maintenance (after an initial expansion phase following adoptive transfer, Hoxb4hiPbx1lo HSCs probably revert to asymmetrical divisions of maintenance, see Fig. 6 legend) and terminal differentiation, as assessed by retroviral insertion studies and immunophenotype.
Figure 6.
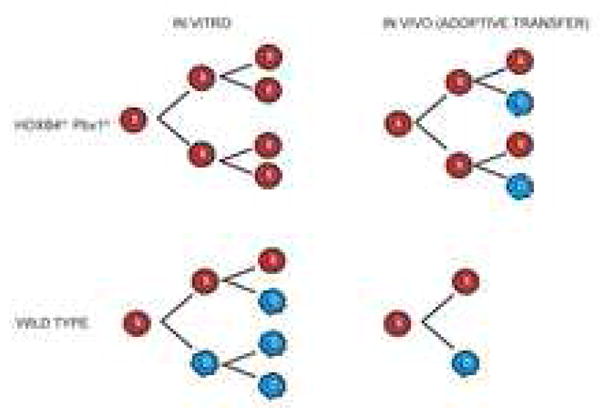
Model for in vitro and in vivo self-renewal division of Hoxb4hiPbx1lo HSCs
Hoxb4 and Pbx1 preferentially alter stem cell fate in vitro with increased probability of symmetrical self-renewal divisions of expansion, for the vast majority of HSCs present in culture, rather than accelerating the division rates of a few stem cells. Following a brief period of expansion in vivo post adoptive transfer, they can revert to asymmetrical divisions of maintenance and respond to physiological cues of the niche.
Since multiple stem cells were recruited in the in vitro expansion compartment, seemingly without an accelerated proliferative impetus, we bring forward the hypothesis that Hoxb4 and Pbx1 mainly alter HSC cell fate decisions, and increase the probability of preserving stemness in both daughter cells upon division, in order to explain the considerable HSC expansion documented in these experiments. Undeniably, a mitotic signal must be integrated for a cell to self-renew. By examining DNA synthesis, cell cycle phase distributions and tracking cell divisions in our experimental setting, Hoxb4hiPbx1lo HSCs do divide, but they are not highly proliferative, and alternate mechanisms must be considered to explain the high frequency of self-renewal documented herein. Of note, apoptosis rates, as measured by Anexin-V studies, were comparable between control and Hoxb4hiPbx1lo Sca+Lin- cells. It must be emphasized that CFSEmed BM cells, which had undergone ≥4 divisions in 72 hours, could also be traced in recipients mice (≤7% peripheral blood reconstitution). Although not as enriched in CRUs as the fraction of cells that highly retained the fluorescent dye (in the range of 1/5000 vs 1/50 for CFSEhigh cells), CFSEmed BM cells comprised 30–40% of T+7 culture, thus the absolute number of stem cells in this compartment is not negligible. This corroborates the emerging concept that engrafment potential can be preserved upon stem cell division in vitro [29], perhaps contrary to initial observations [30, 31]. Moreover, this sustains the idea that in vitro symmetrical self-renewal divisions are not restricted exclusively to rigorously defined stem cells, but may also occur in early progenitors, as indicated by the increment of multipotent precursors and highly proliferative colonies in culture (Fig. 1, lowest impact of Hoxb4 over-expresion on differentiated cells), and as previously reported by others [6]. Our results also demonstrate that CFCs division kinetics mirrors that of CRUs (Suppl Fig2). As opposed to asymmetrical divisions then, symmetry preserves cell fate or impedes cellular diversity, as can be strikingly evident by simple histological examination of Hoxb4hiPbx1lo cell cultures (Fig. 1C). Fascinatingly, the literature provides with other elegant example of in vitro symmetrical divisions of early progenitors in other cell types [32].
Altogether, our results support the established link between cell cycle modulation and self-renewal [e.g., p21, p27, etc., [16, 18–20, 25, 33, 34] see also [33]], and follow the postulate that cellular identity may dictate the pattern of progression through the cycle. Quantification analyses of RNA transcripts in the primitive hematopoietic compartment show a clear decrease in Mad1 and p27Kip1 and a rise in c-myc in Hoxb4hiPbx1lo cells compared to controls. Most interestingly, recent work by Walkley et al. [34] showed that Mad1 (inhibitor of c-myc) and p27Kip1 compound homozygous null mice display an increase in HSC frequency and pool size. Notably, Hoxb4hiPbx1lo HSC compartment is not expanded in vivo (Suppl. Fig. 1) suggesting that either non-cell autonomous effect are in place in compound Mad1/p27Kip1 null mice or that Hoxb4/Pbx1 regulate additional pathway(s) in expanded HSCs. Generation of the pancreatic beta cell mass is also reported to be modulated by p27Kip1 [35], and recently Notch1 signalling has been linked to p27Kip1 degradation [36]. Notably, c-myc has been assigned a role in self-renewal [37] and overall chromatin structure [38]. Moreover, the documented decrease in Cyclin D3 in cultured cells sustaining self-renewal parallels the findings of Cyclin D3 null mice, reported to have a normal stem and progenitor pool, but a differentiation arrest [39].
What then defines the niche, or the proper combination of cell fate determinants that enables and sustains symmetrical self-renewal divisions? Many eloquent examples attempt to dissect this complex question in HSCs (BMP, Gfi-1, Ezh2, Smad7, Mph/Rae, and others) [40–44] and in ES cells (Oct4, Nanog, Sox2, reviewed in [45]). Part of the answer may reside in proper chromatin configuration, integration of specific proliferation, differentiation, senescence or apoptosis signals, as well as intracellular segregation of key regulator molecules. Nonetheless, a role for homeotic genes in cell fate decisions is indisputable, and perturbations in the C. elegans hox-meis-pbx complex were recently shown to alter the outcome of cellular division [46]. Data from foetal stromal cells and tissue stem cell profiling may continue to provide interesting candidates. For now, our data supports currently proposed patterns of lengthy cell cycle progression for hematopoietic stem cells [12, 29, 47], and agrees with the idea that unrestricted proliferation may override stemness. We have not assessed the length of time extensive self-renewal can be sustained in vitro, but HSC activity is still functionally detectable at 21–28 days of culture in our system (data not shown).
As already mentioned in the result section, some degree of skewing towards the myeloid lineage was observed in vivo upon transplantation of BM Hoxb4hiPbx1lo long term culture cells, and as reported, a dosage effect of transcription factor may be incriminated to explain this observation [23], and cell type specific differential transcription of the integrated provirus is also possible. As an alternate mechanism, ES cells that are highly passaged in vitro start to display impaired differentiation, presumably through genetic and epigenetic changes [48]. In our prolonged in vitro cultures, we have also sporadically documented the generation of leukemic HSCs (HSC- L), in a ratio inferior to normal HSCs [1/2500 (HSC-L) vs 1/50 (HSC)] after 2 weeks in culture, as assessed by standard CRU assays (data not shown), resulting in acute myeloid leukemia with short latency in primary and secondary recipients. Clonality analyses (based on Hoxb4 integrations) of BM cells from animals that succumbed to leukemia revealed that a maximum of 2 clones contributed to the disease (see Suppl. Fig. 4), confirming the low incidence of the event. More strikingly, whereas clones recovered from healthy mice harboured between 1.5–2.6 integrations per clone (see Suppl. Table 1 for details), leukemic clones carried 10–11 of these integrations (Suppl. Fig. 4), providing strong evidence to incriminate insertional mutagenesis as a major culprit in this process (statistically significant difference, p<0.0001). Accordingly, there was an association between retroviral transduction rates and leukemogenesis, with only one reported leukemia among 138 recipients in experiment 3, where double gene transfer was evaluated at 4%. To strengthen the argument, in vitro immortalization of primary hematopoietic cells by insertional mutagenesis, and a correlation to the number of integrations, has been rigorously documented [49], and in vitro expansion of tissue stem cells [27] in the absence of retroviral gene transfer was not associated with malignant transformation in vivo.
During a 16-month period, Hoxb4hiPbx1lo HSCs were subjected to a considerable proliferation pressure to achieve a cumulative 1010-fold in vitro and in vivo expansion. Both, the cytokine-promoted proliferation in vitro [50] and repopulation of host following transplantation [51, 52] have been associated with telomere shortening implicated in limiting the replicative lifespan of somatic cells. We did not assess telomere length in these cells, although ongoing studies (P. Lansdorp, Vancouver, BC) will determine the impact of Hoxb4 over expression on telomere length in transduced HSCs. Central to the theme of the presented work however, remains the demonstration that pure symmetrical self-renewal divisions can be sustained in vitro under appropriate conditions, and that supra-physiological ex vivo expansions of tissue stem cells for therapeutic purposes should be envisioned with caution, even in retrovirus-free systems. We propose this in vitro model of stem cell enrichment as a valuable genetic tool to gain further insight into the self-renewal machinery, for instance through the isolation of protein complexes, to better dissect the critical interplay between cell fate determinants and cell cycle regulators, and to study other stem cell biological properties such as replicative senescence.
EXPERIMENTAL PROCEDURES
Animals
(C57Bl/6J x C3H/HeJ)F1 or W41 recipients (expt. 1) and (C57Bl/6Ly-Pep3b x C3H/HeJ)F1 congenic donor mice were bred at a specific pathogen free (SPF) animal facility at the Institute for Research in Immunology and Cancer in Montreal. All animals were housed in ventilated cages and provided with sterilized food and acidified water.
Retroviral vectors
Generation of the MSCV-IRES-GFP and MSCV-Hoxb4-IRES-GFP (Antonchuk et al., 2001), MSCV-a/s Pbx1b-PGK-YFP [15], MSCV-PGK-neo and MSCV-Hoxb4-PGK-neo [3], and MSCV-a/s Pbx1b-PGK-puro [53] vectors were described before. For MSCV-PBX1b-PGK-YFP, a 1.4 kb fragment encoding Pbx1b ORF was blunted and subcloned into HpaI site of MSCV-PGK-YFP [7].
Retroviral infection and transplantation of primary bone marrow cells
Generation of retrovirus producing GP+E-86 cells, and single or double infections of bone marrow cells were performed as previously described [7]. Upon recovery from co-culture with retroviral producers, the proportions of transduced (GFP+, YFP+, or GFP+/YFP+) cells were determined by flow cytometry using MoFlo (Cytomation, Fort Collins, CO) or BD LSR II System (BD biosciences, San Jose, California.
In vitro culture and transplantation of primary bone marrow cells
Cultures comprised of bone marrow cell populations harvested from either GFP, or combined Hoxb4 + a/s Pbx1 retroviral producers, were immediately initiated after co-culture at a density of 3 x 10⁵ cells/mL, in media supplemented with 15% FCS, 6 ng/mL of IL-3, 10 ng/mL of IL-6, 100 ng/mL of SCF, 50 μg/mL of gentamycine and 10 μg/mL of ciprofloxacin. At 3 day-intervals, cells were counted and diluted with fresh media so that cell density was maintained between 3 x 10⁵ and 2 x 10⁶ cells/mL. Cell aliquots were taken at regular intervals to determine total cell counts and progenitor frequencies as assessed by plating cells in methycelullose containing 10 ng/mL of IL-3, 10 ng/mL of IL-6, 50 ng/mL of SCF, and 5U/mL of Epo and scoring colonies on day 7. Cytokines used in these experiments were prepared at IRIC as COS-cell supernatants. All other media components were purchased from GIBCO/Invitrogen Corp. (Burlington, ON, Canada).
Flow cytometry
Cells isolated from BM, spleen and thymus of transplantation chimeras were resuspended in PBS with 2% FCS and allophycocyanin (APC)-conjugated antibodies recognizing Mac-1, or B220, or CD8 cell surface markers, or phycoerithryn-Cy7 (PECy7)-conjugated anti-CD4 antibody (Pharmingen, Mississauga, ON) as previously described [15]. Data were acquired using BD LSR II flow cytometer (BD Biosciences, San Jose, CA) and analyzed using FlowJo software (Tree Star Inc., Ashland, OR).
CRU assays
To determine the contributions of the transplanted transduced (GFP+, YFP+, and GFP+/YFP+) HSC to hemopoietic reconstitution at various intervals post transplantation, ~50 μL of blood obtained from the tail vein were incubated with excess ammonium chloride (StemCell Technologies, Vancouver, BC) to lyse erythrocytes, and the proportions of GFP+, YFP+, and GFP+/YFP+ blood cells were determined by flow cytometry. Mice that had greater than 2% GFP+/YFP+ cells in both, myeloid (SSChiFSClow) and lymphoid (SSClowFSChi) subpopulations were considered to be repopulated with at least 1 Hoxb4+a/sPbx1-transduced HSC. Fidelity of discrimination between myeloid and lymphoid cells was verified using cell surface staining to detect lineage specific markers (Mac-1 vs B-220). HSC numbers in primary recipients were evaluated as described [3] using a limiting dilution transplantation-based assay (CRU assay), that detects cells with competitive, long-term lympho-myeloid repopulation capacity [21].
CFC assays and in vitro expansion of myeloid clones
The frequencies of myeloid progenitors in BM and spleen cell populations of primary and secondary recipients were determined as described (Thorsteinsdottir et al., 2002). To generate clonal myeloid cell populations, well isolated multilineage mixed colonies were transferred from methylcellulose to liquid cultures and expanded for 14 days in IMDM, supplemented with 10 % FSC, IL-3 (10 ng/mL), IL-6 (10 ng/mL), IL-11 (100 ng/mL), SCF (100 ng/mL), and 10−5M β-mercaptoethanol
Southern blot analysis of genomic DNA
High molecular weight DNA from the BM, spleen and thymus of transplantation chimeras, from myeloid clones and from lineage marker specific sorted cells was digested as indicated in figure legends. Probes used were 600 bp (nt 930–1525 of the ORF) Pvu II fragment of PBX1, 490 bp Sal I – Pml I fragment of HOXB4 cDNA, and 730 bp full length YFP cDNA.
BrdU incorporation assay
BrdU incorporation studies of in vitro cultured BM cells were performed using the BD Pharmingen APC BrdU Flow Kit (BD Pharmingen, Mississauga, ON) as recommended by manufacturer. Briefly, one week upon removal from retroviral producer cells, aliquots of BM cells transduced with either MSCV-Hoxb4-IRES-GFP, MSCV-Hoxb4-PGK-Neo or MSCV-PGK-Neo vectors were incubated at a density of 1 x 10⁶ cells/mL in culture media containing 10 μM BrdU for 12 hours. Cells were first stained with R-Phycoerythrin (PE)-conjugated antibody specific for the Sca1 surface antigen (BD Pharmingen, Mississauga, ON), and then treated according to the manufacturer guidelines. Flow cytometric ata were acquired and analyzed as specified above.
Cell cycle analysis using Hoechst 33342 dye
After one week in culture, aliquots of BM cells transduced with either MSCV-Hoxb4-PGK-Neo or MSCV-PGK-Neo vectors were first incubated in media (DMEM+FCS2%+10mM Hepes pH 7.4) containing 5 μg/mL of Hoechst 33342 (Molecular Probe, Invitrogen) as suggested by manufacturer, and then stained using PE-conjugated anti-Sca1 and APC-conjugated anti-GR1 antibodies. 1,000,000 events per condition were acquired using UV-excitation source equipped BD LSR II flow cytometer (BD Biosciences, San Jose, CA) and data for both total and Sca1+Gr1− gated cell populations were analyzed using ModFit software (Verity Software House, Topsham, Maine).
CFSE cell tracking studies
In vitro cultures of BM cells (C57Bl/6J-Ly5.2) transduced with either MSCV-Hoxb4-PGK-Neo, MSCV-Hoxb4-PGK-Neo+MSCV-a/s PBX1b-PGK-Puro, or MSCV-PGK-Neo were initiated following our standard protocol. Three days after harvest from retroviral producer cells, aliquots of cells were resuspended at a final density of 1x 10⁶ cells/mL in prewarmed PBS containing 0.1% BSA and 10 μM CFSE (carboxyfluorescein diacetate succinimidyl ester, CellTrace™ CFSE Cell Proliferation Kit, Molecular Probes/Invitrogen, Burlington, ON), and were then treated according to the manufacturer guidelines and published literature [31, 54]. Following CFSE uptake, cells were washed 3 X with fresh BM media, replated in the same media at a density of 5 x 10⁵ cell/mL, and incubated for 4 additional days. The CFSE fluorescence was determined immediately after the treatment, and after 3-day culture. To assess mean CFSE fluorescence intensity in the primitive cell subpopulations, aliquots of cultures were stained using PE-conjugated anti Sca1 and APC-conjugated anti GR1 antibodies. Data were acquired using BD LSR II System (BD Biosciences, San Jose, California), and generation peaks were determined using ModFit software (Verity Software House, Topsham, Maine). On the 4th day of CFSE incorporation, cells were sorted (BD FACSAria, BD Biosciences, San Jose, California) according to arbitrarily set gates encompassing high, medium and low levels of CFSE fluorescence intensity (see Fig 3D). Predetermined cell numbers were collected in individual tubes containing pure FCS. Cells were then pelleted and resuspended in DMEM + FCS 2% and content of each tube singly transplanted in a previously irradiated (800 cGy) mouse recipient (C57Bl/6J-Ly5.1-Pep3b). Peripheral blood reconstitution of animals was evaluated 3 months post transplantation using APC-conjugated anti-Ly5.2 antibodies described above.
Quantitative RT-PCR
Total RNA was isolated using Trizol ™ according to manufacturer’s protocol (Invitrogen). RNA was treated with DnaseI (Invitrogen) before cDNA synthesis. Reverse transcription of total RNA was performed using the MMLV-RT and random hexamers according to macufactuer’s protocol (Invitrogen). The ABI Gene Expression Assay was performed to measure gene expression levels (c-Myc, c-Myb and Hoxb4, see suppl Table 1) using primer and probe sets from Applied Biosystems (ABI Assays on Demand, http://www.appliedbiosystems.com/). PCR reactions for 384 well plate formats were performed using 2 μl of cDNA samples (10–40 ng), 5 μl of the TaqMan Universal PCR Master Mix (Applied Biosystems, CA) and 0.5 μl of the TaqMan® Gene Expression Assays (20X) in a total volume of 10 μl. Gene expression levels were also measured (see suppl Table 1) by custom primers and TaqMan probes designed (Dr Sylvain Meloche laboratory) using the online version of PrimerQuest software (http://scitools.idtdna.com/Primerquest/). Default parameters for real time PRC were used to select the best primers and probes. In order to amplify only the cDNA, primers were located in different exons or in the splicing junction between two exons. PCR reactions were performed using 2 μl of cDNA samples (10–40 ng), 5 μl of the TaqMan PCR Master Mix (Applied Biosystems, CA), 10 pmol of each primer and 5 pmol of the TaqMan probe in a total volume of 10 μl. The ABI PRISM® 7900HT Sequence Detection System (Applied Biosystems) was used to detect the amplification level and was programmed to an initial step of 10 minutes at 95°C, followed by 50 cycles of 15 seconds at 95°C and 1 minute at 60°C. All reactions were run in duplicate and the average values were used for quantification. GAPDH (glyceraldehyde-3-phosphate dehydrogenase) was used as endogenous control. The relative quantification of target genes was determined by using the ΔΔCT method. Briefly, the Ct (threshold cycle) values of target genes were normalized to the endogenous control gene (GAPDH) (ΔCT = Ct target − Ct GAPDH) and compared with a calibrator (control Sca+Lin- cells): ΔΔCT = ΔCt Sample −ΔCt Calibrator. Relative expression (RQ) was calculated using the Sequence Detection System (SDS) 2.2.2 software (Applied Biosystems) and the formula RQ = 2−ΔΔCT.
Supplementary Material
Acknowledgments
The authors acknowledge Amélie Faubert for her contribution to cell cycle and cell tracking studies. The constant help and support of Simon Girard and Nadine Mayotte was greatly appreciated. We also thank Mélanie Fréchette for her expertise and help with the maintenance and manipulation of the animals, Christian Charbonneau from the imagery plateform, Danièle Gagné from the flow cytometry platform, as well as Pierre Chagnon and Raphaelle Lambert from IRIC genomic platform for their expertise with quantitative RT-PCR. We would also acknowledge Dr. Trang Hoang for discussions and critical comments on the manuscript.
This work was supported by grants from the NIH to G.S., R.K.H. and Norman Iscove. S.C. was a recipient of a National Cancer Institute of Canada Post-MD Fellowship Award and now holds a CIHR Clinician-Scientist phase I Fellowship. G.S. holds a Canada Research Chair in Molecular Genetics of Stem Cells, and is a scholar of the Leukemia Lymphoma Society of America.
Footnotes
Publisher's Disclaimer: This is a PDF file of an unedited manuscript that has been accepted for publication. As a service to our customers we are providing this early version of the manuscript. The manuscript will undergo copyediting, typesetting, and review of the resulting proof before it is published in its final citable form. Please note that during the production process errors may be discovered which could affect the content, and all legal disclaimers that apply to the journal pertain.
References
- 1.Moore KA, Lemischka IR. Stem cells and their niches. Science. 2006;311:1880–1885. doi: 10.1126/science.1110542. [DOI] [PubMed] [Google Scholar]
- 2.Pawliuk R, Eaves C, Humphries RK. Evidence of both ontogeny and transplant dose-regulated expansion of hematopoietic stem cells in vivo. Blood. 1996;88:2852–2858. [PubMed] [Google Scholar]
- 3.Sauvageau G, Thorsteinsdottir U, Eaves CJ, et al. Overexpression of HOXB4 in hematopoietic cells causes the selective expansion of more primitive populations in vitro and in vivo. Genes Dev. 1995;9:1753–1765. doi: 10.1101/gad.9.14.1753. [DOI] [PubMed] [Google Scholar]
- 4.Iscove NN, Nawa K. Hematopoietic stem cells expand during serial transplantation in vivo without apparent exhaustion. Curr Biol. 1997;7:805–808. doi: 10.1016/s0960-9822(06)00341-1. [DOI] [PubMed] [Google Scholar]
- 5.Thorsteinsdottir U, Sauvageau G, Humphries RK. Enhanced in vivo regenerative potential of HOXB4-transduced hematopoietic stem cells with regulation of their pool size. Blood. 1999;94:2605–2612. [PubMed] [Google Scholar]
- 6.Antonchuk J, Sauvageau G, Humphries RK. HOXB4-induced expansion of adult hematopoietic stem cells ex vivo. Cell. 2002;109:39–45. doi: 10.1016/s0092-8674(02)00697-9. [DOI] [PubMed] [Google Scholar]
- 7.Krosl J, Austin P, Beslu N, Kroon E, Humphries RK, Sauvageau G. In vitro expansion of hematopoietic stem cells by recombinant TAT-HOXB4 protein. Nat Med. 2003;9:1428–1432. doi: 10.1038/nm951. [DOI] [PubMed] [Google Scholar]
- 8.Amsellem S, Pflumio F, Bardinet D, et al. Ex vivo expansion of human hematopoietic stem cells by direct delivery of the HOXB4 homeoprotein. Nat Med. 2003;9:1423–1427. doi: 10.1038/nm953. [DOI] [PubMed] [Google Scholar]
- 9.Beslu N, Krosl J, Laurin M, Mayotte N, Humphries KR, Sauvageau G. Molecular interactions involved in HOXB4-induced activation of HSC self-renewal. Blood. 2004;104:2307–2314. doi: 10.1182/blood-2004-04-1653. [DOI] [PubMed] [Google Scholar]
- 10.Chang CP, Shen WF, Rozenfeld S, Lawrence HJ, Largman C, Cleary ML. Pbx proteins display hexapeptide-dependent cooperative DNA binding with a subset of Hox proteins. Genes Dev. 1995;9:663–674. doi: 10.1101/gad.9.6.663. [DOI] [PubMed] [Google Scholar]
- 11.Popperl H, Bienz M, Studer M, et al. Segmental expression of Hoxb-1 is controlled by a highly conserved autoregulatory loop dependent upon exd/pbx. Cell. 1995;81:1031–1042. doi: 10.1016/s0092-8674(05)80008-x. [DOI] [PubMed] [Google Scholar]
- 12.Nygren JM, Bryder D, Jacobsen SE. Prolonged cell cycle transit is a defining and developmentally conserved hemopoietic stem cell property. J Immunol. 2006;177:201–208. doi: 10.4049/jimmunol.177.1.201. [DOI] [PubMed] [Google Scholar]
- 13.Azpiazu N, Morata G. Functional and regulatory interactions between Hox and extradenticle genes. Genes Dev. 1998;12:261–273. doi: 10.1101/gad.12.2.261. [DOI] [PMC free article] [PubMed] [Google Scholar]
- 14.Medina-Martinez O, Ramirez-Solis R. In vivo mutagenesis of the Hoxb8 hexapeptide domain leads to dominant homeotic transformations that mimic the loss-of-function mutations in genes of the Hoxb cluster. Dev Biol. 2003;264:77–90. doi: 10.1016/j.ydbio.2003.07.020. [DOI] [PubMed] [Google Scholar]
- 15.Krosl J, Beslu N, Mayotte N, Humphries RK, Sauvageau G. The competitive nature of HOXB4-transduced HSC is limited by PBX1: the generation of ultra-competitive stem cells retaining full differentiation potential. Immunity. 2003;18:561–571. doi: 10.1016/s1074-7613(03)00090-6. [DOI] [PubMed] [Google Scholar]
- 16.Yu H, Yuan Y, Shen H, Cheng T. Hematopoietic stem cell exhaustion impacted by p18 INK4C and p21 Cip1/Waf1 in opposite manners. Blood. 2006;107:1200–1206. doi: 10.1182/blood-2005-02-0685. [DOI] [PMC free article] [PubMed] [Google Scholar]
- 17.Miyake N, Brun AC, Magnusson M, Miyake K, Scadden DT, Karlsson S. HOXB4-induced self-renewal of hematopoietic stem cells is significantly enhanced by p21 deficiency. Stem Cells. 2005 doi: 10.1634/stemcells.2005-0328. [DOI] [PubMed] [Google Scholar]
- 18.Cheng T, Rodrigues N, Dombkowski D, Stier S, Scadden DT. Stem cell repopulation efficiency but not pool size is governed by p27(kip1) Nat Med. 2000;6:1235–1240. doi: 10.1038/81335. [DOI] [PubMed] [Google Scholar]
- 19.Cheng T, Rodrigues N, Shen H, et al. Hematopoietic stem cell quiescence maintained by p21cip1/waf1. Science. 2000;287:1804–1808. doi: 10.1126/science.287.5459.1804. [DOI] [PubMed] [Google Scholar]
- 20.Zhang J, Attar E, Cohen K, Crumpacker C, Scadden D. Silencing p21(Waf1/Cip1/Sdi1) expression increases gene transduction efficiency in primitive human hematopoietic cells. Gene Ther. 2005;12:1444–1452. doi: 10.1038/sj.gt.3302544. [DOI] [PubMed] [Google Scholar]
- 21.Szilvassy SJ, Humphries RK, Lansdorp PM, Eaves AC, Eaves CJ. Quantitative assay for totipotent reconstituting hematopoietic stem cells by a competitive repopulation strategy. Proc Natl Acad Sci U S A. 1990;87:8736–8740. doi: 10.1073/pnas.87.22.8736. [DOI] [PMC free article] [PubMed] [Google Scholar]
- 22.Thorsteinsdottir U, Mamo A, Kroon E, et al. Overexpression of the myeloid leukemia-associated Hoxa9 gene in bone marrow cells induces stem cell expansion. Blood. 2002;99:121–129. doi: 10.1182/blood.v99.1.121. [DOI] [PubMed] [Google Scholar]
- 23.Schiedlmeier B, Klump H, Will E, et al. High-level ectopic HOXB4 expression confers a profound in vivo competitive growth advantage on human cord blood CD34+ cells, but impairs lymphomyeloid differentiation. Blood. 2003;101:1759–1768. doi: 10.1182/blood-2002-03-0767. [DOI] [PubMed] [Google Scholar]
- 24.Sakamoto H, Dai G, Tsujino K, et al. Proper levels of c-Myb are discretely defined at distinct steps of hematopoietic cell development. Blood. 2006;108:896–903. doi: 10.1182/blood-2005-09-3846. [DOI] [PubMed] [Google Scholar]
- 25.Berger C, Pallavi SK, Prasad M, Shashidhara LS, Technau GM. A critical role for cyclin E in cell fate determination in the central nervous system of Drosophila melanogaster. Nat Cell Biol. 2005;7:56–62. doi: 10.1038/ncb1203. [DOI] [PubMed] [Google Scholar]
- 26.Gekas C, Dieterlen-Lievre F, Orkin SH, Mikkola HK. The placenta is a niche for hematopoietic stem cells. Dev Cell. 2005;8:365–375. doi: 10.1016/j.devcel.2004.12.016. [DOI] [PubMed] [Google Scholar]
- 27.Conti L, Pollard SM, Gorba T, et al. Niche-independent symmetrical self-renewal of a mammalian tissue stem cell. PLoS Biol. 2005;3:e283. doi: 10.1371/journal.pbio.0030283. [DOI] [PMC free article] [PubMed] [Google Scholar]
- 28.Uchida N, Dykstra B, Lyons KJ, Leung FY, Eaves CJ. Different in vivo repopulating activities of purified hematopoietic stem cells before and after being stimulated to divide in vitro with the same kinetics. Exp Hematol. 2003;31:1338–1347. doi: 10.1016/j.exphem.2003.09.001. [DOI] [PubMed] [Google Scholar]
- 29.Dykstra B, Ramunas J, Kent D, et al. High-resolution video monitoring of hematopoietic stem cells cultured in single-cell arrays identifies new features of self-renewal. Proc Natl Acad Sci U S A. 2006;103:8185–8190. doi: 10.1073/pnas.0602548103. [DOI] [PMC free article] [PubMed] [Google Scholar]
- 30.Peters SO, Kittler EL, Ramshaw HS, Quesenberry PJ. Ex vivo expansion of murine marrow cells with interleukin-3 (IL-3), IL-6, IL-11, and stem cell factor leads to impaired engraftment in irradiated hosts. Blood. 1996;87:30–37. [PubMed] [Google Scholar]
- 31.Oostendorp RA, Audet J, Eaves CJ. High-resolution tracking of cell division suggests similar cell cycle kinetics of hematopoietic stem cells stimulated in vitro and in vivo. Blood. 2000;95:855–862. [PubMed] [Google Scholar]
- 32.Shinin V, Gayraud-Morel B, Gomes D, Tajbakhsh S. Asymmetric division and cosegregation of template DNA strands in adult muscle satellite cells. Nat Cell Biol. 2006;8:677–687. doi: 10.1038/ncb1425. [DOI] [PubMed] [Google Scholar]
- 33.Yuan Y, Shen H, Franklin DS, Scadden DT, Cheng T. In vivo self-renewing divisions of haematopoietic stem cells are increased in the absence of the early G1-phase inhibitor, p18INK4C. Nat Cell Biol. 2004;6:436–442. doi: 10.1038/ncb1126. [DOI] [PubMed] [Google Scholar]
- 34.Walkley CR, Fero ML, Chien WM, Purton LE, McArthur GA. Negative cell-cycle regulators cooperatively control self-renewal and differentiation of haematopoietic stem cells. Nat Cell Biol. 2005;7:172–178. doi: 10.1038/ncb1214. [DOI] [PubMed] [Google Scholar]
- 35.Georgia S, Bhushan A. p27 Regulates the Transition of {beta}-Cells From Quiescence to Proliferation. Diabetes. 2006;55:2950–2956. doi: 10.2337/db06-0249. [DOI] [PubMed] [Google Scholar]
- 36.Sarmento LM, Huang H, Limon A, et al. Notch1 modulates timing of G1-S progression by inducing SKP2 transcription and p27 Kip1 degradation. J Exp Med. 2005;202:157–168. doi: 10.1084/jem.20050559. [DOI] [PMC free article] [PubMed] [Google Scholar]
- 37.Cartwright P, McLean C, Sheppard A, Rivett D, Jones K, Dalton S. LIF/STAT3 controls ES cell self-renewal and pluripotency by a Myc-dependent mechanism. Development. 2005;132:885–896. doi: 10.1242/dev.01670. [DOI] [PubMed] [Google Scholar]
- 38.Knoepfler PS, Zhang XY, Cheng PF, Gafken PR, McMahon SB, Eisenman RN. Myc influences global chromatin structure. Embo J. 2006;25:2723–2734. doi: 10.1038/sj.emboj.7601152. [DOI] [PMC free article] [PubMed] [Google Scholar]
- 39.Sicinska E, Lee YM, Gits J, et al. Essential role for cyclin d3 in granulocyte colony-stimulating factor-driven expansion of neutrophil granulocytes. Mol Cell Biol. 2006;26:8052–8060. doi: 10.1128/MCB.00800-06. [DOI] [PMC free article] [PubMed] [Google Scholar]
- 40.Ying QL, Nichols J, Chambers I, Smith A. BMP induction of Id proteins suppresses differentiation and sustains embryonic stem cell self-renewal in collaboration with STAT3. Cell. 2003;115:281–292. doi: 10.1016/s0092-8674(03)00847-x. [DOI] [PubMed] [Google Scholar]
- 41.Hock H, Hamblen MJ, Rooke HM, et al. Gfi-1 restricts proliferation and preserves functional integrity of haematopoietic stem cells. Nature. 2004;431:1002–1007. doi: 10.1038/nature02994. [DOI] [PubMed] [Google Scholar]
- 42.Kamminga LM, Bystrykh LV, de Boer A, et al. The Polycomb group gene Ezh2 prevents hematopoietic stem cell exhaustion. Blood. 2006;107:2170–2179. doi: 10.1182/blood-2005-09-3585. [DOI] [PMC free article] [PubMed] [Google Scholar]
- 43.Blank U, Karlsson G, Moody JL, et al. Smad7 promotes self-renewal of hematopoietic stem cells in vivo. Blood. 2006 doi: 10.1182/blood-2006-02-005611. [DOI] [PubMed] [Google Scholar]
- 44.Kim JY, Sawada A, Tokimasa S, et al. Defective long-term repopulating ability in hematopoietic stem cells lacking the Polycomb-group gene rae28. Eur J Haematol. 2004;73:75–84. doi: 10.1111/j.1600-0609.2004.00268.x. [DOI] [PubMed] [Google Scholar]
- 45.Rao S, Orkin SH. Unraveling the transcriptional network controlling ES cell pluripotency. Genome Biol. 2006;7:230. doi: 10.1186/gb-2006-7-8-230. [DOI] [PMC free article] [PubMed] [Google Scholar]
- 46.Arata Y, Kouike H, Zhang Y, Herman MA, Okano H, Sawa H. Wnt signaling and a Hox protein cooperatively regulate psa-3/Meis to determine daughter cell fate after asymmetric cell division in C. elegans. Dev Cell. 2006;11:105–115. doi: 10.1016/j.devcel.2006.04.020. [DOI] [PubMed] [Google Scholar]
- 47.Calegari F, Haubensak W, Haffner C, Huttner WB. Selective lengthening of the cell cycle in the neurogenic subpopulation of neural progenitor cells during mouse brain development. J Neurosci. 2005;25:6533–6538. doi: 10.1523/JNEUROSCI.0778-05.2005. [DOI] [PMC free article] [PubMed] [Google Scholar]
- 48.Maitra A, Arking DE, Shivapurkar N, et al. Genomic alterations in cultured human embryonic stem cells. Nat Genet. 2005;37:1099–1103. doi: 10.1038/ng1631. [DOI] [PubMed] [Google Scholar]
- 49.Du Y, Jenkins NA, Copeland NG. Insertional mutagenesis identifies genes that promote the immortalization of primary bone marrow progenitor cells. Blood. 2005;106:3932–3939. doi: 10.1182/blood-2005-03-1113. [DOI] [PMC free article] [PubMed] [Google Scholar]
- 50.Vaziri H, Dragowska W, Allsopp RC, Thomas TE, Harley CB, Lansdorp PM. Evidence for a mitotic clock in human hematopoietic stem cells: loss of telomeric DNA with age. Proc Natl Acad Sci U S A. 1994;91:9857–9860. doi: 10.1073/pnas.91.21.9857. [DOI] [PMC free article] [PubMed] [Google Scholar]
- 51.Notaro R, Cimmino A, Tabarini D, Rotoli B, Luzzatto L. In vivo telomere dynamics of human hematopoietic stem cells. Proc Natl Acad Sci U S A. 1997;94:13782–13785. doi: 10.1073/pnas.94.25.13782. [DOI] [PMC free article] [PubMed] [Google Scholar]
- 52.Allsopp RC, Cheshier S, Weissman IL. Telomere shortening accompanies increased cell cycle activity during serial transplantation of hematopoietic stem cells. J Exp Med. 2001;193:917–924. doi: 10.1084/jem.193.8.917. [DOI] [PMC free article] [PubMed] [Google Scholar]
- 53.Krosl J, Baban S, Krosl G, Rozenfeld S, Largman C, Sauvageau G. Cellular proliferation and transformation induced by HOXB4 and HOXB3 proteins involves cooperation with PBX1. Oncogene. 1998;16:3403–3412. doi: 10.1038/sj.onc.1201883. [DOI] [PubMed] [Google Scholar]
- 54.Lyons AB, Parish CR. Determination of lymphocyte division by flow cytometry. J Immunol Methods. 1994;171:131–137. doi: 10.1016/0022-1759(94)90236-4. [DOI] [PubMed] [Google Scholar]
Associated Data
This section collects any data citations, data availability statements, or supplementary materials included in this article.