

Abstract
A large number of proteins are sufficiently unstable that their full 3D structure cannot be resolved. The origins of this intrinsic disorder are not well understood, but its ubiquitous presence undercuts the principle that a protein's structure determines its function. Here we present a quantitative theory that makes predictions regarding the role of intrinsic disorder in protein structure and function. In particular, we discuss the implications of analytical solutions of a series of fundamental thermodynamic models of protein interactions in which disordered proteins are characterized by positive folding free energies. We validate our predictions by assigning protein function by using the gene ontology classification—in which “protein binding”, “catalytic activity”, and “transcription regulator activity” are the three largest functional categories—and by performing genome-wide surveys of both the amount of disorder in these functional classes and binding affinities for both prokaryotic and eukaryotic genomes. Specifically, without assuming any a priori structure–function relationship, the theory predicts that both catalytic and low-affinity binding (Kd ≳10−7 M) proteins prefer ordered structures, whereas only high-affinity binding proteins (found mostly in eukaryotes) can tolerate disorder. Relevant to both transcription and signal transduction, the theory also explains how increasing disorder can tune the binding affinity to maximize the specificity of promiscuous interactions. Collectively, these studies provide insight into how natural selection acts on folding stability to optimize protein function.
Keywords: binding, catalysis, intrinsic disorder, specificity, transcription
Most proteins are not stable enough for current technologies to resolve their full 3D structure (1). In fact, estimates suggest that anywhere between 25% and 41% of the proteins in eukaryotic genomes contain long-disordered regions (2). It has been suggested that disorder itself plays a functional role by, e.g., allowing for multiple interaction partners (3) and functional diversity (4–6), which are particularly important in cell signaling and cancer (7). The correlation between intrinsic disorder and protein function, however, is still nebulous and led us to look for more general principles that might relate protein function and disorder. Unlike the aforementioned bioinformatics approaches and other heuristic models (8), here we examine the linkage between disorder and protein function from a thermodynamic point of view.
Without assuming any structure–function relationship, we look for experimentally derived parameters that might relate protein function and disorder. As described by Dyson and Wright (9), proteins in the cellular environment may have disorder in long loops, end terminals, hinge regions, domains, and even covering their full sequences. However, in a complex, these motifs acquire well-defined 3D structures. Common descriptors to all these forms of disorder are the folding free energy (ΔGf) of the motifs participating in the molecular interaction and the dissociation constant (Kd) of the interaction, where a positive folding free energy corresponds to a disordered protein (10).
We find that binding interactions between proteins become increasingly tolerant of the native disordered state (ΔGf > 0) as the strength of the physical interaction of the bound state (i.e., the “complementarity” of the complex) is increased. Indeed, for μM concentrations, only binding affinities stronger than 10−7 M can optimally bind disordered proteins. More interestingly, we show that this intrinsic protein disorder can tune the binding free energy of the complex to maximize the specificity of promiscuous interactions. On the other hand, optimal catalytic conversion of substrates to products requires ordered structures with ΔGf ≲−1 kcal/mol. These results demonstrate the possibility that evolution may act on the stability of proteins to optimize basic functions such as binding and catalysis. A comparative genomic analysis of the amount of disorder in proteomes across all kingdoms further supports this conjecture and also reveals intriguing differences on the role of disorder between eukaryotes and prokaryotes for both binding and transcription proteins.
Results
Genome-wide surveys of protein disorder have shown that disorder is more prevalent in some functional categories than others (5, 6). We revisit this question by analyzing the fraction of amino acid residues in disordered regions of both eukaryotic and prokaryotic genomes for the three largest functional categories in the gene ontology (11) classification (see Materials and Methods): “protein binding”, “catalytic activity”, and “transcription regulator activity”. Fig. 1 shows the distributions of the amount of disorder in human, yeast, and Escherichia coli proteins (also shown are the distributions after removing proteins with more than one function; see also Fig. S1 of the SI Appendix). Contrary to the striking bias of catalytic and transcription human proteins to be significantly more ordered and disordered, respectively, disorder is neither strongly favored nor disfavored in binding proteins. These distinctions are still visible in yeast but are less obvious in bacterial genomes such as E. coli, whose proteins are found to be significantly more ordered than those found in eukaryotes across all functional categories.
Fig. 1.

Disorder distribution. Normalized histograms of the percentage of disordered residues (see Materials and Methods) in the sequence of human (H. sapiens), yeast (S. cerevisiae) and E. coli (K-12) proteins within the gene ontology (11) categories of “protein binding”, “catalytic activity”, and “transcription regulator activity”. The distributions after removing the overlap between the three categories are shown by the lower bars (shaded). All distributions are normalized to the total number of proteins in each category noted in the upper right corner of each frame. In humans, contrary to the bias of transcription and catalytic proteins to be significantly more disordered and ordered, respectively, binding proteins indicate that disorder is neither strongly favored nor disfavored. The statistical significance of these results, based on a Kolmogorov–Smirnov test (37), is P < 10−150. In yeast, although binding and catalytic proteins show the same trend as occurs in higher eukaryotes, transcription proteins overall show no significant preference for order or disorder. In E. coli, all three functions show strikingly similar distributions favoring ordered structures. Similar distributions were found in other eukaryotic and prokaryotic genomes.
Based on a more comprehensive analysis of the preference of disorder among the different functional categories, we classify the genomes into three types (Fig. S2 of the SI Appendix): (type I) no strong preference for ordered structures in binding proteins but preference for disorder in transcription proteins, among which are human, mouse, zebrafish, chicken, rice, fruit fly, Arabidopsis thaliana, and Dictyostelium discoideum; (type II) no strong preference for ordered structures for either binding or transcription proteins, among which one finds yeast, Schizosaccharomyces pombe, and Caenorhabditis elegans; and (type III) strong preference for ordered structures in both binding and transcription proteins, among which there are E. coli, Bacillus anthracis, and Pseudomonas fluorescens. For catalysis, all genomes show a strong preference for ordered proteins. We note that the smaller bacterial genomes are all type III, whereas eukaryotes are either type I or II, with type I genomes being generally larger than type II.
This analysis suggests that selection pressures act on protein disorder to optimize particular aspects of protein function, raising the question of what universal properties may have driven proteins involved in binding, catalysis, and transcription to evolve along different pathways?
Thermodynamic Model.
We show here that a simple thermodynamic model of molecular interactions can elucidate the role of disorder in binding and catalysis. In this model, folding is defined as a two-state equilibrium between the unfolded state (U) and the folded state (F) (see SI Appendix for a three-state folding model) (12). Thus, the ratio of folded to unfolded proteins is given by [F]eq/[U]eq = e−ΔGf/RT (“eq” denotes equilibrium), where ΔGf is the free energy of folding, R is the ideal gas constant and T is temperature. Molecular interactions are described by a simple binding model that assumes that only folded proteins bind the substrate, i.e.,
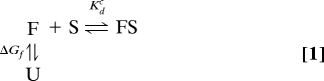 |
By decoupling folding and binding, one can define Kdc ≡ [F]eq[S]eq/[FS]eq as the complementary affinity, which implicitly accounts for the effects of interface area, shape, hydrogen bonds, and other interactions. Note that the size of the interface provides a natural upper bound on the number of contacts contributing to the interaction. In this sense, higher complementarity is often associated with a large interface, although in some cases it can be caused by other factors (e.g., small-molecule drugs often have binding affinities between 10−9 to 10−12 M). Hence, Kdc is equivalent to the experimental binding affinity Kdexp ≡ ([U]eq+[F]eq)[S]eq/[FS]eq if protein F is folded before binding. On the other hand, if protein F is unstable (or disordered), then
We note that in this formulation, Kdc characterizes the strength of the binding interaction for the folded protein and is independent of the folding free energy, ΔGf, allowing for a clear distinction between binding and folding. Aside from the conformational selection (13), disordered proteins could also function through induced folding (1, 14) or a combination of partial folding/unfolding (15). However, as demonstrated in the SI Appendix, our conclusions do not lose generality because we only rely on (quasi)equilibrium properties. For each functional category, we relate a measure of optimal performance to ΔGf over the range of parameters found in nature. With the exception of transcription, where further discussion is needed, we will show that this general model accounts for the observed distributions in Fig. 1 if one assumes that natural selection acts on ΔGf to optimize protein function. In the following, we discuss the key relations between folding stability and function.
For binding proteins, the equilibrium complex concentration is given by
 |
where cp = [U] + [F] + [FS] and cs = [S] + [FS] are the total protein and substrate concentration, respectively. Hence, it is clear that [FS]bind reaches a maximum if ΔGf ≪ 0. The curves in Fig. 2A show the ratio [FS]bind/[FS]bindmax as a function of folding free energy (ΔGf), in the absence of excess protein or substrate (cp = cs = 1 μM). Given Kdc, this ratio defines a measure of the efficiency of protein binding to produce maximum amount of complex. For the physiologically relevant range of Kdc between 10−5 and 10−10 M, a binding efficiency of, say, 90% or higher, is obtained for folding-stability thresholds of ΔGf < −1.2 kcal/mol and ΔGf < 2.9 kcal/mol, respectively (see ref. 16, where a similar analysis was used to relate peptide immunogenicity and folding stability). Specifically, we note that only strongly interacting proteins with Kdexp < 1.2 × 10⁻⁷ M can efficiently bind disordered proteins (ΔGf > 0). As shown in Fig. 2A, a more stringent criteria of 97% binding efficiency also leads to a wide range of stability thresholds, where now Kdexp < 1.0 × 10⁻⁸ M can tolerate disorder. An excess of protein (cp > cs) or substrate (cs > cp) can accommodate a slightly larger amount of disorder (Fig. S3 of the SI Appendix), but this does not affect our main conclusion that highly complementary interactions are more tolerant of disorder, whereas the binding efficiency of low-complementarity interactions is rapidly diminished by disorder.
Fig. 2.

Binding and catalytic efficiency. (A) Ratio of complex concentration [FS]bind as given by Eq. 3 to maximum concentration [FS]bindmax (ΔGf ≪ 0). cp = cs = 1 μM. Vertical dash-dotted lines indicate the folding free energy for 90% (dashed lines for 97%) binding efficiency ([FS]bind/[FS]bindmax with Kdc = 10−5 and 10−10 M, respectively. To maintain high binding efficiency, weak binding requires negative ΔGf (prefers order), whereas strong binding allows positive ΔGf (tolerates disorder). (B) Fractional production rate for catalytic activity relative to maximum catalytic rate Vcatmax (ΔGf ≪ 0) as given by Eq. 4 ([S] = 1 μM). The vertical dash-dotted line indicates the folding free energy for 90% (dashed line for 97%) catalytic efficiency (Vcat/Vcatmax) with all relevant Kmc. To maintain high catalytic efficiency, negative ΔGf (ordered structure) is required for the whole range of physiological parameters shown here. Note that to allow for fast conversion, enzyme–substrate interactions (characterized by the Michaelis constant Km) are limited to much weaker interactions than those of binding proteins (Kd).
For catalysis, we further considered the rate of substrate conversion to product via the FS complex, which within the Michaelis–Menten limit leads to the conversion rate
where Kmc is the Michaelis constant and kcat is the enzyme turnover rate. Fig. 2B shows that for typical Kmc values between 10−1 M and 10−6 M there is a relatively invariant threshold of the folding free energy, ΔGf = −1.0 kcal/mol, above which catalysis becomes suboptimal (i.e., Vcat/Vcatmax ⩽ 90%, where Vcatmax is reached when ΔGf ≪ 0). This threshold is maintained even for substrate concentrations as high as 10−5 M (Fig. S3 of the SI Appendix). Thus, catalytic function is optimized when thermodynamics strongly favor the ordered state. Interestingly, because to have a fast conversion rate the strength of the enzyme–substrate interaction characterized by the Michaelis constant Km must be much weaker than standard protein–protein Kd, enzymes can also be thought of as a special case of extremely weak binding proteins, i.e., ordered.
Specificity of Promiscuous Interactions.
Our model also demonstrates that disorder provides a mechanism to distinguish between two substrates that differ in binding affinity by a relatively small amount, say 1.5 kcal/mol (Fig. 3). For strong binding (Kdexp small), the amount of complex formation with each substrate is almost indistinguishable. A positive ΔGf, however, can tune Kdexp (Eq. 2) to maximize the discrimination between binding of the two substrates while at the same time maintaining a high level of binding to the higher-affinity substrate. Note that the experimental affinity required to bring about this optimal specificity is lower the higher the concentration of protein or substrate. Our finding is reminiscent of Schulz's high-complementarity (or small Kdc), low-affinity (or large Kdexp) rationalization of the flexibility of nucleotide binding proteins (10), which has also been applied in the context of signal transduction (9) as well as the suggestion of Dunker et al. (17) that disorder uncouples complementarity (Kdc) and affinity (Kdexp). We note that here is that the quantitative theory defines “specificity” as simply providing better discrimination among similar physical interactions, a more common usage of the concept (14) that is likely to play a critical role in complex cellular networks.
Fig. 3.

Maximum discrimination in binding to similar substrates. The solid curve shows the equilibrium complex concentration [FS]bind (Eq. 3) normalized by the strong binding limit [FS]bindstrong (Kdexp → 0). cp = cs is used without losing generality. Each pair of vertical lines shows the relative amount of bound complex formed by two different substrates with a binding free energy difference of 1.5 kcal/mol. For strong binding, the complex concentration saturates, and there is almost no difference in the amount of complex formed by either substrate (dashed lines). On the other hand, decreasing the experimental binding affinity by destabilizing the folded state (F) enhances complex formation by the stronger binding substrate relative to the weaker one (dash-dotted lines).
Discussion
Our survey indicates that the distribution of the amount of disorder depends strongly on protein function, and a first-principles thermodynamic analysis explains the nature of this relationship. For proteins whose main function is to bind other proteins, the amount of disorder that can be tolerated without degrading function is quite broad, depending on the complementarity of the interaction. Catalytic proteins have a strong preference for a stable folded state with ΔGf ≲−1 kcal/mol, consistent with the notion that catalysis has strong conformational requirements, as conjectured by Pauling (18) in the prestructure age and more recently discussed by other researchers (see, e.g., ref. 19). Note, however, that although protein stability below the aforementioned threshold (Fig. 2B and Fig. S3B of the SI Appendix) does not improve catalysis any further (20), this preorganized state leaves ample room for conformational changes that might be required to bring about efficient catalysis. Finally, we show that disorder can be used to maximize the specificity of promiscuous interactions relevant to transcription and signal transduction.
Instead of rationalizing our findings in terms of adaptability or other processes that are not easily quantifiable, we restrict our discussion to the experimentally derived parameters defined in our models, making our predictions both experimentally and quantitatively more relevant. For instance, Fig. 3 shows that for μM concentrations, highly complementary complexes, say, Kdc ∼ nM, will yield maximum discrimination if folding instability lowers Kdexp to μM. This extra discrimination is likely to play a role in the differential regulation of promiscuous binding domains such as SH2/3s, whose typical affinities agree with the predictions of the model (21). More interestingly, the theory also elucidates the dependence on concentration of the experimental affinity that optimizes specificity (Fig. 3).
The theory predicts that lower-affinity interactions are expected to involve proteins with less disorder, which may help explain why disorder is less prevalent in prokaryotes (type III) than eukaryotes (types I and II). Indeed, the strikingly similar distributions for E. coli shown in Fig. 1 suggest that disorder does not play a role in function (similar data are observed for other prokaryotes). Without disorder, protein binding efficiency would imply Kdexp ≳ 10−7 M. A survey of the protein-ligand interactions in the Protein Data Bank (PDB) PDBbind database (22) (Fig. 4) confirms not only that bacterial proteins may indeed bind small ligand molecules more weakly than humans proteins but also that there is a sharp drop in the number of E. coli ligands (20% compared with 50% for human) with Kdexp smaller than the predicted threshold of 10−7 M. From the point of view of evolution, the drop of Kdexp is also consistent with the intuition that short-lived microorganisms have less need to form long-lived complexes.
Fig. 4.

Distributions of experimentally measured protein–ligand binding affinities. Data are taken from the PDBbind database (version 2007). The overall distributions are consistent with our hypothesis that the lack of disorder in prokaryotes could be due to their relatively weaker binding affinities (≳10−7 M).
It is important to stress that protein-functional assignments are still incomplete (11). Indeed, for the genomes we analyzed, only a subset of all proteins has at least one assigned function, e.g., ≈75%, 88% and 32% of human, yeast, and E. coli, respectively. As already mentioned, our analysis encompasses motifs participating in the molecular interactions. Hence, for multisite/domain proteins a specific function should not necessarily require folding of the entire protein. Fig. 5 further expands on the amount of intrinsic disorder in multifunctional proteins as well as on the correlation of disorder and protein length. For the most part, we find that proteins with both binding and transcription functions have a disorder distribution similar to transcription, whereas the distribution for proteins with binding and catalytic functions is more similar to catalytic. For these subsets, we failed to observe significant correlations between disorder and protein length. For E. coli, most proteins are ordered. However, the few highly disordered proteins involved in transcription are all relatively small, resulting in a weak negative correlation. The small sets of proteins with both catalytic and transcription functions as well as all three functions (including binding) show a positive correlation with length while seemingly encompassing a combination of the disorder distributions of each individual functional category. Further analysis of disorder as a local property of the functioning site is likely to reveal insights into how evolution has coupled structure and functions to cope with the increasing complexity of higher organisms.
Fig. 5.

Intrinsic disorder as a function of protein length for proteins with (nonoverlapping) binding, transcription, and catalytic function (large circles), and for proteins with more than one function, as indicated by the colored arrows from each individual functional category (smaller circles). For each polar coordinate plot, the radial and angular (counterclockwise) coordinates correspond to protein length in a log-scale and the percentage of residues that are classified as disordered for the protein (as in Fig. 1), respectively. For clarity, percent disorder and protein length are labeled only in transcription and catalysis plots, respectively. Indicated outside each circle is the percentage of proteins in each functional category relative to the total number of proteins for which the function has been annotated for each organism (i.e., 15,260, 5,900, and 1,362 for human, yeast and E. coli, respectively). The figure shows that disorder does not correlate with protein length for well-sampled functional categories. The analysis of disorder in multifunctional proteins also reveals interesting patterns. Specifically, binding does not seem to impact the level of disorder of either transcription or catalytic proteins, whereas disorder in proteins with both catalytic and transcription functionalities appear to follow either one of the patterns found for the individual functions.
Ultimately, the theory might provide more subtle quantitative predictions for the interplay between disorder and function for specific proteins. Although current experimental technologies cannot readily analyze weakly stable proteins, let alone positive folding free energies, computational techniques might help to fill this gap. Although there are other aspects not considered here, such as the role of disorder in aggregation and degradation, our findings show how disorder has opened a new dimension in the regulation of molecular interactions for eukaryotes and, most certainly, humans. Collectively, our findings suggest that protein folding should be viewed as a continuum in which folding stability is just one more parameter that evolution uses to optimize function.
Materials and Methods
Gene Ontology and Genome Databases.
To assign protein function, we use the gene ontology classification, in which protein binding, catalytic activity, and transcription regulator activity are the three largest functional categories. The gene ontology annotations and protein sequences were from the member databases of the Gene Ontology Consortium. Gene ontology annotation at the European Bioinformatics Institute (23) for sequences in the Swiss-Prot database (24) were used for human (Homo sapiens), mouse (Mus musculus), zebrafish (Danio rerio), chicken (Gallus gallus) and A. thaliana; the Saccharomyces Genome Database (25) for yeast (Saccharomyces cerevisiae); EcoCyc and EcoliHub (26) for E. coli (K-12); the Gramene database (27) for rice (Oryza sativa); the FlyBase (28) for fruit fly (Drosophila melanogaster); the WormBase (29) for C. elegans; the dictyBase (30) for D. discoideum; the Schizosaccharomyces pombe GeneDB database (31) for S. pombe; and, the TIGR database (32) for B. anthracis and P. fluorescens. The data were current as of January 2009.
Disorder Prediction.
For each protein, the percentage of disordered amino acids was estimated by using the VSL2B predictor (33), which was trained with experimental data by using machine learning techniques. The method has been validated in comprehensive blind experiments (33). The predictor uses the protein sequence as the input and gives the probability that each amino acid is in a disordered region. A probability >0.5 predicts a residue to be disordered. We also verified the distributions with another two predictors, FoldIndex (34) and DisEMBL (35) (see Fig. S1 of the SI Appendix), and similar results were obtained.
Protein-Ligand Binding Affinity.
The PDBbind database provides the experimentally measured binding affinities of protein-ligand complexes. Organism information was obtained from the PDB database (36) by using the PDB codes provided by PDBbind.
Supplementary Material
Acknowledgments.
We are grateful to Drs. Ivet Bahar, Jeffrey Brodsky, and George Makhatadze for valuable comments and suggestions on the manuscript. This work was partially supported by National Science Foundation Grant MCB-0444291/0744077.
Footnotes
The authors declare no conflict of interest.
This article is a PNAS Direct Submission.
This article contains supporting information online at www.pnas.org/cgi/content/full/0907710106/DCSupplemental.
References
- 1.Wright PE, Dyson HJ. Intrinsically unstructured proteins: Re-assessing the protein structure-function paradigm. J Mol Biol. 1999;293:321–331. doi: 10.1006/jmbi.1999.3110. [DOI] [PubMed] [Google Scholar]
- 2.Dunker AK, Obradovic Z, Romero P, Garner EC, Brown CJ. Intrinsic protein disorder in complete genomes. Genome Informatics. 2000;11:161–171. [PubMed] [Google Scholar]
- 3.Haynes C, et al. Intrinsic disorder is a common feature of hub proteins from four eukaryotic interactomes. PLoS Comput Biol. 2006;2:e100. doi: 10.1371/journal.pcbi.0020100. [DOI] [PMC free article] [PubMed] [Google Scholar]
- 4.Romero PR, et al. Alternative splicing in concert with protein intrinsic disorder enables increased functional diversity in multicellular organisms. Proc Natl Acad Sci USA. 2006;103:8390–8395. doi: 10.1073/pnas.0507916103. [DOI] [PMC free article] [PubMed] [Google Scholar]
- 5.Ward JJ, Sodhi JS, McGuffin LJ, Buxton BF, Jones DT. Prediction and functional analysis of native disorder in proteins from the three kingdoms of life. J Mol Biol. 2004;337:635–645. doi: 10.1016/j.jmb.2004.02.002. [DOI] [PubMed] [Google Scholar]
- 6.Xie H, et al. Functional anthology of intrinsic disorder. 1. Biological processes and functions of proteins with long disordered regions. J Proteome Res. 2007;6:1882–1898. doi: 10.1021/pr060392u. [DOI] [PMC free article] [PubMed] [Google Scholar]
- 7.Iakoucheva LM, Brown CJ, Lawson JD, Obradovic Z, Dunker AK. Intrinsic disorder in cell-signaling and cancer-associated proteins. J Mol Biol. 2002;323:573–584. doi: 10.1016/s0022-2836(02)00969-5. [DOI] [PubMed] [Google Scholar]
- 8.Shoemaker BA, Portman JJ, Wolynes PG. Speeding molecular recognition by using the folding funnel: The fly-casting mechanism. Proc Natl Acad Sci USA. 2000;97:8868–8873. doi: 10.1073/pnas.160259697. [DOI] [PMC free article] [PubMed] [Google Scholar]
- 9.Dyson HJ, Wright PE. Intrinsically unstructured proteins and their functions. Nat Rev Mol Cell Biol. 2005;6:197–208. doi: 10.1038/nrm1589. [DOI] [PubMed] [Google Scholar]
- 10.Schulz GE. Molecular Mechanism of Biological Recognition. Amsterdam: Elsevier; 1979. pp. 79–94. [Google Scholar]
- 11.Ashburner M, et al. Gene ontology: Tool for the unification of biology. Nat Genet. 2000;25:25–29. doi: 10.1038/75556. [DOI] [PMC free article] [PubMed] [Google Scholar]
- 12.Zwanzig R. Two-state models of protein folding kinetics. Proc Natl Acad Sci USA. 1997;94:148–150. doi: 10.1073/pnas.94.1.148. [DOI] [PMC free article] [PubMed] [Google Scholar]
- 13.Tsai CJ, Ma B, Sham YY, Kumar S, Nussinov R. Structured disorder and conformational selection. Proteins. 2001;44:418–427. doi: 10.1002/prot.1107. [DOI] [PubMed] [Google Scholar]
- 14.Spolar RS, Record MT., Jr Coupling of local folding to site-specific binding of proteins to DNA. Science. 1994;263:777–784. doi: 10.1126/science.8303294. [DOI] [PubMed] [Google Scholar]
- 15.Rajamani D, Thiel S, Vajda S, Camacho CJ. Anchor residues in protein–protein interactions. Proc Natl Acad Sci USA. 2004;101:11287–11292. doi: 10.1073/pnas.0401942101. [DOI] [PMC free article] [PubMed] [Google Scholar]
- 16.Camacho CJ, Katsumata Y, Ascherman DP. Structural and thermodynamic approach to peptide immunogenicity. PLoS Comput Biol. 2008;4:e1000231. doi: 10.1371/journal.pcbi.1000231. [DOI] [PMC free article] [PubMed] [Google Scholar]
- 17.Dunker AK, et al. Protein disorder and the evolution of molecular recognition: Theory, predictions and observations. Pac Symp Biocomput. 1998:473–484. [PubMed] [Google Scholar]
- 18.Pauling L. Nature of forces between large molecules of biological interest. Nature. 1948;161:707–709. doi: 10.1038/161707a0. [DOI] [PubMed] [Google Scholar]
- 19.Yang LW, Bahar I. Coupling between catalytic site and collective dynamics: A requirement for mechanochemical activity of enzymes. Structure. 2005;13:893–904. doi: 10.1016/j.str.2005.03.015. [DOI] [PMC free article] [PubMed] [Google Scholar]
- 20.Shoichet BK, Baase WA, Kuroki R, Matthews BW. A relationship between protein stability and protein function. Proc Natl Acad Sci USA. 2005;92:452–456. doi: 10.1073/pnas.92.2.452. [DOI] [PMC free article] [PubMed] [Google Scholar]
- 21.Ladbury JE, Arold S. Searching for specificity in SH domains. Chem Biol. 2000;7:R3–R8. doi: 10.1016/s1074-5521(00)00067-3. [DOI] [PubMed] [Google Scholar]
- 22.Wang R, Fang X, Lu Y, Yang CY, Wang S. The PDBbind database: Methodologies and updates. J Med Chem. 2005;48:4111–4119. doi: 10.1021/jm048957q. [DOI] [PubMed] [Google Scholar]
- 23.Barrell D, et al. The GOA database in 2009—An integrated gene ontology annotation resource. Nucl Acids Res. 2009;37:D396–D403. doi: 10.1093/nar/gkn803. [DOI] [PMC free article] [PubMed] [Google Scholar]
- 24.UniProt Consortium. The universal protein resource (UniProt) Nucleic Acids Res. 2008;36:D190–D195. doi: 10.1093/nar/gkm895. [DOI] [PMC free article] [PubMed] [Google Scholar]
- 25.Hong EL, et al. Gene ontology annotations at SGD: New data sources and annotation methods. Nucleic Acids Res. 2008;36:D577–D581. doi: 10.1093/nar/gkm909. [DOI] [PMC free article] [PubMed] [Google Scholar]
- 26.Keseler IM, et al. EcoCyc: A comprehensive view of Escherichia coli biology. Nucl Acids Res. 2009;37:D464–D470. doi: 10.1093/nar/gkn751. [DOI] [PMC free article] [PubMed] [Google Scholar]
- 27.Liang C, et al. Gramene: A growing plant comparative genomics resource. Nucl Acids Res. 2008;36:D947–D953. doi: 10.1093/nar/gkm968. [DOI] [PMC free article] [PubMed] [Google Scholar]
- 28.Drysdale R FlyBase Consortium. FlyBase: A database for the Drosophila research community. Methods Mol Biol. 2008;420:45–59. doi: 10.1007/978-1-59745-583-1_3. [DOI] [PubMed] [Google Scholar]
- 29.Bieri T, et al. WormBase: New content and better access. Nucleic Acids Res. 2007;35:D506–D510. doi: 10.1093/nar/gkl818. [DOI] [PMC free article] [PubMed] [Google Scholar]
- 30.Fey P, et al. dictyBase—A Dictyostelium bioinformatics resource update. Nucleic Acids Res. 2009;37:D515–D519. doi: 10.1093/nar/gkn844. [DOI] [PMC free article] [PubMed] [Google Scholar]
- 31.Aslett M, Wood V. Gene ontology annotation status of the fission yeast genome: Preliminary coverage approaches 100% Yeast. 2006;13:913–919. doi: 10.1002/yea.1420. [DOI] [PubMed] [Google Scholar]
- 32.Haft DH, Selengut JD, White O. The TIGRFAMs database of protein families. Nucleic Acids Res. 2003;31:371–373. doi: 10.1093/nar/gkg128. [DOI] [PMC free article] [PubMed] [Google Scholar]
- 33.Peng K, Radivojac P, Vucetic S, Dunker AK, Obradovic Z. Length-dependent prediction of protein intrinsic disorder. BMC Bioinformatics. 2006;7:208. doi: 10.1186/1471-2105-7-208. [DOI] [PMC free article] [PubMed] [Google Scholar]
- 34.Prilusky J, et al. FoldIndex: A simple tool to predict whether a given protein sequence is intrinsically unfolded. Bioinformatics. 2005;21:3435–3438. doi: 10.1093/bioinformatics/bti537. [DOI] [PubMed] [Google Scholar]
- 35.Linding R, et al. Protein disorder prediction: Implications for structural proteomics. Structure. 2003;11:1453–1459. doi: 10.1016/j.str.2003.10.002. [DOI] [PubMed] [Google Scholar]
- 36.Berman HM, et al. The protein data bank. Nucleic Acids Res. 2000;28:235–242. doi: 10.1093/nar/28.1.235. [DOI] [PMC free article] [PubMed] [Google Scholar]
- 37.DeGroot MH. Probability and Statistics. 3rd Ed. Reading, MA: Addison-Wesley; 1991. [Google Scholar]
Associated Data
This section collects any data citations, data availability statements, or supplementary materials included in this article.