

Abstract
Although selenophosphate synthetase 1 (SPS1/SelD) is an essential gene in Drosophila, its function has not been determined. To elucidate its intracellular role, we targeted the removal of SPS1/SelD mRNA in Drosophila SL2 cells using RNA interference technology that led to the formation of vacuole-like globular structures. Surprisingly, these structures were identified as megamitochondria, and only depolarized mitochondria developed into megamitochondria. The mRNA levels of l(2)01810 and glutamine synthetase 1 (GS1) were increased by SPS1/SelD knockdown. Blocking the expression of GS1 and l(2)01810 completely inhibited the formation of megamitochondria induced by loss of SPS1/SelD activity and decreased the intracellular levels of glutamine to those of control cells suggesting that the elevated level of glutamine is responsible for megamitochondrial formation. Overexpression of GS1 and l(2)01810 had a synergistic effect on the induction of megamitochondrial formation and on the synthesis of glutamine suggesting that l(2)01810 is involved in glutamine synthesis presumably by activating GS1. Our results indicate that, in Drosophila, SPS1/SelD regulates the intracellular glutamine by inhibiting GS1 and l(2)01810 expression and that elevated levels of glutamine lead to a nutritional stress that provides a signal for megamitochondrial formation.
Introduction
Selenium is an essential trace element in the diet of humans and many other life forms. It provides many health benefits such as roles in preventing cancer and heart disease, serving as an antiviral agent, stimulating the immune system, reactive oxygen species (ROS)4 scavenging, and male reproduction (1–6). Many of the benefits of selenium are most likely due to the presence of this element in selenoproteins as the amino acid selenocysteine (Sec) (7–9). Sec is the 21st amino acid in the genetic code (10–12) and is incorporated into selenoproteins in response to UGA Sec codons (13, 14). The active donor of selenium in Sec biosynthesis is monoselenophosphate (15), which is synthesized from selenite and ATP by an enzyme designated as selenophosphate synthetase (SPS) (16). There are two isoforms of SPS in higher eukaryotes, SPS1/SelD and SPS2, whereas only one type of SPS (SelD) exists in lower eukaryotes and eubacteria (17). The sequences of SPS1/SelD and SPS2 are highly conserved. For example, the amino acid sequence homology between human SPS1/SelD and SPS2 is 72% and that between Drosophila SPS1/SelD and SPS2 is ∼45%. One of the major differences between SPS1/SelD and SPS2 is that SPS1/SelD has an arginine at the position corresponding to Sec in SPS2 (18, 19).
Initially, both SPS1/SelD and SPS2 were thought to be involved in selenophosphate synthesis. However, it was subsequently shown that only SPS2 catalyzes selenophosphate synthesis. In in vitro experiments, SPS2 synthesized selenophosphate from selenide and ATP, but SPS1/SelD did not have this activity (20). Knockdown of SPS2 in NIH3T3 cells led to the loss of selenoprotein biosynthesis, whereas the inhibition of SPS1/SelD expression did not affect the biosynthesis of selenoproteins, and only SPS2 was capable of restoring selenoprotein synthesis (21). In some insects such as the red beetle and silkworm, which have lost the selenoprotein synthesizing machinery, including SPS2, SPS1/SelD is still encoded in the genome (22). Although SPS1/SelD does not participate in the synthesis of selenophosphate, it has an essential function in Drosophila as the knock-out of the gene encoding SPS1/SelD, which was originally designated patufet, led to aberrant imaginal disc morphology and embryonic lethality (23). Haplo-insufficiency of patufet dominantly suppressed the phenotypes caused by hyperactivation of the Ras/mitogen-activated protein kinase (MAPK) cassette, and the activation of the Drosophila epidermal growth factor receptor and receptor tyrosine kinases (24). In addition, the null mutation of patufet caused an accumulation of ROS suggesting SPS1/SelD plays a role in reducing the intracellular ROS level (25).
Mitochondria are composed of compartments that carry out specialized functions dealing in large part with the production of biochemical energy. Mitochondria consist of a double-layered membrane, an outer and an inner layer, which have different properties. The inner membrane forms a special structure called cristae to expand its surface area, whereas the outer membrane has a more simplified structure. The space within the inner membrane is called the matrix (26, 27). In addition to energy production, mitochondria play various other roles such as cell signaling and programmed cell death, which are essential cellular functions (28, 29).
Mitochondria normally have an ovoid or spherical shape, but in some stress conditions they become swollen. Mitochondrial swelling was initially reported with isolated mitochondria by exposing them to hypotonic sucrose solution (30), but many reports have since appeared on this subject. For example, mitochondrial swelling can be induced by increased respiration rate caused by ATP requirements (31, 32), overproduction of ROS (33), or during the processes of cell death (34). Mitochondrial swelling also has been reported to be induced by depolarization of the mitochondrial membrane potential (MMP) and opening of the permeability transition pore, which cause perturbation in potassium homeostasis and osmotic balance between the cytosol and mitochondria resulting in an influx of water into the matrix (35).
In terms of sizes, swollen mitochondria can be classified into two groups, simple swollen mitochondria and megamitochondria (or giant mitochondria). Simple swollen mitochondria are generated by swelling of single mitochondria, and their size is enlarged up to three times in diameter (36). On the other hand, megamitochondria are generated by fusion of swollen mitochondria (37, 38). Therefore, the size of megamitochondria is usually much larger than simple swollen mitochondria. Formation of megamitochondria has been reported to be induced by various conditions such as the treatment with drugs (e.g. cuprizone or antibiotics), hormonal disturbance, malnutrition or high protein diet, during ethanol intoxication, virus infection, and even by exercise (38). Therefore, megamitochondria apparently are induced in response to various intracellular or extracellular stresses. When compared with normal mitochondria, megamitochondria manifest unique characteristics in addition to their enlarged size such as unfolded and shortened cristae that are confined to membrane periphery and dense granules that are scattered throughout the enlarged matrix (39).
Glutamine is a nonessential amino acid that is synthesized from ATP, glutamate, and ammonia. The synthesis of glutamine is catalyzed by glutamine synthetase (GS). In Drosophila, there are two isoforms of GS, GS1 and GS2, which have 60% homology in their amino acid compositions. GS1 is localized in the mitochondria, whereas GS2 is localized in the cytosol (40). It has been reported that administering high levels of glutamine in cultured astrocytes induces mitochondrial permeability transition (41). However, there have not been any reports showing that glutamine induces mitochondrial swelling.
In this study, we found that SPS1/SelD regulates the intracellular glutamine level by regulating genes involved in glutamine biosynthesis, and we found that a high intracellular glutamine level plays a role as a signal for nutritional stress that leads to the formation of megamitochondria.
EXPERIMENTAL PROCEDURES
Cell Line and Antibodies
Rabbit anti-SPS1/SelD antibody was made using a recombinant protein corresponding to the full length of human SPS1/SelD. Drosophila Schneider cell line 2 (SL2) was purchased from Invitrogen (catalog number R690-07) and mouse anti-ATP synthase subunit α monoclonal antibody from MitoSciences. Mouse anti-tubulin monoclonal antibody, goat anti-mouse IgG, and goat anti-rabbit IgG were purchased from Sigma, and Alexa 488-conjugated anti-mouse IgG was from Molecular Probes.
Reagents and Other Materials
Other materials and chemicals were purchased from the following sources: 75Se (specific activity 1000 Ci/mmol) from the Research Reactor Facility, University of Missouri (Columbia, MO); HyQ SFX-Insect media from Hyclone; antibiotics and antimycotics from Invitrogen; T3 Megascript kit from Ambion; SYBR Green mix from Applied Biosystems; TRIzol reagent, Pfx DNA polymerase, and protein size marker from Invitrogen; Moloney murine leukemia virus reverse transcriptase from Super-Bio; RNA size marker and RNase inhibitor from Promega; NheI, BamHI, and NotI from Beams-Bio; Hybond-ECL nitrocellulose membrane, Hybond N+ membrane, and Ready-to-Go DNA labeling beads from Amersham Biosciences; 2′,7′-dichlorofluorescein diacetate, MitoTracker Red, Calcein-AM, and 5,5′,6,6′-tetrachloro-1,1′,3,3′-tetraethylbenzimidazolyl-carbocyanine iodide (JC-1) from Molecular Probes; dimethyldioctadecyl ammonium bromide, CoCl2, carbonyl cyanide p-trifluoromethoxyphenylhydrazone (FCCP), rotenone, oligomycin, methionine sulfoximine, concanavalin A, protease inhibitor mixture, glutamine/glutamate determination kit (GLN-1), and ATP bioluminescent assay kit from Sigma; and Lab-Tek Chambered cover glass from Nunc. Oligonucleotides used in this study were listed in supplemental Tables S1–S3.
Vector Constructions
To express GS1-HA and l(2)01810-HA recombinant proteins in which hemagglutinin is tagged at the C terminus of each protein, DNA fragments containing GS1-HA ORF and l(2)01810-HA ORF were prepared and inserted into pAcGGFP by replacing the G-rich/GFP ORF region. pAcGGFP is a vector that can express G-rich/GFP fusion protein. This vector was constructed from pAcPA by introducing multicloning sites and G-rich/GFP ORF region (42). G-rich and GFP ORFs were replaced in two steps. 1) G-rich ORF was replaced with GS1 or l(2)01810 ORF using NheI and BamHI sites. 2) The GFP ORFs of both vectors were replaced with hemagglutinin ORF containing a stop codon at the 3′ end using BamHI and NotI sites. The vectors were designated pAcGS1-HA and pAcl(2)01810-HA, respectively.
SL2 Cell Culture and RNA Interference
SL2 cell culture and preparation of double-stranded RNAs were carried out as described previously (43). For RNA interference, 0.25 × 10⁶ cells were plated on a 24-well plate in 0.5 ml of HyQ SFX-Insect media. 4 μg of dsRNAs were added directly to the cells and incubated for 24 h and split into appropriate culture dishes for further incubation and other experiments.
Labeling of Selenoproteins with 75Se
Labeling of selenoproteins was performed as described previously (44) with a slight modification. Four days after treating dsRNAs, 50 μCi/ml of 75Se was added to the culture medium, and cells were grown for an additional 24 h. The cells were then harvested, and whole cell lysates were prepared. Fifty micrograms of proteins from each lysate were loaded onto NuPAGE 4–12% BisTris gel and separated by electrophoresis. The gel was stained with Coomassie Blue, dried, and exposed to a PhosphorImager (GE Healthcare).
DNA Transfection and Reagent Treatment
Vectors were transfected into SL2 cells as described previously (45) with minor modifications. Briefly, 4 μg of pAcPA (backbone vector) and pAcGS1-HA and 2 μg of pAcl(2)01810-HA were mixed with 100 μl of dimethyldioctadecyl ammonium bromide (125 μg/ml) and 200 μl of HyQ-SFX-Insect media, incubated for 30 min at room temperature, and then added into a well of a 6-well plate, which contained 6 × 10⁶ cells. pAcGFP was also transfected to monitor transfection efficiency. pAcPA was used for mock transfection. Cells were incubated with media containing 2 μm FCCP or rotenone for 6 h for inhibiting mitochondrial activity or with 3 mm methionine sulfoximine for 48 h for inhibiting glutamine synthetase activity.
ROS Staining and Confocal Microscopy
SL2 cells (0.5 × 10⁶) were plated onto a chambered cover glass the day before staining. The cells were incubated with 10 μm 2′,7′-dichlorofluorescein diacetate for 30 min at 25 °C and washed three times with media. Cells were observed with an LSM510 confocal microscope. Excitation wavelength was 488 nm.
MTT Assay
The MTT assay was carried out as described previously (46) with some modifications. Briefly, 24 h after dsRNAs treatment, 2 × 10⁴ cells were seeded in a 96-well plate. Fifty microliters of 2 mg/ml MTT were added to each well and incubated for 4 h. After removing the supernatant, 200 μl of dimethyl sulfoxide were added to dissolve the formazan crystals that remained in the wells. Absorbance was determined using a microplate reader (Molecular Devices) at 540 nm. Wells without dsRNAs were used for control cell viability and wells without cells for blanking the spectrophotometer.
Transmission Electron Microscopy
Cells treated with dsRNAs were fixed with 2% paraformaldehyde and 2% glutaraldehyde in 0.05 m sodium cacodylate buffer (pH 7.2). After washing three times with the same buffer, post-fixation was carried out with 1% osmium tetroxide in 0.05 m sodium cacodylate buffer for 2 h at 4 °C. The fixed cells were briefly washed two times with distilled water, and en block staining with 0.5% uranyl acetate was carried out overnight at 4 °C. Samples were dehydrated by successive soaking in 30, 50, 70, 80, and 90% ethanol for 10 min each, then three soakings in 100% ethanol for 10 min each, and finally two soakings in 100% propylene oxide for 15 min each. The dried samples were infiltrated by Spurr's resin and then polymerized at 70 °C for 24 h. Ultra-thin sections (60 nm) were prepared using an ultramicrotome (MT-X, RMC) and were mounted on grids. The samples were stained with 2% uranyl acetate and Reynold's lead citrate. TEM images were obtained using an energy filtering transmission electron microscope (LIBRA 120, Carl Zeiss) operated at 80 kV.
Mitochondrial Staining and Confocal Microscopy
An appropriate number of cells (0.5 × 10⁶) were plated onto a chambered cover glass the day before staining. For mitochondrial staining, SL2 cells were incubated with 1 μm MitoTracker-Red, 2.5 μm of Calcein-AM, and 2 mm of CoCl2 for 30 min at 25 °C. Mitochondria were also detected by incubating the cells with 1 μg/ml JC-1 for 30 min at 25 °C. For immunocytochemistry, cells were fixed and permeabilized with 4% paraformaldehyde in PBS and 0.1% Triton X-100 in PBS, respectively. Cells were incubated with 3% bovine serum albumin in PBS for 1 h at room temperature to block nonspecific binding of the antibodies and incubated with mouse anti-ATP synthase subunit α monoclonal antibody diluted in 3% bovine serum albumin in PBS (1:100) for overnight at 4 °C. Cells were then incubated with Alexa 488-conjugated anti-mouse IgG diluted in 3% bovine serum albumin in PBS (1:500) for 2 h at room temperature in the dark. Cells were observed with an LSM510 confocal microscope (Carl Zeiss) at 512 × 512 pixel resolution through a ×63 C-Apochromat objective. Excitation was at 543 nm for MitoTracker Red and at 488 nm for Calcein-AM, JC-1, and Alexa 488. At least 10 fields were captured for each experiment.
Flow Cytometry
SL2 cells treated with dsRNAs or mitochondrial inhibitors were stained with 1 μg/ml JC-1 for 30 min at 25 °C. After washing and resuspending in PBS, cells were analyzed immediately on a FACSCalibur flow cytometer (BD Biosciences) equipped with a 488-nm excitation filter. The green fluorescence from JC-1 monomers was collected through a 530-nm emission filter (fluorescence 1), and the red fluorescence from JC-1 aggregates was collected through a 585-nm emission filter (the fluorescence 2). A total of 30,000 events was analyzed for each sample for both green and red fluorescence. The red and green fluorescence distributions from JC-1 were displayed by two-color dot plot.
Southern Blotting
Total genomic DNA was isolated from dsRNA-treated SL2 cells on each day as described previously (47). Southern blotting was performed as described previously (48) with some modifications. Ten micrograms of total DNA digested with XhoI were separated on a 0.7% agarose gel. DNA was transferred to a Hybond N+ membrane and hybridized with ND5 or rp49-specific probe, which was labeled with [α-32P]dCTP (specific activity ∼1.0 × 10⁹ cpm/μg DNA) using the Ready-to-Go DNA labeling beads (Amersham Biosciences) for detecting mitochondrial DNA and genomic DNA, respectively. The blot was then washed and analyzed by autoradiography.
Northern Blotting
Northern blot analysis was performed as described previously (49) with some modifications. Briefly, total RNA was isolated from SL2 cells using TRIzol reagent according to the manufacturer's instructions. For Northern blot analysis, 20 μg of total RNA was loaded onto a 1.2% agarose-formaldehyde gel and transferred onto a Hybond N+ membrane. cDNAs of SPS1/SelD, Cytb, ND5, and COI were amplified by reverse transcription-PCR and labeled using the same method described above and used as probes. RP49 cDNA was used as an internal control. Membranes were hybridized overnight, washed, and analyzed by autoradiography.
Quantitative Real Time Reverse Transcription-PCR
cDNAs were synthesized from total RNAs with Moloney murine leukemia virus reverse transcriptase and oligo(dT) primers according to the manufacturer's protocols. Then the mRNA levels of each gene were measured by real time PCR using an ABI 7300 real time PCR system (Applied Biosystems). cDNAs were amplified with SYBR Green and specific primers (see supplemental Tables S1–S3), and the comparative Ct method was conducted. RP49 mRNA was used for normalization.
Western Blotting
Western blot analysis was performed as described previously (43) with minor modifications. Briefly, cells were lysed in RIPA lysis buffer containing protease inhibitor mixture. Twenty micrograms of proteins were separated by 10% SDS-PAGE and transferred to a Hybond-ECL nitrocellulose membrane. The membrane was blocked with TBST containing 5% skim milk for 1 h at room temperature and then incubated with an appropriate antibody diluted with 5% skim milk for 1 h at room temperature. Antibody titer was 1:10,000 for anti-SPS1/SelD antibody and 1:100,000 for anti-tubulin antibody. After washing with TBST, the membrane was incubated with goat anti-mouse IgG (1:10,000) or goat anti-rabbit IgG (1:10,000) for 1 h at room temperature.
Glutamine Measurement
Three days after dsRNAs treatment or transfection, 3–5 × 10⁷ cells were harvested, and the cells were washed in ice-cold phosphate-buffered saline, extracted with 10% HClO4, followed by centrifugation at 3,000 × g for 3 min. After neutralizing the supernatants with 5 n KOH, extracts were incubated for 10 min on ice followed by centrifugation at 15,000 × g for 3 min. Glutamine levels were measured in the final supernatants using the glutamine/glutamate determination kit (Sigma) as described in the manufacturer's protocol except that 2 mm hydroxylamine was added in the reaction for deaminating glutamine to reduce the background (50). Data were normalized to the number of cells used.
Statistical Analysis
Statistical analysis was performed with R software. To determine the statistical significance of the observed changes in the glutamine level and the frequency of megamitochondrial formation, pairwise Student's t test (significance level (α) = 0.05) with Bonferroni correction was performed. Correlation between megamitochondrial formation and the intracellular glutamine level was determined by a linear regression analysis.
ATP Content Assay
After treating cells with dsRNAs, the cells were lysed as described previously (51) and the lysates were quickly frozen in liquid nitrogen. The frozen samples were boiled for 10 min to destroy endogenous ATPase activity followed by centrifugation at 15,000 × g for 5 min at 4 °C. Supernatants were measured for cellular ATP levels using the ATP bioluminescent assay kit (Sigma) according to manufacturer's instructions. ATP levels were normalized to its protein content.
RESULTS
Ablation of SPS1/SelD mRNA Causes Vacuole-like Globular Structure Formation, ROS Generation, and Growth Retardation but Not Impairment of Selenoprotein Synthesis
To ablate SPS1/SelD mRNA, we targeted the sequence 126–918 bp within SPS1/SelD mRNA (NCBI accession number NM_166045). dsRNA targeting SPS1/SelD mRNA was prepared and administered to the culture medium as described under “Experimental Procedures.” On day 1 after SPS1/SelD dsRNA treatment, its mRNA level was decreased to ∼80%, and on day 2 its mRNA level was decreased to more than 90% when compared with the SPS1/SelD mRNA level in GFP dsRNA-treated cells (Fig. 1A). The level of SPS2 mRNA, the paralogue of SPS1/SelD in Drosophila, however, was not changed during this time period. The expression of SPS1/SelD was also examined, and this protein was substantially reduced on day 1 but was not detectable on day 2, or thereafter (Fig. 1B).
FIGURE 1.
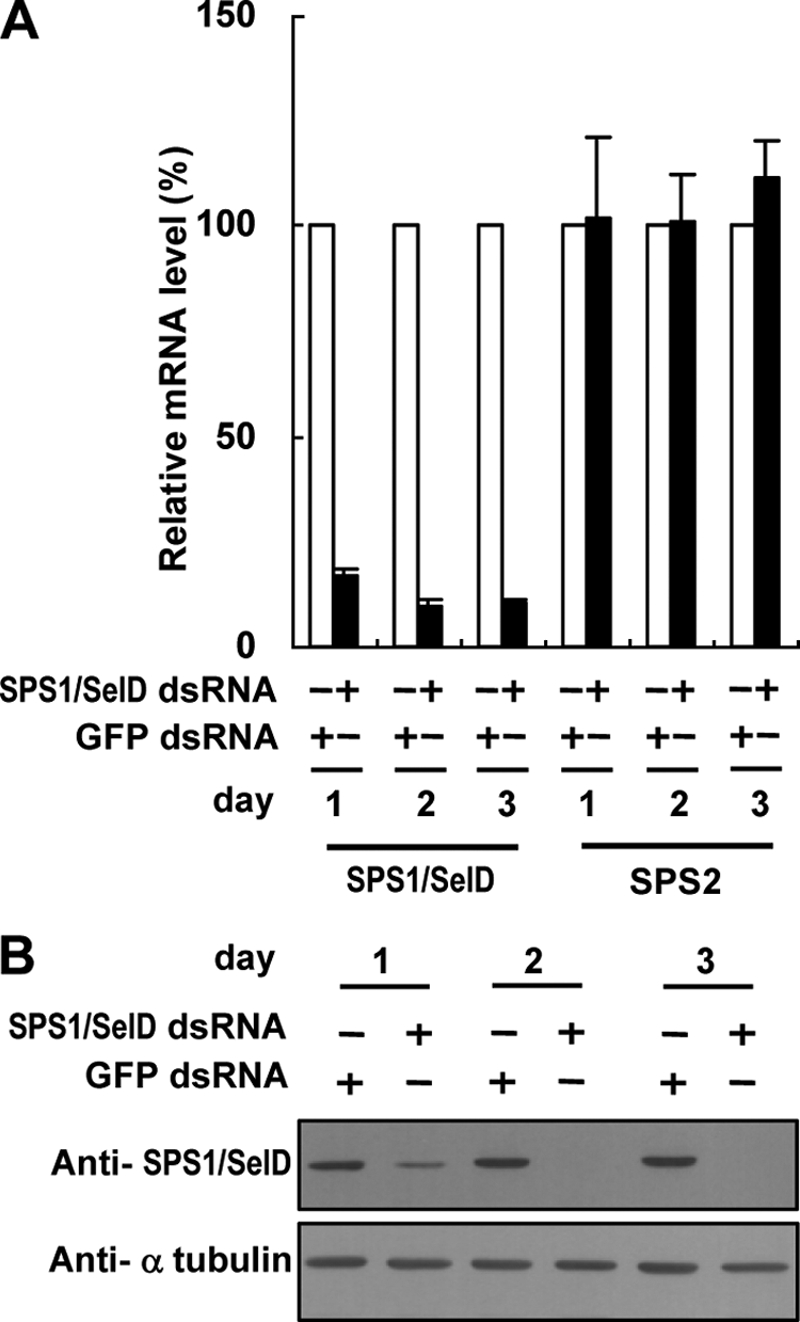
SPS1/SelD knockdown does not reduce the level of SPS2 mRNA. A, level of SPS1/SelD and SPS2 mRNA was measured by real time reverse transcription-PCR and normalized to that of rp49. The relative mRNA levels of SPS1/SelD and SPS2 in SPS1/SelD knockdown cells (closed bars) were calculated by comparing the normalized value to those in GFP dsRNA-treated cells (open bars), the value of which was set to 100%. B, level of SPS1/SelD was determined by Western blotting using anti-SPS1/SelD antibody. α-Tubulin was used as a loading control.
We also examined selenoprotein expression by labeling the cells with 75Se and found that selenoprotein levels were not changed in SPS1/SelD knockdown cells (Fig. 2A). This indicates that SPS1/SelD does not influence the synthesis of selenoproteins, which is consistent with previously published reports (20–22). Interestingly, as shown in Fig. 2B, when SL2 cells were treated with SPS1/SelD dsRNA, their cell surface became coarse and vacuole-like globular structures (VLGSs) formed in the cytoplasm, which were transparent and occurred in a variety of sizes. VLGSs were observed after 2 days following dsRNA treatment, and most of cells formed VLGSs on day 4. Some of the VLGSs were of similar size as the nucleus by day 4 (Fig. 2B, right panel).
FIGURE 2.

Phenotypic changes induced by SPS1/SelD knockdown. A, SPS1/SelD knockdown does not affect selenoprotein synthesis. Cells were labeled with 75Se, a protein extract was prepared, an aliquot of the extract was electrophoresed on a polyacrylamide gel, and the developed gel was exposed to a PhosphorImager for 3 h as described under “Experimental Procedures.” The panels represent an autoradiogram (left panel) and the corresponding gel stained with Coomassie Blue (right panel). B, SPS1/SelD knockdown induces VLGS formation. After treating SL2 cells with dsRNA, cells were examined under an inverted microscope and photographed with a CCD camera. Each panel shows the morphology of cells on day 4. The magnification was ×400. C, ROS were generated by SPS1/SelD knockdown. Four days after dsRNA treatment, cells were stained with 10 μm 2′,7′-dichlorofluorescein diacetate for 30 min at 25 °C and observed with a LSM510 confocal microscope. Scale bars represent 10 μm. D, effect of SPS1/SelD loss on cell growth. The growth rate was examined by MTT assay in GFP or SPS1/SelD dsRNA-treated cells as described under “Experimental Procedures.” Control cells were not transfected with dsRNA. Experiments were performed in triplicate, and error bars denote the standard deviation from the mean of three independent experiments.
Because null mutation of patufet, which, as noted in the Introduction, is another name used for the SPS1/SelD gene, caused embryonic lethality and induced ROS generation in Drosophila (25), ROS generation and growth retardation might be expected to occur in SL2 cells following SPS1/SelD knockdown. As shown in Fig. 2, C and D, SPS1/SelD knockdown did indeed lead to ROS generation and growth retardation. These observations provide further evidence that SPS1/SelD is an essential gene, and its function may be involved with ROS scavenging.
VLGSs Are Swollen Mitochondria
To identify the origin of the VLGSs, cells were stained using various fluorescent dyes that stain each micro-organelle specifically. We then observed the stained cells under a confocal microscope. The dyes that stain the Golgi complex, endoplasmic reticulum, or lysosome did not stain VLGSs (supplemental Fig. S1). Surprisingly, VLGSs were stained with mitochondrial markers. The membrane of VLGSs was stained clearly with MitoTracker Red, whereas the inner space of the VLGSs was stained with calcein-AM (Fig. 3A). To obtain a finer image, cultured cells were transferred onto a concanavalin A-coated cover glass that helped to increase cell adhesion. By employing this latter method, VLGSs were found to be perfectly merged with fluorescent signals (Fig. 3A, inset). MitoTracker Red stains mitochondria through binding with mitochondrial proteins (52). The reason why the membrane was more clearly stained than the inner space of the swollen mitochondria was because cristae-bound proteins moved around the outer membrane during swelling, and this cristae rearrangement reduced protein density in the inner space.
FIGURE 3.

VLGSs are swollen mitochondria. A, mitochondrial staining of dsRNA-treated cells. Four days after dsRNA treatment, cells were stained with fluorescent dyes, MitoTracker Red and calcein-AM/CoCl2, which specifically stain mitochondria. The cells were then observed under a confocal microscope as described under “Experimental Procedures.” Insets in lower panels show the images of photographed cells seeded onto concanavalin A-coated cover glass. Although MitoTracker primarily stains mitochondrial membranes, calcein-AM/CoCl2 stains the matrix in the VLGSs. Scale bars represent 5 μm in all images except for insets, which represent 2 μm. B, immunostaining the protein within the mitochondrial inner membrane. Immunocytochemistry was carried out using antibody against ATP synthase subunit α, which is localized in the mitochondrial inner membrane. Scale bars represent 5 μm.
To verify that the structure stained by MitoTracker is the mitochondrial membrane, we employed immunostaining using the antibody against ATP synthase subunit α. This subunit is localized on the inner membrane of the mitochondria. As shown in Fig. 3B, ATP synthase was localized on the membrane of VLGSs showing a similar pattern of staining as with MitoTracker.
These results indicate that the VLGSs are swollen mitochondria. By considering the size of the VLGSs, VLGSs cannot be simple swollen mitochondria but most likely are megamitochondria. The fact that the inner space of these enlarged mitochondria was stained with calcein-AM indicates that Co2+ could not enter into the mitochondria and that the mitochondrial inner membrane still remained intact during the process of forming enlarged mitochondria.
Electron Microscopic Analysis Reveals That VLGSs Are Megamitochondria
To examine the structure of the VLGSs in more detail, cells were observed under the transmission electron microscope. As shown in Fig. 4A, normal mitochondria, which occur in control cells, were ovoid or spherical in shape with intact inner and outer membranes. In addition to the membrane, cristae (Fig. 4A, inset, see arrows) were invaginated from the inner boundary of the membrane and protruded into the matrix (Fig. 4A, inset). The size of these mitochondria was less than 0.5 μm in diameter, and 20–30 of them occurred in a cross-section of a single cell. In contrast, most of the cells in which SPS1/SelD was down-regulated had enlarged mitochondria that were 2.5–3.5 μm in diameter. These mitochondria were 20–40- fold larger than normal mitochondria, wherein three to five of the enlarged ones were observed on a cross-section of a single cell (Fig. 4B). The enlarged mitochondria in SL2 cells had double membrane structures, and cristae were found at the membrane periphery (Fig. 4B, arrows). These structural characteristics are similar to the megamitochondria described by Tandler and Hoppel (39). For these reasons, we conclude that the enlarged mitochondria in SPS1/SelD knockdown cells are indeed megamitochondria.
FIGURE 4.

Analysis of VLGSs with TEM. A, TEM image of GFP dsRNA-treated cells. Four days after dsRNA treatment, cells were analyzed by TEM as described under “Experimental Procedures.” Inset indicates an amplified image from within the rectangular region. Mt(O), Mt(S), and NU represent ovoid and spherical forms of mitochondria and the nucleus, respectively. Cristae are denoted by arrows. Scale bar at the bottom represents 1 μm and in the inset 200 nm. B, TEM image of SPS1/SelD knockdown cells. The cells were prepared on day 4 and photographed. As described in the text, the sizes of diameter of swollen mitochondria were 2–5 μm, which is the typical size of megamitochondria. Cristae of fully developed megamitochondria are located on the periphery of the mitochondrial membrane (marked as arrows). MMt designates megamitochondrion. Scale bar represents 1 μm. C, fusion intermediate forming megamitochondrion. Fused inner membrane is marked with a brace. The small mitochondrion on the left appears to be a simple swollen mitochondrion, and the large one on the right is a megamitochondrion. Open, closed arrowheads, and SMt indicate inner and outer membrane and simple swollen mitochondrion, respectively. Scale bar represents 200 nm.
As megamitochondria have been reported to be formed through fusion between mitochondria (38), the megamitochondria induced by SPS1/SelD knockdown were further examined to assess whether there were any fusion intermediates with higher magnification. An example of a fusion intermediate was observed as shown in Fig. 4C, where two mitochondria of different sizes are fusing. In this case, two outer membranes were already fused, and the inner membranes were under fusion. Half of the inner membranes seemed to be fused (Fig. 4C, brace), whereas the other part remained separated (indicated by the open arrowheads). These observations corresponded to the proposed mechanism that two mitochondria of different sizes as well as the same size can form megamitochondria (38). The data suggest that as a consequence of the loss of SPS1/SelD expression, mitochondria become swollen, and the swollen mitochondria fuse to form megamitochondria.
Down-regulation of Glutamine Synthetase 1 or l(2)01810 Prevents Megamitochondrial Formation
We assumed that the protein(s) responsible for megamitochondrial formation would most likely be localized in the mitochondria, and their expression would be affected by SPS1/SelD knockdown. The transcription profile was examined in cells wherein SPS1/SelD was targeted for removal using microarray analysis (GEO accession number GSE17685), and the expression of ∼200 genes was found to be changed significantly. By searching the AmiGO, eight genes were predicted to be localized in the mitochondria. There were three down-regulated genes, Dare, CG15093, and Debcl, and five up-regulated genes, GS1, Pepck, Adk3, CG8745, and CG 31075. To examine the possible role of the down-regulated genes in megamitochondrial formation, each gene was targeted with the corresponding dsRNA. dsRNAs were prepared and administered to SL2 cells, and the cells were examined for megamitochondrial formation. When the frequency of megamitochondria was expressed as the percentage of cells containing this enlarged organelle, the frequencies of megamitochondrial formation by the knockdown of Dare, CG15093, and Debcl were 3.9, 12, and 2.9%, respectively (see Table 1). These values were similar to the frequency of megamitochondrial formation in control cells treated with dsRNA of GFP (3.7%). Thus, the genes found to be down-regulated did not appear to be involved in inducing megamitochondrial formation.
TABLE 1.
Induction of megamitochondrial formation
| dsRNA | No. of total cells counted | Frequency of MMta formationb (mean ± S.D.c, %) | Gene ontology (biological process) |
|---|---|---|---|
| GFP | 321 | 3.7 ± 0.3 | —d |
| SPS1/SelD | 425 | 78.6 ± 0.9 | Cell proliferation |
| Dare | 308 | 3.9 ± 0.4 | Steroid biosynthetic process |
| CG15093 | 260 | 12.0 ± 0.8 | Pentose-phosphate shunt |
| Debcl | 315 | 2.9 ± 0.2 | Induction of apoptosis |
a MMt is megamitochondria.
b Frequency of megamitochondria formation was calculated by dividing the number of cells containing megamitochondria with the number of total cells counted and expressed as a percentage.
c S.D. is standard deviation.
d Control (GFP).
For the up-regulated genes, each gene was individually knocked down along with SPS1/SelD, and the frequency of megamitochondrial formation was observed in the doubly knocked down cells. The inhibition rate was calculated using the following equation: 100 × (1 − FTG/FCG) %, where FTG designates the frequency of megamitochondrial formation by the double knockdown of the test gene with SPS1/SelD, and FCG indicates the frequency of megamitochondrial formation by the double knockdown of the control gene, GFP, with SPS1/SelD. The inhibition rates by the double knockdown of Pepck, Adk3, CG8745, and CG31075 with SPS1/SelD were in the range of 2.4 and 13.1% indicating that these genes did not inhibit megamitochondrial formation (Table 2). However, when GS1 was knocked down, the inhibition rate was dramatically increased to 90% suggesting GS1 participated in megamitochondrial formation (Table 2). Furthermore, when methionine sulfoximine, which is an inhibitor of glutamine synthetase (53), was added to SPS1/SelD knockdown cells, less than 10% of the cells formed megamitochondria (supplemental Fig. S2). These results indicate that the activation of GS1 is responsible for megamitochondrial formation.
TABLE 2.
Inhibition of megamitochondrial formation
| dsRNA including SPS1/SelD dsRNA | No. of total cells counted | Frequency of MMta formation (mean ± S.D., %) | Inhibition rateb % | Gene ontology (biological process) |
|---|---|---|---|---|
| GFP | 158 | 77.2 ± 1.8 | 0 | —c |
| Pepck | 154 | 75.3 ± 1.3 | 2.5 | Gluconeogenesis |
| Adk3 | 170 | 67.1 ± 1.5 | 13.2 | ADP biosynthetic process |
| CG8745 | 181 | 73.5 ± 2.1 | 4.8 | Amino acid metabolism |
| CG31075 | 160 | 68.2 ± 1.9 | 11.7 | Pyruvate metabolic process |
| GS1 | 140 | 7.9 ± 0.2 | 89.8 | Glutamine metabolic process |
a MMt is megamitochondria.
b Inhibition rate (%) was calculated as 100 × (1 − FTG/FCG), where FTG designates the frequency of megamitochondria formation by the double knockdown of the test gene with SPS1/SelD and FCG the frequency of megamitochondria formation by the double knockdown of control genes (SPS1/SelD and GFP).
c Control (GFP).
To assess whether additional genes may be involved in megamitochondrial formation, those genes that showed a similar expression pattern as GS1 in SPS1/SelD knocked down cells were further examined. Using the self-organizing map clustering method, 65 genes were grouped in the same cluster with GS1. Among these genes, eight (Alp23b, CG3085, CG8745, CG16888, CG31337, CG32625, l(2)01810, and Tsp42Ed) showed at least a 2-fold change in their expression levels on day 3 compared with those observed in cells on day 1. Each of these genes with the exception of CG8745, which had already been tested (see Table 2), was also examined to assess whether they were related to megamitochondrial formation. As shown in Table 3, the knockdown of l(2)01810 significantly inhibited megamitochondrial formation with an inhibition rate of 84%, which was similar to that caused by loss of GS1. The other genes did not inhibit megamitochondrial formation. The confocal microscopic images of the effects of GS1-SPS1/SelD and l(2)01810-SPS1/SelD double knockdown on the formation of megamitochondria are shown in Fig. 5. Megamitochondrial formation was almost completely inhibited by double knockdown of either GS1-SPS1/SelD or l(2)01810-SPS1/SelD (Fig. 5). These results suggest that l(2)01810, which has a similar expression pattern to that of GS1 in SPS1/SelD knocked down cells, participates in the same metabolic pathway with GS1, i.e. in the glutamine biosynthesis pathway.
TABLE 3.
Inhibition of megamitochondrial formation by knockdown of genes showing the same expression pattern with GS1
| dsRNA including SPS1/SelD dsRNA | Total no. of cells counted | Frequency of MMta formation (mean ± S.D., %) | Inhibition rateb % | Gene ontology (biological process) |
|---|---|---|---|---|
| GFP | 158 | 77.2 ± 1.8 | 0 | —c |
| l(2)01810 | 244 | 12.3 ± 0.8 | 84.1 | Transport |
| CG16888 | 115 | 70.7 ± 0.7 | 8.5 | Unknown |
| CG3085 | 239 | 71.1 ± 2.6 | 6.6 | Microtubule cytoskeleton organization and biogenesis |
| CG31337 | 105 | 68.5 ± 2.0 | 10.1 | Unknown |
| CG32625 | 133 | 69.0 ± 1.4 | 10.6 | Unknown |
| Alp23b | 105 | 67.7 ± 2.8 | 12.4 | Unknown |
| Tsp42Ed | 115 | 71.6 ± 2.8 | 7.3 | Unknown |
a MMt is megamitochondria.
b The inhibition rate (%) was calculated in same manner as described in Table 2.
c Control (GFP).
FIGURE 5.

Knockdown of GS1 or l(2)01810 inhibits the formation of megamitochondria that are induced by SPS1/SelD knockdown. Cells were transfected with GS1 or l(2)01810 dsRNA together with SPS1/SelD dsRNA as described under “Experimental Procedures.” Four days after dsRNA treatment, confocal microscopy was carried out following MitoTracker Red staining. Scale bars represent 5 μm.
Glutamine Synthetase 1 and l(2)01810 Can Cooperatively Induce Megamitochondrial Formation
The fact that the knockdown of GS1 or l(2)01810 inhibited megamitochondrial formation induced by SPS1/SelD knockdown implies that the overexpression of GS1 or l(2)01810 can induce such an anomaly. Therefore, vectors that can overexpress GS1 or l(2)01810 were constructed and transfected into SL2 cells, and the formation of megamitochondria in the resulting cells was examined. Transfection efficiencies of all the experimental groups were ∼75%, which was determined by co-transfecting the cells with the GFP-expressing vector. Unexpectedly, in GS1-overexpressed cells, the size of megamitochondria was smaller compared with those found in SPS1/SelD knockdown cells. Many cells containing both simple swollen mitochondria and megamitochondria were observed suggesting megamitochondrial formation was retarded (Fig. 6). In contrast, in cells overexpressing only l(2)01810 or overexpressing both GS1 and l(2)01810, megamitochondria were formed with relatively higher frequency than induced by GS1 overexpression. Megamitochondria were formed in higher frequency in cells co-expressing GS1 and l(2)01810 than in the cells expressing only l(2)01810. These results indicate that the individual induction of GS1 or l(2)01810 expression is not sufficient for maximum efficiency of megamitochondrial formation and that these two genes can cooperatively induce such formation (see below and Fig. 7B).
FIGURE 6.

Overexpression of GS1 or l(2)01810 can induce megamitochondrial formation. Confocal image of GS1 or l(2)01810 overexpressed cells. SL2 cells were transfected with a vector that expresses GS1-HA or l(2)01810-HA fusion protein separately or together. Three days after transfection, cells were stained with MitoTracker Red and examined by confocal microscopy. Mock represents the cells transfected with backbone vector and used as a control. Cells containing only simple swollen mitochondria found in GS1 overexpressing cells are indicated with arrows and megamitochondria with arrowheads.
FIGURE 7.

Co-relationship between the formation of megamitochondria and intracellular glutamine level. A, frequency of cells forming megamitochondria and the intracellular glutamine level were measured in GS1-SPS1/SelD or l(2)01810-SPS1/SelD double knockdown cells. dsRNAs targeting GS1, SPS1/SelD, or l(2)01810 were prepared separately. For double knockdown, the mixtures of dsRNA targeting SPS1/SelD and either GS1 or l(2)01810 were prepared, and each mixture was added into the culture medium. The different dsRNAs used are shown on the x axis. Closed and open bars designate glutamine level and the frequency of cells, respectively. Experiments were performed in triplicate, and error bars denote the standard deviation from the mean of three independent experiments. Statistical significance was tested by pairwise Student's t test with Bonferroni correction for multiple testing. ** indicates significance at p < 0.0083 (α = 0.05, n = 6). A total of 500 cells was counted to determine the frequency of cells forming megamitochondria. B, megamitochondrial formation and glutamine level were also examined in the cells overexpressing GS1, l(2)01810, or both. Vectors for expressing GS1-HA or l(2)01810-HA were transfected separately or together into SL2 cells, and both the frequency of cells containing megamitochondria and the intracellular glutamine level were measured. Overexpressed proteins are shown on the x axis. Mock represents control cells transfected with the backbone vector. ** indicates significance at p < 0.0083 (α = 0.05, n = 6). C, correlation between megamitochondrial formation and the glutamine level. Linear regression analysis was performed using R software for 24 data sets obtained from knockdown and overexpression experiments. The equation for the relationship between the glutamine level (x) and frequency of megamitochondrial formation (y) was y = 1.235x − 11.329, where x is the glutamine level, and the correlation coefficient (r) was 0.94 (p value of slope = 2.91e−12).
Because ROS accumulated in SL2 knockdown cells (Fig. 2C), it was important to assess whether this accumulation may account for the induction of megamitochondrial formation by activating GS1 and l(2)01810. When the cells were treated with tert-butyl hydroperoxide, which is a peroxide inducer, and with paraquat, which is a superoxide inducer, megamitochondria were not formed and expression of GS1 and l(2)01810 was not increased (supplemental Fig. S4). It should be noted that, as shown in Fig. 2C, cells containing megamitochondria and generating ROS were not matched suggesting that ROS accumulation and megamitochondrial formation occurred as independent events. Thus, even though ROS accumulated in SL2 cells following SPS1/SelD knockdown, ROS did not appear to lead to the activation of GS1 and l(2)01810 and megamitochondrial formation.
Elevated Intracellular Glutamine Level Is a Signal for Megamitochondrial Formation
As the primary function of GS1 is to catalyze the synthesis of glutamine and GS1 was enriched in SPS1/SelD knockdown cells, the synthesis and accumulation of glutamine seemed likely to be responsible for megamitochondrial formation. Therefore, the relationship between megamitochondrial formation and the level of glutamine was examined. The level of glutamine in SPS1/SelD knockdown cells was 55.86 nmol/107 cells, which is 3.8-fold higher than that in GFP dsRNA-treated cells (14.61 nmol/107 cells) as shown in Fig. 7A. However, the levels of glutamine were decreased to 18.23 and 14.35 nmol/107 cells in GS1-SPS1/SelD- and l(2)01810-SPS1/SelD-deficient cells, respectively. These results imply that the knockdown of GS1 or l(2)01810 reduces the glutamine level ∼70% from that elevated by SPS1/SelD knockdown (p < 0.0083). Before measuring the glutamine level, the frequency of megamitochondrial formation was also measured in each experiment. When GS1 or l(2)01810 were knocked down along with SPS1/SelD, formation of megamitochondria was decreased to the basal level observed in the GFP dsRNA-treated control cells (p < 0.0083).
The increase in the level of intracellular glutamine in the SPS1/SelD-deficient cells is clearly caused, at least in part, by increasing GS1 activity, but decreased glutamine utilization, transport, or other mechanisms may also play a role. To assess whether GS1 activity was increased by SPS1/SelD deficiency, we measured GS activity in vitro by using extracts prepared from the mitochondria of SPS1/SelD knockdown cells. GS activity was increased ∼1.7 times in SPS1/SelD knockdown cells compared with control cells demonstrating that the increase in glutamine level was due, at least partly, to the enzymatic activity of GS1 (supplemental Fig. S3).
The relationship between the level of glutamine and megamitochondrial formation was also examined in cells overexpressing GS1 or l(2)01810 (Fig. 7B). When GS1 was overexpressed, the level of glutamine (37.71 nmol/107 cells) was increased 2.5-fold (p < 0.0083) compared with mock (pAcPA) transfection (15.01 nmol/107 cells). In cells expressing l(2)01810, the level of glutamine (61.01 nmol/107 cells) was increased ∼4-fold compared with control cells. In cells expressing both GS1 and l(2)01810, the level of glutamine was 5.6-fold higher (p < 0.0083) compared with control cells, which was the highest observed level (84.19 nmol/107 cells). These results suggest that GS1 and l(2)01810 are involved cooperatively in glutamine synthesis.
As observed with the glutamine level, megamitochondrial formation frequency was also increased by overexpressing GS1 and/or l(2)01810. The frequency of megamitochondrial formation in the cells overexpressing GS1 was increased 17.5-fold (50.7%) compared with mock (pAcPA)-transfected control cells (2.9%). Overexpression of l(2)01810 increased the frequency of megamitochondrial formation 24.3-fold (70.5%) compared with the mock-transfected control experiment, and overexpression of both GS1 and l(2)01810 was 26.0- fold (75.7%) compared with the mock-transfected control experiment.
Interestingly, the changes in the glutamine level induced by knockdown of SPS1/SelD or by overexpression of GS1 and l(2)01810 occurred in a similar manner as the frequency of megamitochondrial formation. As shown in Fig. 7C, the correlation coefficient (r) between the glutamine level and megamitochondrial formation efficiency was 0.94 indicating a possible relationship between these two parameters.
These results suggest that the elevated intracellular glutamine level can serve as a signal for such formation. It is interesting that the overexpression of GS1 increased the intracellular glutamine level by only a small portion, whereas the inhibition of GS1 expression inhibited glutamine synthesis almost completely. These results suggest that the newly expressed GS1 is in an inactive state, and for the inactive protein to obtain catalytic activity, a specific activation process is required (see under “Discussion”).
Mitochondrial Function Is Not Inhibited in SPS1/SelD Knockdown Cells
It was also important to assess whether mitochondrial function was impaired in SPS1/SelD-deficient cells as mitochondrial swelling often alters mitochondrial gene expression that leads to apoptosis or necrosis (35). To examine whether changes occurred in the function of mitochondria by SPS1/SelD knockdown, the expression pattern of mitochondrial genes, size of mitochondrial DNA, and ATP levels were analyzed.
Northern blot analysis showed that the expression levels of genes such as Cyb, ND5, and COI in SPS1/SelD knockdown cells were similar to those in control cells (Fig. 8A). The mitochondrial DNA content and size were also analyzed by Southern blot analysis using the DNA encoding ND5 gene as a probe. There were no significant differences between SPS1/SelD knockdown cells and control cells in their DNA content, and no degradation of mitochondrial DNA was detected in either cell type (Fig. 8B). In addition, no fragmentation of genomic DNA was found in the cells containing megamitochondria (supplemental Fig. S5A). Other typical characteristics of apoptosis such as cell blebbing were not observed even in cells that were further incubated up to 7 days after the administration of SPS1/SelD dsRNA (supplemental Fig. S5B). These results suggest that apoptosis was not induced by SPS1/SelD knockdown in SL2 cells, even though megamitochondria were formed. We therefore assume that the mechanism of megamitochondrial formation mediated by SPS1/SelD knockdown is different from that caused by most of the other treatments that lead to apoptosis or necrosis.
FIGURE 8.

Analysis of mitochondrial function in SPS1/SelD knockdown cells. A, analysis of mitochondrial gene expression. mRNA levels of cytochrome b, ND5, and COI, were examined by northern blotting. The film was exposed for 48 h. Probes are shown on the left of the autoradiogram. Treatment times and types of dsRNAs used in treating cells are shown at the top. Although SPS1/SelD mRNA was ablated, the level of mitochondrial RNAs was not changed by SPS1/SelD knockdown. B, Southern hybridization analysis of mitochondrial and nuclear DNA. Total genomic DNA containing mitochondrial DNA was prepared and digested with restriction enzyme, and Southern hybridization was performed using ND5 (mitochondrial gene) and rp49 (nuclear gene) genes as probes. The film was exposed for 48 h. Neither the degradation of mitochondrial or nuclear DNA nor reduction of DNA content was observed in SPS1/SelD knockdown cells. C, measurement of intracellular ATP levels. Cellular ATP levels were measured in dsRNA-treated cells as described under “Experimental Procedures.” The level of ATP was normalized to the protein contents. Oligomycin, an inhibitor of ATP synthase, was added to the cells to inhibit the function of mitochondria and used as a negative control for ATP synthesis. Experiments were performed in triplicate. Standard deviations from the mean are indicated by error bars.
As most ATP of the cell is synthesized in the mitochondria, the intracellular ATP level is directly related to mitochondrial function. Therefore, the ATP level was measured in the total extracts obtained from SPS1/SelD knockdown cells using the ATP-driven luciferase assay method. As shown in Fig. 8C, ATP levels varied in the range of 6.5–14.9 nmol/mg protein after SPS1/SelD knockdown. These amounts were slightly higher than those of GFP dsRNA-treated cells (5.6–8.8 nmol/mg protein), and on day 5, the ATP level was ∼1.8-fold higher in SPS1/SelD knockdown cells than in control cells (GFP dsRNA-treated cells). Thus, SPS1/SelD knockdown apparently does not inhibit ATP synthesis. The increased level of ATP in SPS1/SelD knockdown cells on day 5 was likely caused by a decreased consumption of ATP. The growth of cells was significantly retarded on day 5 after SPS1/SelD knockdown (see Fig. 2D), and this may result in the reduction of ATP consumption. The fact that mitochondrial gene expression was not changed, mitochondrial DNA was not degraded, and ATP synthesis was not inhibited strongly suggests that the mitochondria function normally.
SPS1/SelD Knockdown Causes Mitochondrial Swelling without Affecting Mitochondrial Membrane Potential
As mitochondria occur in two forms regarding their membrane potential, high and low membrane potential, it was also of interest to determine whether mitochondrial swelling is dependent on the mitochondrial membrane potential. JC-1 dye can stain mitochondria differentially depending on their membrane potential. At low membrane potential (depolarized mitochondria), JC-1 exists as a monomer that fluoresces as a green signal, and in contrast, at high membrane potential, JC-1 forms J-aggregates that fluoresce as a red signal (54). As shown in Fig. 9A, when the cells were stained with JC-1, all megamitochondria were present in green color indicating that they are depolarized.
FIGURE 9.

Effect of SPS1/SelD knockdown on mitochondrial membrane potential. A, confocal image of JC-1-stained cells. Four days after dsRNA treatment, cells were stained with JC-1 and observed under the confocal microscope. 2 μm FCCP or rotenone was added to the cells for 6 h to inhibit mitochondrial function and used as positive controls for membrane depolarization. Green and red spots in each panel represent mitochondria whose membrane potential is low and high, respectively. Scale bars represent 5 μm. B, FACS analysis. Changes of MMP were measured quantitatively by FACS analysis as described under “Experimental Procedures.” x axis displays fluorescence 1 measurement (green fluorescence is indicative of JC-1 monomers or low MMP), and y axis displays fluorescence 2 measurement (red fluorescence is indicative of JC-1 aggregates or high MMP). Numbers are percent of the cell population in each quadrant. Data represent mean of three separate experiments.
We next treated the cells with FCCP and rotenone that specifically induce depolarization of mitochondria to elucidate whether depolarization may have a role in megamitochondrial formation. The treatment of cells with FCCP induced depolarization of the mitochondrial membrane, but megamitochondria were not formed (see Fig. 9A). In contrast, both mitochondrial depolarization and megamitochondrial formation were induced in rotenone-treated cells. These results suggest that depolarization of the mitochondrial membrane is not sufficient for megamitochondrial formation, and an additional process is required for the depolarized mitochondria to become megamitochondria. The mechanism of megamitochondrial production induced by SPS1/SelD knockdown seems to be different from that of rotenone induction due to the fact that there were many polar mitochondria when the cells were knocked down with SPS1/SelD.
To determine whether SPS1/SelD knockdown influences the polarity of mitochondria, we counted the number of polar mitochondria shown as red signals when the SPS1/SelD-deficient cells were stained with JC-1. There was an average of nine red spots in the JC-1-stained cells, which was the same number present in the GFP dsRNA-treated cells (Fig. 9A, compare left and right panels). To quantify MMP, SPS1/SelD knockdown cells were analyzed using FACS. As shown in Fig. 9B, 89.26% of SPS1/SelD knockdown cells showed higher than 102 in intensity of JC-1 monomer and JC-1 aggregates, which was the same intensity observed with GFP dsRNA-treated cells (89.31%). In contrast, more than 98% of the cells were depolarized in both FCCP- and rotenone-treated cells. These results suggest that SPS1/SelD knockdown does not induce changes in MMP but induces megamitochondrial formation only in the depolarized mitochondria.
DISCUSSION
As noted in the Introduction, SPS1/SelD does not appear to be involved in the selenophosphate biosynthetic pathway, even though this protein has high sequence homology with SPS2, which is the true catalytic enzyme in selenophosphate synthesis (20, 21). However, SPS1/SelD apparently has an essential role in cellular metabolism, at least in Drosophila (23), but its function has not been determined. To elucidate the function of SPS1/SelD, RNA interference was employed to knock down its expression in Drosophila SL2 cells. As expected, SPS1/SelD knockdown caused both ROS induction and growth retardation, which provides further support that SPS1/SelD is an essential gene. Interestingly, the loss of SPS1/SelD expression resulted in the activation of glutamine biosynthesis and the elevation of glutamine, which in turn induced megamitochondrial formation. Therefore, an important function of SPS1/SelD appears to be in regulating the intracellular glutamine level. To our knowledge, this finding is the first report that SPS1/SelD controls the intracellular level of glutamine and that the elevation of glutamine induces megamitochondrial formation.
We found that both GS1 and l(2)01810 are responsible for megamitochondrial formation. Knockdown of GS1 or l(2)01810 completely inhibited the formation of megamitochondria and glutamine synthesis. However, when GS1 was overexpressed, the frequency of megamitochondrial formation was lower; the process of megamitochondrial formation was slower, and the level of glutamine was lower compared with those in cells where l(2)01810 was overexpressed (Fig. 7B). In addition, co-expression of GS1 and l(2)01810 showed a synergistic effect on both glutamine synthesis and megamitochondrial formation. These observations suggest that most of the newly synthesized GS1 exists in an inactive form, and the inactive protein(s) must be activated to participate in glutamine synthesis. In bacteria, the activity of GS, which is a homologue of Drosophila GS1, is regulated by cyclic interconversion of GS into two forms, GS (active) and GS-AMP (inactive), and in the activation process, Pi is required to form ADP from AMP (55). In addition, according to FlyBase, the gene function of l(2)01810 (FBgn0010497) is predicted to have a high affinity inorganic phosphate:sodium symporter activity. Therefore, it can be assumed that l(2)01810 transports inorganic phosphate into the cell, and inorganic phosphate in turn can be used to transform the inactive GS1-AMP to active GS1 and ADP. Because the co-expression of GS1 and l(2)01810 showed similar levels of megamitochondrial formation and glutamine as those induced by SPS1/SelD knockdown, the expression of these two genes seem to be sufficient for glutamine-induced megamitochondrial formation. SPS1/SelD appears to tightly regulate the level of glutamine by regulating the expression of both l(2)01810 and GS1.
The formation of megamitochondria is known to be induced by physiological conditions such as aging, alcoholic injury, depletion of nutrients, and/or treatment of drugs as described in the Introduction. The intra-mitochondrial structure of megamitochondria was also similar to that induced by the above described conditions in that there were unfolded and shortened cristae confined to the membrane periphery (39). It was reported that extended hydrazine treatment led to megamitochondrial formation and induction of apoptosis (56). However, megamitochondria formed by high intracellular levels of glutamine did not seem to induce apoptosis, likely because various apoptotic signals such as DNA fragmentation and cell blebbing also did not occur (supplemental Fig. S5). These results suggest that the megamitochondria-forming pathway induced by glutamine overproduction is different from that mediated by treating with drugs such as cuprizone or hydrazine.
Cell growth was retarded significantly in SPS1/SelD knockdown cells (Fig. 2D). To assess whether megamitochondrial formation may lead to growth retardation, GS1 and l(2)01810 were overexpressed in SL2 cells. Unexpectedly, the overexpression of GS1 and l(2)01810 did not enhance growth retardation significantly compared with that observed by SPS1/SelD knockdown (Fig. 2D). Moreover, co-expression of l(2)01810 with GS1 reduced the growth retardation effect of l(2)01810 (compare supplemental Fig. S6 with Fig. 2D). These results together with the observation that megamitochondria did not undergo apoptosis suggest that the presence of megamitochondria affect cell growth very little, if at all, and that other factors are involved in growth retardation.
It should be noted that megamitochondria can also be produced by a high protein diet (57). Such high protein diets may cause an increase in the intracellular amino acid levels and presumably the level of glutamine. It would therefore seem that the intracellular glutamine level can serve as a sensor for nutritional stress, which in turn induces megamitochondrial formation. Interestingly, SPS1/SelD apparently is involved in the control of nutritional stress. Therefore, determination of the relationship between cellular nutritional status and SPS1/SelD expression will be an important area of investigation in future studies.
Supplementary Material
Acknowledgments
We thank Drs. Vadim N. Gladyshev and Andrew Patterson for critical reading of the manuscript, Drs. Soyeon Ahn and Alexei Lobanov for re-evaluating our statistical analyses of the data, and Min-Hyuk Yoo for technical support.
This work was supported by the Korea Research Foundation Grants KRF-2005-070-C00086 and KRF-2008-005-J00201 funded by the Korean Government (Ministry of Education, Science, and Technology) (to B. J. L.). This work was also supported in part by a National Institutes of Health Intramural Research Program grant from NCI, Center for Cancer Research.

The on-line version of this article (available at http://www.jbc.org) contains supplemental Figs. 1–6 and Tables S1–S3.
- ROS
- reactive oxygen species
- FACS
- fluorescence-associated cell sorter
- FCCP
- carbonyl cyanide p-trifluoromethoxyphenylhydrazone
- GS1
- glutamine synthetase 1
- JC-1
- 5,5′,6,6′-tetrachloro-1,1′,3,3′-tetraethylbenzimidazolyl-carbocyanine iodide
- MMP
- mitochondrial membrane potential
- Sec
- selenocysteine
- SL2
- Schneider cell line 2
- SPS1/SelD
- selenophosphate synthetase 1
- VLGSs
- vacuole-like globular structures
- dsRNA
- double-stranded RNA
- MTT
- 3-(4,5-dimethylthiazol-2-yl)-2,5-diphenyltetrazolium bromide
- GFP
- green fluorescent protein
- ORF
- open reading frame
- BisTris
- 2-[bis(2-hydroxyethyl)amino]-2-(hydroxymethyl)propane-1,3-diol
- PBS
- phosphate-buffered saline
- GS
- glutamine synthetase
- TEM
- transmission electron microscope.
REFERENCES
- 1.Hatfield D. L., Berry M. J., Gladyshev V. N. (ds) (2006) Selenium: Its Molecular Biology and Role in Human Health, 2nd Ed., Springer-Verlag Inc., New York [Google Scholar]
- 2.Flohé L. (2007) Biol. Chem. 388, 987–995 [DOI] [PubMed] [Google Scholar]
- 3.Papp L. V., Lu J., Holmgren A., Khanna K. K. (2007) Antioxid. Redox. Signal. 9, 775–806 [DOI] [PubMed] [Google Scholar]
- 4.Boosalis M. G. (2008) Nutr. Clin. Pract. 23, 152–160 [DOI] [PubMed] [Google Scholar]
- 5.Hoffmann P. R., Berry M. J. (2008) Mol. Nutr. Food Res. 52, 1273–1280 [DOI] [PMC free article] [PubMed] [Google Scholar]
- 6.Rayman M. P. (March25, 2009) Biochim. Biophys. Acta 10.1016/j.bbagen.2009.03.014 [DOI] [PubMed] [Google Scholar]
- 7.Hatfield D. L., Gladyshev V. N. (2002) Mol. Cell. Biol. 22, 3565–3576 [DOI] [PMC free article] [PubMed] [Google Scholar]
- 8.Brigelius-Flohé R. (2008) Chem. Biodivers. 5, 389–395 [DOI] [PubMed] [Google Scholar]
- 9.Lu J., Holmgren A. (2009) J. Biol. Chem. 284, 723–727 [DOI] [PubMed] [Google Scholar]
- 10.Lee B. J., Worland P. J., Davis J. N., Stadtman T. C., Hatfield D. L. (1989) J. Biol. Chem. 264, 9724–9727 [PubMed] [Google Scholar]
- 11.Leinfelder W., Stadtman T. C., Böck A. (1989) J. Biol. Chem. 264, 9720–9723 [PubMed] [Google Scholar]
- 12.Longtin R. (2004) J. Natl. Cancer Inst. 96, 504–505 [DOI] [PubMed] [Google Scholar]
- 13.Squires J. E., Berry M. J. (2008) IUBMB Life 60, 232–235 [DOI] [PubMed] [Google Scholar]
- 14.Allmang C., Wurth L., Krol A. (March11, 2009) Biochim. Biophys. Acta, 10.1016/j.bbagen.2009.03.003 [DOI] [PubMed] [Google Scholar]
- 15.Glass R. S., Singh W. P., Jung W., Veres Z., Scholz T. D., Stadtman T. C. (1993) Biochemistry 32, 12555–12559 [DOI] [PubMed] [Google Scholar]
- 16.Ehrenreich A., Forchhammer K., Tormay P., Veprek B., Böck A. (1992) Eur. J. Biochem. 206, 767–773 [DOI] [PubMed] [Google Scholar]
- 17.Leinfelder W., Forchhammer K., Veprek B., Zehelein E., Böck A. (1990) Proc. Natl. Acad. Sci. U.S.A. 87, 543–547 [DOI] [PMC free article] [PubMed] [Google Scholar]
- 18.Low S. C., Harney J. W., Berry M. J. (1995) J. Biol. Chem. 270, 21659–21664 [DOI] [PubMed] [Google Scholar]
- 19.Guimarães M. J., Peterson D., Vicari A., Cocks B. G., Copeland N. G., Gilbert D. J., Jenkins N. A., Ferrick D. A., Kastelein R. A., Bazan J. F., Zlotnik A. (1996) Proc. Natl. Acad. Sci. U.S.A. 93, 15086–15091 [DOI] [PMC free article] [PubMed] [Google Scholar]
- 20.Xu X. M., Carlson B. A., Mix H., Zhang Y., Saira K., Glass R. S., Berry M. J., Gladyshev V. N., Hatfield D. L. (2007) PLoS Biol. 5, e4. [DOI] [PMC free article] [PubMed] [Google Scholar]
- 21.Xu X. M., Carlson B. A., Irons R., Mix H., Zhong N., Gladyshev V. N., Hatfield D. L. ( 2007) Biochem. J. 404, 115– 120 [DOI] [PMC free article] [PubMed] [Google Scholar]
- 22.Lobanov A. V., Hatfield D. L., Gladyshev V. N. (2008) Protein Sci. 17, 176–182 [DOI] [PMC free article] [PubMed] [Google Scholar]
- 23.Alsina B., Serras F., Baguñá J., Corominas M. (1998) Mol. Gen. Genet. 257, 113–123 [DOI] [PubMed] [Google Scholar]
- 24.Morey M., Serras F., Baguñà J., Hafen E., Corominas M. (2001) Dev. Biol. 238, 145–156 [DOI] [PubMed] [Google Scholar]
- 25.Morey M., Corominas M., Serras F. (2003) J. Cell Sci. 116, 4597–4604 [DOI] [PubMed] [Google Scholar]
- 26.Palade G. E. (1952) Anat. Rec. 114, 427–451 [DOI] [PubMed] [Google Scholar]
- 27.Alberts B., Ohnson A., Lewis J., Raff M., Roberts K., Walter P. (ds) (2001) Molecular Biology of the Cell, 4th Ed., pp. 769– 772, Garland Science Press, New York [Google Scholar]
- 28.Butow R. A., Avadhani N. G. (2004) Mol. Cell 14, 1–15 [DOI] [PubMed] [Google Scholar]
- 29.Danial N. N., Korsmeyer S. J. (2004) Cell 116, 205–219 [DOI] [PubMed] [Google Scholar]
- 30.Claud A. (1946) J. Exp. Med. 84, 61–89 [PubMed] [Google Scholar]
- 31.Halestrap A. P. (1989) Biochim. Biophys. Acta 973, 355–382 [DOI] [PubMed] [Google Scholar]
- 32.Lim K. H., Javadov S. A., Das M, Clarke S. J., Suleiman M. S., Halestrap A. P. (2002) J. Physiol. 545, 961–974 [DOI] [PMC free article] [PubMed] [Google Scholar]
- 33.Peng T. I., Jou M. J. (2004) Ann. N. Y. Acad. Sci. 1011, 112–122 [DOI] [PubMed] [Google Scholar]
- 34.Gao W., Pu Y., Luo K. Q., Chang D. C. (2001) J. Cell Sci. 114, 2855–2862 [DOI] [PubMed] [Google Scholar]
- 35.Kaasik A., Safiulina D., Zharkovsky A., Veksler V. (2007) Am. J. Physiol. Cell Physiol. 292, C157–C163 [DOI] [PubMed] [Google Scholar]
- 36.Teranishi M., Karbowski M., Kurono C., Soji T., Wakabayashi T. (1999) J. Electron Microsc. (Tokyo) 48, 637–651 [DOI] [PubMed] [Google Scholar]
- 37.Tandler B., Erlandson R. A., Wynder E. L. (1968) Am. J. Pathol. 52, 69–96 [PMC free article] [PubMed] [Google Scholar]
- 38.Wakabayashi T. (2002) J. Cell. Mol. Med. 6, 497–538 [DOI] [PMC free article] [PubMed] [Google Scholar]
- 39.Tandler B., Hoppel C. L. (1986) Ann. N.Y. Acad. Sci. 488, 65–81 [DOI] [PubMed] [Google Scholar]
- 40.Caizzi R., Bozzetti M. P., Caggese C., Ritossa F. (1990) J. Mol. Biol. 212, 17–26 [DOI] [PubMed] [Google Scholar]
- 41.Rama Rao K. V., Jayakumar A. R., Norenberg M. D. (2003) Neurochem. Int. 43, 517–523 [DOI] [PubMed] [Google Scholar]
- 42.Chen C. L., Shim M. S., Chung J., Yoo H. S., Ha J. M., Kim J. Y., Choi J., Zang S. L., Hou X., Carlson B. A., Hatfield D. L., Lee B. J. (2006) Biochem. Biophys. Res. Commun. 348, 1296–1301 [DOI] [PubMed] [Google Scholar]
- 43.Jin J. S., Baek S., Lee H., Oh M. Y., Koo Y. E., Shim M. S., Kwon S. Y., Jeon I., Park S. Y., Baek K., Yoo M. A., Hatfield D. L., Lee B. J. (2004) Nucleic Acids Res. 32, 2482–2493 [DOI] [PMC free article] [PubMed] [Google Scholar]
- 44.Carlson B. A., Xu X. M., Gladyshev V. N., Hatfield D. L. (2005) J. Biol. Chem. 280, 5542–5548 [DOI] [PubMed] [Google Scholar]
- 45.Han K. (1996) Nucleic Acids Res. 24, 4362–4363 [DOI] [PMC free article] [PubMed] [Google Scholar]
- 46.Kim S., Kim S. S., Bang Y. J., Kim S. J., Lee B. J. (2003) Peptides 24, 945–953 [DOI] [PubMed] [Google Scholar]
- 47.Blin N., Stafford D. W. (1976) Nucleic Acids Res. 3, 2303–2308 [DOI] [PMC free article] [PubMed] [Google Scholar]
- 48.Lee B. J., Rajagopalan M., Kim Y. S., You K. H., Jacobson K. B., Hatfield D. L. (1990) Mol. Cell. Biol. 10, 1940–1949 [DOI] [PMC free article] [PubMed] [Google Scholar]
- 49.Kim M., Choi J., Carlson B. A., Han J. K., Rhee K., Sargent T., Hatfield D. L., Lee B. J. (2003) Biochem. Biophys. Res. Commun. 306, 1106–1111 [DOI] [PubMed] [Google Scholar]
- 50.Lund P. (1986) in Methods of Enzymatic Analysis (Bergmeyer H. U. ed) Vol. 8, pp. 357– 363, Verlag Chemie, Weinheim, Germany [Google Scholar]
- 51.Senoo-Matsuda N., Igaki T., Miura M. (2005) EMBO J. 24, 2700–2713 [DOI] [PMC free article] [PubMed] [Google Scholar]
- 52.Poot M., Zhang Y. Z., Krämer J. A., Wells K. S., Jones L. J., Hanzel D. K., Lugade A. G., Singer V. L., Haugland R. P. (1996) J. Histochem. Cytochem. 44, 1363–1372 [DOI] [PubMed] [Google Scholar]
- 53.Lamar C., Jr., Sellinger O. Z. (1965) Biochem. Pharmacol. 14, 489–506 [DOI] [PubMed] [Google Scholar]
- 54.Smiley S. T., Reers M., Mottola-Hartshorn C., Lin M., Chen A., Smith T. W., Steele G. D., Jr., Chen L. B. (1991) Proc. Natl. Acad. Sci. U.S.A. 88, 3671–3675 [DOI] [PMC free article] [PubMed] [Google Scholar]
- 55.Stadtman E. R. (2001) J. Biol. Chem. 276, 44357–44364 [DOI] [PubMed] [Google Scholar]
- 56.Karbowski M., Kurono C., Wozniak M., Ostrowski M., Teranishi M., Nishizawa Y., Usukura J., Soji T., Wakabayashi T. (1999) Free Radic. Biol. Med. 26, 396–409 [DOI] [PubMed] [Google Scholar]
- 57.Zaragozá R., Renau-Piqueras J., Portolés M., Hernández-Yago J., Jordá A., Grisolía S. (1987) Arch. Biochem. Biophys. 258, 426–435 [DOI] [PubMed] [Google Scholar]
Associated Data
This section collects any data citations, data availability statements, or supplementary materials included in this article.