

Summary
Target prevalence exerts a powerful influence on visual search behavior. In most visual search experiments, targets appear on at least 50% of trials [1–3]. However, when targets are rare (as in medical or airport screening), observers shift response criteria, leading to elevated rates of miss errors [4, 5]. Observers also speed their target-absent responses and may make more motor errors [6]. This could be a speed-accuracy tradeoff with fast, frequent absent responses producing more miss errors. Disproving this hypothesis, Experiment One shows that very high target prevalence (98%) shifts response criteria in the opposite direction, leading to elevated false alarms in a simulated baggage search task. However, the very frequent target present responses are not speeded. Rather, rare target absent responses are greatly slowed. In Experiment Two, prevalence was varied sinusoidally over 1000 trials as observers’ accuracy and reaction times (RTs) were measured. Observers’ criterion and target absent RTs tracked prevalence. Sensitivity (d′) and target-present RTs did not vary with prevalence [see also 7, 8, 9]. The results support a model in which prevalence influences two parameters: A decision criterion governing the series of perceptual decisions about each attended item and a quitting threshold that governs the timing of target-absent responses. Models in which target prevalence only influences an overall decision criterion are not supported.
Results
Experiment One: High target prevalence elevates false alarms but does not speed target present responses
In Experiment One, 13 observers (Os) performed a simulated baggage search task looking for weapons (guns and knives) that were present on either 50% or 98% of bags. Reaction times (RTs) less than 200 ms or greater than 15000 ms were excluded. One O was removed from further analysis for an excess of very fast RTs. For the remaining 12 Os, this led to the removal of 0.5% of trials as outliers.
Figure 1a shows the average error rates for 98% and 50% prevalence. The false alarm rate increased dramatically from .18 at balanced (50%) prevalence to .58 at high prevalence in this experiment (t(11) = 8.0, p< 0.0001). Miss errors dropped from .15 to .02 (t(11) = 8.5, p<0.0001). Figure 1b shows the signal detection measures d′ (sensitivity) and c (criterion). D′ was modestly reduced (t(11)=2.4, p<0.05). However, the use of d′ assumes equal variance of “signal” and “noise” distributions. Previous work indicates that this task is better fit by an unequal variance model (As shown in the Supplemental Fig. S1c, the slope of the zROC is about .6 rather than the equal variance slope of 1.0 [4]). If corrected for unequal variance, the change in criterion [calculated as Macmillan & Creelman’s “C2”, p66, 10] remains essentially the same and highly significant.
Figure 1. Experiment One: Very high prevalence elevates false alarms and target absent RTs.
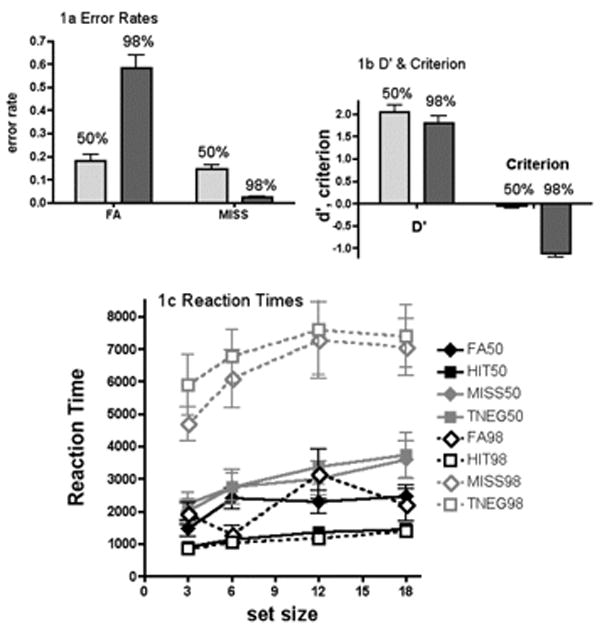
Fig 1a: False alarm and miss error rates as a function of target prevalence (50% and 98%), Fig. 1b: Signal detection measures: Average sensitivity (d′) and criterion (c ) values. Fig 1c: Average reaction time (RT) for correct target present (hit) and absent
If the increase in false alarms were the result of a speed accuracy trade-off, one might expect target-present RTs to become faster, following the pattern of target-absent RTs at low prevalence. However, as can be seen Figure 1c, the prevalence manipulation had no effect on either hit (t(11) = 1.43, p=0.18) or false alarm RTs (t(11) = 0.93, p=0.37), disconfirming the trade-off hypothesis. Interestingly, the only effect on RT we observed was a massive slowing of target-absent responses (Tneg: t(11)=6.67, p<0.0001; miss: t(11)=5.11, p< 0.0001).
Experiment Two: Variable Prevalence principally affects criterion and target-absent RT, not d′ f (sensitivity) and target-present RT
In Experiment Two, 12 Os performed 1000 trials of the simulated baggage search as target prevalence varied sinusoidally from high to low and back to high. RTs less than 200 ms or greater than 15000 ms were removed as outliers. This removed 0.56% of trials. Trials were binned into 20 blocks of 50 trials each. At very low prevalence, there were very few target-present trials, while at very high prevalence there were very few target-absent trials. We eliminated empty cells from analysis by pooling responses over all 12 Os. For the RT analyses, any cell with fewer than 20 trials across all observers was excluded from analysis.
Figure 2a shows the errors trading off as a function of prevalence. Again, based on evidence that this as an unequal variance task (see supplement), we calculated Da as the measure of sensitivity and C2 as the measure of criterion. Because these statistics are based on pooled data, one should be cautious in interpretation. Nevertheless, Figure 2b shows that criterion varied systematically with prevalence while sensitivity did not. C2 and prevalence were significantly correlated (Pearson r = −0.92, 95% CI: −.97 to −.80, p< 0.0001). In contrast, Da was not systematically related to prevalence (Pearson r = 0.20, CI: −.27 to 0.59, p=0.39). Results do not change markedly if one calculates d′ and c. It is criterion that changes with prevalence. Note that peak criterion value in Figure 2b lagged behind the lowest prevalence. This reflects the number of trials over which the observers base their internal estimates of prevalence. These data do not permit a precise calculation but it appears that Os compute prevalence over about four-dozen trials.
Figure 2. Experiment Two: Changing target prevalence changes the pattern of errors and target-absent RTs.
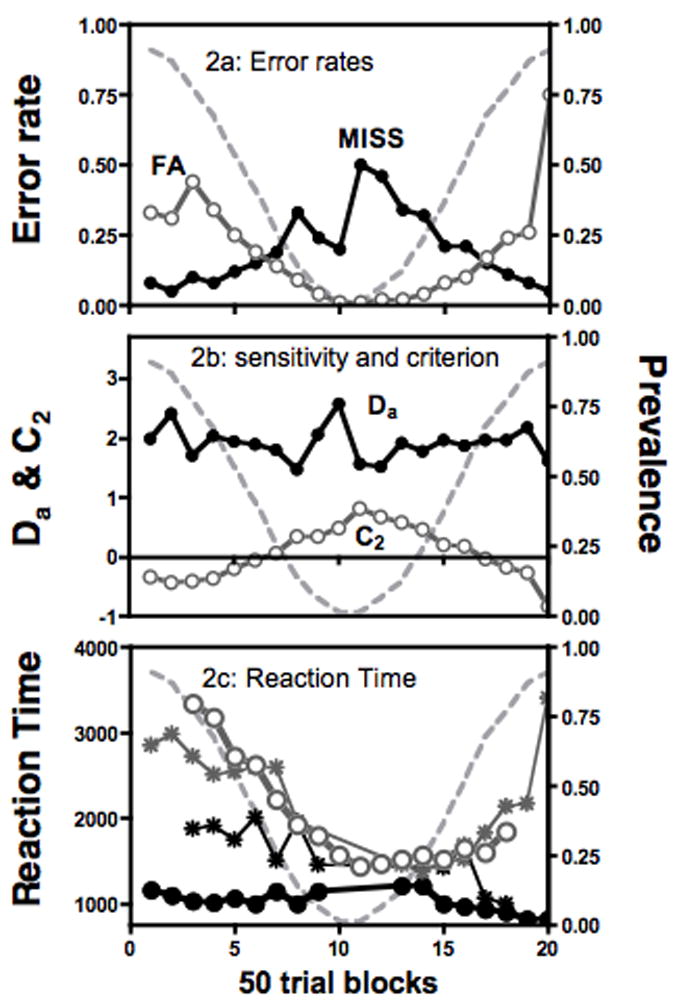
Fig 2a: Miss (black, solid symbols) and false alarm errors (gray, open), trade off as prevalence (dashed line) varies over 1000 trials. Fig 2b: Da (black, solid symbols), a signal detection measure of sensitivity does not vary systematically with prevalence but C2 (gray, open), a criterion measure, does. Fig 2c: Hit RTs (black, solid) change very little with prevalence while True Negative responses (open, gray) vary markedly. False alarm errors (black *) do not vary with prevalence, though they appear to become faster during the experiment. Miss errors (gray *) vary with prevalence in a manner similar to true negatives. (See also Supplemental Figures S1a–c)
Turning to the RT data, Figure 2c shows that, as in Experiment One, it is the target-absent RTs that are clearly responsive to prevalence. Looking at target-present trials (black symbols), it can be seen that both hit and false alarm RTs decline modestly over the course of experiment. This monotonic trend could represent a general speeding of RT with practice, but does not reflect the change in prevalence. The variation in target-absent response times across the experiment is about 5X greater and more clearly follows prevalence.
Discussion
As anticipated by work in other domains, varying target prevalence causes a tradeoff between false alarm and miss errors [7–9]. What is novel and informative here is that, for RT, the main effect of prevalence falls on the target-absent responses. Taken together, the pattern of RT and error data falsifies some plausible theories. For example, the pattern of RTs is not consistent with any account that holds that RTs are speeded when Os can predict the answer. Were that the case, RTs should be slowest at 50% prevalence and fastest at very high and low prevalence. This is not what is seen in Figure 2.
A visual search task might be thought of as a 2-alternative forced-choice (2AFC) decision between a target-present and a target-absent response. 2AFC tasks can be modeled as an accumulation of information toward one of two response boundaries [11–15] (see Figure 3). Errors occur when the noise perturbing the drift toward one boundary causes the accumulation to reach the other boundary by mistake. Our data constrain such diffusion models. Specifically, we argue that modeling the effects of prevalence will require changing more than one parameter. Changing prevalence shifts criterion. To vary criterion in a standard diffusion model, one can move the starting point. In Figure 3, if the starting point moved toward the “YES” boundary at high prevalence, false alarm errors would become more common and misses less common, as desired, without changing sensitivity (represented by the separation between YES and NO boundaries). However, this would also lead to target-present RTs becoming faster and target-absent RTs slower. This speeding of present RTs at high prevalence is not seen. A change in the target-absent but not target-present RTs could be produced by moving the NO boundary. However, since sensitivity (d′ or Da) varies with the separation between the decision boundaries, moving the NO boundary down would increase sensitivity at high prevalence, a pattern not seen in our data (see Supplement for details of simulation of these manipulations of a diffusion model).
Figure 3. The drift diffusion model.
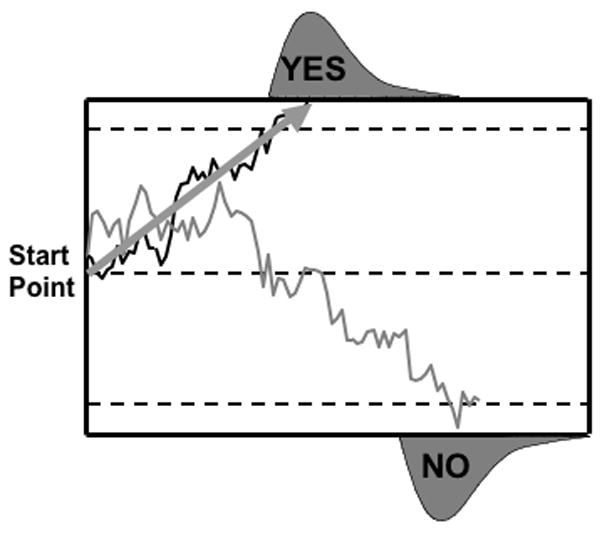
In a standard drift-diffusion account of a two-alternative forced-choice (2AFC) task, information begins accumulating a start point generates one response (here “yes”) if it reaches an upper bound and another (“no”) if it reaches a lower bound. For a fixed drift rate, sensitivity (D′) can be varied by varying the separation of the bounds and criterion can be varied by changing the starting point. (See also Supplemental Figures S1d–e)
While the pattern of the data might be captured by simultaneously changing two parameters in a standard diffusion model [12], we adopt a somewhat different approach, the “Multiple Decision Model”, illustrated in Figure 4, because search tasks like ours are not actually simple 2AFC tasks. At any given moment, the observer evaluates some aspect of the display. In the figure, we illustrate the observer selecting a single item. In an “internal decision” stage, the observer makes a 2AFC decision about this information. If the response, R, exceeds a criterion, a target is deemed to be present and the observer makes a “yes” response. If not, the observer continues to search. A second process generates “no”, absent responses. It is modeled here as a diffusion toward a quitting threshold. If the diffusion value, Q, exceeds that threshold, a no response is generated. Otherwise a new item is selected and search continues.
Figure 4. A multiple-decision model for visual search.
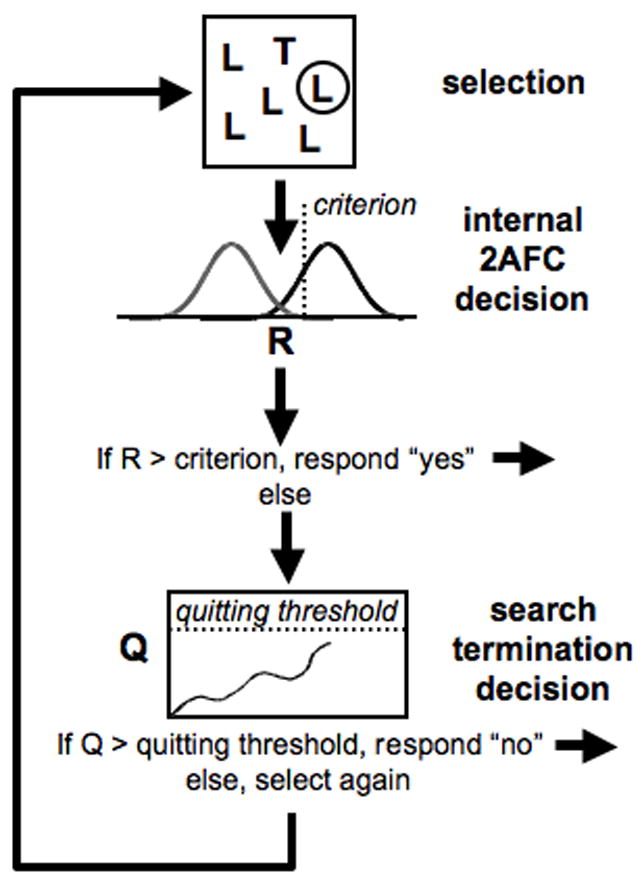
In this model, the observer makes a 2AFC decision about each item that is selected. If an item is classified as a target, a “yes” response is generated. If not a new item will be selected unless a target-absent decision is generated when a quitting signal exceeds its threshold. The quitting signal is modeled as a diffusion process. (See also Supplemental Figures S1d–e)
Here, the two parameters that are affected by prevalence are the internal decision criterion and the quitting threshold. At high prevalence, criterion moves left, making “yes” responses more likely, and the quitting threshold moves up, making target absent RTs slower. At low prevalence, the parameters shift in the opposite direction. As shown in the Supplement (Fig. S1d,e), simulation of a model of this sort produces the basic pattern of results seen in the experiments reported here.
The structure proposed in Figure 4 generalizes quite naturally beyond simple present/absent search tasks and may have some utility in explaining other search phenomena. For example, many radiology tasks require that observers find not one target but all targets (e.g. multiple lung nodules). In terms of the model presented here, this means that a “present” response does not end search. The cycle of selection and perceptual decision would continue until the quitting threshold was reached. “Satisfaction of search” is a known problem in search for an unknown number of targets [16, 17]. This is the observation that the probability of detecting one target is lower if another target has been detected first. The phenomenon could be a consequence of the dual threshold nature of search. Suppose that two trials have the same quitting threshold. On one trial, the image contains T1 and T2. On the other, only T2 is present. If we suppose that it takes some time to deal with T1 and that the quitting threshold discounts this fact, then the chance of reaching T2 will be lower on the T1 and T2 trial than on the T2 alone trial. Further research would be needed to test this hypothetical account of satisfaction of search but the account does capture the possibility of a separation between finding a target and ending a search.
Experimental Procedures
Experiment One
Participants
Thirteen paid participants between the ages of 18 and 55 were tested in all conditions. Each participant reported no history of eye or muscle disorders. All had 20/25 vision or better and passed Ishihara’s Tests for color-blindness. Informed consent was obtained for all participants and each participant was paid $10/hour.
Stimuli
Realistic bag stimuli were created by placing x-ray images of assorted objects in x-ray images of empty bags. Items were semi-transparent and could overlap. Component bags and objects were x-ray images provided by the Transportation Security Lab of the Department of Homeland Security. Set size was varied by varying the number of items added to the bag (3, 6, 12, or 18). Bags and individual objects were scaled in an appropriate manner so, as an example, a computer would be bigger than an iPod. Os sat at approximately 57 cm from the screen. At this distance, bags subtended a range of sizes 9.5° × 16° in width to 20° by 21.5°. Eight pieces of clothing were added to each bag, but were not counted in the set size. In these images, clothing adds an indistinctly shaped orange haze to the image. Stimuli were presented on Macintosh computers running Matlab 7.5 with the Psychophysics Toolbox, version 3 http://psychtoolbox.org/PTB-2/ [18, 19])
Procedure
To familiarize Os with the threat stimuli, they were first briefly shown 20 examples of weapons for 1 second in isolation. Next, they were given 100 practice trials at 50% prevalence with full feedback on the correctness of responses. Os were instructed to indicate as quickly and accurately as possible whether a target was present or absent. On each trial, a fixation cross and audible ‘click’ were followed after 200 ms by the stimulus. The stimulus remained visible until the observer responded. A 500 ms blank interval preceded the start of the next trial.
After practice, observers completed the two experimental blocks: 200 trials at 50% prevalence and 1000 trials at 98% prevalence. Order of the two blocks was counterbalanced over Os. Os were told that bags without weapons would be “frequent” in the 50% prevalence condition, and that bags without weapons would be “rare” in the 98% prevalence condition. We emphasized that they should try to be as quick and accurate as possible in correctly identifying bags without weapons. Full feedback was given after each trial. If a target was present, it was outlined with a box and shown to the observer. A 2-minute break was mandated every 200 trials (about every 20 minutes).
Experiment Two
Participants
Twelve paid participants between the ages of 18 and 55 were tested on all conditions. Each participant reported no history of eye or muscle disorders, as well as 20/25 vision or better, and passed. Ishihara’s Tests for color-blindness. Informed consent was obtained for all participants and each participant was paid $10/hour.
Procedure
The stimuli and general methods were essentially identical to those of Experiment One. Observers were familiarized with the targets in advance. Then they were tested for 100 trials of training at 50% prevalence with full feedback. Finally, over 1000 trials with full feedback, prevalence varied sinusoidally through one cycle from 100% on trial 1 to 0% at trial 500 and back to 100% by trial 1000. Any given trial could be target-present or target-absent with the probability of target presence determined by the current prevalence. Observers were told that the probability of a target would vary over time. A two-minute break was enforced after every 200 trials.
Supplementary Material
Acknowledgments
This research was supported by grants to JMW from HIH/NEI (EY017001) and from the Transportation Security Laboratory of the Science and Technology Directorate, U.S. Department of Homeland Security (#02-G-010). We thank Piers Howe and Todd Horowitz for advice.
Footnotes
Publisher's Disclaimer: This is a PDF file of an unedited manuscript that has been accepted for publication. As a service to our customers we are providing this early version of the manuscript. The manuscript will undergo copyediting, typesetting, and review of the resulting proof before it is published in its final citable form. Please note that during the production process errors may be discovered which could affect the content, and all legal disclaimers that apply to the journal pertain.
References
- 1.Wolfe JM. Visual search. In: Pashler H, editor. Attention. Hove, East Sussex, UK: Psychology Press Ltd; 1998. pp. 13–74. [Google Scholar]
- 2.Verghese P. Visual search and attention: A signal detection approach. Neuron. 2001;31:523–535. doi: 10.1016/s0896-6273(01)00392-0. [DOI] [PubMed] [Google Scholar]
- 3.Wolfe JM, Reynolds JH. Visual Search. In: Basbaum AI, Kaneko A, Shepherd GM, Westheimer G, editors. The Senses: A Comprehensive Reference. Vol. 2. San Diego: Academic Press; 2008. pp. 275–280. VIsion II. [Google Scholar]
- 4.Wolfe JM, Horowitz TS, VanWert MJ, Kenner NM, Place SS, Kibbi N. Low target prevalence is a stubborn source of errors in visual search tasks. JEP: General. 2007;136:623–638. doi: 10.1037/0096-3445.136.4.623. [DOI] [PMC free article] [PubMed] [Google Scholar]
- 5.Wolfe JM, Horowitz TS, Kenner NM. Rare items often missed in visual searches. Nature. 2005;435:439–440. doi: 10.1038/435439a. [DOI] [PMC free article] [PubMed] [Google Scholar]
- 6.Fleck MS, Mitroff SR. Rare targets rarely missed in correctable search. Psychol Sci. 2007;18:943–947. doi: 10.1111/j.1467-9280.2007.02006.x. [DOI] [PubMed] [Google Scholar]
- 7.Healy AF, Kubovy M. Probability matching and the formation of conservative decision rules in a numerical analog of signal detection. J Exp Psychol: Human Learning and Memory. 1981;7:344–354. [Google Scholar]
- 8.Treisman M. A theory of criterion setting: an alternative to the attention band and response ratio hypotheses in magnitude estimation and cross-modality matching. J Exp Psychol Gen. 1984;113:443–463. doi: 10.1037//0096-3445.113.3.443. [DOI] [PubMed] [Google Scholar]
- 9.Maddox WT. Toward a unified theory of decision criterion learning in perceptual categorization. J Exp Anal Behav. 2002;78:567–595. doi: 10.1901/jeab.2002.78-567. [DOI] [PMC free article] [PubMed] [Google Scholar]
- 10.Macmillan NA, Creelman CD. Detection Theory. Mahwah, NJ: Lawrence Erlbaum Assoc; 2005. [Google Scholar]
- 11.Reeves A, Santhi N, Decaro S. A random-ray model for speed and accuracy in perceptual experiments. Spatial Vision. 2005;18:73–83. doi: 10.1163/1568568052801582. [DOI] [PubMed] [Google Scholar]
- 12.Palmer J, Huk AC, Shadlen MN. The effect of stimulus strength on the speed and accuracy of a perceptual decision. Journal of Vision. 2005;5:376–404. doi: 10.1167/5.5.1. [DOI] [PubMed] [Google Scholar]
- 13.Brown SD, Heathcote A. The simplest complete model of choice response time: Linear ballistic accumulation. Cognitive Psychology. 2008;57:153–178. doi: 10.1016/j.cogpsych.2007.12.002. [DOI] [PubMed] [Google Scholar]
- 14.Ratcliff R. Modeling response signal and response time data. Cognit Psychol. 2006;53:195–237. doi: 10.1016/j.cogpsych.2005.10.002. [DOI] [PMC free article] [PubMed] [Google Scholar]
- 15.Ratcliff R. A theory of memory retrieval. Psych Preview. 1978;85:59–108. [Google Scholar]
- 16.Berbaum KS, Franken EA, Jr, Dorfman DD, Rooholamini SA, Kathol MH, Barloon TJ, Behlke FM, Sato Y, Lu CH, el-Khoury GY, et al. Satisfaction of search in diagnostic radiology. Invest Radiol. 1990;25:133–140. doi: 10.1097/00004424-199002000-00006. [DOI] [PubMed] [Google Scholar]
- 17.Nodine CF, Krupinski EA, Kundel HL, Toto L, Herman GT. Satisfaction of search (SOS) Invest Radiol. 1992;27:571–573. [PubMed] [Google Scholar]
- 18.Brainard DH. The Psychophysics Toolbox. Spatial Vision. 1997;10:443–446. [PubMed] [Google Scholar]
- 19.Pelli DG. The Video Toolbox software for visual psychophysics: Transforming numbers into movies. Spatial Vision. 1997;10:437–442. [PubMed] [Google Scholar]
Associated Data
This section collects any data citations, data availability statements, or supplementary materials included in this article.