

Abstract
This article reviews recent work involving electrochemical methods for in vitro analysis of biomolecules, with an emphasis on detection and manipulation at and of single cells and cultures of cells. The techniques discussed include constant potential amperometry, chronoamperometry, cellular electroporation, scanning electrochemical microscopy, and microfluidic platforms integrated with electrochemical detection. The principles of these methods are briefly described, followed in most cases with a short description of an analytical or biological application and its significance. The use of electrochemical methods to examine specific mechanistic issues in exocytosis is highlighted, as a great deal of recent work has been devoted to this application.
Keywords: amperometry, chronoamperometry, electroporation, microfluidics, microelectrodes
1. INTRODUCTION
Electrochemistry in ultrasmall environments has emerged as an increasingly important technique for fundamental studies of single-cell neuronal communication and release and reuptake of chemical messenger molecules as well as cellular imaging and small-scale electroporation applications. The development of electrochemical methods for detection of neurotransmitters began with the groundbreaking work of Adams (1) and has progressed to the point where it is now possible to detect the release of a neurotransmitter from a single vesicle, as first demonstrated in the seminal work by Wightman et al. (2, 3). In these pioneering experiments, a carbon fiber electrode measuring 5 μm in diameter was placed adjacent to a bovine adrenal chromaffin cell isolated in a culture dish. The cell was then stimulated to release by either chemical or mechanical means.
Understanding the chemistry and structure at the single-cell level is of great interest in the biological and medical sciences; indeed, books have been written on this broad topic (4). In neuroscience, knowledge of the chemical composition and dynamics of single nerve cells leads to better models of the cellular neurotransmission process. The key dynamic event in neuronal communication is exocytosis, a process that has been extensively investigated for several decades (5, 6). The process of exocytosis can be summarized as the docking of vesicles (storage compartments) to the cell membrane and subsequently releasing the contents to the extracellular space by fusion of the vesicular and cellular membranes. This process allows the conversion of an electrical signal (action potential) to a chemical signal (messenger release and receptor recognition), which is necessary for exocytotic communication between cells.
Methods to observe and quantify individual exocytotic events have traditionally revolved around electron microscopy and patch-clamp capacitance measurements (7). In 1990, Wightman and colleagues showed that they could directly monitor individual exocytotic events involving easily oxidized messengers occurring on the millisecond time scale by use of amperometric measurements at microelectrodes (3). This method was applied to adrenal chromaffin cells first by Wightman’s group (2), and later by Neher’s group (8).
This review focuses on the use of electrochemical methodologies at single cells or isolated cultures of cells in a “biologically simplified” in vitro setting. These methods, emphasizing constant potential amperometry at microelectrodes and the electrical phenomenon of electroporation, are here reviewed based on their in vitro applicability and are discussed in terms of what new information has been obtained for cellular environment studies that could not have been as eloquently delivered by any analytical method other than electrochemistry.
2. DEVELOPMENTS IN MODIFICATIONS OF MICROELECTRODES
Carbon fiber microelectrodes were developed in several laboratories in the late 1970s for work in vivo. Leaders among these researchers included the Wightman (9, 10) and Gonon (11, 12) groups, who applied this tool to neuroscience. The method was a major breakthrough for several reasons. First, the carbon fiber electrodes were biocompatible and could therefore carry a current while maintaining sensitivity to reductants, thus increasing the working lifetime of an electrode. Second, carbon fibers as small as 5 μm became available, enabling the development of very small probes that minimize tissue damage. For later in vitro work, the carbon fiber electrodes were advantageous in that they were highly resistant to strain and could be placed firmly against cell surfaces without physically breaking, thus providing greater sensitivity and reproducible measurements. For a more in-depth discussion of the factors affecting electrode sensitivity, selectivity, and temporal response, refer to the paper by Cahill et al. (13).
Electrodes used for studying single cells are usually constructed by first aspirating a single carbon fiber through a glass capillary. The capillary is then pulled using a commercial pipette puller, producing two long-tapered fiber-containing pipettes. Each is then cut at a cross-sectional diameter of 8–10 μm on a microscope using a scalpel blade. Cut electrodes are immersed in freshly prepared high-quality epoxy to create a tight seal between the glass tip and carbon fiber. Finally, no more than a few hours before the experiment, electrodes are beveled to 45° on a rotary microgrinder to produce a fine-polished, angled tip (14, 15). Working electrodes are generally prepared from 5- to 10-μm-diameter carbon fibers. The signal-to-noise ratio improves as the electrode size approaches the size of the detection area of interest, but larger electrodes can detect a greater number of electrochemical events (13, 16).
Electrode sensitivity requires that the electrode surface be free of adsorbed molecules, such as proteins and oxidized products (13, 17). Several groups, however, have modified the working electrode surface in hopes of enhancing electrode sensitivity and/or selectivity (18–20). A common modification to enhance cation detection is through the application of a thin coating of Nafion®, a perfluorinated cation-exchange polymer. Anions are primarily excluded by this thin barrier, whereas cations are able to pass and accumulate at the electrode surface, thus improving their detection, particularly in central nervous system studies (17, 21–23). Due to this unique exclusionary property, Nafion® -coated carbon fiber microelectrodes can be utilized to differentiate between neurochemicals possessing similar oxidation potentials, for example dopamine and ascorbic acid. Electrode response time, however, can be compromised when coating with a thin film of Nafion® and a significant loss in temporal resolution may occur. Wightman’s group recently modified 10-μm carbon fiber microelectrodes via the reduction of 4-sulfobenzenediazonium tetrafluoroborate to create an electroactive surface with enhanced sensitivity to cationic species, specifically dopamine, without a severe loss of electrode response time (24). These modified electrodes, unlike those coated with Nafion®, also allowed anionic species to diffuse to the electrode surface, thus not limiting detection to cationic species. Moreover, the sensitivity for dopamine and other positively charged analytes was increased by a factor of 5 compared to an unmodified electrode, a significant increase compared to the enhancement of 1.5 at best attainable with Nafion® coating (24).
Single-walled carbon nanotubes have also been used to modify carbon fiber electrodes in an effort to improve detection of molecules at the single-cell and subcellular levels. Cheng and colleagues fabricated ultrasmall (100–300 nm in diameter) carbon fiber nanoelectrodes via flame etching, then immersed the tips into a solution of suspended single-walled carbon nanotubes. The electrodes were subsequently dried, yielding tips covered with sheets of single-walled carbon nanotubes that effectively increased the working surface area of the electrode (25). Combined with the fine intrinsic electrical properties of single-walled carbon nanotubes, these modified electrodes improved the detection limits of select neurotransmitters when characterized with cyclic voltammetry. For example, unmodified ultrasmall carbon fiber nanoelectrodes exhibited detection limits on the order of 76 nM, whereas the same electrode geometry modified with single-walled carbon fiber nanotubes demonstrated a detection limit of 7.7 nM (25). Because of the improved sensitivity and the small size of these particular electrodes, they may be potentially useful in ultrasmall environments as high-quality detectors with good temporal and spatial resolution.
Fabrication of electrode surfaces in conjunction with a photoresist has also been explored. Orwar, Weber, and colleagues controlled the electroactive area of a carbon fiber working electrode by electrodepositing a negative photoresist onto an exposed carbon fiber microelectrode surface (26). The face of the tip was exposed using a xenon arc lamp, then the resist layer was subsequently removed upon immersing the tip in the developing solution. Experimental parameters, such as the temperature of the photoresist solution and the length of time the photoresist was exposed to light, strongly influenced the photoresist thickness and the area of exposed electroactive surface, respectively. Thus, fine adjustments to the photoresist removal procedure would allow one to reproducibly fabricate an electrode of a specified size, as well as to effectively increase the electroactive surface area of the same electrode without making a fresh electrode (26). Likewise, Wightman’s group used a photoresist/pyrolysis method to fabricate carbon ultramicroelectrodes from tungsten microelectrode substrates (27). Electrodes made in this way still exhibited electrochemical properties comparable to their glass-enclosed fiber counterparts, but possessed the additional properties of flexibility and rigidity inherent in tungsten microelectrodes. Furthermore, because these electrodes lack bulky glass capillary encasements, a tightly configured array format of these individual electrodes may be possible, thus allowing spatial and temporal information to be conserved within an ultrasmall cellular environment (27).
3. SINGLE-CELL AMPEROMETRY: A METHOD TO EXPLORE EXOCYTOTIC RELEASE
Amperometric experiments involve holding the electrode at potentials sufficient to oxidize molecules near the electrode at a diffusion-limited rate. In constant potential amperometric mode, a change in the concentration of an easily oxidized species results in a concomitant change in the oxidation current. Integrating the current of such a transient provides the charge passed which, according to Faraday’s law (N = Q/nF), is directly related to the number of molecules oxidized. Amperometry has been used to study exocytosis in primary cultures (3, 10, 28, 29), in immortalized cell lines (30, 31), in brain slices (32), and at intact neurons in vivo (33, 34). As previously stated, this review focuses on single cells and cell cultures.
In general, candidate cell systems have been limited to those that release an oxidizable substance, usually a catecholamine-, serotonin-, or tyrosine/tryptophan-containing peptide. Immortalized cultures permit single, isolated cells to be studied, whereas primary cultures offer the advantage of modeling cells that can be studied in the context of belonging to a network (i.e., continuing to receive information from adjacent cells). Amperometry is well suited to measuring secretion from cells because of its ability to quantify release from vesicles on the millisecond time scale (Figure 1) (16). To carry out amperometry at single cells, a small electrode is placed near the cell and held at a potential where oxidation is diffusion limited. Stimulant is applied with a small pipette (Figure 1a), resulting in current transients when oxidizable species are released. The first experiment to measure exocytosis used adrenal cells and the catechols norepinephrine and epinephrine were detected (2, 3). The general oxidation reaction for catechols is shown in Figure 1b and a typical current-time trace (in this case at a pheochromocytoma cell) is shown in Figure 1c. The number of molecules detected can be calculated by Faraday’s law (Figure 1d). Estimates of the distance between an electrode placed flush against the cell and the cell membrane surface suggest that a small solution-filled gap of about 300 nm exists (35, 36).
Figure 1.

Basic introduction to amperometric detection of exocytosis at single cells. (a) The top image is the typical setup for amperometry of a single cell. Exocytosis is stimulated by a pipette containing a stimulant, and the release is monitored by a carbon fiber electrode. The bottom image shows typical amperometric data. (b) The oxidation reaction for catecholamines. The catecholamine is oxidized to the orthoquinone form, losing two electrons. (c) Left-hand trace shows a series of stimulations, represented by arrows, and the electrochemical responses detected after each stimulation. Right-hand trace shows a single amperometric current transient. (d) Faraday’s equation, which is used to determine the amount of material released during exocytosis.
The shape of amperometric peaks is determined by the various aspects of the release event. Specifically, the half-width of the peak (full width at half maximum) represents the duration of the release event. The rise time, typically the time it takes to change from 10% to 90% of the peak height, relates to the time it takes the fusion pore to open. Thus, the basic amperometric measurement is suitable for providing data about the amount of transmitter released, the duration of each event, and the opening of the fusion pore.
4. RECENT ACHIEVEMENTS IN EXPLORING DOPAMINE AND CATECHOLAMINE RELEASE
4.1. Lipid Incubation Appears to Affect the Biophysics of Exocytosis
Recent work employing amperometric detection in vitro aims to capitalize on the ability of amperometry to detect small oxidative current changes of molecules, such as dopamine (corresponding to quantities as minute as a few zeptomoles), to obtain submillisecond kinetic information about the secretory event release process, or both (28). Recently, this methodology has been used to study the biophysics of the exocytosis process with a focus on membrane composition. Amatore and colleagues have used short (2–3 min) incubations of adrenal cells with different lipids to demonstrate that the shape of the lipid might affect the rate of release (37). Our laboratory has used the amperometric method to demonstrate that dopamine release from PC12 (pheochromocytoma) cells is altered upon incubation for 3 d with 100 μM phospholipid (38). This neuron-like, immortalized cell line is an excellent model system to work with due to its large, circular size, ease in culturing and manipulation, and robust nature (39). Although these cells do not form functional synapses to neighboring cells, they provide an excellent model for the examination of presynaptic cellular machinery. In these experiments, phosphotidylserine incubation increased the number of events elicited by a high potassium stimulus, whereas phosphotidylcholine reduced the quantal size (total amount of transmitter released) per event. Furthermore, phosphotidylethanolamine accelerated the rate of the release process, resulting in a shortened average half-width and decay time and increasing the average peak amplitude of amperometric measurements. In contrast, phosphotidylcholine incubation decreased the rate of the release process by lengthening the half-width and decay time while decreasing the average peak amplitude. These data are exciting and support a phospholipid-based mechanism that regulates cell-to-cell communication by altering local membrane composition, thereby impacting exocytosis machinery.
Enhancements of secretion were also observed for a similar incubation protocol. PC12 cells differentiated with nerve growth factor and subsequently treated with 1 mM lithium for 2 d exhibited a greater frequency of stimulant-evoked release without noticeable changes to the quantity and rate of release (40). Electron microscopy, however, revealed no increase in the number of secretory vesicles per unit area in these treated cells, but an overall increase in vesicular diameter (~15%). Alongside an immunoblotting assay, electrochemical measurements in this work complemented the observation of lithium, a common therapeutic for psychological disorders, changing dense core vesicle protein expression by altering secretion machinery and generating a therapeutic response (40).
4.2. 3,4-dihydroxy-L-phenylalanine Loading of Cells Fills the Halo, Not the Dense Core
Release of dopamine from PC12 cells was augmented by loading them with 3,4-dihydroxy-L-phenylalanine (L-DOPA), and exocytosis under both physiological and hypertonic conditions has been monitored with amperometry (41). A majority of the loaded dopamine was hypothesized to be preferentially stored in the halo region of the vesicle rather than the dense protein core of the vesicle. Under high-osmolarity (hypertonic) conditions, the dense core matrix does not fully dissociate during exocytosis (42). Therefore, a relatively larger amount of the release observed under hypertonic conditions is attributed to expulsion of material held in the clear halo region of the vesicle, an area not commonly known as an important storage location for transmitter when compared to the dense core matrix.
Amperometry data reflected statistically similar peak area increases (26–36%) for both isotonic and hypertonic conditions after loading with L-DOPA, implying that supplemental transmitter preferentially stays in the halo regardless of osmolaric conditions. However, Amatore and colleagues have also investigated exocytosis under varying osmolaric conditions using carbon fiber amperometry on bovine chromaffin cells that release catecholamines (43) and found that the release frequency and the average amount of catecholamine release notably increased under hypotonic conditions (low osmolarity). These findings support the swelling of the dense core more favorably under such conditions. Moreover, this finding may be explained by the presence of two different populations of vesicles: the first of small content and which favorably release under isotonic conditions (83% of events versus 35% at hypotonic), the second of larger content and which favorably releases at hypotonic conditions (65% of events versus 17% at isotonic conditions) (43).
4.3. Multiple Populations of Vesicles in Catecholamine Cells
Multiple population types of catecholamine vesicles have been suggested, based on results obtained with carbon fiber amperometry in several cell lines, including the large dopamine cell of Planorbis corneus (33) and PC12 cells (44). Tse and colleagues have also hypothesized the existence of multiple vesicle populations in rat chromaffin cells (45). In these cells, each population [small, medium, and large quantal release (Q) granules] can be manipulated separately by lengthening culture duration or simultaneously via coculturing with cyclic AMP. When culture duration was extended from 1 d to 3 d, the overall detected average quantal size decreased, with both small and large Q granule populations changing their distribution proportionalities (each to a different degree). Additionally, introduction of cAMP to the culture media resulted in an increase in the overall average Q for the cell as well as an increased release amount for each population without significant changes to the distribution proportions for each Q subpopulation.
Probable mechanisms for the increased release from all granule sizes, which is apparently triggered by addition of cAMP, include: (a) provoked increase in catecholamine synthesis, (b) improved reuptake of free catecholamine to all granules sizes, (c) fused multiple granules, and (d) dissolving of the dense core matrix, among others (45). Similarly, enhanced catecholamine release from bovine chromaffin cells has been attributed to molecular interaction with D1 dopaminergic receptors (46). The time required to reestablish initial cellular calcium levels after stimulation was optimized by decreasing the length of high-potassium stimulus application (from 2 s to ~0.5 s). This decrease resulted in the observation of more release events after the second potassium stimulation; this effect could be blocked by a D1 antagonist (SCH-23390). Additional release events following the second potassium stimulation could be evoked by a D 1 agonist (SKF-38393), yet they remained unaffected by a D2 antagonist (raclopride). These findings imply that a D1-like receptor on bovine chromaffin cells plays a key role in catecholamines promoting release of themselves within the same cell (46).
4.4. Is Exocytotic Release the Same at the Top and Bottom of a Cell?
All of the amperometric data discussed up to this point have been acquired from the top of the cell surface. A more detailed discussion on amperometric data collected from the bottom of adhered cells onto microfluidic devices integrated with electrodes is presented later in this review. It is worth mentioning here a recent study by Amatore and colleagues in which they discovered that events detected from the top of the cell differed in terms of release dynamics and frequency from those monitored at the bottom of the cell (47). This disparity is extremely important when results are compared for techniques that examine similar phenomena from different geometric setups (i.e., amperometry versus total internal reflectance fluorescence microscopy) (47). When monitoring events with amperometry above and below the cell, those events originating from the top of the cell demonstrated a faster rise time and half-width, but the average flux of electroactive material was 2.5 times less compared to that of events monitored below the cell. Several explanations for these findings were suggested, the most convincing of which centered on membrane dynamics. The cell surface is firmly affixed to the electrode surface when monitoring release from the bottom, whereas for the top of the cell the electrode is lightly contacted with the cell membrane. Thus, the cell membrane under the cell is not as efficient at incorporating new membrane from fusing vesicles and might not flow as easily. It may also be possible that there are different vesicle populations at each pole of chromaffin cells. These data, collected in different geometric configurations, must be carefully interpreted both analytically and biologically to avoid erroneous conclusions (47).
5. REPRODUCIBLE AMPEROMETRIC MONITORING OF SEROTONIN IN VITRO
A great deal of work to date has been carried out on dopamine as it is relatively easy to detect and is present in a discrete and large part of the mammalian brain. Some recent work has aimed to detect more challenging molecules, particularly serotonin, which is notorious for rapidly fouling carbon fiber electrodes in constant potential mode. Fast-scan cyclic voltammetry (FSCV) and chronoamperometry methods (see Section 6, below) can be used to minimize electrode fouling from serotonin oxidation products.
More recently, however, boron-doped diamond microelectrodes have been used to provide more stable, sensitive, and reproducible measurements in the constant potential mode (48–52). Serotonin overflow was monitored from mechanically or electrically stimulated enterochromaffin cells (found in the mucosa of the intestine and known to be rich in gastrointestinal serotonin), and these data were directly compared to data obtained with carbon fiber microelectrodes (53). Several advantages of the former method were found. First, diamond electrodes exhibited a slower rate of fouling compared to carbon fiber electrodes (50% versus 85% loss of initial signal for diamond and carbon fiber electrodes, respectively, after 10 injections of serotonin); however, diamond electrodes can be cleaned with alcohol and, essentially, returned to their initial sensitivity level. Second, diamond electrodes outperformed carbon fiber electrodes when measuring serotonin overflow from different regions of the intestinal mucosa (see Figure 2a). The electrode was positioned away from the mucosa to establish a stable background current. Then the electrode was placed within 1 mm of the tissue surface to determine the “over tissue current” (OTc) resulting from fluid flow over the tissue. Finally, neighboring mucosa was stimulated either mechanically or electrically to determine the “touching tissue current” (TTc). To validate that the observed change in oxidative current could be attributed to changes in serotonin, the experiments were repeated in the presence of a serotonin transporter (SERT) antagonist, fluoxetine. By blocking the SERT, the over tissue current was significantly higher as to be expected with a decreased ability to clear excess serotonin (see Figure 2b). In a recent follow-up study, Swain and colleagues determined that SERT expression was lower in neonatal guinea pig ileum than in adult guinea pigs when fluoxetine was used as the SERT antagonist. The antagonist did not substantially increase the over tissue current observed, implying that initial SERT function was significantly low in guinea pig ileum in the neonatal development stage (see Figure 2c) (54).
Figure 2.

Measurements of serotonin overflow from enterochromaffin cells at adult or neonatal guinea pig ileum tissue. (a) Current versus time trace of serotonin overflow from adult guinea pig ileum tissue recorded with a diamond electrode (solid line) and carbon fiber electrode (dotted line). (b) Current versus time trace of serotonin overflow recorded with a diamond electrode for normal response (solid line) and in the presence of serotonin transporter (SERT) antagonist, fluoxetine (dotted line) for adult guinea pig ileum tissue. The current increased dramatically in the presence of fluoxetine, signifying that the measured current was indeed serotonin. (c) Current versus time trace of serotonin overflow recorded from neonatal guinea pig ileum tissue (dark blue) and the same tissue in the presence of fluoxetine (light blue). No difference in current profile was noted, suggesting that SERT activity in neonates is significantly low or underdeveloped as compared with adult. Abbreviations: OTc, over tissue current; TTc, touching tissue current. Panels a and b reproduced from Reference 53 with permission. Panel c reproduced from Reference 54 with permission.
6. SYNAPTOSOME MODELS FOR REUPTAKE OF DOPAMINE AND SEROTONIN USING CHRONOAMPEROMETRY
Chronoamperometric experiments differ from those using constant potential amperometry in that repetitive potential pulses are applied to the working electrode in a square wave fashion. A typical 1-Hz square wave profile begins at a resting potential (commonly 0 V) and is stepped to a potential where the oxidation of the molecule of interest is diffusion limited (similar to the overpotential selected for steady-state amperometry recordings). This overpotential is maintained briefly (for 100 ms) before the potential is returned to 0 V, essentially reducing any oxidized species still near the electrode back to their original form. The potential is held here for 100 ms plus an additional 800-ms resting period before the cycle is repeated. This essentially prevents fouling of the electrode surface by freshly oxidized species. The changes in both oxidative and reductive currents can be monitored over time, providing the temporal resolution necessary to study biological uptake systems, particularly of monoamine transporters. Synaptosomes, or neuronal liposomes containing one or more mitochondria and fully functioning respiratory capabilities, have also been shown to be suitable in vitro models for determining uptake of both dopamine and serotonin using chronoamperometric methods (55–57). For further reading on synaptosomes and their properties and preparation, please see References 58 and 59.
Two experimental considerations worth noting when working with a synaptosomal preparation are (a) the oxygenation level of the assay buffer containing the experimental synaptosomes, and (b) the rate of convection (stirring) in the solution throughout the experiment. Andrews and colleagues determined that an oxygen-rich assay buffer was necessary for optimal SERT function as interpreted through the more reliable clearance rates of serotonin (126 ± 8 pmol/mg protein-min, n = 6) compared to those obtained in oxygen-depleted buffer (21 ± 8 pmol/mg protein-min, n = 6 (55). Oxygen is necessary to maintain cellular ion gradients through the breakdown of glucose to ATP; therefore, depriving synaptosomes of oxygen hinders their ability to sustain their inherent ion gradient, thus impairing transport activity (58, 60, 61). The effects of stirring to minimize mass transport issues that have also been circumvented by use of rotating disk electrodes (62) have also been addressed; surprisingly, gentle stirring eliminated serotonin clearance (even in oxygen-enriched assay buffer), suggesting that constant agitation forces any serotonin that may have been reuptaken into the synaptosomes to leak out, thereby producing a steady, unchanging level of residual serotonin (55).
The submillisecond time resolution provided with chronoamperometry and the synaptosomal preparations derived from brain tissue have provided more precise determination of serotonin uptake rates. Uptake rates in mice lacking one or both alleles of the SERT gene have been compared in three different brain regions; the resulting data were then compared to results obtained using traditional radiochemical methods (56). Briefly, synaptosomes were prepared from three mice genotypes for SERT function: SERT +/+, +/−, and −/−. The amount of time needed for each preparation to clear 1 μM of introduced serotonin was monitored chronoamperometrically and an estimated uptake rate was extrapolated from the slope of the line constructed between the point of 20% and 60% decrease in maximum current signal. Figure 3 illustrates representative serotonin uptake traces for brain stem synaptosomes prepared from three genotypes of SERT-deficient mice (56). It was determined that the clearance rate for SERT +/− mice was reduced by 60% compared to the uptake rate obtained chronoamperometrically for SERT +/− mice (Figure 3, top and center panels). This is a minute difference from the radiochemical method determination of a 50% reduction rate for SERT +/− mice, but it is a key difference presumed to be based on the potential loss of sensitivity of uptake inherent in the filtration step used in the tissue preparation of the radiochemical method (56). The sensitivity provided with chronoamperometry allows this level of difference to be determined. As expected, no detectable uptake of serotonin was observed for SERT −/− mice (Figure 3, bottom panel).
Figure 3.
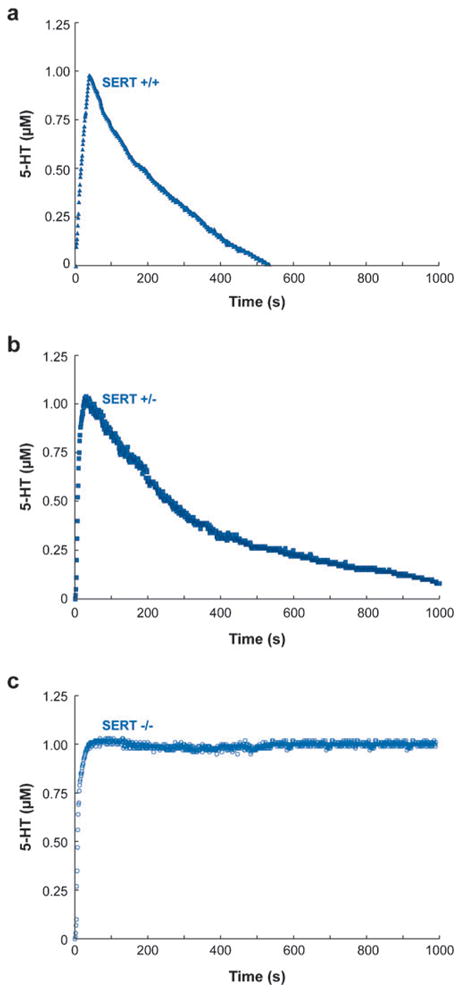
Representative chronoamperometric recordings for serotonin uptake in brain stem synaptosomes prepared from serotonin transporter (SERT) +/+ (a), SERT +/− (b), and SERT −/− (c). The average uptake rates for SERT +/+ and SERT +/− were 162 ± 13 and 67.7 ± 4.1 pmol/mg protein-min, respectively, whereas SERT −/− showed no detectable uptake. Reproduced from Reference 56 with permission.
Dopamine uptake has also been investigated with chronoamperometry, specifically with regard to an abnormality of the α-synuclein protein, which is potentially linked to Parkinson’s disease (63). Mice have been genetically modified to overexpress this protein, and striatum synaptosomes have been prepared and tested for dopamine transport rates using the same approach described above for serotonin. These genetically modified mice exhibited hyperlocomotive activity, and the same mutant mouse synaptosomes showed a significant decrease (40%) in the clearance rate of 1 μM dopamine introduced into the medium. This observation possibly links the loss of transporter function (versus expression) to observed behavior (57).
7. SINGLE-CELL ELECTROPORATION FOR CELL MANIPULATION AND ANALYSIS
The examination of cell composition and the functioning chemical processes inside intact cellular environments remains an exciting area of study in which there is still much to be learned. To probe the internal environment of a cell while maintaining cell viability, electroporation methods have been developed. Using these methods, it is possible to passively introduce into a cell a numerous collection of antisense agents, fluorescent dyes, pharmacological stimulants, and other relatively small molecules unable to self-permeate the membrane surface (64–67). Electroporation is not exactly electroanalysis, but it does involve application of a potential across electrodes and so falls under the scope of this review.
In traditional electroporation, a strong electric field capable of exceeding the transmembrane potential (and thus creating small pores in the plasma membrane) is applied in pulses to a bulk population of suspended cells and the agent to be introduced is administered via the bathing solution (68–70). Typically, the field is generated by passing large voltage pulses between two large, fixed millimeter-sized electrodes positioned on either side of the cells to be electroporated. This creates a broad, unfocused electric field useful for bulk transfection applications. Lundqvist and colleagues developed the first single-cell electroporation scheme, exemplifying the small dimensions of carbon fiber electrodes to generate more localized, high electric fields (71). With a concentrated electric field produced at the electrode tip, individual or smaller groupings of cells could then be addressed.
Since then, other single-cell electroporation methods have been developed (for a more detailed discussion of the various single-cell electroporation methodologies available, please see Reference 72). Here, we highlight a method that generates a highly concentrated electric field at the outlet of a fused silica capillary that also transports the agent to be loaded into the cells (73, 74). These electrolyte-filled capillaries (EFCs) had previously been shown to project an intense electric field from the capillary outlet when used in capillary electrophoresis work (75). By use of this finely focused electric field near single cells or small groups of cells, materials in small defined quantities can be introduced into single cells via electroporation. Electroporation via an EFC was successfully demonstrated with the introduction of YOYO-1, an RNA-/DNA-intercalating dye, into NG108–15 cells (glial-neuronal hybrids) (73). In that experiment, single cells and/or single-cell processes were selectively loaded with YOYO-1 using various potential ranges at a constant cell–EFC tip distance. Different success rates were obtained for each applied potential, most notably when focusing poration efforts to small processes. For an applied potential of 2 kV, only 20% of poration attempts were successful, probably due to insufficient pore formation with such a low potential. However, a potential of 6 kV increased success to 92%. Still higher potentials did not yield greater success, with 10 kV only producing a 70% success rate, revealing a potential-dependence on both poration success rate and cell viability.
In addition to the magnitude of the applied potential, other key parameters have been carefully considered, including pulse duration, distance between the EFC tip and the cell surface, cell size, and cell morphology (76, 77). In these experiments, the effectiveness of the method to introduce fluorescent dyes to the cells or process was examined. Longer pulses (120–150 ms) produced greater decreases in internal fluorescence intensity of cells loaded with fluorescent molecules. This suggests that more extensive pore formation is occurring allowing labeled molecules to escape the cell. This decreases the total concentration of labeled molecule inside the cell, thus decreasing its fluorescence intensity. EFC tip distances on the order of multiple (3 or 4) micrometers also yielded favorable poration results. With these two parameters simultaneously optimized, more than 90% of the cells were electroporated and more than 80% remained viable (76). Moreover, big semicircular cells were more likely to be successfully permeated and remain viable for subsequent studies (77).
In light of the above parameters significant to poration success, a computer-controlled scanning electroporation configuration aiming to more controllably and selectively electroporate adhered cell cultures has recently been presented (78). In brief, the EFC was initially positioned in a dish of adhered cells using a micromanipulator. Then, a motorized stage was used to position the cell of interest underneath the EFC and subsequently porate the cell as described in the previous paragraph. With the addition of the motorized stage, this configuration can be performed in two modes: stationary and scanning. The stationary mode has been used to examine the shape of the electric field when fluorescein diphosphate–loaded WSS cells are electroporated (see Figure 4a). In addition, simple repositioning of the stage has been used to show that repetitive ring-shaped fluorescent areas can be patterned within the same culture. In the scanning mode, however, the potential is maintained while the stage is moved, resulting in a “drawing” effect (Figure 4b,c) for another selection of WSS cells electroporated with fluorescein diphosphate. This approach allows the electroporation agent to be changed many times, and several different experiments can be performed simultaneously within the same cell culture (78).
Figure 4.
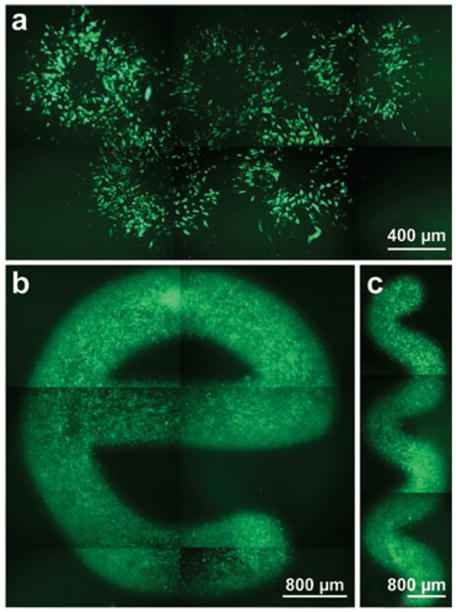
Examples of confluent WSS cells electroporated with fluorescein diphosphate in stationary mode (a) and scanning mode (b, c). Five rings can be seen in image a, demonstrating the electrolyte-filled capillary’s ability to independently electroporate different places within one cell culture in the stationary mode. Fluorescent “e” and “snake” patterns in images b and c, respectively, were drawn using the scanning mode. Reproduced from Reference 78 with permission.
8. SCANNING ELECTROCHEMICAL MICROSCOPY
Scanning electrochemical microscopy (SECM) is a scanning probe technique that has been used at the cellular surface. Briefly, an ultramicroelectrode (UME) is used to detect local electrochemical activity. When the UME is moved over the cell, electrochemical data are recorded at multiple positions and an image is constructed based on the local electrochemical properties of the area of interest. SECM provides topographic information and chemical analysis of cellular functions such as respiration, photosynthesis, and membrane transport. The SECM technique and its applications have been thoroughly reviewed (79–84). In this section, we discuss the latest work showing applications of SECM to cells [for an in-depth review on this subject, see the article by Amemiya et al. in this volume (85)].
SECM has been successfully used to study exocytosis from neuronal cells. Use of carbon fiber microelectrodes yields excellent time resolution and allows detection of zeptomole quantities of dopamine released by a single neuron (86). Recently, Baur and colleagues successfully developed a technique for imaging the topography of single PC12 cells using cell-impermeable Ru(NH3)63+ as a mediator (87). Use of a constant height mode based on the negative feedback effect clearly revealed distinct regions of decreased current on neurites, suggesting the presence of raised structures not visible in optical images. However, the constant height mode could be disadvantageous for imaging differentiated PC12 cells because the neurites are too low to be imaged when the electrode is placed at the apex of the cell body. The authors of the study, however, achieved an improved image resolution of PC12 cells and neurites by using a constant distance mode and two types of feedback signal for distance control. They argued that the highest resolution for these images was achieved with constant current mode using a 1-μm-diameter carbon ring electrode, although specific numbers were not provided (88).
Several groups have combined electrochemical and optical imaging to obtain more information-rich experiments at single cells. For example, Takahashi et al. developed an optical fiber electrode via Ti/Pt sputtering, allowing simultaneous topographic, electrochemical, and optical imaging (89). Optical fibers sputtered with gold were used by Suzuki’s group to simultaneously record electrochemical and optical images with nanometer-scale resolution. Neurites of PC12 cells have also been successfully imaged with high resolution. In that work, a pencil-shaped microelectrode was used for combined electrochemical/optical microscopy; the authors reported a spatial resolution of 300 nm (90).
Recently, Wipf, Baur and colleagues combined FSCV with SECM, which provided important advantages over SECM used alone (91–93). In summary, cyclic voltammetry was carried out at the SECM tip at rapid scan rates (10–1000 V s−1); 3D data sets were produced for line scans and 4D data sets were produced for imaging experiments. By combining those two techniques, the researchers were able to detect multiple electroactive species simultaneously and obtain micrometer spatial resolution of cells (Figure 5). Both oxygen consumption by macrophages and their release of hydrogen peroxide upon stimulation were monitored (92). In conventional SECM, the tip must be held at a constant potential, resulting in oxygen depletion. With the FSCV approach, oxygen depletion is minimized by use of low-duty cycle; therefore, this approach is well suited for imaging oxygen consumption at specific regions across the cell surface. In the future, FSCV combined with SECM will likely be used for specific single-cell applications.
Figure 5.

Fast-scan cyclic voltammetry–scanning electrochemical microscopy images of a single RAW 264.7 macrophage cell following stimulation with zymosan particles (row 1), followed by the addition of 0.3 IU of catalase (row 2), and after washing with fresh Hank’s buffer (row 3). Column a shows the potential for reduction of O2 average of 14 points between −1.2 and −1.3 V on cathodic sweep). Column b shows the potential for H2O2 oxidation (average of 12 points between +1.2 and +1.3 V on the first anodic sweep). Column c represents the average of −0.45 to −0.55 V on the cathodic sweep. The images in each row were recorded simultaneously. The potential applied to the tip consisted of a three-segment waveform (0.0 to +1.2 to −1.4 to 0.0 V) with a scan rate of 450 V·s−1. Reproduced from Reference 92 with permission.
9. THE INTERFACE OF CELL-BASED MICROFLUIDIC SYSTEMS WITH ELECTROCHEMICAL DETECTION
Using microfluidic devices to investigate cellular systems has become very popular, especially with the recent development of elastomeric materials such as polydimethyl-siloxane (PDMS) for the fabrication of devices (94, 95). Although the fabrication of many 2D or 3D microfluidic platforms preferably requires access to a cleanroom in a nanofabrication laboratory, PDMS has the advantages of being inexpensive, easy to handle, and able to connect to plastic tubing. This material is perfectly suited for on-chip cell culturing because it is permeable to gas, allowing cells to grow on it; it also has an excellent optical transparency that allows, for instance, detection with fluorescence microscopes. Several excellent recent reviews on microfluidics (96–99) are recommended for in-depth coverage of this topic.
Within bioanalytical studies, microfluidic devices are used for many different purposes including cell sorting, DNA analysis, immunoassays, and drug discovery (97, 99–102). The diversity of design in the various microfluidic platforms reflects the flourishing imagination of their creators. Indeed, the cells being studied are grown either at the surface, inside microchannels, or in different compartments as illustrated by Taylor et al. (103), who separated nerve cell bodies and axons and thereby stimulated only the nerve terminals.
An important aspect of cell-based microfluidics is, of course, the detection method used to characterize analytes of interest. The main detection techniques are optical (fluorescence being the most popular), electrochemical, and mass spectrometric. In this section we discuss the recent work illustrating the use of microfluidics with electrochemical detection.
Typically, an amperometric electrode is created using metal deposition techniques during the fabrication process of the microfluidic device; the most common electrode materials are carbon, platinum, and gold. Microfluidic devices with integrated electrochemical detection possess several advantages over external electrodes used to directly measure substances at single cells in stagnant solution. In the microfluidic device, the electrode does not need to be manually positioned close to the cell, and experiments using this device are not limited to one cell at a time. The Amatore group has developed a microfluidic device for measuring the oxidative stress generated by macrophages, which are key cells in the immune system. A platinized band microelectrode was used to detect oxidative bursts of reactive oxygen species or reactive nitrogen species with great sensitivity and reproducibility (104). In these experiments, the electrode surface is regenerated in situ by reducing hydrogen hexachloroplatinate in the presence of lead acetate at −60 mV versus a sodium-saturated calomel electrode (105) between experiments, thus circumventing electrode fouling effects and the subsequent decrease in current. In another set of experiments, an elegant microfluidic chip with a built-in amperometric detector array was recently described by the Matsue group (106). They used this system to measure oxygen consumption of single bovine embryos. The embryo was placed in the chip and immobilized near four platinum working electrodes with a constant flow stream. The oxygen consumption was measured with chronoamperometry (see Figure 6) (106). They compared this method to SECM and argued that experiments with the microfluidic chip are as precise as those with SECM, and are more cost effective and easier to use.
Figure 6.

(a) An optical image and (b) amperometric recordings of oxygen consumption obtained from a bovine embryo adhered to a microfluidic device integrated with four working electrodes (labeled W1, W2, W3, and W4 in the optical image). Panel a shows the immobilized embryo at the gate position; the plot of the oxygen concentration profile consumed by the day-6 embryo at the morula stage was obtained with the amperometric detector array at room temperature against time. The monitored concentration profiles for each electrode are shown in panel b. Reproduced from Reference 106 with permission.
Recently, microfluidic devices have been developed to study nerve cells. Owing to their fragility, culturing and studying nerve and nerve-like cells in chip-based devices present a significant challenge. PC12 cells, nerve-like cells that have been used to study dopamine release by electrochemical detection, contain dopamine-filled vesicles and release their contents upon stimulation via exocytosis. They have active dopamine uptake transporters as well and so may be considered a good model system of the release and removal process for dopamine.
Traditionally, dopamine release by PC12 cells has been monitored using carbon fiber amperometry (described above); however, with microfluidic chip technology, more complex systems can be studied. Cells can be grown in conditions that are more similar to in vivo. Huang et al. constructed a device capable of on-chip transport, location and monitoring of Q for a single PC12 cell (107). Martin’s group used integrated Nafion® -coated microelectrodes in their microchip. PC12 cells were reversibly sealed inside a collagen-coated microchannel and dopamine levels were measured by amperometry after calcium stimulation (108). Cui et al. (2006) presented a microelectrode array biochip to investigate the effect of several drugs such as reserpine, L-DOPA, and nomifensine on the level of dopamine release upon multiple potassium stimulations in PC12 cells (109). On-chip determination of dopamine release by PC12 cells with a gold electrode was achieved by Spégel et al. (110). Normally, gold and platinum electrodes are not suitable for dopamine measurements, as dopamine oxidation products form a nonconducting polymer at the surface of the electrode. This problem was solved by modifying the electrode surface by mercaptopropionic acid to decrease the rate of dopamine polymerization, thereby promoting the stability of the electrodes while providing good reversibility and sensitivity of the measurement.
Microfluidic devices allow more precise control of both flow and concentration of molecules than can be obtained with a micropipette and a pressure-based (often called “puffed”) injection. In addition, several detection methods can be used simultaneously. Sun and Gillis recently developed a microchip that uses transparent indium tin oxide (ITO) electrodes to measure quantal exocytosis of catecholamines by bovine adrenal chromaffin cells. The cells adhered to the ITO electrode within the microchannel. Amperometric spikes were recorded with a signal-to-noise ratio comparable to that of carbon fiber electrodes. Also, because the electrodes are transparent simultaneous fluorescence-based measures could be implemented (111). It appears certain that in the future several detection techniques will be combined and integrated within microfluidic chips used for cellular measurements, allowing better imaging quality of the cells and more precise quantitative measurement of the substances released by the cells.
10. SUMMARY AND FUTURE DIRECTIONS
In vitro electrochemistry at cells clearly produces results pertinent to a variety of biologically relevant questions. It has been used to study the exocytosis of zeptomole-to-attomole levels of transmitters from single cells in isolated cultures, and to reveal fine details about the rate of transmitter uptake using synaptosomal models. It has been manipulated to electroporate single cells and to introduce multiple biomolecules unable to permeate the cell membrane. Finally, it has been coupled to a microfluidic platform as a detection scheme. The numerous fields that have been impacted by this technique testify to the versatility of electrochemistry in bioanalysis.
Acknowledgments
The authors gratefully acknowledge support from the National Institutes of Health and the National Science Foundation for work reviewed here. Additionally, the hard work of all our former coworkers referenced herein is gratefully acknowledged. A.G.E. gratefully acknowledges the support of the European Union in the form of a Marie Curie Chair.
Footnotes
DISCLOSURE STATEMENT
The authors are not aware of any biases that might be perceived as affecting the objectivity of this review.
Contributor Information
Kelly L. Adams, Email: kellya@chem.gu.se.
Maja Puchades, Email: maja.puchades@chem.gu.se.
Andrew G. Ewing, Email: andrewe@chem.gu.se.
LITERATURE CITED
- 1.Adams RN. Probing brain chemistry with electroanalytical techniques. Anal Chem. 1976;48:1126A–38A. doi: 10.1021/ac50008a001. [DOI] [PubMed] [Google Scholar]
- 2.Leszczyszyn DJ, Jankowski JA, Viveros OH, Diliberto EJ, Jr, Near JA, Wightman RM. Nicotinic receptor-mediated catecholamine secretion from individual chromaffin cells: chemical evidence for exocytosis. J Biol Chem. 1990;265:14736–37. [PubMed] [Google Scholar]
- 3.Wightman RM, Jankowski JA, Kennedy RT, Kawagoe KT, Schroeder TJ, et al. Temporally resolved catecholamine spikes correspond to single vesicle release from individual chromaffin cells. Proc Natl Acad Sci USA. 1991;88:10754–58. doi: 10.1073/pnas.88.23.10754. [DOI] [PMC free article] [PubMed] [Google Scholar]
- 4.Durack GR, Robinson JP, editors. Emerging Tools for Single-Cell Analysis: Advances in Optical Measurement Technologies Cytometric Cellular Analysis. New York: Wiley; 2000. [Google Scholar]
- 5.Stamford JA, Justice JBJ. Probing brain chemistry. Anal Chem. 1996;68:359A–63A. [PubMed] [Google Scholar]
- 6.Valtorta F, Fesce R, Grohovaz F, Haimann C, Hurlbut WP, et al. Neurotransmitter release and synaptic vesicle recycling. Neuroscience. 1990;35:477–89. doi: 10.1016/0306-4522(90)90323-v. [DOI] [PubMed] [Google Scholar]
- 7.Neher E, Marty A. Discrete changes of cell membrane capacitance observed under conditions of enhanced secretion in bovine adrenal chromaffin cells. Proc Natl Acad Sci USA. 1982;79:6712–16. doi: 10.1073/pnas.79.21.6712. [DOI] [PMC free article] [PubMed] [Google Scholar]
- 8.Chow RH, von Ruden L, Neher E. Delay in vesicle fusion revealed by electrochemical monitoring of single secretory events in adrenal chromaffin cells. Nature. 1992;356:60–63. doi: 10.1038/356060a0. [DOI] [PubMed] [Google Scholar]
- 9.Dayton MA, Ewing AG, Wightman RM. Evaluation of amphetamine-induced in vivo electrochemical response. Eur J Pharmacol. 1981;75:141–44. doi: 10.1016/0014-2999(81)90074-1. [DOI] [PubMed] [Google Scholar]
- 10.Ewing AG, Wightman RM, Dayton MA. In vivo voltammetry with electrodes that discriminate between dopamine and ascorbate. Brain Res. 1982;249:361–70. doi: 10.1016/0006-8993(82)90070-1. [DOI] [PubMed] [Google Scholar]
- 11.Cespuglio R, Faradji H, Ponchon JL, Riou F, Buda M, et al. In vivo measurements by differential pulse voltammetry of extracellular 5-hydroxyindoleacetic acid in the rat brain. J Physiol. 1981;77:327–32. [PubMed] [Google Scholar]
- 12.Gonon F, Buda M, Cespuglio R, Jouvet M, Pujol JF. In vivo electrochemical detection of catechols in the neostriatum of anaesthetized rats: dopamine or DOPAC? Nature. 1980;286:902–4. doi: 10.1038/286902a0. [DOI] [PubMed] [Google Scholar]
- 13.Cahill PS, Walker QD, Finnegan JM, Mickelson GE, Travis ER, Wightman RM. Microelectrodes for the measurement of catecholamines in biological systems. Anal Chem. 1996;68:3180–86. doi: 10.1021/ac960347d. [DOI] [PubMed] [Google Scholar]
- 14.Kawagoe KT, Zimmerman JB, Wightman RM. Principles of voltammetry and microelectrode surface states. J Neurosci Methods. 1993;48:225–40. doi: 10.1016/0165-0270(93)90094-8. [DOI] [PubMed] [Google Scholar]
- 15.Pothos EN, Davila V, Sulzer D. Presynaptic recording of quanta from midbrain dopamine neurons and modulation of the quantal size. J Neurosci. 1998;18:4106–18. doi: 10.1523/JNEUROSCI.18-11-04106.1998. [DOI] [PMC free article] [PubMed] [Google Scholar]
- 16.Travis ER, Wightman RM. Spatio-temporal resolution of exocytosis from individual cells. Annu Rev Biophys Biomol Struct. 1998;27:77–103. doi: 10.1146/annurev.biophys.27.1.77. [DOI] [PubMed] [Google Scholar]
- 17.Gerhardt GA, Oke AF, Nagy G, Moghaddam B, Adams RN. Nafion-coated electrodes with high selectivity for CNS electrochemistry. Brain Res. 1984;290:390–95. doi: 10.1016/0006-8993(84)90963-6. [DOI] [PubMed] [Google Scholar]
- 18.Friedemann MN, Robinson SW, Gerhardt GA. O-phenylenediamine-modified carbon fiber electrodes for the detection of nitric oxide. Anal Chem. 1996;68:2621–28. doi: 10.1021/ac960093w. [DOI] [PubMed] [Google Scholar]
- 19.Gmucova K, Weis M, Barancok D, Cirak J, Tomcik P, Pavlasek J. Ion selectivity of a poly(3-pentylmethoxythiophene) LB-layer modified carbon-fiber microelectrode as a consequence of the second order filtering in voltcoulometry. J Biochem Biophys Methods. 2007;70:385–90. doi: 10.1016/j.jbbm.2006.09.001. [DOI] [PubMed] [Google Scholar]
- 20.Wang Y, Joshi PP, Hobbs KL, Johnson MB, Schmidtke DW. Nanostructured biosensors built by layer-by-layer electrostatic assembly of enzyme-coated single-walled carbon nanotubes and redox polymers. Langmuir. 2006;22:9776–83. doi: 10.1021/la060857v. [DOI] [PubMed] [Google Scholar]
- 21.Kristensen EW, Kuhr WG, Wightman RM. Temporal characterization of perfluorinated ion exchange coated microvoltammetric electrodes for in vivo use. Anal Chem. 1987;59:1752–57. doi: 10.1021/ac00141a003. [DOI] [PubMed] [Google Scholar]
- 22.Nagy G, Gerhardt GA, Oke AF, Rice ME, Adams RN, et al. Ion exchange and transport of neurotransmitters in Nafion films on conventional and microelectrode surfaces. J Electroanal Chem. 1985;188:85–94. [Google Scholar]
- 23.Rice ME, Oke AF, Bradberry CW, Adams RN. Simultaneous voltammetric and chemical monitoring of dopamine release in situ. Brain Res. 1985;340:151–55. doi: 10.1016/0006-8993(85)90785-1. [DOI] [PubMed] [Google Scholar]
- 24.Hermans A, Seipel AT, Miller CE, Wightman RM. Carbon-fiber microelectrodes modified with 4-sulfobenzene have increased sensitivity and selectivity for catecholamines. Langmuir. 2006;22:1964–69. doi: 10.1021/la053032e. [DOI] [PMC free article] [PubMed] [Google Scholar]
- 25.Chen RS, Huang WH, Tong H, Wang ZL, Cheng JK. Carbon fiber nanoelectrodes modified by single-walled carbon nanotubes. Anal Chem. 2003;75:6341–45. doi: 10.1021/ac0340556. [DOI] [PubMed] [Google Scholar]
- 26.Lambie BA, Orwar O, Weber SG. Controlling the electrochemically active area of carbon fiber microelectrodes by the electrodeposition and selective removal of an insulating photoresist. Anal Chem. 2006;78:5165–71. doi: 10.1021/ac051372z. [DOI] [PMC free article] [PubMed] [Google Scholar]
- 27.Hermans A, Wightman RM. Conical tungsten tips as substrates for the preparation of ultramicroelectrodes. Langmuir. 2006;22:10348–53. doi: 10.1021/la061209e. [DOI] [PMC free article] [PubMed] [Google Scholar]
- 28.Hochstetler SE, Puopolo M, Gustincich S, Raviola E, Wightman RM. Real-time amperometric measurements of zeptomole quantities of dopamine released from neurons. Anal Chem. 2000;72:489–96. doi: 10.1021/ac991119x. [DOI] [PubMed] [Google Scholar]
- 29.Pothos EN, Mosharov E, Liu K-P, Setlik W, Haburcak M, et al. Stimulation-dependent regulation of the pH, volume and quantal size of bovine and rodent secretory vesicles. J Physiol. 2002;542:453–76. doi: 10.1113/jphysiol.2002.018630. [DOI] [PMC free article] [PubMed] [Google Scholar]
- 30.Chen TK, Luo G, Ewing AG. Amperometric monitoring of stimulated catecholamine release from rat pheochromocytoma (PC12) cells at the zeptomole level. Anal Chem. 1994;66:3031–35. doi: 10.1021/ac00091a007. [DOI] [PubMed] [Google Scholar]
- 31.Colliver TL, Pyott SJ, Achalabun M, Ewing AG. VMAT-mediated changes in quantal size and vesicular volume. J Neurosci. 2000;20:5276–82. doi: 10.1523/JNEUROSCI.20-14-05276.2000. [DOI] [PMC free article] [PubMed] [Google Scholar]
- 32.Schmitz Y, Lee CJ, Schmauss C, Gonon F, Sulzer D. Amphetamine distorts stimulation-dependent dopamine overflow: effects on D2 autoreceptors, transporters, and synaptic vesicle stores. J Neurosci. 2001;21:5916–24. doi: 10.1523/JNEUROSCI.21-16-05916.2001. [DOI] [PMC free article] [PubMed] [Google Scholar]
- 33.Chen G, Gavin PF, Luo G, Ewing AG. Observation and quantitation of exocytosis from the cell body of a fully developed neuron in Planorbis corneus. J Neurosci. 1995;15:7747–55. doi: 10.1523/JNEUROSCI.15-11-07747.1995. [DOI] [PMC free article] [PubMed] [Google Scholar]
- 34.Schonfu D, Reum T, Olshausen P, Fischer T, Morgenstern R. Modelling constant potential amperometry for investigations of dopaminergic neurotransmission kinetics in vivo. J Neurosci Methods. 2001;112:163–72. doi: 10.1016/s0165-0270(01)00465-4. [DOI] [PubMed] [Google Scholar]
- 35.Anderson BB, Chen G, Gutman DA, Ewing AG. Demonstration of two distributions of vesicle radius in the dopamine neuron of Planorbis corneus from electrochemical data. J Neurosci Methods. 1999;88:153–61. doi: 10.1016/s0165-0270(99)00024-2. [DOI] [PubMed] [Google Scholar]
- 36.Cans AS, Wittenberg N, Eves D, Karlsson R, Karlsson A, et al. Amperometric detection of exocytosis in an artificial synapse. Anal Chem. 2003;75:4168–75. doi: 10.1021/ac0343578. [DOI] [PubMed] [Google Scholar]
- 37.Amatore C, Arbault S, Bouret Y, Guille M, Lemaître F, Verchier Y. Regulation of exocytosis in chromaffin cells by trans-insertion of lysophosphatidyl-choline and arachidonic acid into the outer leaflet of the cell membrane. Chem Bio Chem. 2006;7:1998–2003. doi: 10.1002/cbic.200600194. [DOI] [PubMed] [Google Scholar]
- 38.Uchiyama Y, Maxson MM, Sawada T, Nakano A, Ewing AG. Phospholipid mediated plasticity in exocytosis observed in PC12 cells. Brain Res. 2007;1151:46–54. doi: 10.1016/j.brainres.2007.03.012. [DOI] [PMC free article] [PubMed] [Google Scholar]
- 39.Greene LA, Tischler AS. Establishment of a noradrenergic clonal line of rat adrenal pheochromocytoma cells which respond to nerve growth factor. Proc Natl Acad Sci USA. 1976;73:2424–28. doi: 10.1073/pnas.73.7.2424. [DOI] [PMC free article] [PubMed] [Google Scholar]
- 40.Umbach JA, Zhao Y, Gundersen CB. Lithium enhances secretion from large dense-core vesicles in nerve growth factor–differentiated PC12 cells. J Neurochem. 2005;94:1306–14. doi: 10.1111/j.1471-4159.2005.03277.x. [DOI] [PubMed] [Google Scholar]
- 41.Sombers LA, Maxson MM, Ewing AG. Loaded dopamine is preferentially stored in the halo portion of PC12 cell dense core vesicles. J Neurochem. 2005;93:1122–31. doi: 10.1111/j.1471-4159.2005.03087.x. [DOI] [PubMed] [Google Scholar]
- 42.Troyer KP, Wightman RM. Temporal separation of vesicle release from vesicle fusion during exocytosis. J Biol Chem. 2002;277:29101–7. doi: 10.1074/jbc.M202856200. [DOI] [PubMed] [Google Scholar]
- 43.Amatore C, Arbault S, Bonifas I, Lemaître F, Verchier Y. Vesicular exocytosis under hypotonic conditions shows two distinct populations of dense core vesicles in bovine chromaffin cells. Chem Phys Chem. 2007;8:578–85. doi: 10.1002/cphc.200600607. [DOI] [PubMed] [Google Scholar]
- 44.Westerink RH, de Groot A, Vijverberg HP. Heterogeneity of catecholamine-containing vesicles in PC12 cells. Biochem Biophys Res Commun. 2000;270:625–30. doi: 10.1006/bbrc.2000.2470. [DOI] [PubMed] [Google Scholar]
- 45.Tang KS, Tse A, Tse FW. Differential regulation of multiple populations of granules in rat adrenal chromaffin cells by culture duration and cyclic AMP. J Neurochem. 2005;92:1126–39. doi: 10.1111/j.1471-4159.2004.02944.x. [DOI] [PubMed] [Google Scholar]
- 46.Villanueva M, Wightman RM. Facilitation of quantal release induced by a D1-like receptor on bovine chromaffin cells. Biochem J. 2007;46:3881–87. doi: 10.1021/bi602661p. [DOI] [PMC free article] [PubMed] [Google Scholar]
- 47.Amatore C, Arbault S, Lemaître F, Verchier Y. Comparison of apex and bottom secretion efficiency at chromaffin cells as measured by amperometry. Biophys Chem. 2007;127:165–71. doi: 10.1016/j.bpc.2007.01.007. [DOI] [PubMed] [Google Scholar]
- 48.Cvacka J, Quaiserova V, Park J, Show Y, Muck A, Swain GM. Boron-doped diamond microelectrodes for use in capillary electrophoresis with electrochemical detection. Anal Chem. 2003;75:2678–87. doi: 10.1021/ac030024z. [DOI] [PubMed] [Google Scholar]
- 49.Muna GW, Quaiserova-Mocko V, Swain GM. Chlorinated phenol analysis using off-line solid-phase extraction and capillary electrophoresis coupled with amperometric detection and a boron-doped diamond microelectrode. Anal Chem. 2005;77:6542–48. doi: 10.1021/ac050473u. [DOI] [PubMed] [Google Scholar]
- 50.Park J, Galligan JJ, Fink GD, Swain GM. In vitro continuous amperometry with a diamond microelectrode coupled with video microscopy for simultaneously monitoring endogenous norepinephrine and its effect on the contractile response of a rat mesenteric artery. Anal Chem. 2006;78:6756–64. doi: 10.1021/ac060440u. [DOI] [PubMed] [Google Scholar]
- 51.Park J, Quaiserova-Mocko V, Peckova K, Galligan JJ, Fink GD, Swain GM. Fabrication, characterization, and application of a diamond microelectrode for electrochemical measurement of norepinephrine release from the sympathetic nervous system. Diam Relat Mater. 2006;15:761–72. [Google Scholar]
- 52.Park J, Show Y, Quaiserova V, Galligan JJ, Fink GD, Swain GM. Diamond microelectrodes for use in biological environments. J Electroanal Chem. 2005;583:56–68. [Google Scholar]
- 53.Patel BA, Bian X, Quaiserova-Mocko V, Galligan JJ, Swain GM. In vitro continuous amperometric monitoring of 5-hydroxytryptamine release from enterochromaffin cells of the guinea pig ileum. Analyst. 2007;132:41–47. doi: 10.1039/b611920d. [DOI] [PubMed] [Google Scholar]
- 54.Bian X, Patel B, Dai X, Galligan JJ, Swain G. High mucosal serotonin availability in neonatal guinea pig ileum is associated with low serotonin transporter expression. Gastroenterology. 2007;132:2438–47. doi: 10.1053/j.gastro.2007.03.103. [DOI] [PMC free article] [PubMed] [Google Scholar]
- 55.Perez XA, Andrews AM. Chronoamperometry to determine differential reductions in uptake in brain synaptosomes from serotonin transporter knockout mice. Anal Chem. 2005;77:818–26. doi: 10.1021/ac049103g. [DOI] [PubMed] [Google Scholar]
- 56.Perez XA, Bianco LE, Andrews AM. Filtration disrupts synaptosomes during radiochemical analysis of serotonin uptake: comparison with chronoamperometry in SERT knockout mice. J Neurosci Methods. 2006;154:245–55. doi: 10.1016/j.jneumeth.2005.12.017. [DOI] [PubMed] [Google Scholar]
- 57.Unger EL, Eve DJ, Perez XA, Reichenbach DK, Xu Y, et al. Locomotor hyperactivity and alterations in dopamine neurotransmission are associated with overexpression of A53T mutant human α-synuclein in mice. Neurobio Dis. 2006;21:431–43. doi: 10.1016/j.nbd.2005.08.005. [DOI] [PubMed] [Google Scholar]
- 58.Erecinska M, Nelson D, Silver IA. Metabolic and energetic properties of isolated nerve ending particles (synaptosomes) Biochim Biophys Acta Bioenerg. 1996;1277:13–34. doi: 10.1016/s0005-2728(96)00103-x. [DOI] [PubMed] [Google Scholar]
- 59.Hyde CE, Bennett BA. Similar properties of fetal and adult amine transporters in the rat brain. Brain Res. 1994;646:118–23. doi: 10.1016/0006-8993(94)90063-9. [DOI] [PubMed] [Google Scholar]
- 60.Scott ID, Nicholls DG. Energy transduction in intact synaptosomes: influence of plasma-membrane depolarization on the respiration and membrane potential of internal mitochondria determined in situ. Biochem J. 1980;186:21–33. doi: 10.1042/bj1860021. [DOI] [PMC free article] [PubMed] [Google Scholar]
- 61.Whittaker VP. Thirty years of synaptosome research. J Neurocytol. 1993;22:735–42. doi: 10.1007/BF01181319. [DOI] [PubMed] [Google Scholar]
- 62.Schenk JO, Wright C, Bjorklund N. Unraveling neuronal dopamine transporter mechanisms with rotating disk electrode voltammetry. J Neurosci Methods. 2005;143:41–47. doi: 10.1016/j.jneumeth.2004.09.021. [DOI] [PubMed] [Google Scholar]
- 63.Kruger R, Muller T, Riess O. Involvement of α-synuclein in Parkinson’s disease and other neurodegenerative disorders. J Neural Transm. 2000;107:31–40. doi: 10.1007/s007020050002. [DOI] [PubMed] [Google Scholar]
- 64.Templeton NS, Roberts DD, Safer B. Efficient gene targeting in mouse embryonic stem cells. Gene Ther. 1997;4:700–9. doi: 10.1038/sj.gt.3300457. [DOI] [PubMed] [Google Scholar]
- 65.Tsong TY. Electroporation of cell membranes. Biophys J. 1991;60:297–306. doi: 10.1016/S0006-3495(91)82054-9. [DOI] [PMC free article] [PubMed] [Google Scholar]
- 66.Weaver JC. Electroporation: a general phenomenon for manipulating cells and tissues. J Cell Biochem. 1993;51:426–35. doi: 10.1002/jcb.2400510407. [DOI] [PubMed] [Google Scholar]
- 67.Zimmermann U. Electric field-mediated fusion and related electrical phenomena. Biochim Biophys Acta Rev Biomem. 1982;694:227–77. doi: 10.1016/0304-4157(82)90007-7. [DOI] [PubMed] [Google Scholar]
- 68.Gabriel B, Teissie J. Time courses of mammalian cell electropermeabilization observed by millisecond imaging of membrane property changes during the pulse. Biophys J. 1999;76:2158–65. doi: 10.1016/S0006-3495(99)77370-4. [DOI] [PMC free article] [PubMed] [Google Scholar]
- 69.Golzio M, Teissie J, Rols M-P. Direct visualization at the single-cell level of electrically mediated gene delivery. Proc Natl Acad Sci USA. 2002;99:1292–97. doi: 10.1073/pnas.022646499. [DOI] [PMC free article] [PubMed] [Google Scholar]
- 70.Hibino M, Itoh H, Kinosita K. Time courses of cell electroporation as revealed by submicrosecond imaging of transmembrane potential. Biophys J. 1993;64:1789–800. doi: 10.1016/S0006-3495(93)81550-9. [DOI] [PMC free article] [PubMed] [Google Scholar]
- 71.Lundqvist JA, Sahlin F, Aberg MAI, Stromberg A, Eriksson PS, Orwar O. Altering the biochemical state of individual cultured cells and organelles with ultramicroelectrodes. Proc Natl Acad Sci USA. 1998;95:10356–60. doi: 10.1073/pnas.95.18.10356. [DOI] [PMC free article] [PubMed] [Google Scholar]
- 72.Olofsson J, Nolkrantz K, Ryttsen F, Lambie BA, Weber SG, Orwar O. Single-cell electroporation. Curr Opin Biotechnol. 2003;14:29–34. doi: 10.1016/s0958-1669(02)00003-4. [DOI] [PubMed] [Google Scholar]
- 73.Nolkrantz K, Farre C, Brederlau A, Karlsson RID, Brennan C, et al. Electroporation of single cells and tissues with an electrolyte-filled capillary. Anal Chem. 2001;73:4469–77. doi: 10.1021/ac010403x. [DOI] [PubMed] [Google Scholar]
- 74.Nolkrantz K, Farre C, Hurtig KJ, Rylander P, Orwar O. Functional screening of intracellular proteins in single cells and in patterned cell arrays using electroporation. Anal Chem. 2002;74:4300–5. doi: 10.1021/ac025584x. [DOI] [PubMed] [Google Scholar]
- 75.Lu W, Cassidy RM. Background noise in capillary electrophoretic amperometric detection. Anal Chem. 1994;66:200–4. [Google Scholar]
- 76.Agarwal A, Zudans I, Orwar O, Weber SG. Simultaneous maximization of cell permeabilization and viability in single-cell electroporation using an electrolyte-filled capillary. Anal Chem. 2007;79:161–67. doi: 10.1021/ac061270o. [DOI] [PMC free article] [PubMed] [Google Scholar]
- 77.Agarwal A, Zudans I, Weber EA, Olofsson J, Orwar O, Weber SG. Effect of cell size and shape on single-cell electroporation. Anal Chem. 2007;79:3589–96. doi: 10.1021/ac062049e. [DOI] [PMC free article] [PubMed] [Google Scholar]
- 78.Olofsson J, Levin M, Stromberg A, Weber SG, Ryttsen F, Orwar O. Scanning electroporation of selected areas of adherent cell cultures. Anal Chem. 2007;79:4410–18. doi: 10.1021/ac062140i. [DOI] [PubMed] [Google Scholar]
- 79.Amemiya S, Guo J, Xiong H, Gross DA. Biological applications of scanning electrochemical microscopy: chemical imaging of single living cells and beyond. Anal Bioanal Chem. 2006;386:458–71. doi: 10.1007/s00216-006-0510-6. [DOI] [PubMed] [Google Scholar]
- 80.Wightman RM. Detection technologies: probing cellular chemistry in biological systems with microelectrodes. Science. 2006;311:1570–74. doi: 10.1126/science.1120027. [DOI] [PubMed] [Google Scholar]
- 81.Edwards MA, Martin S, Whitworth AL, Macpherson JV, Unwin PR. Scanning electrochemical microscopy: principles and applications to biophysical systems. Physiol Meas. 2006;27:R63–R108. doi: 10.1088/0967-3334/27/12/R01. [DOI] [PubMed] [Google Scholar]
- 82.Bard AJ, Li X, Zhan W. Chemically imaging living cells by scanning electrochemical microscopy. Biosens Bioelectron. 2006;22:461–72. doi: 10.1016/j.bios.2006.04.028. [DOI] [PubMed] [Google Scholar]
- 83.Zhan D, Li X, Zhan W, Fan FR, Bard AJ. Scanning electrochemical microscopy. 58 Application of a micropipet-supported ITIES tip to detect Ag+ and study its effect on fibroblast cells. Anal Chem. 2007;79:5225–31. doi: 10.1021/ac070318a. [DOI] [PubMed] [Google Scholar]
- 84.Sun P, Laforge FO, Mirkin MV. Scanning electrochemical microscopy in the 21st century. Phys Chem Chem Phys. 2007;9:802–23. doi: 10.1039/b612259k. [DOI] [PubMed] [Google Scholar]
- 85.Amemiya S, Bard AJ, Fan FRF, Mirkin MV, Unwin PR. Scanning electrochemical microscopy. Annu Rev Anal Chem. 1:95–131. doi: 10.1146/annurev.anchem.1.031207.112938. [DOI] [PubMed] [Google Scholar]
- 86.Hochstetler SE, Puopolo M, Gustincich S, Raviola E, Wightman RM. Real-time amperometric measurements of zeptomole quantities of dopamine released from neurons. Anal Chem. 2000;72:489–96. doi: 10.1021/ac991119x. [DOI] [PubMed] [Google Scholar]
- 87.Liebetrau JM, Miller HM, Baur JE, Takacs SA, Anupunpisit V, et al. Scanning electrochemical microscopy of model neurons: imaging and real-time detection of morphological changes. Anal Chem. 2003;75:563–71. doi: 10.1021/ac026166v. [DOI] [PubMed] [Google Scholar]
- 88.Kurulugama RT, Wipf DO, Takacs SA, Pongmayteegul S, Garris PA, Baur JE. Scanning electrochemical microscopy of model neurons: constant distance imaging. Anal Chem. 2005;77:1111–17. doi: 10.1021/ac048571n. [DOI] [PubMed] [Google Scholar]
- 89.Takahashi Y, Hirano Y, Yasukawa T, Shiku H, Yamada H, Matsue T. Topographic, electrochemical, and optical images captured using standing approach mode scanning electrochemical/optical microscopy. Langmuir. 2006;22:10299–306. doi: 10.1021/la0611763. [DOI] [PubMed] [Google Scholar]
- 90.Maruyama K, Ohkawa H, Ogawa S, Ueda A, Niwa O, Suzuki K. Fabrication and characterization of a nanometer-sized optical fiber electrode based on selective chemical etching for scanning electrochemical/optical microscopy. Anal Chem. 2006;78:1904–12. doi: 10.1021/ac0502549. [DOI] [PubMed] [Google Scholar]
- 91.Diaz-Ballote L, Alpuche-Aviles M, Wipf DO. Fast-scan cyclic voltammetry-scanning electrochemical microscopy. J Electroanal Chem. 2007;604:17–25. [Google Scholar]
- 92.Schrock DS, Baur JE. Chemical imaging with combined fast-scan cyclic voltammetry–scanning electrochemical microscopy. Anal Chem. 2007;79:7053–61. doi: 10.1021/ac071155t. [DOI] [PubMed] [Google Scholar]
- 93.Schrock DS, Wipf DO, Baur JE. Feedback effects in combined fast-scan cyclic voltammetry-scanning electrochemical microscopy. Anal Chem. 2007;79:4931–41. doi: 10.1021/ac0703911. [DOI] [PMC free article] [PubMed] [Google Scholar]
- 94.McDonald JC, Duffy DC, Anderson JR, Chiu DT, Wu H, et al. Fabrication of microfluidic systems in poly(dimethylsiloxane) Electrophoresis. 2000;21:27–40. doi: 10.1002/(SICI)1522-2683(20000101)21:1<27::AID-ELPS27>3.0.CO;2-C. [DOI] [PubMed] [Google Scholar]
- 95.Whitesides GM, Ostuni E, Takayama S, Jiang X, Ingber DE. Soft lithography in biology and biochemistry. Annu Rev Biomed Eng. 2001;3:335–73. doi: 10.1146/annurev.bioeng.3.1.335. [DOI] [PubMed] [Google Scholar]
- 96.Dittrich PS, Tachikawa K, Manz A. Micro total analysis systems: latest advancements and trends. Anal Chem. 2006;78:3887–908. doi: 10.1021/ac0605602. [DOI] [PubMed] [Google Scholar]
- 97.Fiorini GS, Chiu DT. Disposable microfluidic devices: fabrication, function, and application. Biotechniques. 2005;38:429–46. doi: 10.2144/05383RV02. [DOI] [PubMed] [Google Scholar]
- 98.Martin RS, Root PD, Spence DM. Microfluidic technologies as platforms for performing quantitative cellular analyses in an in vitro environment. Analyst. 2006;131:1197–206. doi: 10.1039/b611041j. [DOI] [PubMed] [Google Scholar]
- 99.Yi C, Zhang Q, Li CW, Yang J, Zhao J, Yang M. Optical and electrochemical detection techniques for cell-based microfluidic systems. Anal Bioanal Chem. 2006;384:1259–68. doi: 10.1007/s00216-005-0252-x. [DOI] [PubMed] [Google Scholar]
- 100.El-Ali J, Sorger PK, Jensen KF. Cells on chips. Nature. 2006;442:403–11. doi: 10.1038/nature05063. [DOI] [PubMed] [Google Scholar]
- 101.Dittrich PS, Manz A. Lab-on-a-chip: microfluidics in drug discovery. Nat Rev D rug Discov. 2006;5:210–18. doi: 10.1038/nrd1985. [DOI] [PubMed] [Google Scholar]
- 102.Sims CE, Allbritton NL. Analysis of single mammalian cells on-chip. Lab Chip. 2007;7:423–40. doi: 10.1039/b615235j. [DOI] [PubMed] [Google Scholar]
- 103.Taylor AM, Blurton-Jones M, Rhee SW, Cribbs DH, Cotman CW, Jeon NL. A microfluidic culture platform for CNS axonal injury, regeneration and transport. Nat Methods. 2005;2:599–605. doi: 10.1038/nmeth777. [DOI] [PMC free article] [PubMed] [Google Scholar]
- 104.Amatore C, Arbault S, Chen Y, Crozatier C, Tapsoba I. Electrochemical detection in a microfluidic device of oxidative stress generated by macrophage cells. Lab Chip. 2007;7:233–38. doi: 10.1039/b611569a. [DOI] [PubMed] [Google Scholar]
- 105.Amatore C, Arbault S, Bouton C, Coffi K, Drapier J, et al. Monitoring in real time with a microelectrode the release of reactive oxygen and nitrogen species by a single macrophage stimulated by its membrane mechanical depolarization. Chem Bio Chem. 2006;7:653–61. doi: 10.1002/cbic.200500359. [DOI] [PubMed] [Google Scholar]
- 106.Wu C-C, Saito T, Yasukawa T, Shiku H, Abe H, et al. Microfluidic chip integrated with amperometric detector array for in situ estimating oxygen consumption characteristics of single bovine embryos. Sensors Actuators B: Chem. 2007;125:680–87. [Google Scholar]
- 107.Huang WH, Cheng W, Zhang Z, Pang DW, Wang ZL, et al. Transport, location, and quantal release monitoring of single cells on a microfluidic device. Anal Chem. 2004;76:483–88. doi: 10.1021/ac035026y. [DOI] [PubMed] [Google Scholar]
- 108.Li MW, Spence DM, Martin RS. A microchip-based system for immobilizing PC 12 cells and amperometrically detecting catecholamines released after stimulation with calcium. Electroanalysis. 2005;17:1171–80. [Google Scholar]
- 109.Cui HF, Ye JS, Chen Y, Chong SC, Sheu FS. Microelectrode array biochip: tool for in vitro drug screening based on the detection of a drug effect on dopamine release from PC12 cells. Anal Chem. 2006;78:6347–55. doi: 10.1021/ac060018d. [DOI] [PubMed] [Google Scholar]
- 110.Spégel C, Heiskanen A, Acklid J, Wolff A, Taboryski R, et al. On-chip determination of dopamine exocytosis using mercaptopropionic acid modified microelectrodes. Electroanalysis. 2007;19:263–71. [Google Scholar]
- 111.Sun X, Gillis KD. On-chip amperometric measurement of quantal catecholamine release using transparent indium tin oxide electrodes. Anal Chem. 2006;78:2521–25. doi: 10.1021/ac052037d. [DOI] [PubMed] [Google Scholar]