

Abstract
Background
Antibodies (Ab) responses to major and minor HLA loci may impact graft survival after organ transplantation.
Methods
A ProtoArray platform was used to study 37 serum samples from 15 renal transplant patients with (n=10) and without (n=5) acute rejection (AR), and 7 normal controls and the clinical relevance of MICA-Ab measurements were investigated. Biopsy immunohistochemistry (IHC) was conducted for localization of the MICA antigen.
Results: De novo
MICA-Ab were detected in 11 of the 15 transplant patients in this study, irrespective of interval acute graft rejection. Mean MICA-Ab signal intensity was higher in transplant patients with C4d+AR (121.4) vs. C4d−AR (4.3), correlated with DSA to HLA antigens (r=0.66; p=0.0078), was not elevated in cellular rejections, and correlated with decline in graft function over the subsequent year (r=0.73; p=0.0022). Integrative genomics accurately predicted localization of the MICA antigen to the glomerulus in the normal kidney (1), as this was confirmed subsequently by IHC.
Conclusions
Integrative genomics analysis of ProtoArray data is a powerful tool to ascertain de novo antibody responses after renal transplantation, and to accurately predict the anatomical location of the target renal antigens. This proof-of-concept study on MICA measurements by ProtoArray demonstrate that antibody responses are modulated to MICA after transplantation in patients, irrespective of graft rejection, may be high at the time of humoral rejection, and may not be elevated in cellular rejection. Understanding that MICA is preferentially localized to the glomerulus, may explain both immunoregulatory and pathogenic roles for MICA after transplantation.
Keywords: Acute rejection, Renal transplantation, MICA
INTRODUCTION
HLA-specific antibodies, specifically directed against the donor organ, have been shown to be associated with poor graft outcomes and accelerated graft loss (2). Nevertheless, despite good tissue matches at the HLA loci between donor and recipient, as well as HLA identical organ transplantation, graft rejection can still occur (3). Recently, there has been a growing body of literature supporting that non-HLA antigens could be additional targets of injury in organ transplant recipients (4) (5). A well studied non-HLA antigen associated with an increased risk of graft loss is MHC class I-chain related gene A or MICA (6). The proteins encoded by MICA are membrane-bound antigens, and are expressed in freshly isolated monocytes, keratinocytes, endothelial cells, dendritic, fibroblasts cells (7), and gastrointestinal epithelium (8), but localization of this antigen in the kidney is currently unknown. MICA is induced on peripheral blood stimulated CD4+ and CD8+ T lymphocytes, and results in engagement of CD3 and CD28 (9). Antibodies against MICA alleles have been detected at acute renal (10), and heart (11) allograft rejection and associate with reduced one year graft survival (12) and chronic kidney graft dysfunction (13).
The aims of this study were three fold: (1) to utilize a novel integrative proto-genomics approach to investigate the generation of de novo post-transplant MICA responses after renal transplantation in children and young adults, irrespective of graft dysfunction; (2) to investigate any correlation between the intensity of de novo MICA-Ab responses with graft rejection; and (3) to predict and confirm renal compartmental localization of the MICA antigen with a view to understanding its pathogenic relevance in transplantation.
MATERIALS and METHODS
Patients and samples
Thirty paired pre- and post-transplant serum samples from 15 pediatric and young adult kidney allograft recipients were included for analysis of de novo post-transplant HLA and non-HLA antibody responses, across a human Protoarray platform (1). All patients were primary transplant recipients. 7 control samples were also examined on the ProtoArray for comparison (Table 1). All post-transplant serum samples were collected at the time of paired graft biopsies (protocol or for graft dysfunction, prior to any treatment intensification) and HLA donor specific antibodies (DSA) were measured. All biopsies were graded by the Banff classification (14–16) for acute rejection, and intragraft C4d stains were performed (17, 18) to assess for acute humoral rejection (AHR) (19, 20). Three clinical patient phenotypes were included in this study. The first group consisted of 5 patients with C4d+ acute rejection, the second group consisted of 5 patients with cellular rejections which were C4d− and with no measureable DSA, and the third group consisted of 5 patients with stable graft function without any interval rejection. The mean age of the recipients at transplantation, recipient gender, race, cause of ESRD, creatinine clearance at the sample date, donor gender, and donor source were matched for these 3 groups (Table 1). The post-transplant serum samples were collected between February 2004 and November 2006, at a mean of 26 (range 3–72 months) months after transplantation. Written informed consent was obtained from all subjects and the study was approved by the Institutional Review Board of Stanford University.
Table 1.
Patient demographic information for 3 phenotypes
| Baseline Demographics | ||||
|---|---|---|---|---|
| C4d+ AR (n=5) | C4d− AR (n=5) | STA (n=5) | P value | |
| Recipient | ||||
| Gender, %females | 20% | 40% | 20% | 0.71 |
| Mean age (yr) | 12.0 ± 2.2 | 13.3 ± 2.7 | 8.7 ± 2.9 | 0.47 |
| Immunosuppression, %SF# | 100% | 100% | 100% | 1 |
| Post-txp sampling (mo) | 37.1 ± 10.5 | 12.4 ± 4.7 | 28.0 ± 9.9 | 0.17 |
| Race* | 40%, 20%, 0%, 20%, 20% | 80%, 20%, 0%, 0%, 0% | 20%, 20%, 20%, 20%, 20% | 0.65 |
| Cause of ESRD** | 20%, 0%, 20%, 60%, 0%, 0% | 0%, 40%, 20%, 20%, 20%, 0% | 40%, 20%, 20%, 20%, 0%, 0% | 0.47 |
| Mean HLA match | 2.0 ± 0.4 | 3.0 ± 0.6 | 3.8 ± 0.9 | 0.3 |
| PRA <20% | 100% | 100% | 100% | 1 |
| Donor | ||||
| Type, %LD | 80% | 40% | 100% | 0.23 |
| Gender, %females | 40% | 40% | 80% | 0.34 |
| Mean age, yr | 31.2 ± 5.3 | 37.7 ± 5.8 | 34.8 ± 3.4 | 0.65 |
SF: Steroid-free immunosuppression treatment (ref), consisting of daclizumab induction + mycophenolate mofetil + tacrolimus
Race: 1=Caucasian; 2= Hispanic; 3=Asian; 4=African American; 5=Other
ESRD= End-stage Renal Disease: ESRD categories: 1= Glomerulonephritis; 2= Polycystic Kidney Disease; 3=Dysplasia; 4=Reflux Nephropathy; 5=Obstructive Uropathy; 6=Other
Plasma profiling using the Protein Microarray Measurement
Pre- and post-transplant serum antibodies were profiled for each patient, using the Invitrogen ProtoArray® Human Protein Microarray v3.0 platform (Invitrogen, Carlsbad, CA). This platform contains 5,056 non-redundant human proteins expressed in a baculovirus system, purified from insect cells and printed in duplicate onto a nitrocellulose-coated glass slide. Each protein is spotted twice on each array, to measure the quality of the signal intensity. Details for experiment processing and analysis follow the previous publication from our group (1). Prospector software was used to retrieve the expression based on immune response profiling of the .gal files. Pearson correlation coefficients between duplicated spots across all proteins were calculated, and raverage is 0.97 (range 0.71–0.99) for all patients.
The signal intensity was measured by subtracting the antibody signal detected from the background signal (Signal used = Signal Ab − Signal background) described in our previous study (Fig 1) (1). De novo antibody formation after transplantation was identified by using the equation Immune Response Ab = Signal used post-transplant − Signal used pre-transplant
Fig 1. Work flow for identifying anti-MICA antibody.

Work flow of study to identify compartmental localization and clinical relevance of MICA Antibodies by using integrated genomics approach.
We also tested for affinity of the MICA antigen on the ProtoArray by a MICA monoclonal antibody (mouse anti-human MICA monoclonal antibody, Minneapolis, MN 55413). We followed the manufacturer’s method for ProtoArray except we hybridized the arrays with monoclonal MICA antibodies (1:1000 fold dilution). The antibodies were then detected by a secondary antibody (Alexa Fluor® 647 goat anti-mouse IgG, Carlsbad, CA).
AILUN re-annotation and determining kidney compartment specific genes
Due to the inconsistencies over time in 5% of NetAffx probe-to-gene annotations (21) and approximately 30–50% discrepancy between the original and the redefined probes sets in the genes previously identified (22), AILUN (http://ailun.stanford.edu) (23) was used to re-annotate probe IDs from each platforms’ to the most recent NCBI Entrez Gene ID to overcome this inconsistency. Probes on any platform that non-specifically mapped to more than a single NCBI Entrez Gene were eliminated. Seven compartmental gene expression measurements from normal kidney tissue (inner and outer cortex, inner and outer medulla, papillary tips, renal pelvis and glomeruli) (24) were re-downloaded, re-annotated by AILUN and cross-mapped to the re-annotated Protoaray probe IDs, to determine kidney compartment specific genes, as previously described (1).
Immunohistochemistry staining
Immunohistochemical staining was performed on formalin fixed paraffin embedded tissue using goat polyclonal anti-human antibodies directed against MICA (R & D Systems, Mineapolis, MN, Catalog # AF1300). Serial sections of 4 mm were obtained, deparaffinized in xylene, and hydrated in a graded series of alcohol. Heat induced antigen retrieval was carried out by microwave pretreatment in citric acid buffer (10mM, pH 6.0) for 10 minutes. Nonspecific reactivity was inhibited by incubation for 30 minutes in a solution of 20% normal rabbit serum (VECTA STAIN Kit Elite PK 6105; Vector Laboratories, Burlingame, CA). The sections were then incubated with antisera to MICA (dilution 1:200) overnight for 18 hours at 4 degrees C. Subsequently, the tissue was incubated with biotinylated rabbit anti goat immunoglobulins, followed by avidin-biotin complex/horseradish peroxidase(VECTA-STAIN Kit Elite PK 6105) and diaminobenzidine for 8 minutes. The slides were counterstained with hematoxylin The staining was optimized using appropriate negative controls. Other immunostains used include antiserum against CD20 (DAKO, Carpenteria, CA, dilution 1:1000), C4d (Biomedica Gruppe, Austria, distributed by ALPCO, Windham NH, catalog #004-BI-RC4D; dilution 1:20), CD8 (DAKO, Carpenteria, CA, dilution 1:30) and CD56 (Zymed Laboratories, Carlsbad, CA, dilution 1:20).
Statistical analysis
T, chi-square, and ANOVA tests were used to compare continuous or categorical clinical variables for two or three phenotype groups. Banff grade were assigned as ordinal variables as range 0 to 4 according to the Banff grade (mild, IA, IB, IIA, IIB) based on severity. Spearman correlations were calculated to see if the association between immune response signal, rejection Banff grade, C4d+ rejections, DSA detection, time post-transplantation and change in creatinine clearance over time. All results were reported as mean ± standard error, and p≤0.05 was used as a significant level. All statistical tests were performed by SAS 9.1.3 software (SAS institute, Cary, NC).
RESULTS
MICA antibody increases after kidney transplantation, irrespective of graft rejection
The mean immune response signal in post-transplant patient serum, showed an increase in the MICA-Ab, with range from 21 to 364. When compared with healthy normal controls (n=7) volunteers, the MICA-Ab signal intensity was significantly higher in all 15 transplant recipients (37.9 ± 24.8 in normal controls vs. 129.0 ± 30.0 in transplant patients, p=0.03) (Table 2a). Among the 15 transplant patients, 73% (11/15), regardless of the presence or absence of biopsy proven graft rejection, showed an increase in MICA specific antibody immune responses after transplantation. When only examining post-transplant MICA-Ab responses in the 5 stable transplant patients, without acute rejection, the increase in MICA-Ab signal was seen to occur within a lower dynamic range (range 0–46.5). There was no association between the MICA-Ab signal intensity and sampling time post-transplantation (r=0.03; p=0.91) (Table 1 and Fig 2a). When the ProtoArray was probed with the MICA monoclonal antibody (mouse anti-human MICA monoclonal antibody, R & D Systems®, Minneapolis, MN), we observed positive signal for the MICA antigen, based on affinity between the MICA monoclonal antibody and the MICA protein on the ProtoArray.
Table 2.
| Table 2a: | |||
|---|---|---|---|
| Pediatric recipient (N=15) | Healthy control (N=7) | P | |
| (+)% of MICA post-txp signal intensity | 100% | 86% | 0.13 |
| MICA post-txp signal intensity | 129.0 ± 30.0 | 37.9 ± 24.8 | 0.03 |
| Table 2b: | |||
|---|---|---|---|
| C4d+ (N=5) | C4d−(N=5) | P(C4d+ vs. C4d−) | |
| (+)% of MICA signal intensity | 100% | 40% | 0.01 |
| De novo MICA signal intensity | 121.4±56.3 | 4.3±2.6 | 0.1 |
Fig 2. Association between MICA immune response signal intensity and kidney chronic injury.

A: Scatter plot for association between post-transplant sample time (months) and the signal intensity of MICA-Ab detected from ProtoArray from 15 patients, correlation coefficient = 0.03.
B: Scatter plot for association between the change of calculated creatinine clearance by Schwartz equation over the subsequent year (Δ Crcl) and the signal intensity of MICA-Ab detected from ProtoArray from 15 patients, correlation coefficient = 0.73.
MICA antibody levels are higher in C4d+ acute rejection and correlate with Class II DSA
The intensity of the antibody signal against the MICA antigen was highest in C4d+ rejection with 121.4±56.3, vs. 4.3±2.6 in C4d− rejection (p=0.1) (Table 2b). There was a correlation between high MICA levels and C4d+ graft rejection r=0.54 (p=0.039), and MHC class II specific circulating DSA in these patients (r=0.66; p=0.0078).
Mapping MICA in different compartments of normal kidney
Kidney compartment specific gene lists have been previously generated (1) for each of the 7 individual kidney compartments (24), with false discovery rates (FDR) <5% from statistical analysis of microarrays (SAM; (25). To summarize, each gene on the cDNA platform was compared between a specific kidney compartment, versus all other compartments, by a two-unpaired class comparison and a multi-class comparison (Fig 1) (1). 109 targets were identified on the Protoarray, mapping specifically to genes most highly regulated in the glomerulus (1). By ranking these targets by average signal intensity and positive signal percentage across the 15 patients, the intensity signal of the MICA-Ab ranked in the top 15 glomerulus–specific targets (Table 3) that are known to mount antibody responses after transplantation (1). The MICA antigen was found to have a 2.7-fold higher expression (false discovery rate [FDR] = 2.5%) in the glomerulus, when compared to the other 6 normal kidney compartments (in a two-unpaired class comparison), and with a contrast score (the standardized mean difference between MICA expression in glomeruli versus its overall mean expression) of 1.6 (FDR 0.1% by multi-class comparison).
Table 3.
The top 15 targets of the rank order of positive antibody signal intensity solely specific to glomerulus compartment
| Symbol | Entrez GeneID | Positive Ab. Signal Intensity across 15 pts (%) | Average Ab. Immune Response Signal Intensity | FDR (%) | Fold | Contrast Score | r |
|---|---|---|---|---|---|---|---|
| CTNND1 | 1500 | 93% | 741.60 | 2.06 | 2.03 | 2.21 | 0.21 |
| WWC3 | 55841 | 87% | 86.87 | 1.31 | 2.13 | 2.41 | 0.07 |
| ROCK1 | 6093 | 87% | 78.47 | 1.31 | 2.06 | 3.27 | −0.40 |
| CBLB | 868 | 80% | 93.13 | 1.58 | 2.08 | 2.67 | 0.37 |
| CLIC2 | 1193 | 80% | 71.00 | 0.46 | 2.54 | 3.14 | 0.13 |
| CMAH | 8418 | 80% | 51.90 | 0 | 4.89 | 2.50 | 0.21 |
| PIP5K2A | 5305 | 80% | 48.70 | 0.46 | 2.85 | 1.81 | −0.12 |
| TSPAN2 | 10100 | 80% | 36.37 | 0 | 3.29 | 2.9 | 0.30 |
| RAPGEF4 | 11069 | 80% | 18.00 | 0.20 | 2.98 | 2.80 | −0.14 |
| FLJ10357 | 55701 | 73% | 129.20 | 0.20 | 2.83 | 2.59 | 0.17 |
| ELK3 | 2004 | 73% | 88.37 | 0.46 | 2.99 | 2.07 | 0.49 |
| ANKS6 | 203286 | 73% | 58.93 | 0.14 | 3.01 | 3.31 | 0.08 |
| BTNL9 | 153579 | 73% | 52.60 | 0 | 4.44 | 3.23 | 0.48 |
| MICA | 4276 | 73% | 47.67 | 2.48 | 2.69 | 1.55 | 0.73 |
| IFITM1 | 8519 | 73% | 45.87 | 2.06 | 2.45 | 1.68 | −0.25 |
High MICA antibody levels correlate with declining graft function
To evaluate if the intensity of MICA-Ab responses after transplantation bore clinical relevance for predicting transplant function, the intensity of MICA-Ab responses were correlated with a change in the calculated creatinine clearance using Schwartz equation over the next year (26, 27) (difference between the calculated creatinine clearance measured at the post-transplant sample time and the clearance measured 1 year after this sample time). There was significant positive correlation between the intensity of the antibody signal to MICA and decline in graft function over the subsequent year (r=0.73; p=0.0022) (Fig 2b). As HLA Class II antibodies were the only other clinical parameter that correlated with a subsequent decline in graft function (r=0.74; p= 0.0016), we next controlled for the clinical confounder of donor specific antibodies against HLA-Class II, and found that there was a persistent trend towards positive association between MICA antibody signal and a decline in graft function over the subsequent year (r=0.5, p=0.0873). This data suggests that MICA antibodies may have an independent impact on adverse graft outcomes. Interestingly, except MICA, none of the top 15 targets which are specific to the glomerulus showed a similar correlation with downstream graft function (Table 3).
Immunochemistry (IHC) to confirm compartment-specific location
As we wanted to confirm if the MICA antigen localizes specifically to the glomerulus, as predicted by integrated genomics, immunohistochemistry (IHC) was performed for the MICA antigen on normal kidney biopsies obtained from dissection of normal renal tissue from renal carcinomas. Additionally, we also performed IHC for the MICA antigen in rejecting and stable transplant biopsies (C4d+ and C4d−), to ascertain if the localization of the MICA antigen was similar to normal kidney.
Within normal and stable transplanted kidneys, cytoplasmic granular staining for MICA was observed solely in podocytes within glomeruli (Fig 3: Normal kidney). In acute rejection, in addition to the persisting glomerular staining, the infiltrating mononuclear lymphocytes also showed strong positive staining for MICA (Fig 3: AR kidney), as well as other known infiltrating cells in acute rejection, such as B lymphocytes (CD20+), cytotoxic T cells (CD8+) and scattered NK cells (CD56+). To accurately co-localize lymphocyte subsets with MICA positive lymphocytes, we attempted double staining using fluorescence in situ hybridization (FISH) probes for CD8, CD20 and MICA. Unfortunately, we were unsuccessful in obtaining a signal for MICA by FISH despite repeated measures; hence co-localization data for MICA and other infiltrating cell types is not currently available.
Fig 3. IHC staining on normal kidney, infiltrates, and cell types.
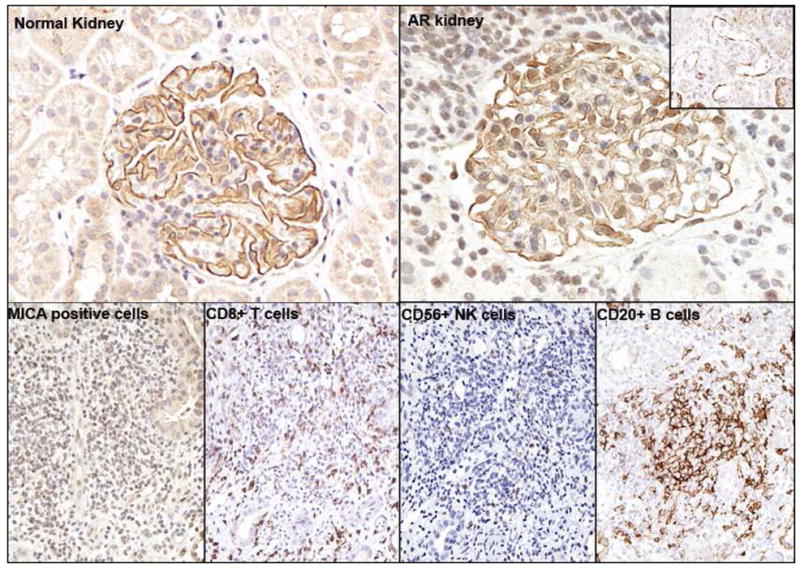
Normal kidney: IHC staining for MICA-Ab on 7 compartments from normal kidney tissue. Cytoplasmic staining is observed solely in the glomerulus podocyte for MICA.
AR kidney: The infiltrating mononuclear lymphocytes also showed strong positive staining for MICA in addition to positive staining in glomerular. Right upper corner: This biopsy is also seen to have focal staining of the peritubular capillaries (20%) and glomerular endothelial cells with C4d+.
The lower panel shows the lymphocytic infiltrates in acute rejection: Dense lymphocytic infiltrates in rejection stain positive for MICA+ cells, CD56+ NK cells, CD8+ T cells and CD20+ B cells.
DISCUSSION
Immune responses to non-HLA antibodies are becoming increasingly recognized as critical in the pathogenesis of organ allograft outcomes. Non-HLA antibody responses are receiving increasing interest in acute and chronic rejection and studies to determine specificity, affinity, and pathogenicity are ongoing to estimate their contribution. Recent studies suggest that an immune response against the MHC class I-chain related gene A or MICA may play a role in organ allograft rejection in some patients (28). MICA is a highly polymorphic, non classic MHC class I molecule constitutively expressed on the cell surface of epithelial and endothelial cells, and fibroblasts (7) (8), up-regulated in inflammation (29) and can elicit antibody production. It has been shown that kidney allografts undergoing both acute and chronic rejection can measure antibodies against MICA antigens (12, 13, 28, 30). MICA binds to the C-type lectin receptor, NKG2D, triggering the secretion of cytokines which enhance the response of CD4+T cells. This augmented reaction generates signals from the T cell to the B cell, triggering antibody production (31).
Our recently published study (1) demonstrated the integrated genomics approach which combined the analysis of ProtoArray data with gene expression microarray data. We used a data from this publication to evaluate the kidney compartment specificity of the MICA antigen. The methodology for integrative genomics initially uses a customized software program called AILUN (http://ailun.stanford.edu) (23) for re-annotating all protein and gene probes to the most recent NCBI gene identifiers. This creates an atlas of overlapping antigens (measured on the ProtoArray) and their matching genes, expressed in one of seven different compartments of the kidney (expression assessed on the cDNA gene expression platform; supplemental files also available at http://sarwal.stanford.edu/ProtoArray). Using this novel technology of integrative proto-genomics by integration of antibody, protein and RNA measurements (1) and immunohistochemistry for confirmation of antigen localization in the kidney, we can demonstrate, that MICA antigen was accurately predicted by this methodology to be selectively localized to normal kidney glomerulus. Immunohistochemistry established that the MICA antigen preferentially localizes to the glomerular podocytes. It is interesting to note that podocytes have immunomodualtory activities in renal injury (32), the podocyte localizes immunoregulatory molecules like toll like receptors (TLR) (33), and additionally, TLRs are known to up- regulate MICA expression (34). It has been demonstrated in vitro, that low surface expression of MICA on activated CD4+ T cells can be a safeguard mechanism to protect cells from resting NK cells, especially during T cell dependant infectious immunity, to allow for an efficient antigen elimination phase. It is thus possible that, based on in vitro studies (35), MICA expression on the podocyte in vivo, may be a means to resist NK cell-mediated nephrotoxicity. Thus, MICA expression in the normal kidney podocyte may actually be necessary for protection against infectious and inflammatory stimuli. In this study we demonstrate, for the first time, that de novo serological responses to the MICA antigen can be detected in almost 70% of patients after kidney transplantation, regardless of graft dysfunction or biopsy confirmed rejection. Thus the mere detection of MICA antibodies after renal transplantation does not appear to be pathogenic, and may be a result of increased expression of the MICA antigen in response to various inflammatory stimuli after transplantation.
Various cytokines, specifically IL2, IL4 and IL15 (9, 35), are known to further induce MICA expression on T lymphocytes in vitro. We show in this study, that during a rejection episode, where a cytokine storm is known to occur in the inflamed graft, MICA expression is induced in vivo on infiltrating lymphocytes. In this study, MICA-Ab levels track at much higher levels in humoral rejections, when compared to cellular rejections. Though the direct association between anti-HLA and anti-MICA antibodies remains unclear, they may be correlative mechanisms during acute humoral rejections, given the much stronger signal for MICA antibodies in patients with C4d+ acute rejection in this study. Anti-HLA antibodies, often seen during humoral rejection episodes, and correlative with the presence of peritubular C4d deposition in the graft (36), inhibit engagement of the inhibitory NK cell receptors (KIR2DLs, KIR3DLs), with resultant NK cell activation and T cell cytotoxicity. NKG2D is a receptor for MICA, detected on most T cells, and NK cells (37), may also be highly regulated during a humoral rejection episode. Engagement of MICA by antibodies has been previously shown to activate endothelial cells in vitro and induce a prothrombotic phenotype leading to vascular thrombosis and loss of graft function (38). This may be one mechanism for graft injury by MICA that may explain the correlation of MICA-Ab signal intensity after renal transplantation with progressive graft dysfunction. Another mechanism of chronic graft injury may relate to our finding of an association between MICA and anti-HLA Class II antibodies. As anti-class II Ab in turn have been correlated with development of chronic transplant glomerlopathy, it is not possible to dissect the independent pathogenic association between chronic glomerular injury, anti-HLA class II Ab and anti-MICA antibodies.
Thus, in conclusion, antibody responses are modulated to MICA after transplantation in patients, irrespective of graft rejection. MICA-Ab levels increase with humoral rejection episodes, but are not necessarily elevated in cellular rejection. Thus, rather than checking MICA-Ab levels cross-sectionally at the time of rejection, serial measurements of MICA-Ab levels may be more informative, with a significant increase in antibody titers likely to occur prior to and at the time of humoral rejection. Integrative genomics accurately predicted that MICA is a glomerular antigen, and the correlation of MICA-Ab with decline in graft function may relate to the development of progressive glomerular injury and transplant glomerulopathy with resultant chronic transplant dysfunction. Additional antibodies to different renal compartment antigens, discovered by this novel and unique integrative genomics approach (1), should be explored as potential biomarkers for serial tracking of different etiologies of graft dysfunction after organ transplantation.
Acknowledgments
We are grateful for the help from Drs. Maarten Naesens, Valeriya Zarkhin, and Atul Butte for discussion, Sue Hsieh, Hong Dai, and Dr. Poonam Sansanwal for MICA monoclonal antibody validation, and nephrology team for helping with clinical sample collection and processing, and data file management. MS and LL were partially funded by NIAID (R01 AI61739) for this study.
Abbreviations
- Ab
Antibody
- AR
Acute rejection
- ESRD
End Stage Renal Disease
- FDR
False discovery rate
- IHC
Immunohistochemistry
- MHC
Major histocompatibility complex
Footnotes
Author’s specific contribution:
- Participated in research design: Li Li, Minnie Sarwal
- Participated in the writing of the paper: Li Li, Abanti Chaudhuri, Rong Chen, Neeraja Kambham, Minnie Sarwal
- Participated in the performance of the research: Li Li, Amery Chen, Neeraja Kambham, Tara Sigdel, Rong Chen
- Contributed new reagents: Minnie Sarwal
- Participated in data analysis: Li Li
References
- 1.Li L, Wadia P, Chen R, et al. Identifying compartment-specific non-HLA targets after renal transplantation by integrating transcriptome and “antibodyome” measures. Proc Natl Acad Sci U S A. 2009;106 (11):4148. doi: 10.1073/pnas.0900563106. [DOI] [PMC free article] [PubMed] [Google Scholar]
- 2.Patel R, Terasaki PI. Significance of the positive crossmatch test in kidney transplantation. N Engl J Med. 1969;280 (14):735. doi: 10.1056/NEJM196904032801401. [DOI] [PubMed] [Google Scholar]
- 3.Sheldon S, Poulton K. HLA typing and its influence on organ transplantation. Methods Mol Biol. 2006;333:157. doi: 10.1385/1-59745-049-9:157. [DOI] [PubMed] [Google Scholar]
- 4.Sumitran-Karuppan S, Tyden G, Reinholt F, Berg U, Moller E. Hyperacute rejections of two consecutive renal allografts and early loss of the third transplant caused by non-HLA antibodies specific for endothelial cells. Transpl Immunol. 1997;5 (4):321. doi: 10.1016/s0966-3274(97)80016-0. [DOI] [PubMed] [Google Scholar]
- 5.Perrey C, Brenchley PE, Johnson RW, Martin S. An association between antibodies specific for endothelial cells and renal transplant failure. Transpl Immunol. 1998;6 (2):101. doi: 10.1016/s0966-3274(98)80024-5. [DOI] [PubMed] [Google Scholar]
- 6.Bahram S, Bresnahan M, Geraghty DE, Spies T. A second lineage of mammalian major histocompatibility complex class I genes. Proc Natl Acad Sci U S A. 1994;91 (14):6259. doi: 10.1073/pnas.91.14.6259. [DOI] [PMC free article] [PubMed] [Google Scholar]
- 7.Zwirner NW, Fernandez-Vina MA, Stastny P. MICA, a new polymorphic HLA-related antigen, is expressed mainly by keratinocytes, endothelial cells, and monocytes. Immunogenetics. 1998;47 (2):139. doi: 10.1007/s002510050339. [DOI] [PubMed] [Google Scholar]
- 8.Groh V, Bahram S, Bauer S, Herman A, Beauchamp M, Spies T. Cell stress-regulated human major histocompatibility complex class I gene expressed in gastrointestinal epithelium. Proc Natl Acad Sci U S A. 1996;93 (22):12445. doi: 10.1073/pnas.93.22.12445. [DOI] [PMC free article] [PubMed] [Google Scholar]
- 9.Molinero LL, Fuertes MB, Rabinovich GA, Fainboim L, Zwirner NW. Activation-induced expression of MICA on T lymphocytes involves engagement of CD3 and CD28. J Leukoc Biol. 2002;71 (5):791. [PubMed] [Google Scholar]
- 10.Terasaki PI, Ozawa M, Castro R. Four-year follow-up of a prospective trial of HLA and MICA antibodies on kidney graft survival. Am J Transplant. 2007;7 (2):408. doi: 10.1111/j.1600-6143.2006.01644.x. [DOI] [PubMed] [Google Scholar]
- 11.Suarez-Alvarez B, Lopez-Vazquez A, Gonzalez MZ, et al. The relationship of anti-MICA antibodies and MICA expression with heart allograft rejection. Am J Transplant. 2007;7 (7):1842. doi: 10.1111/j.1600-6143.2007.01838.x. [DOI] [PubMed] [Google Scholar]
- 12.Zou Y, Stastny P, Susal C, Dohler B, Opelz G. Antibodies against MICA antigens and kidney-transplant rejection. N Engl J Med. 2007;357 (13):1293. doi: 10.1056/NEJMoa067160. [DOI] [PubMed] [Google Scholar]
- 13.Amezaga N, Crespo M, Lopez-Cobos M, et al. Relevance of MICA antibodies in acute humoral rejection in renal transplant patients. Transpl Immunol. 2006;17 (1):39. doi: 10.1016/j.trim.2006.09.016. [DOI] [PubMed] [Google Scholar]
- 14.Racusen LC, Solez K, Colvin RB, et al. The Banff 97 working classification of renal allograft pathology. Kidney Int. 1999;55 (2):713. doi: 10.1046/j.1523-1755.1999.00299.x. [DOI] [PubMed] [Google Scholar]
- 15.Racusen LC, Halloran PF, Solez K. Banff 2003 meeting report: new diagnostic insights and standards. Am J Transplant. 2004;4 (10):1562. doi: 10.1111/j.1600-6143.2004.00585.x. [DOI] [PubMed] [Google Scholar]
- 16.Solez K, Colvin RB, Racusen LC, et al. Banff 07 classification of renal allograft pathology: updates and future directions. Am J Transplant. 2008;8 (4):753. doi: 10.1111/j.1600-6143.2008.02159.x. [DOI] [PubMed] [Google Scholar]
- 17.Jianghua C, Wenqing X, Huiping W, Juan J, Jianyong W, Qiang H. C4d as a significant predictor for humoral rejection in renal allografts. Clin Transplant. 2005;19 (6):785. doi: 10.1111/j.1399-0012.2005.00422.x. [DOI] [PubMed] [Google Scholar]
- 18.Vargha R, Mueller T, Arbeiter K, et al. C4d in pediatric renal allograft biopsies: a marker for negative outcome in steroid-resistant rejection. Pediatr Transplant. 2006;10 (4):449. doi: 10.1111/j.1399-3046.2006.00492.x. [DOI] [PubMed] [Google Scholar]
- 19.Crespo M, Pascual M, Tolkoff-Rubin N, et al. Acute humoral rejection in renal allograft recipients: I. Incidence, serology and clinical characteristics. Transplantation. 2001;71 (5):652. doi: 10.1097/00007890-200103150-00013. [DOI] [PubMed] [Google Scholar]
- 20.Mauiyyedi S, Crespo M, Collins AB, et al. Acute humoral rejection in kidney transplantation: II. Morphology, immunopathology, and pathologic classification. J Am Soc Nephrol. 2002;13 (3):779. doi: 10.1681/ASN.V133779. [DOI] [PubMed] [Google Scholar]
- 21.Perez-Iratxeta C, Andrade MA. Inconsistencies over time in 5% of NetAffx probe-to-gene annotations. BMC Bioinformatics. 2005;6:183. doi: 10.1186/1471-2105-6-183. [DOI] [PMC free article] [PubMed] [Google Scholar]
- 22.Dai M, Wang P, Boyd AD, et al. Evolving gene/transcript definitions significantly alter the interpretation of GeneChip data. Nucleic Acids Res. 2005;33 (20):e175. doi: 10.1093/nar/gni179. [DOI] [PMC free article] [PubMed] [Google Scholar]
- 23.Chen R, Li L, Butte AJ. AILUN: reannotating gene expression data automatically. Nat Methods. 2007;4 (11):879. doi: 10.1038/nmeth1107-879. [DOI] [PMC free article] [PubMed] [Google Scholar]
- 24.Higgins JP, Wang L, Kambham N, et al. Gene expression in the normal adult human kidney assessed by complementary DNA microarray. Mol Biol Cell. 2004;15 (2):649. doi: 10.1091/mbc.E03-06-0432. [DOI] [PMC free article] [PubMed] [Google Scholar]
- 25.Tusher VG, Tibshirani R, Chu G. Significance analysis of microarrays applied to the ionizing radiation response. Proc Natl Acad Sci U S A. 2001;98 (9):5116. doi: 10.1073/pnas.091062498. [DOI] [PMC free article] [PubMed] [Google Scholar]
- 26.Schwartz GJ, Haycock GB, Edelmann CM, Jr, Spitzer A. A simple estimate of glomerular filtration rate in children derived from body length and plasma creatinine. Pediatrics. 1976;58 (2):259. [PubMed] [Google Scholar]
- 27.Schwartz GJ, Feld LG, Langford DJ. A simple estimate of glomerular filtration rate in full-term infants during the first year of life. J Pediatr. 1984;104 (6):849. doi: 10.1016/s0022-3476(84)80479-5. [DOI] [PubMed] [Google Scholar]
- 28.Zwirner NW, Marcos CY, Mirbaha F, Zou Y, Stastny P. Identification of MICA as a new polymorphic alloantigen recognized by antibodies in sera of organ transplant recipients. Hum Immunol. 2000;61 (9):917. doi: 10.1016/s0198-8859(00)00162-2. [DOI] [PubMed] [Google Scholar]
- 29.Stephens HA. MICA and MICB genes: can the enigma of their polymorphism be resolved? Trends Immunol. 2001;22 (7):378. doi: 10.1016/s1471-4906(01)01960-3. [DOI] [PubMed] [Google Scholar]
- 30.Mizutani K, Terasaki P, Bignon JD, et al. Association of kidney transplant failure and antibodies against MICA. Hum Immunol. 2006;67 (9):683. doi: 10.1016/j.humimm.2006.06.002. [DOI] [PubMed] [Google Scholar]
- 31.Stastny P. Introduction: MICA/MICB in innate immunity, adaptive immunity, autoimmunity, cancer, and in the immune response to transplants. Hum Immunol. 2006;67 (3):141. doi: 10.1016/j.humimm.2006.02.019. [DOI] [PubMed] [Google Scholar]
- 32.Reiser J, von Gersdorff G, Loos M, et al. Induction of B7-1 in podocytes is associated with nephrotic syndrome. J Clin Invest. 2004;113 (10):1390. doi: 10.1172/JCI20402. [DOI] [PMC free article] [PubMed] [Google Scholar]
- 33.Banas MC, Banas B, Hudkins KL, et al. TLR4 links podocytes with the innate immune system to mediate glomerular injury. J Am Soc Nephrol. 2008;19 (4):704. doi: 10.1681/ASN.2007040395. [DOI] [PMC free article] [PubMed] [Google Scholar]
- 34.Kloss M, Decker P, Baltz KM, et al. Interaction of monocytes with NK cells upon Toll-like receptor-induced expression of the NKG2D ligand MICA. J Immunol. 2008;181 (10):6711. doi: 10.4049/jimmunol.181.10.6711. [DOI] [PubMed] [Google Scholar]
- 35.Molinero LL, Domaica CI, Fuertes MB, Girart MV, Rossi LE, Zwirner NW. Intracellular expression of MICA in activated CD4 T lymphocytes and protection from NK cell-mediated MICA-dependent cytotoxicity. Hum Immunol. 2006;67 (3):170. doi: 10.1016/j.humimm.2006.02.010. [DOI] [PubMed] [Google Scholar]
- 36.Michaels PJ, Fishbein MC, Colvin RB. Humoral rejection of human organ transplants. Springer Semin Immunopathol. 2003;25 (2):119. doi: 10.1007/s00281-003-0139-x. [DOI] [PubMed] [Google Scholar]
- 37.Bauer S, Groh V, Wu J, et al. Activation of NK cells and T cells by NKG2D, a receptor for stress-inducible MICA. Science. 1999;285 (5428):727. doi: 10.1126/science.285.5428.727. [DOI] [PubMed] [Google Scholar]
- 38.Eric J, Lepin EFR. Complement-independent mechanisms of antigraft antibodies in transplant arteriosclerosis and accommodation current opinion in organ transplant. 2004;9:10. [Google Scholar]