Abstract
Antimicrobial peptides (AMPs), important effector molecules of the innate immune system, also provide templates for designing novel antibiotics. Protegrin, an especially potent AMP found in porcine leukocytes, was recently shown to form octameric transmembrane pores. We have employed a combination of experiments and models spanning length scales from the atomistic to the cellular level in order to elucidate the microbicidal mechanism of protegrin. Comparison of the modeling and experimental data suggests that approximately 10–100 protegrin pores are necessary to explain the observed rates of potassium leakage and E. coli death in exponential phase bacteria. The kinetics of viability loss suggest that bacterial death results largely from uncontrolled ion exchange processes and decay of transmembrane potential. However, ion exchange processes alone cannot account for the experimentally observed cell swelling and osmotic lysis - a redundant “overkill” mechanism most likely to occur in locales with high protegrin concentrations. Although our study is limited to protegrin and E. coli, the timeline of events described herein is likely shared by other AMPs that act primarily by permeabilizing microbial membranes. This work provides many of the missing links in describing antimicrobial action, as well providing a quantitative connection between several previous experimental and simulation studies of protegrin.
Introduction
Antimicrobial peptides (AMPs) are small, naturally-occurring proteins that exhibit a broad range of activity against bacteria and other pathogens [1, 2]. Although some bacterial resistance to AMPs has been reported [3], they have remained effective antibacterial agents despite their ancient and widespread deployment in nature [1]. This has spurred extensive research efforts to develop AMP-based therapeutic antibiotics as a lasting solution to the growing problem of antibiotic resistance. However, these efforts have been largely hampered by a lack of understanding of the fundamental mechanism of AMP action. It has been suggested that AMPs act primarily by disrupting the bacterial cell membrane, although recent evidence indicates that intracellular targets may also play a key role in the bacterial killing mechanism of many peptides [2, 4–6]. In the present work, we limit our investigations to protegrin-1, a broad-spectrum, β-sheet, cationic peptide derived from porcine leukocytes [7], for which the balance of evidence strongly suggests a membrane-active mechanism. We have selected this particular peptide as a model for AMP action due to its strong therapeutic potential as well as the wealth of available biophysical data pertaining to protegrin and its derivatives.
Protegrins are characterized by a beta-hairpin conformation that is held together by two cysteine-cysteine disulfide bonds. They contain 18 amino acids, and are highly cationic (charge of +7) at physiological pH. The simple structure and broad spectrum of activity of protegrins has led to their pharmaceutical development as agents to prevent oral mucositis [8–10] and ventillator-associated pneumonia [11]. The solution structure of monomeric PG-1 (NH2-RGGRLCYCRRRFCVCVGR-amide), the most prevalent natural form of protegrin, has been elucidated by NMR [12]. Recently, Mani and coworkers conducted solid-state NMR experiments that led them to hypothesize that protegrins form octameric, membrane-spanning pore stuctures in anionic lipid bilayers [13]. Molecular dynamics simulations performed by Langham and coworkers [14] confirmed the stability of such pores. Previously, we used structures extracted from these simulations as input to an electrodiffusion model in order to quantify the conductance characteristics of the PG-1 pore [15], and obtained good agreement with experimental data [16]. We have also modeled protegrin and numerous of its analogues in various environments that mimic bacterial membranes in order to decipher the mechanism of interaction between protegrin peptides and membranes[17–23]. Despite all accumulating information there remains a gap in the empirical content required to explain in quantitative, mechanistic terms how exactly protegrin kills bacteria.
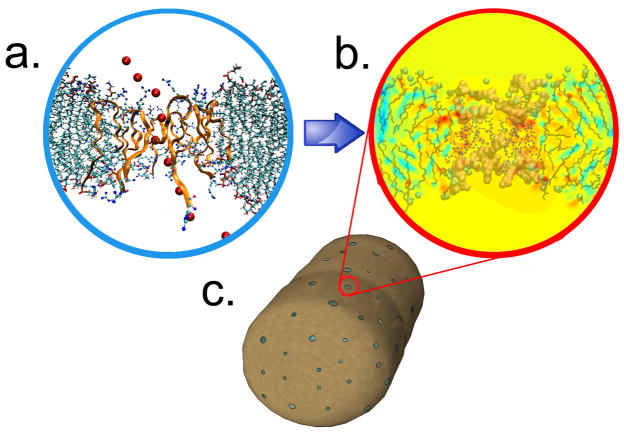
In the present study, we employ a combination of experimental and theoretical techniques to investigate the effect of protegrin pore formation on E. coli cultures. We investigate how molecular level events result in antimicrobial function, focusing in particular on potassium efflux from a bacterial cell, transmembrane potential decay and cell volume changes. While many authors have suggested that membrane permeabilization by AMPs is an important part of the bacterial killing mechanism [1, 4, 24], the highly coupled effects of such permeabilization have not been quantified. Furthermore, no attempts have been made that we are aware of to establish a quantitative link between molecular knowledge of AMP structure and physiological effects measured on whole bacteria. The multiscale approach that we have employed is illustrated graphically in figure 1, and is described in greater detail in the Methods section.
Figure 1.
The multiscale modeling approach. Atomistic molecular dynamics simulations (panel A) provide the high-resolutions structures and charge distributions needed for continuum, nonequilibrium electrodiffusion modeling of the protegrin pore (panel B). Ion permeabilities are calculated based on these results, and transient ion transport is modeled for entire bacterial cells (panel C), allowing us to estimate the total number of pores.
Methods and Materials
Experimental
Synthetic PG-1 (RGGRLCYCRRRFCVCVGR-amide), ~96.5% pure, was purchased from the SynPep Corporation (Dublin, CA), diSC3-5 (3,5-dipropylthiacarbocyanine) was purchased from Molecular Probes (Eugene, OR) and diisodecyl phthalate and dibutyl phthalate were purchased from Pfaltz and Bauer (Waterbury, CT) and from Eastman Kodak (Rochester, NY), respectively. All other chemicals were purchased from Sigma. E. coli strain ML-35p [25, 26] was used in all experiments. Light scattering assays were performed in 96 well, flat-bottom polystyrene tissue culture plates, with a final volume of 200 μL/well. In all cases, peptide or an equal volume of buffer was added to washed E. coli, final concentration of 108 colony-forming units (CFU)/ml, in a solution that contained 100 mM NaCl and 10 mM sodium phosphate (pH 7.4). Optical density measurements at 350 nm were taken every 6 seconds with a SpectraMax 250 spectrophotometer (Molecular Devices, Sunnyvale, CA). Unless otherwise noted, all experiments were performed at 37°C.
Colony count assays were performed to determine the effects of protegrin on bacterial viability. E. coli ML-35p cells were washed with buffer and incubated at 37 °C for 10 minutes with the desired concentration of protegrin or an equivalent volume of buffer. Aliquots were removed at intervals, and subjected to two sequential 100-fold serial dilutions with protegrin-free incubation medium. After further 1:50 dilution into 5 ml of a 43 °C solution of 1 % agarose in 100 mM NaCl, 10 mM sodium phosphate and 1% trypticase soy broth, the entire 5 ml sample was poured over a conventional trypticase soy agar underlay, and colonies in the overlay were counted after an overnight incubation.
A previously described procedure [27] was used to monitor potassium loss from E. coli ML 35p cells. In brief, a potassium-selective electrode was used to monitor the conductance of a solution containing 108 CFU/mL in the medium described above and suspended in a 250μL incubation tube. The K+ concentration was recorded every second. The total bacterial K+ content (cK+,total) was measured after subjecting the bacteria to prolonged (3 min) sonication. All data are reported as the percent of the total K+ released.
The relative transmembrane potential decay was measured using a general procedure recently described by Wu et al [28] using a self-quenching fluorescent dye, diSC3-5. Cells were incubated with 0.4 μM diSC3-5 for 30 minutes in the same buffer described above. After the fluorescence had stabilized at about 10% of its initial value, PG-1 (final concentration, 25 μg/ml) or its vehicle was added and fluorescence was monitored every 8 seconds using excitation and emission wavelengths of 622 and 670 nm, respectively.
Transmission electron microscopy (TEM) was carried out to inspect the effects of protegrin on E. coli ML-35p. Bacteria were washed twice in the usual buffer and then incubated at a concentration of 108 CFU/mL with a PG-1 concentration of 25 μg/mL. The organisms were fixed by adding fresh glutaraldehyde (2% final concentration) and allowed to adhere to mixed cellulose ester membrane filters (Millipore VCWP01300) for 20 minutes. The glutaraldehyde-fixed samples were then washed in phosphate buffered saline, postfixed in 1% osmium tetroxide for 45 minutes at room temperature, dehydrated through ethanol in propylene oxide, embedded in Epon 812 (Electron Microscopy Services, Hatfield, PA), thin-sectioned, and stained with uranyl acetate and lead citrate. Transmission electron microscopy was performed at the Electron Microscopy Core Facility of the UCLA School of Medicine, with a JEOL CX II instrument
Modeling
The model system consists of a representative bacterial cell separated from the bathing solution by a thin membrane region. The volume of the entire system, bacterium and bath, is set to a constant value of 10−14 m3, based on experimental conditions. Since diffusion of ions is limited by the membrane, the two compartments can both be considered well-mixed volumes. Mass balances on the diffusing ionic species and a volume balance yield the following set of ordinary differential equations:
| [1] |
| [2] |
where ni is the number of moles of species i inside the cell, ji is the flux of species i, JV is the volume flux, A is the cell membrane area and Vaq is the cell aqueous volume.
The volume flux is driven by the pressure difference and the osmotic pressure difference across the membrane [29]:
| [3] |
Here, LP is the membrane hydraulic permeability, ΔP = P outside − P inside is the pressure difference across the membrane, R is the gas constant, T is the temperature, σi is the reflection coefficient (a measure of the membrane ideality; (see [29, 30]), and represent the concentration of ionic species i outside and inside of the cell, respectively, and cf represents the concentration of osmotically active but impermeable solutes present in the cell interior. The summation is over the three ionic species considered, namely K+, Na+ and Cl−. The model assumes that these are the only relevant osmolytes that cross the cell membrane as a result of PG-1 permeabilization. Intracellular osmolytes such as nucleic acids and proteins that do not readily cross the membrane are accounted for by the term cf. Assuming that 30% of the total bacterial volume consists of solids, the total cell volume is found according to:
| [4] |
where Vaq is the aqueous cell volume.
To calculate the ion fluxes, we have used the integrated form of the Nernst-Planck equation under the assumption of a constant field [31]:
| [5] |
where ji is the ion flux in mol/m2/s, qi is the ion charge, Pi is the (effective) ion permeability, and , where V is the value of the electrostatic potential in the cell interior and F is Faraday’s constant. We have also added an active potassium uptake term based on available kinetic data for the four main K+ uptake systems (Kdp, TrkA, TrkD and TrkF) [32]:
| [6] |
The kinetic parameters Vmax and Km for all three uptake systems were obtained from the work of Rhoads et al [32].
The transmembrane potential is found by imposing a zero-current restriction (required to maintain bath electroneutrality in both the cell interior and the surrounding bath):
| [7] |
Due to the active K+ uptake terms, equation [7] is solved numerically at each time step to obtain V.
The pressure difference across the membrane, P, is calculated as a simple linear relation with the volume:
| [8] |
where ΔP0 is the initial pressure difference across the membrane, m is an effective volume modulus, Vc is the cell volume, and Vc,0 is the initial cell volume. Although the mechanics of the peptidoglycan sacculus are known to be much more complex [33–35], this particular approximation is sufficient for the present model, and has been employed by other authors in similar modeling [36].
Ion permeabilities, Pi
In order to estimate the permeabilities of ions through the bacterial membrane region (Pi in equation [5]), it is assumed that the most significant resistance to ion diffusion arises from the inner cytoplasmic membrane. Permeabilities are calculated assuming parallel passive diffusion through pores and the bilayer region:
| [9] |
Here, χ is the fraction of the membrane area covered by protegrin pores. It is related to the number of pores, Npores, according to: χ = Npores*Apore/Acell, where Apore is the total area of the membrane that can be designated as being occupied by the pore This was estimated to be 1120 Å2 according to structures extracted from the molecular dynamics simulations of Langham et al [14].
The effective permeabilities of ions through the pore, Pi,pore, are estimated based on the numerical solution of the 3D Poisson-Nernst-Planck (PNP) equations for the structure of a single protegrin pore embedded in an anionic lipid bilayer. The details of this work, as well as the molecular dynamics simulations from which the structures were extracted, have been discussed elsewhere [14, 15]. The total flow rate of each ion through the pore, ni, was calculated from the 3D PNP solution and substituted in the integrated 1-D Nernst-Planck equation to obtain the effective ionic permeabilities:
| [10] |
The boundary concentrations of a particular species, and , are the boundary conditions used at the top and bottom of the pore in the 3D PNP model, while the transmembrane potential V corresponds to the boundary value of the electrostatic potential. The 3D-PNP model was originally solved only for potassium and chloride ions. Since the only distinction in the 3D-PNP model between potassium and sodium is the diffusion coefficient, the calculations were not repeated for sodium. Instead, the permeability of sodium (PNa+,pore) was calculated by scaling the permeability of the potassium ion with the ratio of the diffusion coefficients of Na+ and K+.
The permeabilities of ions through the bilayer region, Pi,bilayer, were estimated based on literature values [37, 38]. For K+, this corresponds to approximately 3.0*10−14 m/s, for Na+ 1.0*10−13 m/s, and for Cl− 2.3*10−11 m/s.
Hydraulic permeability, LP
As in the case of the ion permeabilities, the hydraulic permeability is calculated on the assumption of parallel flow through the pore and bilayer regions of the membrane.
| [11] |
The hydraulic permeability through the pore, LP, pore, was calculated based on three-dimensional pore structures obtained from the molecular dynamics simulations of Langham and coworkers [14], assuming Poisseuille flow in series along the pore axis [39, 40]. Values of LP,pore obtained this way do not vary significantly with the pore structure used; a typical value, which was used for all subsequent calculations, was 4.1*10−9 m3/N/s. Literature values for the value of LP, bilayer range significantly depending on the type of bilayer used in the measurements [37, 40]. We have used a value of LP=7.0*10−14 m3/N/s, well within the range of the relevant literature values.
Initial conditions and other parameters
The initial aqueous cell volume, Vaq,t=0, was set to a value of 4.18*10−18 m3, based on the mean volume of cellular water measured in exponential-phase E. coli using 3H2O measurements. Similarly, the initial K+ intracellular concentration was set to 137.9 mM, based on the total concentration of K+ measured after sonication of a 108 CFU/mL bacterial suspension. The initial concentrations of Na+ and Cl− in the cell interior were set to 6mM and 5mM respectively, based on values obtained from the CyberCell Database [41]. The initial pressure difference across the bacterial cell wall was taken to be 4 bar [41, 42]. The effective volume modulus of the bacterial envelope, m in equation [8], was taken to be 9 bars. [42]. The parameter cf was set so that the initial conditions yield an osmotic equilibrium. The values of all reflection coefficients σi were set to unity. This is justified because the vast majority of the membrane (the lipid bilayer region) is practically impermeable to ions.
Results
Ion diffusion and potassium release
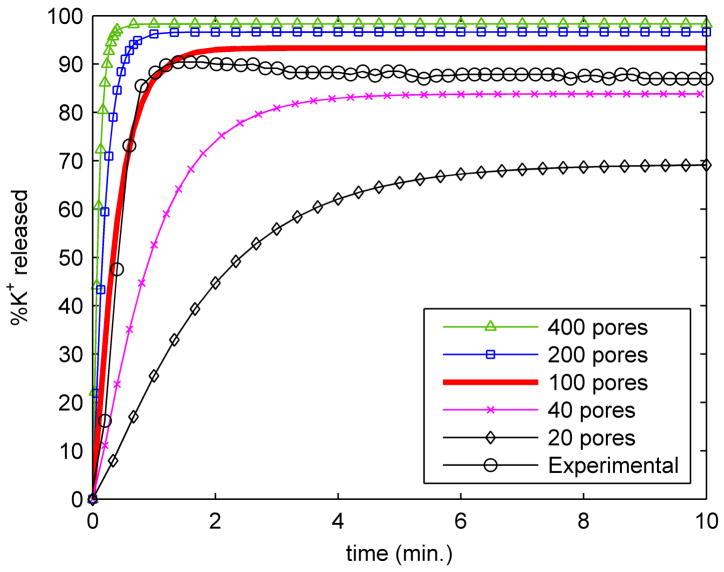
Exposure of bacteria to 25 μg/ml of PG-1 caused a rapid release of potassium from exponential phase E. coli (Fig. 2). As shown, potassium release began within a few seconds and continued until about 90% of the total bacterial K+ was lost. The K+ release curve for exponential phase bacteria can be closely matched by the model by setting the number of protegrin pores to approximately 100. It should be noted that these and all other values of the number of pores mentioned always represent an effective, average number of open pores. In reality, the pores are transient structures that likely form and collapse frequently on the timescale of the experimental observations. The data in figure 2 correspond to a typical choice of ion permeabilities through pores obtained based on the 3D-PNP calculations (PK+,pore=3.06*10−4, PNa+,pore=2.34*10−4, PCl−,pore=0.0906 m/s), as described in the Methods section. Although some variation exists in these parameters depending on the bath boundary concentrations and the particular snap shot from the molecular dynamics simulations that is used to obtain the atomistic pore structure, the results are not substantially affected. The variation in the number of pores is between 40 and 200 in the case of exponential-phase organisms for all of the 3D-PNP conditions and structures tested.
Figure 2.
Potassium release curves for exponential E. coli. The figure shows release curves obtained from the model for several values of the number of pores, along with the experimental data.
Both the experiment with exponential phase bacteria and the model show a plateau in the K+ release curve after approximately 90% of the bacterial K+ has been released (fig. 2), less than two minutes after protegrin treatment. In the model, this plateau occurs due to the existence of the active uptake mechanisms (see equation [6]). As K+ is released, the driving force for flux out of the cell diminishes, and eventually the K+ uptake mechanisms are able to match the outward electrodiffusive flux of K+, corresponding to the observed steady state concentration values. Since the electrodiffusive flux takes place primarily through the pores, the height of the plateau decreases with a decreasing number of pores.
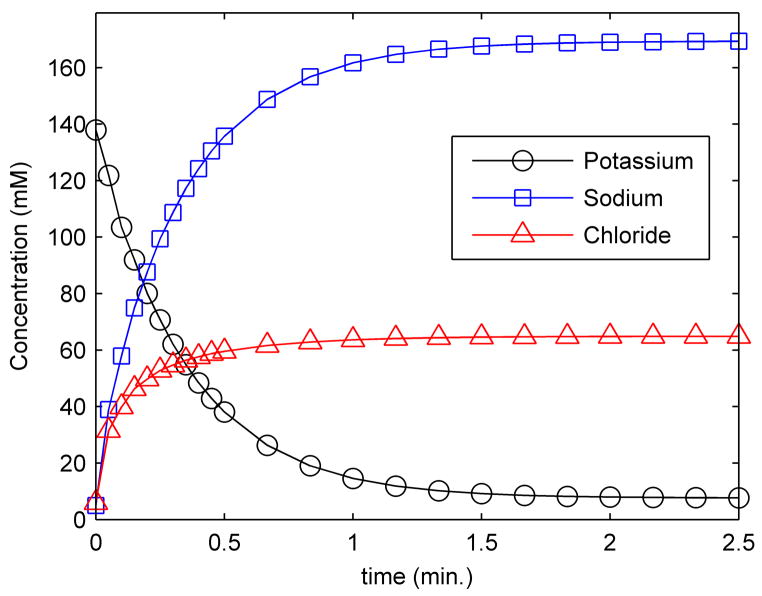
In addition to the percentage of potassium released, the model offers the possibility of monitoring the interior concentration of the other diffusing ions, namely sodium and chloride. Figure 3 shows the cytoplasmic concentration of all three ionic species as a function of time. The data shown correspond to the typical ion permeabilities already mentioned and 100 pores (Npores = 100). As potassium leaks from the cytoplasmic interior, sodium and chloride enter the cell from the higher concentration exterior environment. Interestingly, sodium accumulates inside the cell to a higher concentration than the 110 mM exterior sodium concentration. This is because the zero-current condition (equation [7]) requires the baths to remain at a constant total charge. Since the baths must be neutral, this further implies that a non-permeating, negatively charged species exists in the cytoplasm to achieve electroneutrality of the cell interior for the given initial conditions. This anionic species corresponds to the cumulative negative charges of proteins, nucleic acids and small organic molecules. As sodium replaces the potassium that is released, it also enters alongside the chloride ions that are driven into the cell by concentration gradients. The implications of a high concentration of sodium in the cell interior could be significant, as sodium is known to compete with potassium for many enzyme binding sites involved in vital metabolic processes [43, 44].
Figure 3. Intracellular ion concentrations.
A value of 100 pores was used for the above data, corresponding to K+ release kinetics observed in exponential phase bacteria.
Transmembrane potential
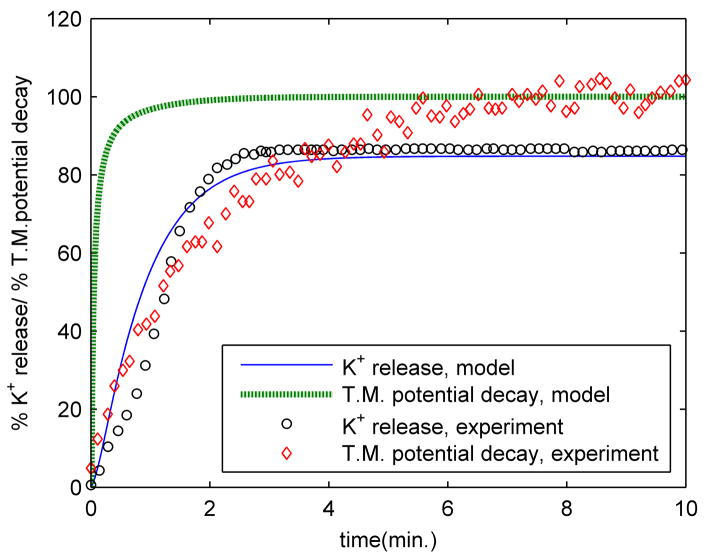
The relative fluorescence of diSC3-5 measured after treatment of exponential phase E. coli with 25 μg/mL of PG-1 is shown in figure 4, along with the corresponding K+ release curve. The equivalent results obtained from the model are shown alongside the experimental data; the number of pores was adjusted to 43 in order to reproduce the slower K+ release observed in this particular experiment. The transmembrane potential change is scaled as a percentage of complete depolarization, based on the initial value and the steady state value obtained at long times. As expected, the permeabilization of the membrane by PG-1 allows ions to exchange freely, thereby upsetting the concentration gradients across the bacterial membrane that contribute to the transmembrane potential. The higher rate of transmembrane potential decay observed in the model as compared to the experiments could be partially explained by the delay associated with the diffusion of diSC3-5 in response to changes in the transmembrane potential, whereas the model provides direct and instantaneous transmembrane potential data. In the model, the transmembrane potential initially has a value of approximately −75 mV (cell interior negative), and decays to a value of around −12 mV at steady state. These values are well within range of physiologically relevant potentials measured in bacteria (commonly between −130 and −150 mV) [3]. The nonzero value obtained for the steady-state transmembrane voltage results from the Donnan equilibrium associated with the implicit presence of a nonpermeating, anionic species in the cell interior (see discussion above near the end of the ‘Ion diffusion and potassium release’ section), which is required to maintain bath electroneutrality for the given initial conditions.
Figure 4.
Comparison of potassium release and transmembrane potential decay between model and experiment. Experimental measurements were carried out on exponential phase E. coli. The experimental transmembrane potential decay data corresponds to the relative fluorescence of diSC3-5 observed. The model data corresponds to setting the number of pores to 43 in order to match the K+ release data for this particular experiment.
Light scattering and volume changes
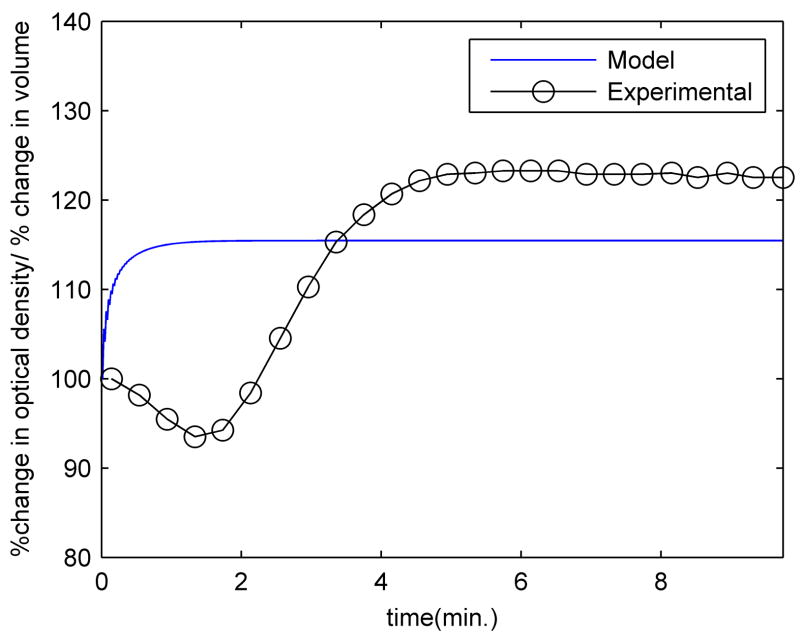
The time-dependent cell volume calculated from the model is shown in figure 5 along with the experimental light scattering data for exponential phase organisms. All values are scaled as a percent change from the initial values, which correspond to untreated bacteria. The number of pores was set to achieve the best agreement with the experimental K+ release (100 pores). With the parameter choices described in the Methods and Materials section, the trend of an initial decrease followed by a subsequent increase in volume is not reproduced well. The model shows a rapid increase in cell volume that occurs sooner than the measured increases in optical density.
Figure 5.
Optical density measurements and calculated volume changes for exponential phase E. coli The computed volume changes correspond to setting the number of pores to 100. All data are shown as a percent change from the initial value.
The volume behaviour in the model is caused by an osmotic imbalance that results from ion transport. Although potassium leaks out of the cell, sodium and chloride enter it in larger quantities, increasing the osmolarity of the cell interior, thereby providing a strong driving force for water influx. Due to the relatively high permeability of the cell membrane, water enters the cell very quickly in response to this osmolarity change, resulting in a sharp increase in the cell volume. As water flows into the cell, it dilutes its contents and increases the hydrostatic pressure, thereby reducing the driving force for osmotic water influx. An osmotic equilibrium and an equilibrated cell volume are reached shortly after ion diffusion ceases. Since the response to osmolarity changes is very fast, the slow volume changes observed cannot be a delayed response to osmolarity changes caused by ions, but must be the result of the transport of other osmolytes. Experiments aimed at measuring the kinetics of volume changes in E. coli [45, 46] and in Saccharomyces cerevisiae [47] in response to changes in external medium osmolarity suggest a time scale for volume changes on the order of milliseconds to seconds. As such, the time scale of light scattering changes (and presumably volume changes) observed in the present experiments cannot be a delayed response to changes in ion concentrations, since ion equilibrium is attained well before the volume has stopped changing.
Considering the ambiguities involved in relating light scattering data to volume changes, as well as the simplifying assumption made in the model that K+, Na+ and Cl− are the only relevant permeating osmolytes, the inconsistencies between the experiment and the model in this area are not surprising. Very likely, bacteria are able to adopt several additional strategies to regulate their volume, such as the release of other small molecules (e.g. glycine betaine, glutamate, trehalose, and proline), synthesis of additional osmolytes [48], and active transport of ions [49]. Despite these shortcomings in the model, one notable result that emerges from both the experiments and the model is that exposure to protegrin ultimately causes a significant increase in bacterial volume, which could very well compromise the structural integrity of the sacculus and lead to osmotic lysing of the bacteria. This in turn could be an integral part of the mechanism of action of protegrin-1, as well as other pore-forming antimicrobial peptides.
Bacterial viability loss
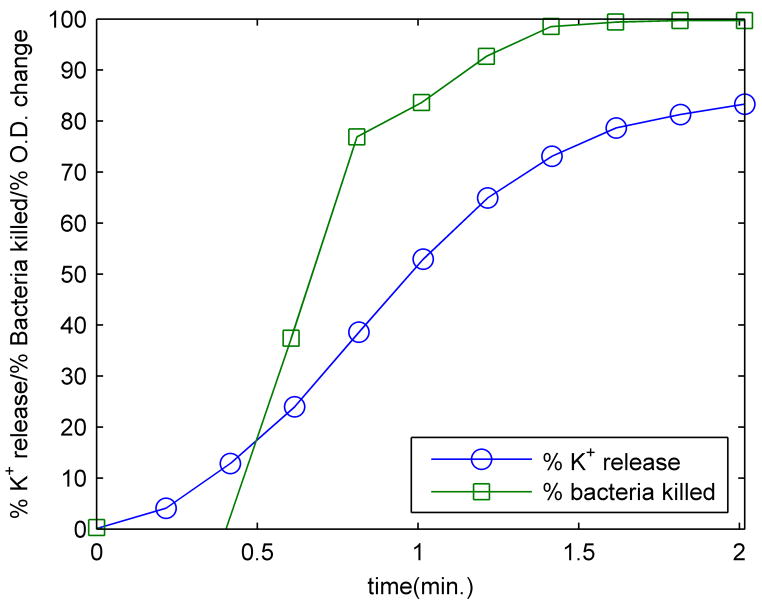
The viability of bacteria was determined by extracting aliquots from each experiment at different times and performing colony counts after overnight incubation. The percentage of bacteria killed after different exposure times and the K+ release curve are shown for exponential phase bacteria treated with 25 μg/mL of PG-1 at 23°C in Figure 6.
Figure 6.
Concurrent measurements of potassium release and bacterial viability for exponential phase E. coli.
The figures show the bacterial killing kinetics to be similar to the potassium release kinetics, which have been shown above to be concurrent with transmembrane potential decay. This does not necessarily imply that potassium release or membrane depolarization are sufficient to cause cell death; ionophores such as valinomycin can cause complete membrane depolarization that effectively ‘stuns’ bacteria but does not kill them - once the valinomycin is removed, the transmembrane potential is reestablished, and bacteria remain viable [28]. Nonetheless, the rapid loss of potassium accompanied by the increase in intracellular sodium concentrations could have a strong contribution to cell death, as the exchange of potassium for sodium is likely to inhibit numerous metabolic functions. At the same time, the loss of the transmembrane potential will severely compromise normal membrane function. Although the light scattering data were collected in a different experiment (Fig. 5), they do not appear to have a clear relationship to the bacterial killing kinetics. Since most of the bacteria are rendered nonviable well before the experimentally observed rise in light scattering, any osmotic lysing that occurs due to cell volume expansion represents an overkill mechanism. Given the regenerative abilities of many bacterial species, this aspect of the killing mechanism of PG-1 may prove useful to the host.
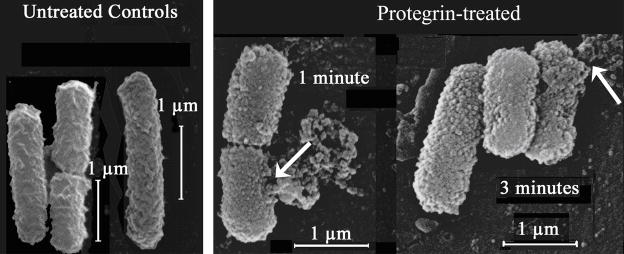
The effects of a large volume increase on bacterial cells are seen most dramatically in microscopy images of PG-1 treated bacteria. Figure 7 shows transmission electron microscopy images of E. coli strain ML-35p after several minutes of exposure to PG-1 at a concentration of 25 μg/mL PG-1. A rupture in the outer envelope of the organism in figure 7 leads to extrusion of the cellular membrane through the cell wall, followed by massive leakage of cell contents.
Figure 7.
Transmission electron microscopy images of E. coli treated with 25 μg/mL of PG-1 The arrows in panels A and B point to rupture sites in the bacterial membrane, where the cellular membrane along with intracellular contents are being extruded.
Discussion
Both the experiments and models suggest that even a relatively small degree of bacterial membrane permeabilization by protegrin can cause rapid potassium leakage and decay of the transmembrane potential. The model presented herein uses as input the ion permeabilities from a numerical study of the three-dimensional electrodiffusion through an octameric pore structure, which in turn is based on a molecular dynamics study of the protegrin pore. According to the present results, we estimate that the number of protegrin pores required to reproduce the experimentally measured K+ release curve is around 100 for exponential-phase bacteria. It should be noted once again that these numbers represent the average, apparent number of fully formed, open pores, rather than the number of pores or membrane-bound protegrin molecules at any particular instance. Not surprisingly, the decay of the transmembrane potential occurs in parallel with the potassium release and sodium influx, a trend that is observed both experimentally and in the model.
Although it is difficult to ascertain a clear relationship between light scattering and bacterial volume changes, the light scattering data presented herein indicate that in many cases, the volume decreases initially, and increases following the plateau in the K+ release. This behaviour is not well captured by the model, suggesting that osmolytes other than the three ions considered here are involved. Nevertheless, both the model and the experiments suggest that sufficiently high concentrations of PG-1 cause a significant volume increase, which leads to catastrophic membrane rupture, as observed by electron microscopy. Comparing the light scattering data to the kinetics of bacterial killing, it appears that the optical density rise is not directly linked to any causes of death, but rather represents an effect of bacterial killing by protegrin. The cause of death, although not conclusive from the present study, coincides with, and may well be a direct result of concurrent potassium release, sodium influx and transmembrane potential decay. As the result of this damage unfolds, the bacterial volume expands, leading to membrane rupture at sufficiently high PG-1 concentrations.
It appears that osmotic lysing by protegrin is not merely a consequence of bacterial death, but rather a characteristic behaviour that occurs at high concentrations of PG-1. This therefore represents an additional overkill mechanism that protegrins are able to deploy against pathogen targets to render them irreparable. Given the robustness and regenerative abilities of most bacteria, this mechanism would prove useful to the protegrin host.
With this work we provide a timeline of molecular events underlying the bactericidal action of protegrin. It appears that around 100 protegrin pores are sufficient for rapid enough potassium leakage and transmembrane potential decay to overwhelm bacterial defenses. The ion exchange occurs in minutes and appears sufficient to kill bacteria, although water subsequently rushes in, swelling the cells and irreversibly disrupting their structural integrity, thereby ensuring bacterial death.
Acknowledgments
We thank Min Jun Lee and Lorenzo Menzel for technical assistance. This work was supported by a grant from NIH (GM 070989). Computational support from the Minnesota Supercomputing Institute (MSI) is gratefully acknowledged. This work was also partially supported by National Computational Science Alliance under TG-MCA04N033 and utilized the TeraGrid Cluster.
Footnotes
Publisher's Disclaimer: This is a PDF file of an unedited manuscript that has been accepted for publication. As a service to our customers we are providing this early version of the manuscript. The manuscript will undergo copyediting, typesetting, and review of the resulting proof before it is published in its final citable form. Please note that during the production process errors may be discovered which could affect the content, and all legal disclaimers that apply to the journal pertain.
References
- 1.Zasloff M. Antimicrobial peptides of multicellular organisms. Nature. 2002;415(6870):389–95. doi: 10.1038/415389a. [DOI] [PubMed] [Google Scholar]
- 2.Epand RM, Vogel HJ. Diversity of antimicrobial peptides and their mechanisms of action. Biochim Biophys Acta. 1999;1462(1–2):11–28. doi: 10.1016/s0005-2736(99)00198-4. [DOI] [PubMed] [Google Scholar]
- 3.Yeaman MR, Yount NY. Mechanisms of antimicrobial peptide action and resistance. Pharmacol Rev. 2003;55(1):27–55. doi: 10.1124/pr.55.1.2. [DOI] [PubMed] [Google Scholar]
- 4.Brogden KA. Antimicrobial peptides: pore formers or metabolic inhibitors in bacteria? Nat Rev Microbiol. 2005;3(3):238–50. doi: 10.1038/nrmicro1098. [DOI] [PubMed] [Google Scholar]
- 5.Zhang L, Rozek A, Hancock RE. Interaction of cationic antimicrobial peptides with model membranes. J Biol Chem. 2001;276(38):35714–22. doi: 10.1074/jbc.M104925200. [DOI] [PubMed] [Google Scholar]
- 6.Jenssen H, Hamill P, Hancock RE. Peptide antimicrobial agents. Clin Microbiol Rev. 2006;19(3):491–511. doi: 10.1128/CMR.00056-05. [DOI] [PMC free article] [PubMed] [Google Scholar]
- 7.Kokryakov VN, et al. Protegrins: leukocyte antimicrobial peptides that combine features of corticostatic defensins and tachyplesins. FEBS Lett. 1993;327(2):231–6. doi: 10.1016/0014-5793(93)80175-t. [DOI] [PubMed] [Google Scholar]
- 8.Bellm L, Lehrer RI, Ganz T. Protegrins: new antibiotics of mammalian origin. Expert Opin Investig Drugs. 2000;9(8):1731–42. doi: 10.1517/13543784.9.8.1731. [DOI] [PubMed] [Google Scholar]
- 9.Chen J, et al. Development of protegrins for the treatment and prevention of oral mucositis: structure-activity relationships of synthetic protegrin analogues. Biopolymers. 2000;55(1):88–98. doi: 10.1002/1097-0282(2000)55:1<88::AID-BIP80>3.0.CO;2-K. [DOI] [PubMed] [Google Scholar]
- 10.Mosca DA, et al. IB-367, a protegrin peptide with in vitro and in vivo activities against the microflora associated with oral mucositis. Antimicrob Agents Chemother. 2000;44(7):1803–8. doi: 10.1128/aac.44.7.1803-1808.2000. [DOI] [PMC free article] [PubMed] [Google Scholar]
- 11.Cole AM, Waring AJ. The role of defensins in lung biology and therapy. Am J Respir Med. 2002;1(4):249–59. doi: 10.1007/BF03256616. [DOI] [PubMed] [Google Scholar]
- 12.Fahrner RL, et al. Solution structure of protegrin-1, a broad-spectrum antimicrobial peptide from porcine leukocytes. Chem Biol. 1996;3(7):543–50. doi: 10.1016/s1074-5521(96)90145-3. [DOI] [PubMed] [Google Scholar]
- 13.Mani R, et al. Membrane-dependent oligomeric structure and pore formation of a beta-hairpin antimicrobial peptide in lipid bilayers from solid-state NMR. Proc Natl Acad Sci U S A. 2006;103(44):16242–7. doi: 10.1073/pnas.0605079103. [DOI] [PMC free article] [PubMed] [Google Scholar]
- 14.Langham AA, Ahmad AS, Kaznessis YN. On the nature of antimicrobial activity: a model for protegrin-1 pores. J Am Chem Soc. 2008;130(13):4338–46. doi: 10.1021/ja0780380. [DOI] [PMC free article] [PubMed] [Google Scholar]
- 15.Bolintineanu DS, et al. Poisson-Nernst-Planck Models of Nonequilibrium Ion Electrodiffusion through a Protegrin Transmembrane Pore. PLoS Comput Biol. 2009;5(1):e1000277. doi: 10.1371/journal.pcbi.1000277. [DOI] [PMC free article] [PubMed] [Google Scholar]
- 16.Sokolov Y, et al. Membrane channel formation by antimicrobial protegrins. Biochim Biophys Acta. 1999;1420(1–2):23–9. doi: 10.1016/s0005-2736(99)00086-3. [DOI] [PubMed] [Google Scholar]
- 17.Khandelia H, Langham AA, Kaznessis YN. Driving engineering of novel antimicrobial peptides from simulations of peptide-micelle interactions. Biochim Biophys Acta. 2006;1758(9):1224–34. doi: 10.1016/j.bbamem.2006.03.010. [DOI] [PMC free article] [PubMed] [Google Scholar]
- 18.Khandelia H, Kaznessis YN. Molecular dynamics investigation of the influence of anionic and zwitterionic interfaces on antimicrobial peptides’ structure: implications for peptide toxicity and activity. Peptides. 2006;27(6):1192–200. doi: 10.1016/j.peptides.2005.10.022. [DOI] [PMC free article] [PubMed] [Google Scholar]
- 19.Khandelia H, Kaznessis YN. Structure of the antimicrobial beta-hairpin peptide protegrin-1 in a DLPC lipid bilayer investigated by molecular dynamics simulation. Biochim Biophys Acta. 2007;1768(3):509–20. doi: 10.1016/j.bbamem.2006.11.015. [DOI] [PMC free article] [PubMed] [Google Scholar]
- 20.Langham AA, Khandelia H, Kaznessis YN. How can a beta-sheet peptide be both a potent antimicrobial and harmfully toxic? Molecular dynamics simulations of protegrin-1 in micelles. Biopolymers. 2006;84(2):219–31. doi: 10.1002/bip.20397. [DOI] [PubMed] [Google Scholar]
- 21.Langham AA, Waring AJ, Kaznessis YN. Comparison of interactions between beta-hairpin decapeptides and SDS/DPC micelles from experimental and simulation data. BMC Biochem. 2007;8:11. doi: 10.1186/1471-2091-8-11. [DOI] [PMC free article] [PubMed] [Google Scholar]
- 22.Langham AA, et al. Correlation between simulated physicochemical properties and hemolycity of protegrin-like antimicrobial peptides: predicting experimental toxicity. Peptides. 2008;29(7):1085–93. doi: 10.1016/j.peptides.2008.03.018. [DOI] [PMC free article] [PubMed] [Google Scholar]
- 23.Ostberg N, Kaznessis Y. Protegrin structure-activity relationships: using homology models of synthetic sequences to determine structural characteristics important for activity. Peptides. 2005;26(2):297–306. doi: 10.1016/j.peptides.2004.09.020. [DOI] [PubMed] [Google Scholar]
- 24.Hancock RE. Peptide antibiotics. Lancet. 1997;349(9049):418–22. doi: 10.1016/S0140-6736(97)80051-7. [DOI] [PubMed] [Google Scholar]
- 25.Lehrer RI, et al. Interaction of human defensins with Escherichia coli. Mechanism of bactericidal activity. J Clin Invest. 1989;84(2):553–61. doi: 10.1172/JCI114198. [DOI] [PMC free article] [PubMed] [Google Scholar]
- 26.Lehrer RI, Barton A, Ganz T. Concurrent assessment of inner and outer membrane permeabilization and bacteriolysis in E. coli by multiple-wavelength spectrophotometry. J Immunol Methods. 1988;108(1–2):153–8. doi: 10.1016/0022-1759(88)90414-0. [DOI] [PubMed] [Google Scholar]
- 27.Orlov DS, Nguyen T, Lehrer RI. Potassium release, a useful tool for studying antimicrobial peptides. J Microbiol Methods. 2002;49(3):325–8. doi: 10.1016/s0167-7012(01)00383-9. [DOI] [PubMed] [Google Scholar]
- 28.Wu M, et al. Mechanism of interaction of different classes of cationic antimicrobial peptides with planar bilayers and with the cytoplasmic membrane of Escherichia coli. Biochemistry. 1999;38(22):7235–42. doi: 10.1021/bi9826299. [DOI] [PubMed] [Google Scholar]
- 29.Kedem O, Katchalsky A. Thermodynamic analysis of the permeability of biological membranes to non-electrolytes. Biochim Biophys Acta. 1958;27(2):229–46. doi: 10.1016/0006-3002(58)90330-5. [DOI] [PubMed] [Google Scholar]
- 30.Katchalsky A, Curran PF. Harvard Books in Biophysics. Cambridge, Massachusets: Harvard University Press; 1965. Nonequilibrium Thermodynamics in Biophysics. [Google Scholar]
- 31.Goldman DE. Potential, Impedance and Rectification in Membranes. Journal of General Physiology. 1943;27:37–60. doi: 10.1085/jgp.27.1.37. [DOI] [PMC free article] [PubMed] [Google Scholar]
- 32.Rhoads DB, Waters FB, Epstein W. Cation transport in Escherichia coli. VIII. Potassium transport mutants. J Gen Physiol. 1976;67(3):325–41. doi: 10.1085/jgp.67.3.325. [DOI] [PMC free article] [PubMed] [Google Scholar]
- 33.Koch AL, Woeste S. Elasticity of the sacculus of Escherichia coli. J Bacteriol. 1992;174(14):4811–9. doi: 10.1128/jb.174.14.4811-4819.1992. [DOI] [PMC free article] [PubMed] [Google Scholar]
- 34.Yao X, et al. Thickness and elasticity of gram-negative murein sacculi measured by atomic force microscopy. J Bacteriol. 1999;181(22):6865–75. doi: 10.1128/jb.181.22.6865-6875.1999. [DOI] [PMC free article] [PubMed] [Google Scholar]
- 35.Vollmer W, Blanot D, de Pedro MA. Peptidoglycan structure and architecture. FEMS Microbiol Rev. 2008;32(2):149–67. doi: 10.1111/j.1574-6976.2007.00094.x. [DOI] [PubMed] [Google Scholar]
- 36.Klipp E, et al. Integrative model of the response of yeast to osmotic shock. Nat Biotechnol. 2005;23(8):975–82. doi: 10.1038/nbt1114. [DOI] [PubMed] [Google Scholar]
- 37.Paula S, et al. Permeation of protons, potassium ions, and small polar molecules through phospholipid bilayers as a function of membrane thickness. Biophys J. 1996;70(1):339–48. doi: 10.1016/S0006-3495(96)79575-9. [DOI] [PMC free article] [PubMed] [Google Scholar]
- 38.Pagano R, Thompson TE. Spherical lipid bilayer membranes: electrical and isotopic studies of ion permeability. J Mol Biol. 1968;38(1):41–57. doi: 10.1016/0022-2836(68)90127-7. [DOI] [PubMed] [Google Scholar]
- 39.Levitt DG. Kinetics of diffusion and convection in 3.2-A pores. Exact solution by computer simulation. Biopolymers. 1973;13(2):186–206. [PubMed] [Google Scholar]
- 40.Finkelstein A. Theory and Reality. New York: John Wiley & Sons; 1987. Water Movement Through Lipid Bilayers, Pores and Plasma Membranes. [Google Scholar]
- 41.Sundararaj S, et al. The CyberCell Database (CCDB): a comprehensive, self-updating, relational database to coordinate and facilitate in silico modeling of Escherichia coli. Nucleic Acids Res. 2004;32(Database issue):D293–5. doi: 10.1093/nar/gkh108. [DOI] [PMC free article] [PubMed] [Google Scholar]
- 42.Koch AL. Shrinkage of growing Escherichia coli cells by osmotic challenge. J Bacteriol. 1984;159(3):919–24. doi: 10.1128/jb.159.3.919-924.1984. [DOI] [PMC free article] [PubMed] [Google Scholar]
- 43.Shabala L, et al. Ion transport and osmotic adjustment in Escherichia coli in response to ionic and non-ionic osmotica. Environ Microbiol. 2009;11(1):137–48. doi: 10.1111/j.1462-2920.2008.01748.x. [DOI] [PubMed] [Google Scholar]
- 44.Chebotareva NA, Kurganov BI, Livanova NB. Biochemical effects of molecular crowding. Biochemistry (Mosc) 2004;69(11):1239–51. doi: 10.1007/s10541-005-0070-y. [DOI] [PubMed] [Google Scholar]
- 45.Matts TC, Knowles CJ. Stopped-flow studies of salt-induced turbidity changes of Escherichia coli. Biochim Biophys Acta. 1971;249(2):583–7. doi: 10.1016/0005-2736(71)90134-9. [DOI] [PubMed] [Google Scholar]
- 46.Alemohammad MM, Knowles CJ. Osmotically induced volume and turbidity changes of Escherichia coli due to salts, sucrose and glycerol, with particular reference to the rapid permeation of glycerol into the cell. J Gen Microbiol. 1974;82(1):125–42. doi: 10.1099/00221287-82-1-125. [DOI] [PubMed] [Google Scholar]
- 47.de Maranon IM, Gervais P, Molin P. Determination of cells’ water membrane permeability: Unexpected high osmotic permeability of Saccharomyces cerevisiae. Biotechnol Bioeng. 1997;56(1):62–70. doi: 10.1002/(SICI)1097-0290(19971005)56:1<62::AID-BIT7>3.0.CO;2-T. [DOI] [PubMed] [Google Scholar]
- 48.Record MT, Jr, et al. Responses of E. coli to osmotic stress: large changes in amounts of cytoplasmic solutes and water. Trends Biochem Sci. 1998;23(4):143–8. doi: 10.1016/s0968-0004(98)01196-7. [DOI] [PubMed] [Google Scholar]
- 49.Record MT, Jr, et al. Biophysical compensation mechanisms buffering E. coli protein-nucleic acid interactions against changing environments. Trends Biochem Sci. 1998;23(5):190–4. doi: 10.1016/s0968-0004(98)01207-9. [DOI] [PubMed] [Google Scholar]


