Abstract
Calcium puffs describe the transient release of Ca2+ ions into the cytosol, through small clusters of 1,4,5-inositol triphosphate (IP3) receptors, present on internal stores such as the endoplasmic reticulum. Statistical properties of puffs, such as puff amplitudes and durations, have been well characterized experimentally. We model calcium puffs using a simple, sequential-binding model for the IP3 receptor in conjunction with a computationally inexpensive point-source approximation. We follow two different protocols, a sequential protocol and a renewal protocol. In the sequential protocol, puffs are generated successively by the same cluster; in the renewal protocol, the system is reset after each puff. In both cases for a single set of parameters our results are in excellent agreement with experimental results for puff amplitudes and durations but indicate puff-to-puff correlations for the sequential protocol, consistent with recent experimental findings [H. J. Rose, S. Dargan, J. W. Shuai, and I. Parker, Biophys. J. 91, 4024 (2006)]. The model is then used to test the consistency of the hypothesized steep Ca2+ gradients around single channels with the experimentally observed features of puff durations and amplitudes. A three-dimensional implementation of our point-source model suggests that a peak Ca2+ concentration of the order of 10 μM at the cluster site (not channel) is consistent with the statistical features of observed calcium puffs.
Ca2+ ions play a vital role in numerous cellular regulatory mechanisms at all stages of a living organism. Life starts with a massive calcium wave roaming the fertilized egg cell and triggering embryonic development; calcium waves in heart cells regulate the strength at which these cells contract and how hearts beat; calcium signals in neurons facilitate their communication and hence our brain’s ability to function. Yet, in spite of its great relevance for physiology, there are gaps in our quantitative understanding of the biophysical processes underlying calcium signaling. In this paper we focus on the most elemental form of calcium dynamics, the release of calcium from intracellular stores through small groups of release channels, a process on the micrometer scale. Since all forms of calcium signaling are built from these events it is worthwhile to quantitatively understand the biophysical processes underpinning these elemental events. The endoplasmic reticulum (ER) is an intracellular calcium rich source, with calcium values ranging up to 500 μM. The cytosolic concentration, however, is quite small and of the order of nanomolars. Hence, when small groups of ion channels (the gatekeepers of calcium) on the membrane of the ER open, a large amount of calcium rushes into the cytosol and increases the concentration in the vicinity of these channels. When the channels close, the spatially and temporally limited event, we call a calcium puff, terminates. We propose a simple and computationally inexpensive sequential model for these elemental calcium puffs, which reproduces the features of the experimentally observed ones well. Such a model can be used to large-scale simulations of cells where numerous of these elemental events give rise to waves and oscillations. We use this model to explore puff-to-puff correlations for puffs generated by the same cluster and to constrain peak calcium concentrations near the clusters of release channels.
INTRODUCTION: CALCIUM PUFFS
Calcium signaling is one of the most important cellular signaling mechanisms. It describes the transient increase in cytosolic calcium through release of calcium ions from intracellular stores or through plasma membrane channels. The shape of these signals varies widely in time and space, ranging from brief localized events of a few milliseconds to waves roaming the entire cell and even tissue such as liver, heart, and brain.
In this paper we focus on the most elemental calcium signaling event, termed the calcium puff. Calcium is stored in intracellular stores, most notably the ER and the sarcoplasmic reticulum. The concentration there is of the order of tens to hundreds of micromolars, much larger than in the cytosol where it is in the range of tens to several hundreds of nanomolars (see, e.g., Ref. 1). Calcium ions, Ca2+, are released from stores through clusters of release channels with 10–30 channels each. The opening of these channels is determined in a large part by the cytosolic calcium concentration and by the presence of an additional second messenger, inositol trisphosphate (IP3), which is generated upon binding of extracellular agonist (e.g., hormones, neurotransmitter). Increased cytosolic Ca2+ increases the open probability of release channels (IP3Rs). Hence, Ca2+ released from one open channel into the cytosol increases the open probability of other channels in the same cluster, leading to collective positive feedback and a rapid rise in the local cytosolic Ca2+ level. The number of channels recruited this way into a calcium release event varies stochastically giving rise to statistical distributions of the amplitudes, durations, and intervals between Ca2+ release events. These calcium release events, termed calcium puffs, are terminated through a mechanism which is not fully understood but thought of as channel inhibition upon cytosolic Ca2+ binding to an inhibitory binding site.
Clusters of IP3Rs in the oocyte are randomly distributed and about 3 μm apart on the average. This spatial organization of the IP3Rs in small clusters is essential for the hierarchical organization of Ca2+ release events, ranging from the most elemental single-cluster events, i.e., puffs, to multicluster events where the Ca2+ release from one cluster triggers the firing of one or more nearby clusters leading to a spread of the increased cytosolic Ca2+ concentration and to intracellular Ca2+ waves, where clusters fire up like a chain of dominos.
In this paper, we consider puffs released from single clusters. A detailed quantitative characterization of puffs has been provided earlier by Yao et al.,2 Parker et al.,3 and Sun et al.4 The rise of cytosolic Ca2+ is fast and peaks within 20 ms.5 The subsequent decline of cytosolic Ca2+ is reported within a few hundred milliseconds with an average reported between 60 and 150 ms. Puff amplitudes obtained from experiments are averaged over a small domain of about 1 μm length. They are characterized by the statistical distribution of the maxima of these averages within one puff. The resulting puff-amplitude distributions are approximately Gaussian with a peak at about 200 nM and a small proportion of puffs having a much larger amplitude. A more skewed distribution is reported in Ref. 4. The lateral spread of Ca2+ away from the release site has been characterized as diffusive, with an effective diffusion coefficient of about 25 μm2∕s and observed for a few microns.4 The spatial spread of a puff ranges between 2 and 5 μm.4
Early studies reported values for the time intervals between puffs, at a single site, in the range of 10 s.3 Later studies corrected these numbers to 3 s (Ref. 6) (at an IP3 concentration of about 0.3 μM) and most recently to about 1 s.7
While the reported puff amplitudes are of the order of 0.1 μM, it has been hypothesized based on computational studies8 that the Ca2+ concentrations in the vicinity of the channel pores are much larger, i.e., of the order 100 μM. Detailed numerical studies have confirmed these large local concentrations.9, 10 The large concentration of Ca2+ near the channels poses a significant computational problem which has been addressed with, e.g., sophisticated finite element techniques10 if the model is to fully resolve the details of the concentration profile around the channel.
In this paper, similar in spirit to the recent study by Solovey et al.,11 we propose a simple, computationally inexpensive model for calcium puffs, which generates puffs with frequencies, amplitudes, and durations consistent with experimental values. At the heart is a model for the gating of the IP3 receptors which is derived from the DeYoung–Keizer model but incorporates sequential binding and a larger rate of inhibition. In the spirit of simplicity, we use a point-source model, which effectively describes the Ca2+ release from the ER through the entire cluster at a point. Such a model is obviously not designed to resolve Ca2+ profiles near single IP3Rs and the possibly very steep Ca2+ concentration profiles, but it can be useful to address physiological questions on larger spatial scales such as the dynamics of Ca2+ patterns from the scale of micrometers upward which requires simulating a large number of clusters.
The key feature of a point-source model is that all channels of a cluster and all their binding sites experience the same value of the calcium concentration. But this concentration is not the large concentration generated by a single pore close to the pore; it is a concentration that represents an average value of calcium experienced by the binding sites of a channel when a representative number of channels are open. This value is not a priori known and will be constrained by observed statistical properties of puffs.
In Sec. 2 we describe our model and the computational methods we use to analyze it. Similar as in Refs. 12, 13 we derive, through lumping of states, reductions of our six-state IP3 receptor model to a four-state and a two-state model.
We then present results for puff characteristics using two different protocols, a sequential protocol, where puffs are generated continuously from one single cluster, and a renewal protocol, where the system is reset after each puff to a predefined state. We show that our model delivers puffs with statistical characteristics (duration and amplitude) consistent with those observed experimentally. Using the two different protocols, we identify correlations between subsequent puffs generated by a single cluster, which can be explained in a similar way as those observed in experiments13 by channel inhibition. We further test the accuracies of the four-state and two-state model reductions.
Finally, we investigate the consistency of large Ca2+ concentrations around the cluster sites. First, we show that the two-dimensional implementation of our model, although its results are consistent with physiological values, is clearly inconsistent with steep Ca2+ gradients around the cluster sites. But we can reconcile this difference to an extent by using a three-dimensional (3D) implementation of the model giving rise to consistent puff amplitudes and durations for peak cluster concentration at around 10 μM.
THE MODEL
The spatiotemporal dynamics of the cytosolic Ca2+ concentration c is modeled by the following two-dimensional reaction diffusion equation:
| (1) |
Here Jcluster denotes the flux of Ca2+ from the ER into the cytosol through one cluster of IP3Rs containing a small number of channels, and is the position of the point cluster. Each cluster comprises N channels and the total cluster flux is given by
| (2) |
where rc≈5 nm denotes the radius of the channel and vcluster determines the maximum flux. The number of open channels is simulated by using a stochastic version of the kinetic scheme of the IP3 receptor as described in Sec. 3.
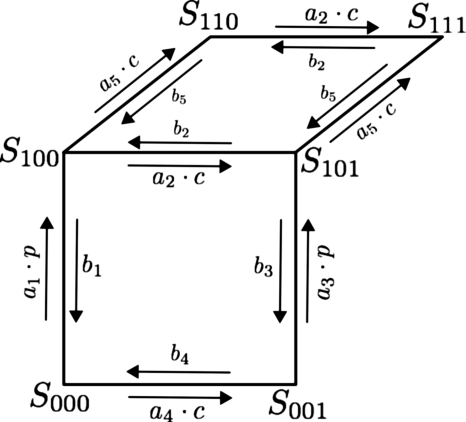
As it is now well established that the IP3R is a tetramer14 we assume that the IP3 receptor has four equal and independent subunits. Each subunit has three binding sites: an IP3 binding site, a Ca2+ activation binding site, and a Ca2+ inhibition binding site, each of which is either occupied or unoccupied. Therefore, each subunit can exist in any of the eight permissible states. We make two assumptions. First, unlike the DeYoung–Keizer model15 we force sequential binding of IP3 and Ca2+ to the receptor. This means that Ca2+ only binds to the activation site on the subunit once IP3 has bound to the subunit. In the absence of bound IP3, Ca2+ does not bind to the activation site. Thus, if Sijk denotes the state of a subunit, where i characterizes the state of the IP3 binding site (i=0 means not bound), j the state of the Ca2+ activation binding site, and k the state of the inhibiting Ca2+ binding site, the two states S010 and S011 do not exist. Therefore we have a six-state model for each subunit of the IP3R as opposed to the eight-state DeYoung–Keizer model. The subunit is activated only when the IP3 and Ca2+ activation sites are occupied. The channel is considered open if any three or all four subunits are activated. Second, we increase the rate of inhibition by a factor of 10, reducing the mean open time of the channels. Figure 1 shows a schematic diagram for the receptor subunit.
Figure 1.
A schematic diagram of the kinetics of a single IP3 subunit for the six-state model. The transition rates between receptor states are indicated next to the arrows. p denotes the IP3 concentration.
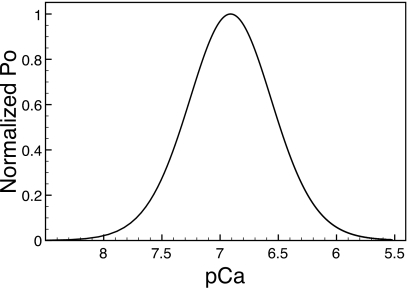
Figure 2 shows the normalized steady-state open probability Po of the receptor as a function of the Ca2+ concentration for a fixed IP3 concentration of 2 μM. Similar to the protocol in Ref. 16 the open probabilities are normalized to its maximum value. Reported open probabilities of the IP3 receptor range from <0.01 (Ref. 17) up to 0.5 (Ref. 18). For our model at 2 μM IP3, the open probability peaks at around 0.042, with the peak at Ca2+ concentration of about 120 nM. The peak Ca2+ sensitivity correlates well with data published by Tu et al.16 On cell membranes, three different types of IP3 isoforms are known to exist. At 2 μM IP3, Tu et al.16 measured peak Ca2+ sensitivity for Po to be at 257 nM of Ca2+ for type 1 isoform, 154 nM of Ca2+ for type 2 isoform, and 107 nM of Ca2+ for type 3 isoform. We therefore conclude that our model operates within a physiologically relevant range.
Figure 2.
Steady-state open probability curve for the six-state model at 2 μM IP3. Calcium sensitivity peaks at 123 nM of [Ca2+]. The open probability is normalized with respect to peak Po value. pCa equals −log 10[Ca2+].
Our approach for the IP3R is not meant as a substitute for detailed and realistic models of the IP3 receptor19, 20, 21 designed to further our understanding of these receptors. Our target is to arrive at a model that is computationally efficient and accurate on the organizational scale of puffs and waves.
In the spirit of simplicity we do not incorporate buffers explicitly but use the effective diffusion coefficient D=25 μm2∕s extracted from data,4 and therefore incorporates the role of buffers. As it is essential to restore low cytosolic Ca2+ concentrations, once Ca2+ is released into the cytosol, the cell recruits the sarcoendoplasmic reticulum calcium ATPases (SERCA or calcium pumps) present on the ER membrane for the reuptake of Ca2+ from the cytosol. We assume the SERCA pumps to be distributed uniformly on the ER membrane and model the pump flux Jpump with a Hill coefficient of 2, i.e.,
| (3) |
The remaining term Jleak=vleak(cER−c) describes nonspecific Ca2+ leakage from the ER into the cytosol.
The Ca2+ concentration in the ER is much larger than the cytosolic Ca2+ and is assumed to be constant, i.e., the possibility of store depletion is neglected here. Table 1 lists the values of all model parameters. Detailed balance has been imposed with k1k2=k3k4, ki being the ratio of the receptor dissociation constant to the receptor association constant. The maximum pump flux v3 in conjunction with the luminal Ca2+ is the main determinant of the basal Ca2+ concentration in our model.
Table 1.
Model parameters.
| Parameter | Value | Description |
|---|---|---|
| vcluster | 5689.0 s−1 | Max. [Ca2+] channel flux |
| vleak | 0.020 35 s−1 | [Ca2+] leak flux constant |
| vpump | 45.5 μM s−1 | Max. [Ca2+] uptake |
| kpump | 0.1 μM | Activation constant for [Ca2+] pump |
| D | 25.0 μm2 s−1 | Effective diffusion coefficient of cytosolic [Ca2+] |
| Receptor binding constants | ||
| a1 | 167.6 (μM s)−1 | IP3 |
| a2 | 3.81 (μM s)−1 | Ca2+ inhibition |
| a3 | 413.4 (μM s)−1 | IP3 |
| a4 | 0.3101 (μM s)−1 | Ca2+ inhibition |
| a5 | 53.9 (μM s)−1 | Ca2+ activation |
| Receptor dissociation constants | ||
| b1 | 228.0 s−1 | IP3 |
| b2 | 0.409 s−1 | Ca2+ inhibition |
| b3 | 188.5 s−1 | IP3 |
| b4 | 0.096 s−1 | Ca2+ inhibition |
| b5 | 4.52 s−1 | Ca2+ activation |
We solve the partial differential equation [Eq. 1] on a square area of 5×5 μm2 using a four-point discretization of the Laplacian and a fully explicit solver. Boundary conditions are such that no flux can enter the square area. The δ function in Eq. 1, modeling a point cluster, is implemented in discrete fashion by (a) limiting the flux to a bin with area dxdy, where dx and dy are the discretization intervals, and (b) dividing the total flux by the bin area dxdy such that the integral over the cluster is independent of the bin size. 3D simulations of this nature involve a cubic volume being simulated using a six-point discretization of the Laplacian and a fully explicit solver. Yet, it is important to realize that the computationally efficient point-source method comes with a disadvantage: Decreasing the discretization length leads to a decreased source size and hence a larger flux density and correspondingly, a modified local peak concentration which in turn can affect the gating of the channels. This effect, however, is weak unless the bin size becomes much smaller than the estimated cluster size of 40×40 nm2. To resolve such spatial detail a distributed source model will be necessary (see, e.g., Ref. 22). On the other hand, the point-source model still gives reasonably accurate results for a discretization length as large as 100 nm, similar as reported in Ref. 11. Unless stated differently, we use a bin size of 50×50 nm2, close to the actual size of a cluster.
For the stochastic simulation of the IP3 receptor, we assume that all subunits are independent and that each subunit of the receptor undergoes stochastic transitions between its states, through stochastic association and dissociation of the agonist (see also the recent review in Ref. 23). Transition rates between states depend on the agonist binding rates (see Fig. 1) and for a sufficiently small time step, transition probabilities have a linear dependence on the time step. Specifically, if a subunit is in state Ai and has access to states Aj with transitions rates rij, the probability of a transition i→j is given by rijdt with dt small enough that rijdt⪡1 and the probability to remain in state Ai is 1−∑jrijdt. We randomly select from these transitions with a weight proportional to their probabilities.
Quasi-steady-state reductions
The full set of rate equations describing a subunit of an IP3 receptor, introduced above, reads (see also Fig. 1)
| (4) |
where xijk denote the probabilities for a subunit to be in states Sijk, respectively.
We now proceed to employ quasi-steady-state approximations by exploiting time scale separation of the full six-state model. It should be pointed out that the actual separation of time scales of various rate processes depends on the Ca2+ concentration and is for our model and its parameter values only valid for calcium concentrations up to around 1 μM, i.e., for relatively small values of v1. It is this regime we are considering below.
In the first reduction we exploit the fact (similar as in Ref. 12) that IP3 binding and dissociation is faster than the other competing processes by assuming that the transitions between the states x1ij and x0ij are equilibrized, i.e.,
| (5) |
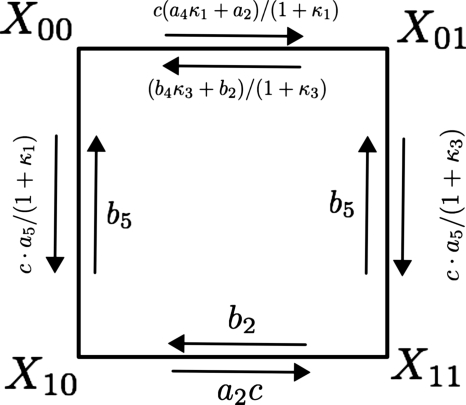
where p denotes the IP3 concentration. We exploit this relation to reduce our six-state model to a four-state model by lumping together states x0ik and x1ik into states Xik. In this reduced model, the subunit conducts in the X10 state. The set of six differential equations, that govern the subunit dynamics for a six-state model, following the approximation reduces to the following set of four equations (for a graphical scheme, see Fig. 3):
| (6) |
where
| (7) |
In a second reduction, we start from the four-state model [Eq. 6] and lump states again, i.e.,
| (8) |
yielding a two-state approximation for each subunit with the activated state Y0 and the inhibited state Y1, i.e.,
| (9) |
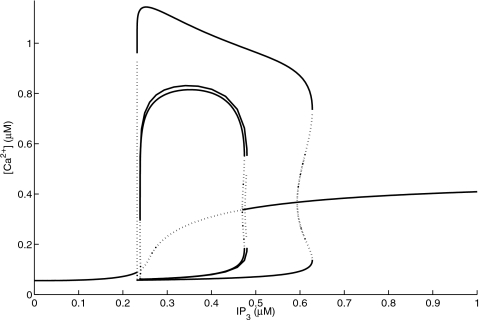
Before we use the stochastic version of this reduced four-state model, we compare the bifurcation diagrams of the corresponding rate equations for the full six-state [Eq. 4] and four-state models [Eq. 6] (Fig. 4) with the IP3 concentration as a bifurcation parameter. We replace Jcluster by
| (10) |
respectively. In Fig. 4, we depict the bifurcation diagrams for the full six-state model, the four-state model, and the two-state model by the minimum and maximum values of the Ca2+ concentration c as a function of the IP3 concentration p at v1=120∕s. For low values of IP3, c settles at a stable equilibrium. The steady-state values of c increase as IP3 is increased until the steady state loses stability via a subcritical Hopf bifurcation at p=0.24 μM. At this point, an unstable periodic orbit collapses onto the equilibrium, and both disappear. c is subsequently attracted toward a large-amplitude stable periodic orbit. The oscillations in c persist as p is increased until the same sequence of bifurcations occurs in reverse at p=0.476 μM. At this value of p, the unstable equilibrium undergoes a subcritical Hopf bifurcation, becoming stable, giving rise to an unstable periodic orbit whose amplitude quickly rises with increasing p. This orbit then collides with the large-amplitude stable periodic orbit at p=0.628 μM, and both orbits disappear in a saddle-node bifurcation of periodic orbits. For still higher values of p, c approaches the equilibrium values shown at the far right in Fig. 4. The second Hopf bifurcation at the larger IP3 concentration occurs farther to the right for the two-state model and therefore, we do not further pursue the two-state reduction. Comparison of the bifurcation diagram of this two-state approximation (see Fig. 4) shows significant deviations from that of the full six-state model and four-state model and we therefore do not further this venue.
Figure 3.
A schematic diagram of the kinetics of a single IP3 subunit for the four-state model. The modified transition rates in between receptor states are as shown in the figure.
Figure 4.
The bifurcation diagram for the Ca2+ concentration c as a function of the IP3 concentration for the six-state model, the four-state reduction, and the two-state reduction at v1=120 and cER=11 μM. All other parameters are described in the text. Solid and dotted lines represent stable and unstable states, respectively.
RESULTS
A single cluster of 20 IP3Rs was simulated at the center of a 5×5 μm2 grid, with an effective cytosolic Ca2+ diffusion coefficient of D=25 μm2 s−1 at IP3=5 μM. A typical Ca2+ puff has the spatial extent of about 2–4 μm. We record (a) the peak Ca2+ concentration at the site of the cluster, (b) the concentration averaged over a 1×1 μm2 square centered at the puff site, and (c) the durations of the puffs in terms of the full width at half maximum (for a definition see Sec. 3A). At this point, the Ca2+ concentration in the ER was chosen to be 11 μM and the flux constant vcluster was chosen to be 5689∕s, yielding peak maximum Ca2+ levels between 1 and 2 μM. We would like to mention here that almost identical results can be obtained by choosing a more realistic luminar calcium concentration of 500 μM but with a reduced value of about vcluster=200∕s. Stochastic opening and closing of channels, within a cluster, gives rise to elementary Ca2+ release events with varying numbers of recruited channels.
Sequential protocol
We are using a sequential protocol, i.e., we continuously simulate the 5×5 μm2 grid, generating thousands of sequential puffs. The puffs are characterized by their durations and their amplitudes, which are both statistically distributed since the number of channels recruited and their opening times are random. The puff amplitudes are defined as follows. A puff starts (at ta) when more than one channel is open, corresponding roughly to an averaged Ca2+ concentration (averaged over a 1×1 μm2 domain) of 20 nM above baseline. We do not consider at this point single-channel events but discuss them later. The puff ends at tb, when the averaged Ca2+ concentration falls below 10 nM above baseline. The puff amplitude is defined as the maximum averaged amplitude within the time interval [ta,tb]. The duration of the puff is the time interval between the time the averaged Ca2+ concentration exceeds half the maximum for the first time and the last time within [ta,tb]. Experimental data obtained by various groups show puff lifetimes to be in the millisecond regime. Sun et al.4 and Thomas et al.24 reported puff lifetimes to peak at about 100 ms whereas Haak et al.25 reported mean puff lifetimes of 60 ms.
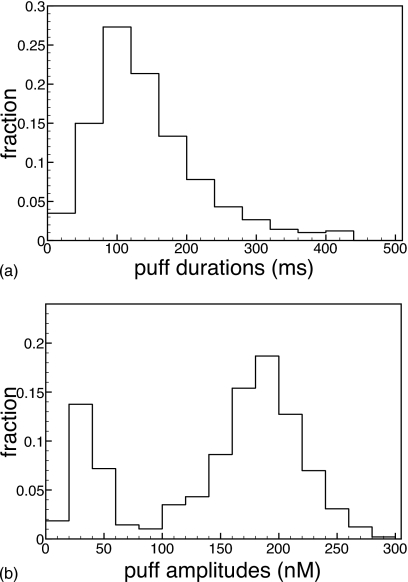
In Fig. 5a we show the distribution of puff durations obtained by analyzing 5000 sequential puffs with our model at parameter values described above. The puff-duration distribution has a peak of around 100 ms, in excellent agreement with the experimental distribution, and average puff duration is about 150 ms.
Figure 5.
Puff-amplitude (bottom panel) and puff-duration (top panel) distributions for the six-state model at cER=11 μM, IP3=5 μM, and vcluster=5689∕s.
Puff amplitudes show considerable variation, with values ranging from about 20 to 700 nM, as measured by Thomas et al.24 In Fig. 5b we show the puff-amplitude distribution we obtained by averaging over 5000 sequential puffs at the same parameter values as above. Puffs generated had a minimum amplitude of about 16 nM and a maximum of about 300 nM, with a mean of 144.19 nM. The amplitude distribution we obtained also compares qualitatively with the distribution obtained in Xenopus oocytes by Sun et al.4 [Fig. 8(A) therein], except for the large peak at small puff amplitudes. By analyzing this peak, we found that these peaks are predominantly due to two-channel events. Thus, in view of the absence of this peak in the reported experiments, it could be that either the experiments do not resolve all of these events (as suggested in Ref. 4) or that our model produces too many events where channel opening is poorly synchronized. Of all events observed, about 44% were single-channel events. An important factor for these large numbers of few-channel events is the sequential protocol as discussed below.
For a channel to activate, IP3 binding is a prerequisite. Therefore puff properties vary with IP3 concentrations. A very small IP3 concentration fails to generate puffs, as not enough channels in the cluster have IP3 bound. Increasing the IP3 concentration increases the number of generated puffs as well as their amplitudes. We simulated 5000 sequential puffs and analyzed the puffs as described above. At IP3=0.5 μM, we found for the rate of puffs (no single-channel events) about one puff in 750 s for their mean (averaged) amplitude about 50 nM and the duration of about 171 ms. Most of these events are few-channel events. As IP3 is increased, the rate of puffs increases. For 5 μM IP3, the puff rate is up to one puff in about 12 s, not counting single-channel events. Remarkably, the other properties, such as puff durations or puff amplitude, however, saturate once a certain level of IP3 is reached. Between IP3=3 μM and IP3=5 μM, we have seen no change in the average puff durations and amplitudes, consistent with experimental conclusions.5 As a matter of fact the entire distribution of puff durations and amplitudes is virtually unchanged between IP3=3 μM and IP3=5 μM.
Reduced models
As described above, the full six-state model for the IP3 receptor may be reduced to a four-state and a two-state model using one or two quasi-steady-state approximations. While the four-state reduction seems most promising when the corresponding rate equations are compared, we have to also compare stochastic implementations of the reduced scheme, as the validity of the rate equation does not necessarily imply that for a stochastic implementation. In Fig. 6, we show the puff-duration and puff-amplitude distributions for the same parameters as above.
Figure 6.
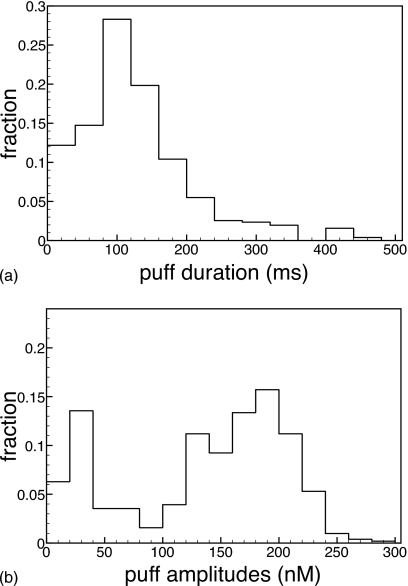
Puff-amplitude (bottom panel) and puff-duration (top panel) distributions for cER=11 μM, IP3=5 μM, and vcluster=5689∕s but with the reduced four-state model for the IP3 subunit described above.
While overall, the four-state model works well, the six-state model gives us a mean lifetime of 157 ms and a mean amplitude of 144 nM. For the same set of parameters the four-state model gives us a mean lifetime of 135 ms and a mean amplitude of 134 nM. This discrepancy in the mean values can be attributed to the larger number of small-amplitude events (20 nM) in the four-state model. This observation can be explained by the fact that in the four-state reduction we assumed equilibrium of IP3 binding and disassociation to be instantaneous on the time scale of Ca2+ binding. Therefore, it is to be expected that IP3 dissociates faster than the time it takes for Ca2+ activation to set in and thereby the failure to elicit a large puff. Correspondingly, the puff-duration distribution reveals a larger fraction of shorter puffs. For both models, puff durations peak at 100 ms while puff-amplitude distributions have a peak at 180–190 nM. The two-state reduction yields, as for the bifurcation diagram above, dissatisfactory answers (not shown) and is not further considered.
Renewal protocol
The above chosen protocol assumes that the puffs are generated sequentially and by one cluster only. In this section we use a protocol similar as in the computational study by Swillens et al.26 We hold one channel open (the trigger channel), increasing the local Ca2+ concentration and thus the probability of puff initiation. Once the second channel opens, we release the trigger channel and record the emerging puff. When the averaged Ca2+ amplitude decreases below 5 nM above baseline, the puff is terminated and the system resets to prepuff conditions (i.e., the receptor states are re-equilibrized). The main motivation for using this protocol is that it eliminates correlations between puffs. If there is long-term inhibition, beyond the time interval between the puffs, puffs obtained sequentially (i.e., correlated puffs) are expected to exhibit different statistics than those obtained through the renewal protocol. We thus use the renewal protocol as a tool to detect correlations. If puff statistics are assembled from experiments by pooling puffs from different sites, temporal correlations are not present and the renewal protocol would be the protocol of choice for simulations.
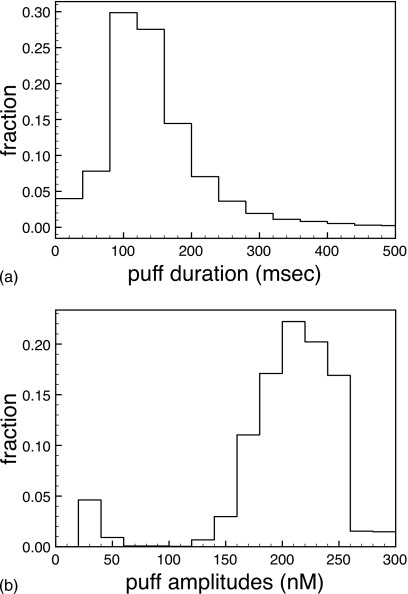
For an IP3 concentration of 5 μM and all parameters the same as above, we simulate 5000 decorrelated puffs analyzed the same way as described above. The resulting puff-amplitude and puff-duration distributions are shown in Figs. 7a, 7b, respectively. The peaks around and below 50 nM amplitude are predominantly two-channel events. In comparison to the sequential protocol, the number of two-channel events is much smaller. The fraction of two-channel events is down from 16% to about 7%. For peak Ca2+ levels at the cluster site of the order 1–2 μM, the average fraction of open channels during a puff is slightly larger with the renewal protocol. Increasing the channel flux through IP3Rs, so that peak Ca2+ concentrations at the cluster site are of the order of 10 μM, the average fraction of open channels remains about 50% in the renewal protocol, while it drops down to 25% in the sequential protocol, increasing the fraction of, e.g., two-channel events, while the fraction of two-channel events becomes virtually zero for the renewal protocol.
Figure 7.
Puff-amplitude (bottom panel) and puff-duration distributions (top panel) for cER=11 μM, IP3=5 μM, and vcluster=5689∕s obtained with the renewal protocol.
These results indicate (a) stronger channel synchrony during a puff in the renewal protocol than in the sequential case (in particular, when local Ca2+ levels are high) and (b) correlations between successive puffs. Such correlations have been reported recently by Fraimann et al.7 They recorded that a large puff amplitude is followed on the average by a large time interval to the next puff. Their analysis revealed that this correlation is due to a competition between inhibition (a long-term effect) and channel opening. The results reported here suggest the same hypothesis. A single-channel event shortly after a large-amplitude puff can recruit and synchronize only few, if any, other channels because of inhibition. For the same reason, the larger puffs [the peaks at large puff amplitudes in Fig. 5a] have a smaller amplitude in the sequential protocol (144 nM) versus the renewal protocol (200 nM) (compare the amplitude distributions in Figs. 57). The puff-duration distributions [see Fig. 7b] are similar in both protocols. The average puff duration with the renewal protocol is 147 ms (5000 puffs), in comparison to 157 ms in the sequential protocol. This correlates well with the differences in the puff amplitudes since larger amplitudes go often along with smaller durations for the increased inhibition at large puff amplitudes.
Local Ca2+ concentrations and maximum cluster flux
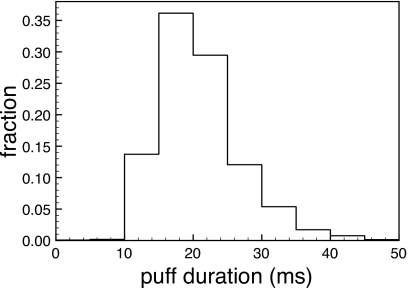
Computational modeling of a single open channel9 and other work26 suggest that the concentration of Ca2+ at the mouth of an open channel is of the order of 100 μM, decaying to fractions of 1 μM within 1 μm, giving rise to huge gradients of Ca2+ around the channel mouth which may affect the gating of the open channel and channels within the cluster. We found that for cER=11 μM, the value of vcluster of about 5000 generates puffs with the observed statistical properties. For the peak calcium concentration at the cluster site (not to be confused with the peak calcium concentration at the mouth of a channel) we find values of a few micromolars. If we targeted a cluster-site concentration of 100 μM, a concentration expected around a single channel,10 we would clearly overestimate the influence of the channels on each other. In view of the analysis of the decay of the Ca2+ profile around the cluster in Ref. 10 and the assumption that channels are densely packed (around 10 nm distance) a few tens of micromolars seem reasonable as a target for the peak Ca2+ at the cluster site. If the channels are not as densely packed as suggested in Ref. 27 (300–800 nm cluster size), the cluster-site Ca2+ concentrations would be substantially smaller. To explore the effects of a large Ca2+ concentration at the cluster site (using the renewal protocol), we choose a realistic value of cER=500 μM but leave vcluster as large as vcluster=3000 s−1. All other parameters remain unchanged. The peak amplitudes at the cluster site are now about 25 μM on the average. The resulting distribution of puff amplitudes (averaged), however, peaks at almost 4 μM, a value much larger than in any experimental observation we are aware of. Furthermore, the distribution of puff lifetimes (see Fig. 8) peaks at about 20 ms, much less than in any experimental recording we are aware of. Most compelling, however, is the narrow range of the puff-duration distribution with essentially no puffs longer than 50 ms (see Fig. 8). Such characteristics are clearly inconsistent with observed puff durations.3, 4, 5 For cER=500 μM and a smaller value for vcluster=1000∕s, the peak amplitudes at the cluster site are down to 10 μM on the average. The distribution of averaged puff amplitudes is 1.7 μM, still well beyond the experimental values we are aware of, and the puff-duration distribution peaks at about 30 ms, cutting off at about 70 ms.
Figure 8.
Puff-duration distribution obtained with the renewal protocol for cER=500 μM and vcluster=3000∕s.
In order to match the statistics of the experimentally observed puffs, in amplitude, duration, and frequency, we are guided to a value for the maximum channel flux (at cER=500 μM) determined by a value for vcluster not more than about 300∕s. We made a similar observation in an earlier work.28
DISCUSSION
We put forward a simple computationally inexpensive model (six states and four states) for the IP3 receptor which generates, in conjunction with a point-source approximation, calcium puffs with statistics in durations, averaged amplitudes, and frequencies consistent with numerous experiments. The model is derived from the DeYoung–Keizer model by requiring sequential binding of IP3 and activating Ca2+ and an increased rate of inhibition. At the parameter values for vcluster and luminal CaER, where we find good agreement between our model and experimentally observed puff statistics, the DeYoung–Keizer model with its original parameter values generates puffs that are generally much too long in duration (seconds) and too large in amplitude.
We have used two different protocols to generate puffs, a sequential protocol, where puffs are continuously generated from one cluster, and a renewal protocol, where we reset the conditions after the end of a puff to a predetermined state of the receptor subunits and basal Ca2+ levels (no channel open). The puffs generated by the renewal protocol exhibit generally a large fraction of open channels and a smaller number of few-channel events. The distribution of puff durations is similar in both protocols, while the distribution of puff amplitudes does not exhibit the large peak at small amplitudes due to the reduced number of few-channel events. This observation is consistent with puff correlations observed recently by Fraimann et al.7 where puffs from a single-cluster site have been analyzed. As the differences between the two protocols increase for increasing Ca2+ concentrations at the cluster site, it is (like in Ref. 7) likely a consequence of inhibition.
Our model, however, at the parameter values that yield puff statistics consistent with experiments, generates peak Ca2+ concentrations of the order of about 1–2 μM, inconsistent with other detailed computational studies8, 9, 10 of single channels suggesting a concentration of tens of micromolars at the cluster-site Ca2+ (see Fig. 2 in Ref. 10). One way to reconcile the hypothesized large Ca2+ concentrations at the cluster sites in the range of tens of micromolars and the observed distributions of puff durations and averaged amplitudes on the micrometer scale may be dimensionality. Like in the Poisson equation in electrodynamics,29 which is mathematically a similar problem as the diffusion of Ca2+ released by a point source, dimensionality is important. In one dimension, diffusion with a point source and a linear absorber (excessive buffer approximation) yields a steady-state profile which is finite at the cluster site and decays exponentially. In two dimensions, the concentration has a weak and very narrow logarithmic singularity at the cluster site. In three dimensions, the same setting yields a profile of the form (1∕r)exp(−αr),30, 31 with a seriously diverging Ca2+ concentration at the position of the source. While the diverging concentration at the cluster site (in one and two dimensions) is clearly a consequence of the steady-state source density, it is clear that in three dimensions, one would expect a larger peak concentration of Ca2+ at the cluster site.
With this observation in mind, we simulated our model in a 1 fl cube (mimicking experimental protocols). Simulation protocol is as described in the model section above. To obtain the averaged puff amplitudes, we average the Ca2+ concentrations over a cube of (1 μm)3=1 fl. For cER=500 μM and vcluster=3000∕s, we find an average peak Ca2+ concentration of about 130 μM, an average puff amplitude of about 1 μM, and an average puff duration of about 10 ms with little spread. None of the 500 simulated puffs had a duration longer than 30 ms. Next we use the much smaller value vcluster=125∕s preserving the product vclustercER we used in our two-dimensional model to generate puffs consistent with experimental recordings but with a more realistic luminal Ca2+ concentration of CER=500 μM. For these parameter values we find an average peak concentration of Ca2+ at the cluster site of about 10 μM, an average puff concentration of about 130 nM, and an average puff duration of about 100 ms, with a spread ranging from 2 to 300 ms. Remarkably, these results are similar to those we reported earlier for our two-dimensional model, except that the peak Ca2+ concentrations at the cluster site are more consistent with large Ca2+ gradients at the channel mouth.
This result suggests, that if one is interested in Ca2+ signaling phenomena on a larger spatial scale, i.e., in the collective dynamics of numerous cluster sites (but still based on accurate elemental event dynamics), a two-dimensional model with moderate peak Ca2+levels at the cluster sites is more practical as it lacks the serious computational difficulties of the 3D models with huge Ca2+ gradients. What are lost in this approach are the accurate spatial details of the Ca2+ profiles well within the puffs, near cluster sites.
ACKNOWLEDGMENTS
We thank the National Science Foundation for support under Grant No. IOS 0345500.
References
- Pszczolkowski M. A., Lee W. S., Liu H. P., and Chiang A. S., Mol. Cell. Endocrinol. 158, 163 (1999). 10.1016/S0303-7207(99)00167-7 [DOI] [PubMed] [Google Scholar]
- Yao Y., Choi J., and Parker I., J. Physiol. (London) 482, 533 (1995). [DOI] [PMC free article] [PubMed] [Google Scholar]
- Parker I., Choi J., and Yao Y., Cell Calcium 20, 105 (1996). 10.1016/S0143-4160(96)90100-1 [DOI] [PubMed] [Google Scholar]
- Sun X. P., Callamaras N., Marchant J. S., and Parker I., J. Physiol. (London) 509, 67 (1998). 10.1111/j.1469-7793.1998.067bo.x [DOI] [PMC free article] [PubMed] [Google Scholar]
- Rose H. J., Dargan S., Shuai J. W., and Parker I., Biophys. J. 91, 4024 (2006). 10.1529/biophysj.106.088872 [DOI] [PMC free article] [PubMed] [Google Scholar]
- Parker I. and Yao Y., J. Physiol. (London) 491, 663 (1996). [DOI] [PMC free article] [PubMed] [Google Scholar]
- Fraiman D., Pando B., Dargan S., Parker I., and Dawson S. P., Biophys. J. 90, 3897 (2006). 10.1529/biophysj.105.075911 [DOI] [PMC free article] [PubMed] [Google Scholar]
- Swillens S., Champeil P., Combettes L., and Dupont G., Cell Calcium 23, 291 (1998). 10.1016/S0143-4160(98)90025-2 [DOI] [PubMed] [Google Scholar]
- Thul R. and Falcke M., Biophys. J. 86, 2660 (2004). 10.1016/S0006-3495(04)74322-2 [DOI] [PMC free article] [PubMed] [Google Scholar]
- Rudiger S., Shuai J. W., Huisinga W., Nagaiah C., Warnecke G., Parker I., and Falcke M., Biophys. J. 93, 1847 (2007). 10.1529/biophysj.106.099879 [DOI] [PMC free article] [PubMed] [Google Scholar]
- Solovey G., Fraiman D., Pando B., and Ponce Dawson S., Phys. Rev. E 78, 041915 (2008). 10.1103/PhysRevE.78.041915 [DOI] [PubMed] [Google Scholar]
- Li Y. X. and Rinzel J., J. Theor. Biol. 166, 461 (1994). 10.1006/jtbi.1994.1041 [DOI] [PubMed] [Google Scholar]
- Keizer J. and DeYoung G., J. Theor. Biol. 166, 431 (1994). 10.1006/jtbi.1994.1038 [DOI] [Google Scholar]
- Taylor C. W., daFonseca P. C. A., and Morris E. P., Trends Biochem. Sci. 29, 210 (2004). 10.1016/j.tibs.2004.02.010 [DOI] [PubMed] [Google Scholar]
- De Young G. W. and Keizer J., Proc. Natl. Acad. Sci. U.S.A. 89, 9895 (1992). 10.1073/pnas.89.20.9895 [DOI] [PMC free article] [PubMed] [Google Scholar]
- Tu H., Wang Z., and Bezprozvanny I., Biophys. J. 88, 1056 (2005). 10.1529/biophysj.104.049601 [DOI] [PMC free article] [PubMed] [Google Scholar]
- Kaftan E. J., Ehrlich B. E., and Watrass J., J. Gen. Physiol. 110, 529 (1997). 10.1085/jgp.110.5.529 [DOI] [PMC free article] [PubMed] [Google Scholar]
- Mak D. O. D., McBride S., and Foskett J. K., Proc. Natl. Acad. Sci. U.S.A. 95, 15821 (1998). 10.1073/pnas.95.26.15821 [DOI] [PMC free article] [PubMed] [Google Scholar]
- Shuai J., Pearson J., Foskett J., Mak D. O. D., and Parker I., Biophys. J. 93, 1151 (2007). 10.1529/biophysj.107.108795 [DOI] [PMC free article] [PubMed] [Google Scholar]
- Ionescu L., White C., Cheung K. -H., Shuai J., Parker I., and John E., J. Gen. Physiol. 130, 631 (2007). 10.1085/jgp.200709859 [DOI] [PMC free article] [PubMed] [Google Scholar]
- Shuai J., Pearson J., and Parker I., Biophys. J. 95, 3738 (2008). 10.1529/biophysj.108.137182 [DOI] [PMC free article] [PubMed] [Google Scholar]
- DeRemigio H., Groff J. R., and Smith G. D., , IMA J. Math. Appl. Med. Biol. 25, 65 (2008). 10.1093/imammb/dqn004 [DOI] [PubMed] [Google Scholar]
- Groff J. R., DeRemigio H., and Smith G. D., in Stochastic Methods in Neuroscience, edited by Laing C. and Lord G. (Clarendon, New York, 2008). [Google Scholar]
- Thomas D., Lipp P., Berridge M. J., and Bootman M. D., J. Biol. Chem. 273, 27130 (1998). 10.1074/jbc.273.42.27130 [DOI] [PubMed] [Google Scholar]
- Haak L. L., Song L. S., Molinski T. F., Pessah I. N., Cheng H., and Russell J. T., J. Neurosci. 21, 3860 (2001). [DOI] [PMC free article] [PubMed] [Google Scholar]
- Swillens S., Dupont G., Combettes L., and Champeil P., Proc. Natl. Acad. Sci. U.S.A. 96, 13750 (1999). 10.1073/pnas.96.24.13750 [DOI] [PMC free article] [PubMed] [Google Scholar]
- Shuai J., Rose H. J., and Parker I., Biophys. J. 91, 4033 (2006). 10.1529/biophysj.106.088880 [DOI] [PMC free article] [PubMed] [Google Scholar]
- Ullah G. and Jung P., Biophys. J. 90, 3485 (2006). 10.1529/biophysj.105.073460 [DOI] [PMC free article] [PubMed] [Google Scholar]
- Jackson J. D., Electrodynamics, 2nd ed. (Wiley, New York, 1975). [Google Scholar]
- Smith G. D., Wagner J., and Keizer J., Biophys. J. 70, 2527 (1996). 10.1016/S0006-3495(96)79824-7 [DOI] [PMC free article] [PubMed] [Google Scholar]
- Smith G. D., Biophys. J. 71, 3064 (1996). 10.1016/S0006-3495(96)79500-0 [DOI] [PMC free article] [PubMed] [Google Scholar]


