


Abstract
Synthetic gene networks can be used to control gene expression and cellular phenotypes in a variety of applications. In many instances, however, such networks can behave unreliably due to gene expression noise. Accordingly, there is a need to develop systematic means to tune gene expression noise, so that it can be suppressed in some cases and harnessed in others, e.g. in cellular differentiation to create population-wide heterogeneity. Here, we present a method for controlling noise in synthetic eukaryotic gene expression systems, utilizing reduction of noise levels by TATA box mutations and noise propagation in transcriptional cascades. Specifically, we introduce TATA box mutations into promoters driving TetR expression and show that these mutations can be used to effectively tune the noise of a target gene while decoupling it from the mean, with negligible effects on the dynamic range and basal expression. We apply mathematical and computational modeling to explain the experimentally observed effects of TATA box mutations. This work, which highlights some important aspects of noise propagation in gene regulatory cascades, has practical implications for implementing gene expression control in synthetic gene networks.
INTRODUCTION
One of the primary aims of synthetic biology is to design artificial gene circuits for biotechnological, industrial and medical applications, by utilizing our understanding of natural gene networks, their regulation and the resulting cellular phenotypes. From constructing small-scale gene circuits in microbes (1–8) and coordinating cell population behavior (9,10), to the development of programmable cells (6,11–13) and the metabolic engineering of microbes for biofuel production (14,15), the last decade has witnessed a broad range of advances towards a fuller realization of this aim.
Relevant biochemical parameters and component properties within a given network design, including binding and dissociation rates, degradation rates, strength of promoter repression and basal expression levels have been used in computational models to predict and explain average gene expression levels conferred by synthetic gene circuits in engineered cell populations (1,2,16). However, in order to engineer predictable behavior through an artificially constructed gene network, the synthetic biologist must consider that cells form populations, implying the necessity of controlling ‘demographic’ aspects of gene expression. While the mean gene expression (measured over the cell population) plays a dominant role in synthetic and natural systems, the level of variability or noise in the expression of key proteins can also significantly affect the performance of synthetic gene networks as well as population fitness (17).
Noise or variability is a fundamental, inherent aspect of gene expression, and can often be attributed to the small number of molecules involved in key reactions (18–22), such as in transcription (23), chromatin remodeling (24), transcription reinitiation complexes (24,25) or the process of translation (26). Often this unpredictable feature can give rise to significant heterogeneity in gene expression across populations of cells, leading to population-wide phenotypic variation which affects differentiation (27–33), fitness (25,34–38) and may even enhance evolvability (39). Cells have evolved to suppress or amplify this inherent variability (40) through feedback loops (7,8,41–46), regulated protein degradation (47), gene dosage (20,33,45,48,49) and noise filtering within long cascades (50).
Gene expression noise may have unintuitive and important effects on population fitness, signal propagation and the functional reliability of artificial gene circuits (2). Accordingly there is a need in the synthetic biology community for systematic means to tune and control gene expression noise. Ideally, such noise-control mechanisms should be relatively straightforward to implement, allow for the control of noise levels independently of the mean and be free of undesirable pleiotropic effects.
Here, we present such a method for controlling noise in synthetic eukaryotic gene expression systems, utilizing the reduction of noise levels by TATA box mutations (24,25) and noise propagation in transcriptional cascades (21,51–53). Specifically, we establish five different yeast strains, each carrying either the wild-type or a mutant TATA box in the GAL10 promoter controlling expression of the TetR repressor in Saccharomyces cerevisiae. Overall, including these TATA box mutations resulted in significant reductions in gene expression noise from the downstream tet-regulated GAL1 (T123) promoter, as measured by flow cytometric analysis of yEGFP reporter expression. Furthermore, this reduction in noise was achieved without significant loss of repression of the downstream promoter while in the fully repressed state, thus maintaining as broad a dynamic range of gene expression as possible. We apply a recently developed modeling framework to explain and predict the experimentally observed changes in the mean and noise of reporter gene expression, thereby expanding our understanding of noise propagation in TetR-based gene regulatory cascades. Overall, the incorporation of TATA box mutations within an upstream regulatory promoter allows for a simple, effective and widely applicable method for controlling gene expression noise in inducible gene expression systems and synthetic gene networks.
MATERIALS AND METHODS
Cell strains
For all plasmid construction and amplifications, Escherichia coli strain XL10-Gold (Stratagene) was utilized. Saccharomyces cerevisiae parental strain YPH500 [(α, ura3-52, lys2-801, ade2-101, trp1Δ63, his3Δ200, leu2Δ1) (Stratagene)] served as the parental strain for all experimental strains constructed. Experimental strains were derived by transformation of YPH500 by a standard lithium acetate/carrier DNA/PEG procedure (54) using 20–100 ng of plasmid DNA. Each strain-specific plasmid was linearized within the GAL1-10 promoter region by AgeI digestion (New England Biolabs). The TRP1 selectable marker gene within the plasmids allowed for initial selection of yeast clones in synthetic drop-out media lacking tryptophan (SD-TRP). Individual positive clones were then screened for single integrations at the GAL1-10 promoter region of chromosome II by measurement of yEGFP expression by flow cytometry, and when necessary, by PCR of isolated gDNA (55) using Taq DNA polymerase (New England Biolabs).
Plasmid construction and design of GAL10 promoters
The previously used yeast integrative plasmid pRS4D12 (56) served as the template for PCR-based site-directed mutagenesis of the TATA box sequence of the GAL10 promoter within this plasmid (Figure 1A). The general cloning strategy involved PCR amplification of two products from two sets of primers (Integrated DNA Technologies). The first set of primers amplified a short (120 bp) product from the EcoRI restriction site downstream of the GAL10 TATA box to the GAL10 TATA box sequence itself. The primers for this reaction included the constant forward primer EcoRI-f (5′- CCGCCCTTTAGTGAGGGTTGAATTCG-3′) along with a reverse primer annealing at the GAL10 TATA box, which contained a single or multiple point mutations within the TATA sequence, as follows (with TATA box sequence in bold and point mutations underlined):
10TATAint1-rP [5′-P-CACAACATATATGTAAGATTAGATATG-3′];
10TATAint2-r [5′-P-CACAACAAATAAGTAAGATTAGATATG-3′];
10TATAsev1-rP [5′-P-CACAACATATTAGTAAGATTAGATATG-3′];
10TATAsev2-r [5′-P-CACAACAGCTAAGTAAGATTAGATATG-3′].
Additionally, the GAL10 TATA box reverse primer was 5′ phosphorylated for subsequent blunt-end ligation reactions. The second set of primers amplified a longer (556 bp) product from immediately upstream of the GAL10 TATA box sequence to the BamHI restriction site downstream of the GAL1 promoter, and thus amplified the GAL1 promoter region. For this reaction, plasmid pRS4D12 was used as a template for coupling the GAL10 TATA box mutations with the GAL1 promoter containing three tetO2 operator sites. The two constant primers for this reaction were the 5′ phosphorylated forward primer 10TATAm-f (5′-P-GAAATGTAAAGAGCCCCATTATC-3′) and the reverse primer BamHI-r (5′-AATAGGATCCGGGGTTTTTTCTCCTTG-3′). All PCRs used Pfu Turbo DNA polymerase (Stratagene) for amplification along with a purchased dNTP mix (New England Biolabs). Reactions were run on a PTC-100 Programmable Thermal Controller (MJ Research). PCR reactions were subsequently gel-purified using a QIAquick Gel Extraction kit (Qiagen). Following purification, each PCR fragment was digested with the appropriate restriction endonuclease (EcoRI for the GAL10 TATA containing fragment, and BamHI for the GAL1 promoter containing fragment, all New England Biolabs). After appropriate digestion, fragments and plasmid DNA were column-purified using the QIAquick PCR Purification Kit (Qiagen), and ligated together overnight at 16°C using T4 DNA ligase (New England Biolabs). This ligation product was transformed the next day into E. coli strain XL-10 Gold (Stratagene) by heat shock and plated on LB agar plates containing ampicillin for selection (all Fisher BioReagents). Escherichia coli cells had previously been made chemically competent by following standard protocols (57). Plasmid DNA was recovered from positive bacterial clones by the QIAprep Spin Miniprep Kit (Qiagen). Mutations at the GAL10 TATA box were confirmed by sequencing (Agencourt, MWG Biotech).
Figure 1.

(A) Schematic illustration of the design of the GAL10 TATA mutant strains, with T123 as the downstream promoter. (B) yEGFP mean expression from the GAL10 promoter and (C) yEGFP noise (CV) from the GAL10 promoter measured by flow cytometry. Inset: the noise strength (Fano factor) closely mirrors mean expression from the GAL10 promoter, due to the quasi-proportionality of the expression mean and standard deviation from this promoter. Overall, GAL10 TATA box mutations decreased gene expression mean and noise strength, but had little effect on the CV. The wt, int1, int2, sev1 and sev2 strains are shown in black, blue, cyan, purple and red, respectively. The error bars correspond to standard deviations calculated from three independent biological replicate measurements.
This strategy was repeatedly used to create four different plasmids, each containing a different mutation at the TATA box of the GAL10 promoter coupled with the double tetO2 operator-containing D12 GAL1 promoter (sev1-D12, sev2-D12, int1-D12 and int2-D12). Additionally, each of these plasmids was used to create similar sets with the single and triple tetO2 operator-containing GAL1 promoters, S1 and T123 (56). For this, the TATA box mutant plasmids were digested with EcoRI and AgeI restriction endonucleases, while the plasmid pRS4S1 was digested with EcoRI and BamHI. This produced fragments containing the mutant TATA GAL10 promoters, which were then gel-purified and ligated into the similarly digested plasmids pRS4S1 and pRS4T123, yielding plasmid sets sev1- S1, sev2- S1, int1- S1, int2- S1, and sev1-T123, sev2-T123, int1-T123 and int2-T123.
In addition, several control plasmids were constructed to quantify directly the effect of mutations in the TATA box of the GAL10 promoter on gene expression from this promoter. The steps for constructing these control plasmids are described in the Supplementary Data.
Media and growth conditions
For all transformations, yeast synthetic drop-out plates lacking tryptophan (SD-TRP) and containing 2% glucose were used for selective growth. Plates were made with 6.7 g/l yeast nitrogen base without amino acids (Sigma), 1.92 g/l yeast SD-TRP (Sigma), 38 mg/l adenine (Sigma), 15 g/l agar (Fisher BioReagents), 100 ml 20% stock d-glucose (Fisher BioReagents), and water to a total volume of 1 l. Media was sterilized by autoclaving for 30 min, then poured into round Petridishes, and cooled. After transformed cells were spread onto these plates, they were kept in a static incubator at 30°C for 2–3 days until colonies of sufficient size were detectable.
Liquid cultures for strains used in all experiments were prepared in SD-TRP medium containing 2% galactose (Fisher BioReagents). Liquid media was prepared the same as above for plates, except without agar and with galactose replacing glucose.
Frozen stocks of all strains were prepared by growing strains overnight from an OD600 of ∼0.01 in SD-TRP containing 2% glucose to a final OD600 of ∼1. A 1.218 ml of this culture was then added to a sterile cryogenic vial containing 282 μl of 80% glycerol (final concentration 15%) (Fisher BioReagents) that had been sterilized with a 0.2 μm filter. Vials were inverted to mix contents and kept at −80°C for long-term storage.
For experiments involving yEGFP induction from the GAL1 (or GAL10) promoters, single yeast colonies for each strain were picked from SD-TRP plates containing 2% glucose and used to inoculate 3 ml SD-TRP media containing 2% galactose. These selected colonies were then grown overnight at 30°C with 300 r.p.m. orbital shaking until reaching an OD600 of 1.0–1.5, as measured on a Tecan SpectraFluor Plus instrument set in absorbance mode. A triplicate set of 3 ml SD-TRP cultures containing 2% galactose and anhydrotetracycline (ATc) was then inoculated by the initial culture to an OD600 of 0.01 and incubated overnight at 30°C with 300 r.p.m. orbital shaking. After 16–20 h, cultures reached an OD600 of 0.5 ± 0.2 and were then assayed for yEGFP expression by flow cytometry. ATc (ACROS Organics) was kept as a stock solution of 5 mg/ml in ethanol at −20°C. A diluted working stock of 50 ng/μl (in sterile water) was added to SD-TRP media for experiments. Wild-type GAL10 strains S1, D12 and T123 were assayed across a range of 0–250 ng/ml ATc. Strains with GAL10int2 and GAL10sev2 were assayed across a range of 0–20 ng/ml ATc, and strains containing GAL10int1 and GAL10sev1 were assayed across a range of 0–50 ng/ml ATc.
Flow cytometric analysis of gene expression
Following overnight growth at 30°C with shaking, cultures were taken out upon reaching an OD600 of 0.5 ± 0.2. One milliliter of each induced culture was transferred into a 1.5 ml microcentrifuge tube and centrifuged at 8000 r.p.m. for 1 min. The supernatant was discarded and the pellet was resuspended in 500 μl of 0.22 μm filtered PBS (Fisher BioTech, pH 7.4). Samples were then assayed for yEGFP expression using a Becton Dickinson FACSCalibur instrument with a 15 mW 488 nm argon-ion laser and a 515–545 nm emission filter (FL1-H). Voltage settings used were as follows: P1, E-1; P2, 300; P3, 575; P4, 491; and P5, 834. Additionally, the threshold value for forward scatter was set to zero. Samples were run on a low flow rate to maximize resolution of signal from each cell. Samples were run long enough for collection of total populations in the range of 105–106 individual cells. Flow cytometry data files were then analyzed using Matlab (The MathWorks, Inc.). Analysis of samples was conducted on cells within a small forward- and side-scatter gate (35–45 × 55–65), allowing for examination of at least 5000 cells of similar size, shape and point in the cell cycle. The mean and standard deviation were calculated for each sample. Finally, the noise (coefficient of variation, CV) was computed for each sample as the standard deviation normalized by the mean.
Inducer pulse time-course experiments
A single colony for each strain was used to inoculate 3 ml SD-TRP media containing 2% galactose, and grown overnight as before. Following overnight growth, this culture was used to inoculate six different sets of 3 ml SD-TRP liquid cultures, each set in triplicate (18 total cultures) at an OD600 of 0.01. The six triplicate sets of cultures were then grown overnight again until reaching an OD600 of 0.6 ± 0.2. At this point, ATc at a concentration of 50 ng/ml was added to each of six different sets of triplicate yeast cultures, each grown at 30°C with shaking with ATc for 30, 15, 10, 5, 2 and 0 min (no ATc added). At the end of the indicated ATc pulse duration, all cultures were centrifuged at 8000 r.p.m., and washed in sterile water twice. Yeast pellets were then resuspended in fresh SD-TRP media without any ATc. Cultures were then returned to the 30°C shaking incubator. At various time-points (0, 1, 2, 4 and 6 h) following the removal of ATc containing media, 250 µl from each liquid culture was transferred into a 1.5 ml microcentrifuge tube and centrifuged at 8000 r.p.m. for 1 min. The pellet was resuspended in 500 μl of 0.22 μm filtered PBS and examined by flow cytometry as before.
Analytical noise approximations and predictions of reporter gene expression
Our analytical predictions were based on the system of equations from (46):
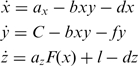 |
(1) |
where x is free intracellular TetR concentration, F(x) is a Hill function with parameters n and θ, y is free intracellular ATc concentration and z is yEGFP reporter concentration. Solving this system determines the three unknowns x, y and z as a function of the molecular parameters ax, az, b, d, f, l and the control parameter C, which represents the influx of ATc through the cell membrane. Therefore, the steady-state solution z(C) represents the dose-response of the gene regulatory cascade (see the Supplementary Data), which was fit to the experimentally measured wild-type dose-response applying the simplex method based on the Nelder–Mead algorithm in Matlab (MathWorks, Inc.). We kept the parameter values obtained from nonlinear fitting unchanged, except the upstream promoter strength (parameter ax), which was decreased proportional to the average fluorescence measured when yEGFP expression was driven by the various GAL10 mutant promoters.
To obtain analytical noise predictions, we employed approaches analogous to the fluctuation–dissipation theorem in statistical mechanics described by Paulsson (58), which can be used to derive the magnitude of fluctuations in biochemical reaction networks assuming that the noise is relatively small. This leads to the following equation for the covariance matrix:
| (2) |
where matrix A represents relaxation dynamics to equilibrium, defined by  , with
  representing the mean concentration of species i; the matrix B represents randomness of biochemical events, defined as
  , with vjk representing the number of j molecules that change in the k-th reaction, at the macroscopic rate Rk; Ω is the average cell volume, and finally, the matrix σ represents a matrix of covariances between variables x, y, z [see the Supplementary Data for the detailed form of Equation (2) and how it was solved].
Stochastic simulations
Stochastic simulations for wild-type GAL10-controlled TetR strains were performed based on an augmented version of the deterministic model [Equation(1)], where parameters were derived by fitting the theoretical dose–response function z(C) to the experimental dose-response, using known constraints on certain reaction rates, such as TetR-DNA binding/unbinding, TetR-ATc binding, ATc-membrane diffusion, and RNA and protein degradation rates. TetR dimerization was assumed to be much faster than other processes (41,59). The GAL10 and T123 activation and inactivation rates (a0, α0, a and α) were fit to reflect observed mean and noise values at maximal expression using Paulsson’s equations approximating protein-level fluctuations driven by underlying promoter and mRNA fluctuations (58). The upstream GAL10 promoter was modeled as having two states corresponding to TBP unbound and TBP bound to the TATA box, respectively. The downstream T123 promoter was modeled with eight promoter states corresponding to the binding of 0–3 TetR molecule times the two states associated with TBP. Using these parameters and the simulation tool Dizzy (60), 5000 Gillespie simulations (61) were individually run for a simulated 12 h and used to predict downstream yEGFP mean and noise (see the Supplementary Material for full details of rate constants and the Dizzy model).
RESULTS
Construction of gene expression cascades with GAL10 TATA mutant promoter sets
We established five different yeast strains (Figure 1A), each carrying a chromosomally integrated synthetic gene expression cascade based on the bidirectional GAL10-GAL1 promoter (23,25,56) to examine the influence of mutations at the TATA box of an upstream regulator's promoter on the expression of the downstream promoter under its regulation. In each of these gene regulatory cascades, the expression of the fluorescent reporter yEGFP could be regulated by the TetR repressor binding to three tetO2 operator sites inserted into the GAL1 promoter of S. cerevisiae (renamed to T123) between the TATA box and the transcription start site (56). The DNA binding activity of the repressor TetR (expressed constitutively from the GAL10 promoter) could be controlled by adding various concentrations of the inducer ATc to the growth medium. ATc diffuses into the cells and prevents TetR from binding to the tetO2 sites and repressing yEGFP (Figure 1A) (23,25,56).
The only genetic difference between these yeast strains was in the TATA box of the GAL10 promoter controlling tetR expression. Based on the effect of these mutations on GAL10 expression (Figure 1B), the GAL10 promoter variants and the strains carrying them were named GAL10wt (wild type), GAL10int1 (intermediate-1), GAL10int2 (intermediate-2), GAL10sev1 (severe-1) and GAL10sev2 (severe-2), indicating that the wild type and four mutant TATA sequences were used. Specifically, the four GAL10 mutants were constructed from the wild-type GAL10 TATA box by: an A→T transversion at position five in int1, a T→A transversion at position one in int2, an A→T transversion at position four in sev1, and finally, a TA→GC double transversion in sev2 (Figure 1A). We named these cascades according to the convention [upstream promoter] − [downstream promoter]; for example, GAL10sev1-T123 indicates that the GAL10sev1 promoter controlled TetR expression, and the T123 promoter controlled yEGFP expression. Since TATA box variants in this article always refer to the GAL10 promoter, and since we mainly focus on cascades with the T123 promoter downstream, in most cases we removed ‘GAL10’ from the name of the upstream promoter and dropped the name of the downstream promoter to simplify notation. For example, the GAL10sev1-T123 cascade will be simply referred to as sev1.
In addition to this set of engineered gene regulatory cascades, a corresponding set of control promoters were constructed to allow for measurements of gene expression directly from all five GAL10 promoter variants. To achieve this, the tetR gene was replaced by the yEGFP reporter gene in each GAL10 promoter variant strain. We have also truncated the yEGFP gene at T123 to a nonfunctional form so that only expression at GAL10 was measured.
Effect of TATA box mutations on the GAL10 expression mean
Fluorescent reporter gene yEGFP expression was measured in triplicate by flow cytometry for the five S. cerevisiae strains, each carrying one of the GAL10 control constructs (Figure 1B) at fully inducing 2% galactose. As shown in Figure 1B, the mutations in the GAL10 TATA box had considerable effects on the mean of yEGFP expression from the GAL10 promoter. The wild-type GAL10 promoter (in black) had the highest expression with an FL1 value of 143.43 ± 6.80 arbitrary fluorescent units (AFU). As expected based on earlier work by our group and other groups (24,25,62–64), mutations at the TATA box of GAL10 resulted in either intermediate or substantial reductions in mean expression from this promoter, prompting the nomenclature of the GAL10 promoters (Figure 1A and B). Specifically, the expression of the mutant strains were 61.78 ± 4.02, 30.41 ± 1.01, 14.37 ± 0.83 and 14.66 ± 0.33 AFU for int1, int2, sev1 and sev2, respectively, corresponding to a reduction of 57%, 80%, 90% and 90%, compared to the wild-type GAL10 promoter (Figure 1B).
Effect of TATA box mutations on GAL10 expression noise
In addition to examining the effect TATA box mutations had on the mean GAL10 expression level, we also measured their effect on gene expression variability, or noise (25), of the GAL10 promoter. To quantify the noise, we calculated the CV for each population sample as the standard deviation of the population divided by the population mean, using a narrow forward- and side-scatter gate to minimize extrinsic contributions from cell size, cell cycle phase, etc. As seen in Figure 1C, there is little, but still statistically significant, difference [at P < 0.01 using Statistica’s ‘multiple comparisons of mean ranks for all groups’ nonparametric test (65)] in the CV plotted for all five GAL10 control promoters, except int2 and sev1. Specifically, the measured values for these control promoters were: 0.162 ± 0.007 for wt (in black); 0.147 ± 0.005 for int1 (in blue); 0.168 ± 0.004 for int2 (in cyan); 0.169 ± 0.006 for sev1 (in magenta); and 0.179 ± 0.004 for sev2 (in red) (Figure 1C). Contrasted with the considerable differences in gene expression mean, the similarity of CV values indicates that the standard deviations of GAL10 expression (data not shown) tend to change proportionally with the mean. To illustrate this proportionality, we calculated the noise strength (Fano factor) of each GAL10 variant, defined as the CV multiplied by the standard deviation. Given the minimal differences in CV at GAL10, the noise strength was proportional to the mean, and relative changes in the noise strength closely mirrored the decreasing means and standard deviations of each mutant GAL10 promoter (Figure 1B and C). Specifically, the noise strength values were 3.79 ± 0.24, 1.35 ± 0.15, 0.86 ± 0.03, 0.41 ± 0.02, and 0.47 ± 0.03, respectively, for the wt, int1, int2, sev1 and sev2 promoters. The decrease in noise strength values due to increasingly severe GAL10 TATA box mutations obtained from our gated data are consistent with a previous study measuring the intrinsic noise strength of the PHO5 promoter with TATA box mutations in S. cerevisiae (24).
To explain why the significant variation in mean expression following GAL10 TATA box mutations result in only minor differences in noise, we estimated promoter activation and inactivation rates (a0, α0) by fitting to our data Paulsson’s formula approximating protein-level fluctuations driven by underlying promoter and mRNA fluctuations (58). The parameters obtained from this fit suggest that TATA box mutations speed up GAL10 promoter activation and deactivation, with a stronger effect on the latter. As a result, the promoter quickly activates, but then it deactivates even faster so that mean GAL10 expression is decreased in the TATA box mutants (Figure 1B). The relatively unchanged GAL10 noise (Figure 1C) can be explained by a shift in the primary noise source: whereas slow promoter dynamics generates most of the noise for the wild-type TATA box, the noise of severe TATA box mutants originates primarily from the stochastic processes of protein production and degradation (see Supplementary Material for a full discussion and derived rates).
Ultimately, these observations serve as an indirect estimate of total TetR expression levels from the five different GAL10 promoters in the subsequent experiments discussed below where yEGFP expression was measured downstream, from the tet-regulated T123 promoter.
The effect of GAL10 TATA box mutations on T123 dose-response
T123 basal and maximal expression level
Since basal expression is an important property of gene expression systems that experimenters typically strive to minimize, we examined whether introducing GAL10 TATA box mutations would increase T123 basal expression measured at 0 ng/ml ATc (Figure 2A). While we observed a slight increase in basal expression with the severity of GAL10 TATA box mutations, the basal T123 expression remained very low for all strains. Specifically, the expression levels for the wt, int1, int2, sev1 and sev2 strains were 1.75 ± 0.03 AFU, 2.22 ± 0.07 AFU, 2.94 ± 0.03 AFU, 3.73 ± 0.05 AFU and 5.02 ± 0.14 AFU, respectively. To better reflect the change in the dynamic range, the basal expression levels expressed as a percentage of the maximum expression level from the synthetic T123 promoter were 0.26% (±0.005), 0.34% (±0.01), 0.42% (±0.005), 0.55% (±0.008) and 0.73% (±0.02), respectively. At the same time, the maximum T123 expression levels at full induction (250 ng/ml ATc) were practically unaffected by the GAL10 TATA box mutations (Figure 2B). Taken together, these data indicate that the GAL10 TATA box mutations have practically no effect on the dynamic range of expression from the T123 promoter.
Figure 2.

Mean yEGFP expression levels from the T123 promoter for different upstream GAL10 TATA box variants. (A) Basal yEGFP expression means at no induction (ATc = 0 ng/ml) and (B) fully induced yEGFP expression levels, showing a dynamic range insensitive to the strength of the upstream GAL10 promoter variant. (C) Experimental and simulated and (D) analytically determined dose-responses at intermediate levels of induction show a leftward shift and increased sensitivity to ATc with various upstream tetR promoters. The meaning of the colors and the error bars are the same as in Figure 1.
T123 dose-response—increased sensitivity to inducer
Considering that we have previously measured the dose-response of the T123 promoter (56), we asked whether we could predict analytically and computationally the effect of TATA box mutations in the GAL10 promoter on the dose-response of the gene regulatory cascade. We applied a system of three equations in three unknowns [the concentrations of the free repressor x, of the intracellular inducer y and the reporter z; see Equation (1) in the ‘Materials and Methods’ section] that we recently developed to model tet-inducible gene expression systems (46). The dependence of solutions on the control parameter C (rate of inducer influx into the cell) generates a theoretical dose–response function z(C) that can be compared with the experimental dose–response curves. We learned all the parameters in system [Equation (1)] by fitting the T123 dose-response measured for the wild-type GAL10 promoter. Next, we varied parameter ax, corresponding to the GAL10 promoter strength, while keeping the rest of the parameters unchanged to calculate the dose-response z(C) corresponding to the four GAL10 TATA box mutants. The model predicted that the dynamic range of the T123 dose-response should remain practically unaltered, while the induction threshold (the ATc concentration corresponding to half-maximal induction) should gradually decrease for severe TATA mutants. Moreover, the model predicted a linear dependence between GAL10 promoter strength and the ATc concentration at which half induction occurred (see the Supplementary Data).
Indeed, the experimentally measured T123 dose–response curves shift to the left depending on the severity of GAL10 TATA box mutations. Strains with higher GAL10 expression levels have higher induction thresholds, in agreement with the computationally predicted dose–response curves (Figure 2C). To quantify the leftward shift in the T123 dose–response curves, we estimated the experimental ATc concentration at which half-maximal induction occurred by linear interpolation. The resulting values (39.6, 17.2, 6.5, 4.1 and 3.4 ng/ml ATc for wt, int1, int2, sev1 and sev2, respectively) had a nearly perfect linear dependence on upstream promoter strength, with a correlation coefficient ρ = 0.9986 (Figure 4A).
Figure 4.

Inducer sensitivity of downstream gene expression due to upstream promoter mutations. (A) The induction threshold (inducer concentration necessary for half-maximal yEGFP expression) is plotted against GAL10 promoter strength (estimated by yEGFP expression from the GAL10 promoter). Parameters for the system of equations were obtained from wt-T123: ax = 86 nM h−1, b = 4 nM−1h−1, C = 3.2219 [ATc] h−1, f = log(2)/(45/60) h−1, l = 1 nM h−1, n = 1.088, θ = 0.3957, d = 0.3 h−1, and predictions were made by varying upstream promoter strength from ax = 0.86 to 86.0 nM h−1. (B) Active (free) TetR noise plotted as a function of the mean of active TetR, calculated for all GAL10 TATA variants. The levels of free TetR noise maintain the same order as at no induction. (C) Plot of relative maximum yEGFP noise as a function of relative upstream standard deviation. Parameters for the simplified model were obtained from fitting the experimental dose-response data for wt-T123, and predictions were made using the Fluctuation Dissipation Theorem assuming a constant upstream CV while varying upstream promoter expression and standard deviation. (D and E) illustrate the depletion of active intracellular TetR pool due to increasing ATc influx. Simulated active TetR levels for (D) wt and (E) int1 strains. Total TetR (bound + unbound) remains constant, regardless of ATc.
In summary, while the TATA box mutations at the upstream GAL10 promoter controlling tetR expression do not alter the dynamic range of T123 dose-response (i.e. they only have a negligible effect on basal expression, and no significant effect on maximum expression), these mutations cause a systematic leftward shift in the dose–response curves, strongly increasing the overall sensitivity of this synthetic GAL10-T123 expression system to the inducer ATc.
The effect of GAL10 TATA box mutations on T123 noise levels
Reduction in T123 noise levels
In addition to examining the effect GAL10 TATA box mutations had on T123 mean levels of expression through the full range of dose-responses, we also examined their effect on the level of T123 gene expression noise. Once again, we made theoretical predictions of the T123 expression noise based on the experimentally measured GAL10 expression mean and noise. Keeping all of the parameters unchanged for each GAL10 TATA box mutant, we employed linear noise approximations based on the fluctuation–dissipation theorem (FDT) in statistical mechanics (58) to derive the magnitude of fluctuations in T123 expression. Taking into account GAL10 expression mean and noise measurements, and keeping all parameters unchanged, we used Equation (2) to calculate yEGFP expression noise from the T123 promoter (see the ‘Materials and Methods’ section). In addition, we also performed stochastic simulations of a more comprehensive set of reactions to predict and explain the effect of GAL10 TATA box mutations on T123 expression mean and noise (see the ‘Materials and Methods’ section and Supplementary Data for a more detailed discussion of these methods). Both methods predicted noise curves with a peak at intermediate ATc concentrations. Moreover, the models predicted that noise peaks would occur at lower ATc concentrations with decreasing peak heights as GAL10 TATA box mutations became increasingly severe (Figure 3A and B).
Figure 3.

Noise of yEGFP expression from the T123 promoter as measured by the CV plotted against inducer (ATc) concentration for (A) experimental data and simulated results, and (B) analytically derived predictions. (C) CV plotted against experimentally determined mean yEGFP fluorescence levels. The meaning of the colors and the error bars are the same as in Figure 1. The green line shows where gene expression mean and noise can be experimentally decoupled, so that noise is changed 5-fold, while mean remains invariant.
The experimentally measured noise curves (Figure 3A) had low noise at zero induction, followed by a sharp increase in CV at low to intermediate ATc concentrations, and finally a decrease in CV to a low noise level near full induction, in agreement with the computational predictions. Moreover, the noise peak position and height also decrease for various mutant GAL10 TATA box promoters, as predicted, with noise peaks occurring at 20, 11.5, 4.0, 2.5 and 2.0 ng/ml ATc for wt, int1, int2, sev1 and sev2, respectively. The peak height decreases as the peaks shift leftwards, in consensus with the model, depending on the severity of the GAL10 TATA box mutation (Figure 3B).
Noise in yEGFP expression from the T123 promoter can have contributions from multiple sources (51), including intrinsic noise, global noise and extrinsic noise due to cell-to-cell variations in active TetR levels. Importantly, our yEGFP noise measurements from the GAL10 promoter (Figure 1C) can only estimate TetR noise in the absence of inducer, and cannot account for TetR noise levels when ATc diffuses into cells and gradually depletes the pool of active TetR dimers. On the other hand, our computational models explicitly incorporated active TetR [(species x in Equation (1), see the 'Materials and Methods' section] and gave us interesting insights on the origins of downstream fluctuations as noise propagates through our gene regulatory cascades, while the TetR repressor is gradually sequestered by ATc. Starting from constant TetR noise in the absence of ATc (as observed in Figure 1C), we calculated the mean, standard deviation and noise of active TetR for the five GAL10 variants at increasing ATc concentrations. The results suggest that active TetR means decrease faster than TetR standard deviations, leading to increasing repressor noise in all strains as the active TetR pool is depleted at various ATc concentrations for the five GAL10 variants (Figure 4B). However, the TetR standard deviation in the wt strain remains the highest at all ATc concentrations, followed by the mutants in the order shown in Figure 1B and C. Consequently, the wt strain will experience maximal extrinsic repressor noise when TetR is nearly depleted, explaining the decreasing noise peak heights for increasingly severe GAL10 TATA box mutations. Specifically, we predicted that downstream (yEGFP) peak noise should approximately follow the relationship  , which was indeed in good agreement with our experimental measurements (see Figure 4C and the Supplementary Data).
In addition to plotting the CV as a function of inducer concentration, we also examined the noise of each GAL10 TATA box mutant as a function of the mean, obtaining the mean–noise characteristics shown in Figure 3C. If these characteristics are nonoverlapping, then they can be used to decouple gene expression noise from the mean in two separate cell populations (25,56). Moreover, these characteristics may provide a fairer and more concise account of the effect of GAL10 TATA box mutations since they present simultaneously in the same graph the mean and noise for each strain. While every mean–noise characteristic had a peak at intermediate mean expression levels, the mean–noise characteristics were clearly nonoverlapping. Therefore, a certain mean expression level on the horizontal axis corresponds to different noise levels in various strains. Consequently, by adjusting the inducer concentration, two separate cell populations can be designed to have identical means, but different gene expression noises. This effectively decouples the noise from the mean, since these gene expression properties can now be tuned independently from each other in different strains, using appropriate inducer concentrations, as we have demonstrated recently (25).
We have shown recently that the number of tetO2 sites in the downstream promoter play a key role in shaping the overall dose-response and noise characteristics of the gene regulatory cascade (56). To further validate that the above observations are robust with respect to the number of tetO2 sites in the regulated GAL1 promoter, we subsequently replaced the triple operator containing T123 promoter with either the double operator containing (D12) or the single operator containing (S1) promoter (56) for each TATA box variant. We measured the dose-response and noise of the resulting 10 regulatory cascades by flow cytometry, as described for the T123 promoter. The results (summarized below, and presented in detail in the Supplementary Data) indicate that the general effects of GAL10 TATA box mutations are independent of the number of tetO2 sites in the target promoter.
The sets of S1 and D12 dose-responses maintained the relative leftward shifts and noise reduction as the severity of TATA box mutations increased, in a manner consistent with the T123 dose-response. Again, the half-maximal induction points of these curves had a linear dependence on GAL10 expression levels (see the Supplementary Data). The main differences between the sets of five S1, D12 and T123 dose-responses were that S1 noise consistently peaked at a higher mean expression level, and had consistently lower peak CV levels, at around 50% of the D12 and T123 strains. Perhaps this doubling of peak noise can be accounted for by the relative steepness of D12 and T123 compared to S1 promoter response. Comparing dose-responses across each TATA box mutant, the D12 and T123 promoters had higher levels of noise and S1 had the least abrupt dose–response curve, as described previously (56).
Effect of GAL10 TATA box mutations on the gene expression response to an inducer pulse
Since synthetic gene circuits and gene expression systems may need to function in a dynamic environment including exposure to pulses, step functions, or random inducer fluctuations, we measured the pulse response of regulatory cascades with various GAL10 TATA box mutations. Exposing the wt, int1 and int2 TATA box mutant strains to transient pulses of the inducer ATc, we examined how the duration of exposure to inducer molecules would affect yEGFP expression during time-course measurements. Yeast strains harboring these constructs were initially grown overnight in the absence of the inducer ATc. Triplicate cultures were then subjected to a short, transient pulse of ATc at a fixed concentration slightly higher than the induction threshold for wt (50 ng/ml) for six different durations (0, 2, 5, 10, 15 and 30 min). Following exposure to inducer, cultures were washed twice and resuspended in fresh media lacking ATc. These cultures were then assayed for yEGFP expression from the synthetic T123 promoter over time, beginning at the onset of removal of inducer ATc (0 h) to 1, 2, 4 and 6 h post-removal.
As shown in Figure 5A–C, the GAL10 TATA box mutations had a strong effect on the population mean of gene expression response to inducer pulses of various lengths. Overall, the pulse responses were either flat or had a peak, suggesting a transient increase in yEGFP expression, followed by a drop towards full repression. However, the pulse responsiveness of various GAL10 variants was markedly different. For example, the strain carrying a wt GAL10 TATA box revealed a negligible or very minimal response to most of the six different ATc pulses, except for a slight increase following the 30-min ATc pulse, where the mean expression level increased from 2.27 ± 0.04 AFU at 0 hours to a peak expression of 2.36 ± 0.10 AFU at 2 h post-induction, followed by a gradual decrease to a mean of 2.17 ± 0.04 AFU at 6 h post-induction (Figure 5A). For ATc pulse lengths of 0–15 min, the fluorescent measurements decrease slightly, which is likely due to yEGFP fluorescent signal or ATc autofluorescence decaying over time. We observed a similar, but more pronounced response for the int1 strain, (Figure 5B), indicating that tetR expression from the int1 promoter was still sufficient to maintain strong repression of the T123 promoter. We observed a very different result for the int2 pulse response time-course (Figure 5C). For this TATA box mutant, the population mean of T123 expression increases significantly in time for all pulse durations, including pulses of 5 min. The pulse response was especially pronounced for longer pulses, reaching peak response levels of 148.44 ± 6.63 AFU and 186.31 ± 2.80 AFU at 1 and 2 h post-induction, respectively. Overall, these time-course measurements revealed an increasing intensity of pulse response with the severity of GAL10 TATA box mutations.
Figure 5.

Time courses of yEGFP expression mean and noise due to inducer removal after 0–30 min of pre-induction in 50 ng/ml ATc. The yEGFP expression mean for wt (A), int1 (B), and int2 (C), indicates how ATc can more quickly sequester small TetR pools so that transient inducer sensitivity is increased. The yEGFP expression noise (measured as the CV) for wt (D), int1 (E) and int2 (F) peaks at intermediate time points for all three strains.
In order to better understand these experimental pulse–response trends, we simulated these three strains (wt, int1 and int2) using the model described by Equation (1) (see the ‘Materials and Methods’ section), incorporating the parameters derived for the steady-state measurements. The results of these simulations were in good agreement with the experimental data (see Supplementary Figure S8), and suggest the interplay between TetR expression and ATc influx as the most important mechanism for explaining the main features of the pulse–response time-courses. We found that maximal levels of yEGFP expression depend on the length of time for which the free intracellular TetR pool is depleted by ATc molecules diffusing into the cell, so that longer pulses or lower TetR expression result in higher peak downstream expression. Conversely, the speed of repression following the transient increase in yEGFP expression is explained by the rate at which newly synthesized TetR molecules sequester the free ATc pool remaining within the cell after transfer, as well as the rate of yEGFP degradation/dilution. These two relationships thus explain the observations that the peak height of transient yEGFP expression is positively correlated with preinduction time, while both the peak height and the rate of repression are negatively related to the GAL10 promoter strength.
In addition to examining the effects of GAL10 TATA box mutations on the pulse response of gene expression in TetR-based regulatory cascades, we also examined how these mutations influenced the level of gene expression noise (Figure 5D–F). Similar to the mean expression, cells carrying the wt GAL10 promoter showed no significant change in noise levels for ATc pulse lengths below 30 min, while the 30 min ATc pulse caused an increase in population heterogeneity. The overall level of gene expression noise increased slightly for short inducer pulses and significantly for the 30 min ATc pulse in the int1 mutants, compared to wt (Figure 5E) Finally, a much broader array of noise levels and population heterogeneity was observed for the various inducer pulse durations for cells carrying the int2 promoter construct (Figure 5F), demonstrating how reduced tetR expression from a more severe TATA box mutant alters noise-level dynamics upon exposure to different inducer pulse durations. Specifically, we observed a CV increase for ATc pulse durations as short as 2 min (Figure 5F), with maximum CV values as high as 1.26 ± 0.27 at 2 h post-induction. However, in stark contrast to the other two mutants, we observed very low noise following the 30 min pulse duration (Figure 5F), as expected based on the active TetR levels in this strain.
Overall, these noise measurements demonstrate that the GAL10 TATA box mutations affect transient gene expression noise following inducer pulses of various durations. Wild type and int1 noise levels were affected only by the longest (30 min) ATc pulses, while int2 noise levels were maximal for intermediary (10 min) pulse durations, peaking at 1–2 h post-induction. This unintuitive noise behavior can most likely be explained as resulting from TetR depletion being just sufficient to slightly relieve T123 repression in a certain population of cells, thus resulting in a noise peak.
DISCUSSION
By introducing TATA box mutations into the upstream (GAL10) promoter of synthetic gene regulatory cascades and developing a systematic means to control gene expression noise, we sought to achieve several goals. First, we aimed to determine the effect of TATA box mutations on gene expression from the GAL10 promoter itself. Our second and main goal was to determine how these mutations affect several key population-level gene expression characteristics, with specific focus on gene expression noise. In addition to controlling the noise in the expression of a target gene, we have also considered two characteristics of the dose-response: (i) the basal expression and (ii) the dynamic range. Our third and final goal was to examine if the gene expression noise and mean can be decoupled, e.g. if they can be independently controlled using our newly engineered gene expression cascades. To study fitness differences between cell populations due to noise separately from the effects of the gene expression mean, these two gene expression properties must be decoupled, i.e. they should be independently controlled. These goals were motivated by several recent studies suggesting a fitness benefit due to the population-wide phenotypic variation introduced by gene expression noise (25,36).
With these objectives in mind, we constructed three quintuplets of synthetic gene regulatory cascades based on the GAL1 and GAL10 promoters of S. cerevisiae. Each quintuplet consisted of five minimally different (only by one and two base pairs) TATA box variants of the GAL10 promoter controlling TetR repressor expression. The quintuplets differed from each other in the number of tetO2 operator sites inserted into the GAL1 promoter controlling the expression of the reporter yEGFP. In addition, we constructed five control strains expressing yEGFP from the five different GAL10 promoter variants, to measure gene expression directly from the upstream promoter.
In the control strains, we observed decreases in yEGFP expression levels due to TATA box mutations in the GAL10 promoter, which was expected since these point mutations had been specifically modeled after mutations previously incorporated in the GAL1 TATA box, where similar reductions in gene expression were observed (25). In general, it has long been known that the TATA box can play a key role in transcription initiation and TATA box mutations can result in a less efficient promoter with reduced expression (62,64). While largely consistent with previous studies in yeast (24,25), the specific base substitutions we introduced at equivalent positions in the GAL10 TATA box did not produce the same impact on gene expression, illustrating that a given mutation can affect individual promoters differently.
In contrast to the significantly lower mean expression in GAL10 TATA box mutant cells, the GAL10 expression noises remained low and were similar (but distinct) for all strains, likely due to two different reasons. First, growing the cells in 2% galactose-containing medium ensured constitutive, maximal expression from GAL10 in our synthetic constructs, lowering the noise. Higher discrepancies in GAL10 expression noise may be revealed at intermediate induction, as in our previous work. Second, slow degradation of yEGFP (used as a proxy instead of TetR to estimate GAL10 promoter efficiency) filters out fast fluctuations from promoter activation or mRNA production events, thereby reducing the CV closer to the baseline. The differences in CV for GAL10 were small though statistically significant, which we think is due to different contributions from several noise sources. Applying a formula that connects protein noise to the underlying processes (promoter activation/deactivation and mRNA and protein synthesis and degradation) suggests that rare promoter deactivation events coupled with strong protein synthesis are the prime source of noise for the wild-type GAL10 promoter. In contrast, the main source of noise for severe TATA box mutants appears to be fast promoter dynamics coupled with low protein production in these mutants.
Since the main goal of this study was to determine how GAL10 TATA box mutations affect the ‘demographic’ characteristics of yEGFP expression from the T123 promoter, next we discuss in detail the various aspects of these findings. Specifically, we focus on yEGFP basal expression, dynamic range and gene expression noise, all of which are important if the synthetic regulatory cascades are to be used for controlling gene expression across a cell population.
We sought to explain the observed differences in yEGFP expression through mathematical and computational modeling. This was necessary to infer since there are no direct ways to measure inducer-bound TetR separately from free TetR dimers capable of repressing the T123 promoter. The good agreement between our model and the experimental data indicate that free TetR levels in single cells depend on two key molecular factors: the rate of inducer influx and episodic TetR production controlled by the GAL10 promoter sequence. ATc molecules entering the cell bind and inactivate free TetR dimers, depleting the TetR pool capable of repression. Therefore, once the TetR pool is depleted, new TetR molecules must be synthesized for repression to be possible. The GAL10 TATA box mutations determine the periods of productive and silent promoter states. Importantly, the inducer molecules dissociate from TetR very slowly (66,67)—practically never, considering the time scales of other molecular processes. These considerations, and their implications from our model, explain most of yEGFP’s behavior from the downstream T123 promoter.
Our first functionally important finding is that the severe reductions in TetR repressor levels due to the GAL10 TATA box mutations did not increase T123 basal expression levels significantly. Strong and tight repression is often necessary for achieving stable OFF states in many synthetic gene circuits, inducible switches and devices (1,2,68–70), and in functional genetics studies of genes encoding toxic proteins (68,71). We observed a systematic, but still slight increase in T123 basal expression following mutations of the GAL10 TATA box controlling tetR gene expression (Figure 2A). Even for the two most severe GAL10 TATA box mutants (sev1 and sev2) with approximately 10% tetR production compared to wild type, T123 basal expression stayed at less than 1% of maximal expression. This slight increase in basal expression suggests that TetR dimers dissociating from the DNA take longer to replace in TATA box mutant cells. Nevertheless, TetR is an extremely strong and efficient repressor that, even in low concentrations, can reliably shut down the expression of target genes. Therefore, in the future, synthetic biologists can adjust gene expression noise by reducing the strength of the promoter encoding the repressor TetR, without being concerned about changing the basal level of downstream gene expression.
Maximal T123 expression when fully induced was not significantly affected by the strength of the tetR promoter (Figure 2B), indicating that the repressor activity of TetR molecules was completely abolished by ATc. Therefore, there was practically no reduction in dynamic range due to the GAL10 TATA box mutations. This result becomes important when compared to prior studies, where GAL1 (downstream) TATA box mutant noise reductions were tied to large reductions of maximum expression (25). In contrast, in this study, we were able to maintain as broad a dynamic range as possible from the promoter of interest (T123) by transferring the TATA box mutations upstream to the GAL10 promoter. This maintenance of maximal expression levels and overall dynamic range can be important for synthetic gene expression systems, especially in functional genetics studies or within engineered microbes that need to produce industrially important protein products, enzymes and chemicals (14,15) at user-specified rates.
In view of future applications for population-wide gene expression control, one of the more important effects of upstream TATA box mutations is the noise reduction observed downstream, at the level of the T123 promoter. This is relevant because high levels of gene expression noise can have negative effects on the fidelity of information flow in synthetic or natural gene networks (2). Accordingly, several techniques have been employed to reduce noise in gene expression, including negative feedback loops (29,41,44,46), alterations of cell volume (29), temperature (8), coexpression (72) and direct TATA box mutations (25). While in our case the noise peaked at some intermediary inducer concentration for all TATA box mutant strains, we observed a systematic decrease and leftward shift of the noise peak for increasingly severe TATA box mutants. These results suggest that a substantial part of the yEGFP noise originates from fluctuations in free TetR dimer concentrations, and are consistent with the expectation that upstream noise is amplified more in the region where the dose–response curve has the greatest slope (21,51). While most of this noise is masked in the absence of inducer, free TetR fluctuations are unmasked as ATc influx into the cells increases and depletes the free TetR dimer pool. At this point where ATc depletes TetR, the yEGFP noise peak decreases in increasingly severe TATA box mutants, which is most likely due to the lower TetR fluctuations (variance) of TATA box mutants (see Figure 4), as explained in the Results. Overall, we show that noise in free (active) TetR strongly affects the expression of the regulated gene, while the noise of total TetR seems to have a negligible effect on yEGFP noise. Still, in addition to noise from active TetR molecules, we previously showed substantial intrinsic noise contributions from the downstream promoter itself (25). Slow T123 promoter fluctuations (due to the presence of a consensus TATA box sequence) may be most prone to respond to the slow fluctuations of the upstream gene expression, typical to the wild-type GAL10 promoter. In contrast, faster upstream fluctuations of TATA box mutant strains may be filtered out by the slow T123 promoter. This may give rise to stochastic entrainment of the downstream promoter, which could be tested in the future by mutating both the upstream and downstream TATA boxes in the regulatory cascade.
Our final goal was to examine whether GAL10 TATA box variants could be used to decouple the control of yEGFP expression noise and mean. To achieve this, we focused on the noticeable reduction in the height of the gene expression noise peak, in addition to the shift in the mean yEGFP expression level where peak noise occurred. Both effects were due to different TetR repressible promoters, indicating a strain-dependent relationship between the noise and the mean. These shifts and reductions of maximum noise to higher mean expression levels were even more dramatic in our S1 single tetO2 operator GAL1 promoter set, as seen in Supplementary Materials. Thus, the nonoverlapping mean–noise characteristics can be used to decouple the mean and noise of gene expression by preparing cell populations to have identical means, but different noises of gene expression, as illustrated in Figure 3C. Such decoupling (25,28,29,36,38) is crucial for functional genetics studies investigating the effect of gene expression noise on cell population fitness. Accordingly, the gene circuits described here can be used as robust and tunable synthetic noise generators that control a target protein with prescribed levels of noise and mean in natural or other synthetic gene networks, resulting in cell populations with engineered fitness or differentiation capabilities. For example, stem cell populations could be engineered to differentiate at desired rates, depending on the noise levels of a differentiation factor, while maintaining a stable stem cell population by keeping the average expression levels constant.
In addition to our steady-state analysis of this synthetic gene circuit, our time-course measurements also provide useful principles for synthetic design, especially pertinent for natural cellular environments, where input signals often fluctuate (73) or occur transiently. Our results demonstrate an important design principle involving the robustness of gene repression against transient input signals and gene expression variability at steady state. High expression of TetR repressor protein from the wild-type GAL10 promoter resulted in robust maintenance of T123 repression in the presence of a strong, but transient inducer signal input (Figure 5A). At steady state, this promoter demonstrated the highest overall noise levels (Figure 3, in black). In contrast, the reduced mean and variance in TetR expression from the mutant TATA promoter int2 lead to a weaker repression of T123, which responded strongly to the short pulses of inducer signal (Figure 5C). At steady state, though, this promoter exhibited significantly reduced gene expression noise (Figure 3, in teal). These results demonstrate an important cost-benefit relationship between robustness of repression during short transient pulses and steady-state variability. The future designs of synthetic gene circuits, especially when dealing with fluctuating input signals, will need to balance these factors in order to achieve optimal performance.
In conclusion, the use of TATA box mutations in synthetic gene regulation offers a means of improving the controllability of gene expression across cell populations. Our findings demonstrate the possibility of improving noise control with a clear benefit from TATA box mutations, reducing the expression level of repressor proteins that inhibit expression of a downstream promoter. High repressor protein expression (in our case, TetR) causes no significant change in the dynamic range, while strongly elevating variability in the gene expression of interest. The introduction of TATA box mutations in the regulatory promoters of inducible gene expression systems thus offers an attractive solution for adjusting the noise of gene expression independently of the mean. Our method involves minimal alteration to synthetic gene circuits, maintains low basal expression of repressed promoters, and retains the maximum gene expression output from the regulated promoter of interest. Admittedly, the gains in noise control and the maintenance of the dynamic range come at the cost of increasing inducer sensitivity (the dose–response curves become steeper for the mutants in Figure 2). Due to the ease of implementing such mutations for controlling gene expression noise, together with the clear benefits, this strategy may prove worthwhile to include in the future design of synthetic gene networks as well as repressor protein-based inducible gene expression systems.
SUPPLEMENTARY DATA
Supplementary Data are available at NAR Online.
FUNDING
National Institutes of Health Director’s Pioneer Award Program (DP1 OD00344 to J.J.C.); the National Institutes of Health Director’s New Innovator Award Program (1DP2 OD006481-01 to G.B.); the National Science Foundation Frontiers in Integrative Biological Research Program (to J.J.C.); the Howard Hughes Medical Institute (to J.J.C.); an Institutional Research Grant from The University of Texas M. D. Anderson Cancer Center (to G.B.). Funding for open access charge: National Institutes of Health Director's New Innovator Award Program (1DP2 OD006481-01).
Conflict of interest statement. None declared.
Supplementary Material
ACKNOWLEDGEMENTS
We thank Dmitry Nevozhay (M. D. Anderson Cancer Center) for comments on the article.
REFERENCES
- 1.Gardner TS, Cantor CR, Collins JJ. Construction of a genetic toggle switch in Escherichia coli. Nature. 2000;403:339–342. doi: 10.1038/35002131. [DOI] [PubMed] [Google Scholar]
- 2.Elowitz MB, Leibler S. A synthetic oscillatory network of transcriptional regulators. Nature. 2000;403:335–338. doi: 10.1038/35002125. [DOI] [PubMed] [Google Scholar]
- 3.Guet CC, Elowitz MB, Hsing W, Leibler S. Combinatorial synthesis of genetic networks. Science. 2002;296:1466–1470. doi: 10.1126/science.1067407. [DOI] [PubMed] [Google Scholar]
- 4.Friedland AE, Lu TK, Wang X, Shi D, Church G, Collins JJ. Synthetic gene networks that count. Science. 2009;324:1199–1202. doi: 10.1126/science.1172005. [DOI] [PMC free article] [PubMed] [Google Scholar]
- 5.Smolke CD. Cell biology. It's the DNA that counts. Science. 2009;324:1156–1157. doi: 10.1126/science.1174843. [DOI] [PubMed] [Google Scholar]
- 6.Ellis T, Wang X, Collins JJ. Diversity-based, model-guided construction of synthetic gene networks with predicted functions. Nat. Biotechnol. 2009;27:465–471. doi: 10.1038/nbt.1536. [DOI] [PMC free article] [PubMed] [Google Scholar]
- 7.Guido NJ, Lee P, Wang X, Elston TC, Collins JJ. A pathway and genetic factors contributing to elevated gene expression noise in stationary phase. Biophys. J. 2007;93:L55–L57. doi: 10.1529/biophysj.107.118687. [DOI] [PMC free article] [PubMed] [Google Scholar]
- 8.Isaacs FJ, Hasty J, Cantor CR, Collins JJ. Prediction and measurement of an autoregulatory genetic module. Proc. Natl Acad. Sci. USA. 2003;100:7714–7719. doi: 10.1073/pnas.1332628100. [DOI] [PMC free article] [PubMed] [Google Scholar]
- 9.Basu S, Gerchman Y, Collins CH, Arnold FH, Weiss R. A synthetic multicellular system for programmed pattern formation. Nature. 2005;434:1130–1134. doi: 10.1038/nature03461. [DOI] [PubMed] [Google Scholar]
- 10.McMillen D, Kopell N, Hasty J, Collins JJ. Synchronizing genetic relaxation oscillators by intercell signaling. Proc. Natl Acad. Sci. USA. 2002;99:679–684. doi: 10.1073/pnas.022642299. [DOI] [PMC free article] [PubMed] [Google Scholar]
- 11.Wang HH, Isaacs FJ, Carr PA, Sun ZZ, Xu G, Forest CR, Church GM. Programming cells by multiplex genome engineering and accelerated evolution. Nature. 2009;460:894–898. doi: 10.1038/nature08187. [DOI] [PMC free article] [PubMed] [Google Scholar]
- 12.You L, Cox R.S., III, Weiss R, Arnold FH. Programmed population control by cell-cell communication and regulated killing. Nature. 2004;428:868–871. doi: 10.1038/nature02491. [DOI] [PubMed] [Google Scholar]
- 13.Kobayashi H, Kaern M, Araki M, Chung K, Gardner TS, Cantor CR, Collins JJ. Programmable cells: interfacing natural and engineered gene networks. Proc. Natl Acad. Sci. USA. 2004;101:8414–8419. doi: 10.1073/pnas.0402940101. [DOI] [PMC free article] [PubMed] [Google Scholar]
- 14.Lee SK, Chou H, Ham TS, Lee TS, Keasling JD. Metabolic engineering of microorganisms for biofuels production: from bugs to synthetic biology to fuels. Curr. Opin. Biotechnol. 2008;19:556–563. doi: 10.1016/j.copbio.2008.10.014. [DOI] [PubMed] [Google Scholar]
- 15.Waks Z, Silver PA. Engineering a synthetic dual-organism system for hydrogen production. Appl. Environ. Microbiol. 2009;75:1867–1875. doi: 10.1128/AEM.02009-08. [DOI] [PMC free article] [PubMed] [Google Scholar]
- 16.Atkinson MR, Savageau MA, Myers JT, Ninfa AJ. Development of genetic circuitry exhibiting toggle switch or oscillatory behavior in Escherichia coli. Cell. 2003;113:597–607. doi: 10.1016/s0092-8674(03)00346-5. [DOI] [PubMed] [Google Scholar]
- 17.Raj A, van Oudenaarden A. Nature, nurture, or chance: stochastic gene expression and its consequences. Cell. 2008;135:216–226. doi: 10.1016/j.cell.2008.09.050. [DOI] [PMC free article] [PubMed] [Google Scholar]
- 18.McAdams HH, Arkin A. Stochastic mechanisms in gene expression. Proc. Natl Acad. Sci. USA. 1997;94:814–819. doi: 10.1073/pnas.94.3.814. [DOI] [PMC free article] [PubMed] [Google Scholar]
- 19.Arkin A, Ross J, McAdams HH. Stochastic kinetic analysis of developmental pathway bifurcation in phage lambda-infected Escherichia coli cells. Genetics. 1998;149:1633–1648. doi: 10.1093/genetics/149.4.1633. [DOI] [PMC free article] [PubMed] [Google Scholar]
- 20.McAdams HH, Arkin A. It's a noisy business! Genetic regulation at the nanomolar scale. Trends Genet. 1999;15:65–69. doi: 10.1016/s0168-9525(98)01659-x. [DOI] [PubMed] [Google Scholar]
- 21.Becskei A, Kaufmann BB, van Oudenaarden A. Contributions of low molecule number and chromosomal positioning to stochastic gene expression. Nat. Genet. 2005;37:937–944. doi: 10.1038/ng1616. [DOI] [PubMed] [Google Scholar]
- 22.Zenklusen D, Larson DR, Singer RH. Single-RNA counting reveals alternative modes of gene expression in yeast. Nat. Struct. Mol. Biol. 2008;15:1263–1271. doi: 10.1038/nsmb.1514. [DOI] [PMC free article] [PubMed] [Google Scholar]
- 23.Blake WJ, Kaern M, Cantor CR, Collins JJ. Noise in eukaryotic gene expression. Nature. 2003;422:633–637. doi: 10.1038/nature01546. [DOI] [PubMed] [Google Scholar]
- 24.Raser JM, O'Shea EK. Control of stochasticity in eukaryotic gene expression. Science. 2004;304:1811–1814. doi: 10.1126/science.1098641. [DOI] [PMC free article] [PubMed] [Google Scholar]
- 25.Blake WJ, Balázsi G, Kohanski MA, Isaacs FJ, Murphy KF, Kuang Y, Cantor CR, Walt DR, Collins JJ. Phenotypic consequences of promoter-mediated transcriptional noise. Mol. Cell. 2006;24:853–865. doi: 10.1016/j.molcel.2006.11.003. [DOI] [PubMed] [Google Scholar]
- 26.Ozbudak EM, Thattai M, Kurtser I, Grossman AD, van Oudenaarden A. Regulation of noise in the expression of a single gene. Nat. Genet. 2002;31:69–73. doi: 10.1038/ng869. [DOI] [PubMed] [Google Scholar]
- 27.Paldi A. Stochastic gene expression during cell differentiation: order from disorder? Cell Mol. Life Sci. 2003;60:1775–1778. doi: 10.1007/s00018-003-23147-z. [DOI] [PMC free article] [PubMed] [Google Scholar]
- 28.Maamar H, Raj A, Dubnau D. Noise in gene expression determines cell fate in Bacillus subtilis. Science. 2007;317:526–529. doi: 10.1126/science.1140818. [DOI] [PMC free article] [PubMed] [Google Scholar]
- 29.Suel GM, Kulkarni RP, Dworkin J, Garcia-Ojalvo J, Elowitz MB. Tunability and noise dependence in differentiation dynamics. Science. 2007;315:1716–1719. doi: 10.1126/science.1137455. [DOI] [PubMed] [Google Scholar]
- 30.Chang HH, Hemberg M, Barahona M, Ingber DE, Huang S. Transcriptome-wide noise controls lineage choice in mammalian progenitor cells. Nature. 2008;453:544–547. doi: 10.1038/nature06965. [DOI] [PMC free article] [PubMed] [Google Scholar]
- 31.Levin MD. Noise in gene expression as the source of non-genetic individuality in the chemotactic response of Escherichia coli. FEBS Lett. 2003;550:135–138. doi: 10.1016/s0014-5793(03)00857-3. [DOI] [PubMed] [Google Scholar]
- 32.Neildez-Nguyen TM, Parisot A, Vignal C, Rameau P, Stockholm D, Picot J, Allo V, Le Bec C, Laplace C, Paldi A. Epigenetic gene expression noise and phenotypic diversification of clonal cell populations. Differentiation. 2008;76:33–40. doi: 10.1111/j.1432-0436.2007.00219.x. [DOI] [PubMed] [Google Scholar]
- 33.Korobkova E, Emonet T, Vilar JM, Shimizu TS, Cluzel P. From molecular noise to behavioural variability in a single bacterium. Nature. 2004;428:574–578. doi: 10.1038/nature02404. [DOI] [PubMed] [Google Scholar]
- 34.Thattai M, van Oudenaarden A. Stochastic gene expression in fluctuating environments. Genetics. 2004;167:523–530. doi: 10.1534/genetics.167.1.523. [DOI] [PMC free article] [PubMed] [Google Scholar]
- 35.Kussell E, Leibler S. Phenotypic diversity, population growth, and information in fluctuating environments. Science. 2005;309:2075–2078. doi: 10.1126/science.1114383. [DOI] [PubMed] [Google Scholar]
- 36.Smith MC, Sumner ER, Avery SV. Glutathione and Gts1p drive beneficial variability in the cadmium resistances of individual yeast cells. Mol. Microbiol. 2007;66:699–712. doi: 10.1111/j.1365-2958.2007.05951.x. [DOI] [PMC free article] [PubMed] [Google Scholar]
- 37.Lu T, Shen T, Bennett MR, Wolynes PG, Hasty J. Phenotypic variability of growing cellular populations. Proc. Natl Acad. Sci. USA. 2007;104:18982–18987. doi: 10.1073/pnas.0706115104. [DOI] [PMC free article] [PubMed] [Google Scholar]
- 38.Bayer TS, Hoff KG, Beisel CL, Lee JJ, Smolke CD. Synthetic control of a fitness tradeoff in yeast nitrogen metabolism. J. Biol. Eng. 2009;3:1. doi: 10.1186/1754-1611-3-1. [DOI] [PMC free article] [PubMed] [Google Scholar]
- 39.Landry CR, Lemos B, Rifkin SA, Dickinson WJ, Hartl DL. Genetic properties influencing the evolvability of gene expression. Science. 2007;317:118–121. doi: 10.1126/science.1140247. [DOI] [PubMed] [Google Scholar]
- 40.Zhang Z, Qian W, Zhang J. Positive selection for elevated gene expression noise in yeast. Mol. Syst. Biol. 2009;5:299. doi: 10.1038/msb.2009.58. [DOI] [PMC free article] [PubMed] [Google Scholar]
- 41.Becskei A, Serrano L. Engineering stability in gene networks by autoregulation. Nature. 2000;405:590–593. doi: 10.1038/35014651. [DOI] [PubMed] [Google Scholar]
- 42.Gonze D, Halloy J, Goldbeter A. Robustness of circadian rhythms with respect to molecular noise. Proc. Natl Acad. Sci. USA. 2002;99:673–678. doi: 10.1073/pnas.022628299. [DOI] [PMC free article] [PubMed] [Google Scholar]
- 43.Orrell D, Bolouri H. Control of internal and external noise in genetic regulatory networks. J. Theor. Biol. 2004;230:301–312. doi: 10.1016/j.jtbi.2004.05.013. [DOI] [PubMed] [Google Scholar]
- 44.Dublanche Y, Michalodimitrakis K, Kummerer N, Foglierini M, Serrano L. Noise in transcription negative feedback loops: simulation and experimental analysis. Mol. Syst. Biol. 2006;2:41. doi: 10.1038/msb4100081. [DOI] [PMC free article] [PubMed] [Google Scholar]
- 45.Rao CV, Wolf DM, Arkin AP. Control, exploitation and tolerance of intracellular noise. Nature. 2002;420:231–237. doi: 10.1038/nature01258. [DOI] [PubMed] [Google Scholar]
- 46.Nevozhay D, Adams RM, Murphy KF, Josic K, Balázsi G. Negative autoregulation linearizes the dose-response and suppresses the heterogeneity of gene expression. Proc. Natl Acad. Sci. USA. 2009;106:5123–5128. doi: 10.1073/pnas.0809901106. [DOI] [PMC free article] [PubMed] [Google Scholar]
- 47.El-Samad H, Khammash M. Regulated degradation is a mechanism for suppressing stochastic fluctuations in gene regulatory networks. Biophys. J. 2006;90:3749–3761. doi: 10.1529/biophysj.105.060491. [DOI] [PMC free article] [PubMed] [Google Scholar]
- 48.Cook DL, Gerber AN, Tapscott SJ. Modeling stochastic gene expression: implications for haploinsufficiency. Proc. Natl Acad. Sci. USA. 1998;95:15641–15646. doi: 10.1073/pnas.95.26.15641. [DOI] [PMC free article] [PubMed] [Google Scholar]
- 49.Kemkemer R, Schrank S, Vogel W, Gruler H, Kaufmann D. Increased noise as an effect of haploinsufficiency of the tumor-suppressor gene neurofibromatosis type 1 in vitro. Proc. Natl Acad. Sci. USA. 2002;99:13783–13788. doi: 10.1073/pnas.212386999. [DOI] [PMC free article] [PubMed] [Google Scholar]
- 50.Thattai M, van Oudenaarden A. Attenuation of noise in ultrasensitive signaling cascades. Biophys. J. 2002;82:2943–2950. doi: 10.1016/S0006-3495(02)75635-X. [DOI] [PMC free article] [PubMed] [Google Scholar]
- 51.Pedraza JM, van Oudenaarden A. Noise propagation in gene networks. Science. 2005;307:1965–1969. doi: 10.1126/science.1109090. [DOI] [PubMed] [Google Scholar]
- 52.Rosenfeld N, Young JW, Alon U, Swain PS, Elowitz MB. Gene regulation at the single-cell level. Science. 2005;307:1962–1965. doi: 10.1126/science.1106914. [DOI] [PubMed] [Google Scholar]
- 53.Hooshangi S, Thiberge S, Weiss R. Ultrasensitivity and noise propagation in a synthetic transcriptional cascade. Proc. Natl Acad. Sci. USA. 2005;102:3581–3586. doi: 10.1073/pnas.0408507102. [DOI] [PMC free article] [PubMed] [Google Scholar]
- 54.Gietz RD, Schiestl RH, Willems AR, Woods RA. Studies on the transformation of intact yeast cells by the LiAc/SS-DNA/PEG procedure. Yeast. 1995;11:355–360. doi: 10.1002/yea.320110408. [DOI] [PubMed] [Google Scholar]
- 55.Amberg DC, Burke D, Strathern JN. Methods in Yeast Genetics. Cold Spring Harbor, NY, USA: Cold Spring Harbor Laboratory Press; 2005. [Google Scholar]
- 56.Murphy KF, Balázsi G, Collins JJ. Combinatorial promoter design for engineering noisy gene expression. Proc. Natl Acad. Sci. USA. 2007;104:12726–12731. doi: 10.1073/pnas.0608451104. [DOI] [PMC free article] [PubMed] [Google Scholar]
- 57.Struhl K. In: Current Protocols in Molecular Biology. Ausubel FM, Brent R, Kingston RE, Moore DD, Seidman J, Smith JA, Struhl K, editors. New York, NY, USA: John Wiley & Sons, Inc.; 1995. pp. 1.8.3–1.8.3. [Google Scholar]
- 58.Paulsson J. Models of stochastic gene expression. Phys. Life Rev. 2005;2:157–175. [Google Scholar]
- 59.Backes H, Berens C, Helbl V, Walter S, Schmid FX, Hillen W. Combinations of the alpha-helix-turn-alpha-helix motif of TetR with respective residues from LacI or 434Cro: DNA recognition, inducer binding, and urea-dependent denaturation. Biochemistry. 1997;36:5311–5322. doi: 10.1021/bi961527k. [DOI] [PubMed] [Google Scholar]
- 60.Ramsey S, Orrell D, Bolouri H. Dizzy: stochastic simulation of large-scale genetic regulatory networks (supplementary material) J. Bioinform. Comput. Biol. 2005;3:437–454. doi: 10.1142/s0219720005001144. [DOI] [PubMed] [Google Scholar]
- 61.Gillespie DT. Stochastic simulation of chemical kinetics. Annu. Rev. Phys. Chem. 2007;58:35–55. doi: 10.1146/annurev.physchem.58.032806.104637. [DOI] [PubMed] [Google Scholar]
- 62.Chen W, Struhl K. Saturation mutagenesis of a yeast his3 “TATA element”: genetic evidence for a specific TATA-binding protein. Proc. Natl Acad. Sci. USA. 1988;85:2691–2695. doi: 10.1073/pnas.85.8.2691. [DOI] [PMC free article] [PubMed] [Google Scholar]
- 63.Selleck SB, Majors J. In vivo “photofootprint” changes at sequences between the yeast GAL1 upstream activating sequence and “TATA” element require activated GAL4 protein but not a functional TATA element. Proc. Natl Acad. Sci. USA. 1988;85:5399–5403. doi: 10.1073/pnas.85.15.5399. [DOI] [PMC free article] [PubMed] [Google Scholar]
- 64.Hoopes BC, LeBlanc JF, Hawley DK. Contributions of the TATA box sequence to rate-limiting steps in transcription initiation by RNA polymerase II. J. Mol. Biol. 1998;277:1015–1031. doi: 10.1006/jmbi.1998.1651. [DOI] [PubMed] [Google Scholar]
- 65.Siegel S, Castellan NJ., Jr . Nonparametric Statistics for the Behavioral Sciences. New York: McGraw-Hill; 1988. [Google Scholar]
- 66.Orth P, Cordes F, Schnappinger D, Hillen W, Saenger W, Hinrichs W. Conformational changes of the Tet repressor induced by tetracycline trapping. J. Mol. Biol. 1998;279:439–447. doi: 10.1006/jmbi.1998.1775. [DOI] [PubMed] [Google Scholar]
- 67.Schubert P, Pfleiderer K, Hillen W. Tet repressor residues indirectly recognizing anhydrotetracycline. Eur. J. Biochem. 2004;271:2144–2152. doi: 10.1111/j.1432-1033.2004.04130.x. [DOI] [PubMed] [Google Scholar]
- 68.Deans TL, Cantor CR, Collins JJ. A tunable genetic switch based on RNAi and repressor proteins for regulating gene expression in mammalian cells. Cell. 2007;130:363–372. doi: 10.1016/j.cell.2007.05.045. [DOI] [PubMed] [Google Scholar]
- 69.Sipo I, Hurtado Pico A, Wang X, Eberle J, Petersen I, Weger S, Poller W, Fechner H. An improved Tet-On regulatable FasL-adenovirus vector system for lung cancer therapy. J. Mol. Med. 2006;84:215–225. doi: 10.1007/s00109-005-0009-1. [DOI] [PubMed] [Google Scholar]
- 70.Isaacs FJ, Dwyer DJ, Ding C, Pervouchine DD, Cantor CR, Collins JJ. Engineered riboregulators enable post-transcriptional control of gene expression. Nat. Biotechnol. 2004;22:841–847. doi: 10.1038/nbt986. [DOI] [PubMed] [Google Scholar]
- 71.Dwyer DJ, Kohanski MA, Hayete B, Collins JJ. Gyrase inhibitors induce an oxidative damage cellular death pathway in Escherichia coli. Mol. Syst. Biol. 2007;3:91. doi: 10.1038/msb4100135. [DOI] [PMC free article] [PubMed] [Google Scholar]
- 72.Tabor JJ, Bayer TS, Simpson ZB, Levy M, Ellington AD. Engineering stochasticity in gene expression. Mol. Biosyst. 2008;4:754–761. doi: 10.1039/b801245h. [DOI] [PMC free article] [PubMed] [Google Scholar]
- 73.Acar M, Mettetal JT, van Oudenaarden A. Stochastic switching as a survival strategy in fluctuating environments. Nat. Genet. 2008;40:471–475. doi: 10.1038/ng.110. [DOI] [PubMed] [Google Scholar]
Associated Data
This section collects any data citations, data availability statements, or supplementary materials included in this article.