

Abstract
Cellular organelle membranes maintain their integrity, global shape, and composition despite vigorous exchange among compartments of lipids and proteins during trafficking and signaling. Organelle homeostasis involves dynamic molecular sorting mechanisms that are far from being understood. In contrast, equilibrium thermodynamics of membrane mixing and sorting, particularly the phase behavior of binary and ternary model membrane mixtures and its coupling to membrane mechanics, is relatively well characterized. Elucidating the continuous turnover of live cell membranes, however, calls for experimental and theoretical membrane models enabling manipulation and investigation of directional mass transport. Here we introduce the phenomenon of curvature-induced domain nucleation and growth in membrane mixtures with fluid phase coexistence. Membrane domains were consistently observed to nucleate precisely at the junction between a strongly curved cylindrical (tube) membrane and a pipette-aspirated giant unilamellar vesicle. This experimental geometry mimics intracellular sorting compartments, because they often show tubular-vesicular membrane regions. Nucleated domains at tube necks were observed to present diffusion barriers to the transport of lipids and proteins. We find that curvature-nucleated domains grow with characteristic parabolic time dependence that is strongly curvature-dependent. We derive an analytical model that reflects the observed growth dynamics. Numerically calculated membrane shapes furthermore allow us to elucidate mechanical details underlying curvature-dependent directed lipid transport. Our observations suggest a novel dynamic membrane sorting principle that may contribute to intracellular protein and lipid sorting and trafficking.
Keywords: liquid disordered, liquid ordered, phase transition, vesicle
The sorting of both lipids and proteins within cells is an essential but poorly understood process. Sorting of intracellular membrane components can be mediated by protein coats (1) and involves biophysical mechanisms based on membrane fluidity, molecular shape of components, and membrane phases (2).
Lateral segregation of membrane lipids likely constitutes an important sorting principle in cellular membranes (2, 3). In model membranes, segregation into the biologically most relevant fluid phase domains—the liquid-ordered (Lo) phase and the liquid-disordered (Ld) phase—is well characterized (4). In curvature gradients, Lo phase membrane domains segregate into regions of low curvature. This curvature-mediated segregation occurs because Lo phase membranes show larger resistance toward bending, compared to Ld phase domains (5–7). The present work considers the strong segregation limit, where membranes consist of domains with sharp phase boundaries (8–10). To be distinguished from that situation is the weak segregation limit near critical demixing (consolute) points (11–14).
Analysis of intracellular cargo movement has demonstrated that many transport carriers consist of tubes rather than vesicles (1, 15). Furthermore, parts of several cellular organelles, including the endoplasmic reticulum, the trans-Golgi network, and various endosomal compartments consist of tubular networks (15). Numerous mechanisms are known that lead to tube formation in vivo. These include exertion of pulling forces by molecular motors, membrane/cytoskeletal interactions, and the action of curvature-generating peripherally binding and transmembrane proteins.
Tubes can be formed from model membrane lipid mixtures under controlled membrane tension that regulates tube curvature (5, 11, 12, 16). Phase separation in tubular membranes has previously been induced by photoactivation (5, 17), exploiting the sensitivity of membrane phase behavior to fluorophore-mediated lipid breakdown (5). Here, we induced first-order demixing transitions through membrane curvature of pulled tubes.
Most model membrane curvature research involving lipid and lipid/protein mixtures has focused on thermodynamic equilibrium conditions (11, 12, 18). However, since the situation in biological cells is one of steady state and regulated mass transport with continuous recycling of membrane components, here we investigate dynamic aspects of membrane sorting.
Results
To systematically probe the effects of curvature on nucleation and growth of membrane domains, we used a classical vesicle pipette aspiration approach (19). Membrane tubes were pulled by beads that were moved either by a second aspiration pipette (Fig. 1A) or by a laser trap (see Fig. 1B, Materials and Methods, and SI Appendix). From a thermodynamic point of view, vesicles provided a particle reservoir that fixes lipid chemical exchange potentials (18). The lateral membrane tension was controlled by means of the pipette aspiration pressure. Fig. 1C shows that our vesicle composition was within the Lo/Ld phase coexistence region, in the strong segregation limit of the phase diagram (4). This composition was chosen to yield vesicles with an Lo/Ld area fraction ratio typically larger than one (to facilitate tube pulling from the Lo phase) and with low domain boundary line tension [to avoid tube fission (16)].
Fig. 1.

Curvature-induced first-order demixing transitions are observed in tube pulled from lipid mixture membranes. (A) Illustration of tube pulling by two-micropipette setup. The Ld phase (gray line) of a vesicle with radius Rv is aspirated by micropipette a. A streptavidin-coated bead is held by micropipette b to pull a tube from the Lo phase (black line) of the vesicle. Z0 represents the length of the Ld phase growing from the tube neck. (B) Schematic of a specially designed fluorescence imaging/optical trapping setup. (C) Schematic phase diagram of ternary lipid mixture. Loop encloses the Ld/Lo coexistence region (4). Lipid composition is indicated by an open circle. (D–G) Confocal microscopy images of domain growth (at constant tube length) using two-micropipette setup. (D) A tube is pulled from the Lo phase (green) of a vesicle and imaged before observable Ld phase (red) growth occurred. Scale bar: 2 μm. (E–G) Growing Ld domain nucleated at the tube neck at constant reservoir membrane tension σ = 3.3·10-5 N/m. Growth time is denoted in each panel. The Lo phases of vesicle and tube appear yellow due to enhanced red channel display, used to emphasize the Ld phase. Scale bar: 1 μm.
Vesicles with a single large Lo domain coexisting with a single large Ld domain (Fig. 1D) were selected and aspirated from the Ld phase (shown in red in Fig. 1D; pipette shown at the left edge of Fig. 1D).
Shortly (typically milliseconds to seconds but occasionally up to several minutes) after pulling a tube from the Lo phase of the vesicle (labeled in green by means of the peripherally binding protein cholera toxin (CTB, which binds to ganglioside, GM1) in Fig. 1 D–G), an Ld domain nucleated at the neck of the tube, while the total tube length was held constant. Nucleation times (defined as the time between the end of the process of tube extraction and the first observation of a domain) were variable, in accordance with thermally activated nucleation.
Exclusively, only a single Ld domain nucleated in the tube, and it was always located at the tube neck. Both of these observations suggest that curvature/composition coupling (11, 12) rather than photoeffects (5, 17) caused phase separation. This conclusion was further supported by the qualitative observation that increasing curvature (by increasing the vesicle lateral tension) on average decreased the time needed for nucleation [from up to minutes for the lowest lateral tensions to short (milliseconds) times for the highest tensions considered].
Previous research has shown that CTB bound to the outer leaflet of giant unilamellar vesicle (GUV) membranes preferentially partitions away from high curvature tubes pulled from vesicles with equilibration times less than 1 min (11, 12). Furthermore, Ld phase lipid diffusion coefficients in our mixture are in the range of ∼3–5 μm2/s (20). Because green CTB fluorescence is observed for > 400 s on the tube (Fig. 1G), the red Ld domain shown in Fig. 1 E–G serves as a diffusion barrier to protein (and lipid) exchange between tube Lo and vesicle Lo domains. Such diffusion barriers have been postulated to modulate intracellular lipid and protein sorting (2).
Curvature-nucleated domains grow in time; i.e., the red Ld phase invades the tube membrane, progressively replacing the green Lo phase (Fig. 1 E–G; time was measured relative to the first observation of fluorescence heterogeneity at the tube neck). The comparison of the time needed for domain boundary movement between first and second (Fig. 1 E and F) vs. second and third (Fig. 1 F and G) frames reveals that the domain boundary velocity decreased with time.
The addition of the CTB/GM1 complex to our membranes so far has served to illustrate the possibility of dynamic protein sorting in Fig. 1. It has previously been shown, however, that CTB itself is an effective curvature sensor (11, 12) and furthermore amplifies lipid curvature sorting (12). For the following quantitative characterization of the dynamic lipid phase behavior depicted in Fig. 1 D–G, we therefore omitted CTB/GM1.
We found a systematic dependence of domain boundary positions (measured as the distance between the intratube phase boundary and the tube neck) on both observation time and lateral membrane tension (Fig. 2A). The domain boundary length to a good approximation showed a square-root time dependence (Fig. 2B).
Fig. 2.

Curvature-induced domains show parabolic growth and characteristic pulling force decay. (A) Six domains were sequentially nucleated at the tube neck of a single vesicle (additional examples in SI Appendix) through stepwise total tube length extension followed by domain growth at constant total tube length (and reservoir tension) as shown in schematic (i). Domain length as a function of time relative to the first moment of detectable fluorescence heterogeneity at the tube neck (ii). Closed and open circles, closed and open triangles, closed and open squares: domains grown at pressures of 17 ± 0.5 Pa, 23 Pa, 31 Pa, 38 Pa, 50 Pa, and 61 Pa, respectively, corresponding to the lateral tensions in B. (B) Same data as in A plotted vs.  . Linear fits are shown as solid lines. (C) Tube force is observed to decrease after domain nucleation and concomitant to growth. The black curve corresponds to the first domain generated (closed circles in A, B, and D); lighter gray curves correspond to domains grown sequentially at increasing aspiration pressures as in A. (D) Tube force as a function of domain length; symbols as in panel B. Solid lines are linear fits for domain lengths up to 10 μm. (E) Double logarithmic plot (with standard deviations) of the slopes of the linear fits as in B as a function of membrane tension for 6 different vesicles and 26 vesicle tensions. Slope of a linear fit to the binned data yields 0.62 ± 0.08. (F) Three sequentially nucleated domains grown at constant membrane tension but with different initial lengths of Lo phase tube [schematic in (i)] exhibited essentially identical growth behavior and force decay (ii) for various total tube lengths.
Ld phase domains that had been nucleated at the tube neck could be pulled into the tube interior by quickly (typically 30 μm/s) increasing the total tube length by moving the pulling bead. This led to nucleation (at the tube neck) of a new (here called primary) domain (with nucleation times similar to the previously nucleated, here called secondary, domain) in the Lo phase membrane region that was pulled onto the tube (see schematics in Fig. 2 A and F). Essentially identical growth dynamics were observed for multiple domains that resulted from successive pulls of the same tube (see Fig. 2F and Fig. S1A) when vesicle lateral tension was held constant. These observations allowed us to perform multiple domain growth experiments using the same tube and vesicle, but varying the vesicle (below also called reservoir-) lateral tensions to change tube curvature.
Concomitant to the domain length characterization analyzed in Fig. 2 A and B, we measured the pulling force exerted by the tube membrane on a bead held in an optical trap. Following curvature-induced phase separation, tubes displayed pulling forces that decayed on time scales longer than 100 s. The pulling force decay for the six domains analyzed in Fig. 2 A and B is shown in Fig. 2C. Intriguingly, pulling forces decreased essentially linearly with domain boundary displacement (Fig. 2D). We characterized the time scales required for initial mechanical equilibration after membrane tube elongation or aspiration pressure change using homogeneous vesicles (without phase separation). These time scales were less than 2 s to reach a constant pulling force after tube elongation (see Fig. S2A, consistent with ref. 21) and less than 1 s to reach a constant pulling force after changing the aspiration pressure (Fig. S2B). Accordingly, the force decay during domain growth (Fig. 2C) occurs on a time scale significantly longer than needed to reach mechanical equilibrium after initial tube formation.
Fig. 2E suggests a power-law dependence between the slopes of Fig. 2B and vesicle lateral tension, with an exponent of 0.62 ± 0.08. This systematic dependence further emphasizes that curvature, rather than photoeffects, is the driving force for phase separation and mass transport. For high vesicle tensions, we confirmed that after long (> 10 min) waiting times, tether membranes consisted of one single Ld domain, consistent with ref. 10.
The slowing down of domain boundary velocities observed in Figs. 1 and 2 suggests that the growing Ld phase presents a mass transport resistance that grows with its length. The parabolic moving boundary (“Stefan problem”) behavior that we observe here is displayed by many physicochemical phenomena involving both heat and mass transfer (22, 23).
We derived a simple thermodynamic transport model (see SI Appendix for details) that enables us to explain dynamic aspects of the findings shown in Figs. 1 and 2. The key features of the model are depicted in Fig. 3. We assume the vesicle and the Lo phase of the tube are thermodynamic reservoirs (with chemical equilibrium being maintained at their boundaries) and that a linear chemical potential gradient across the thermodynamic system (here the Ld phase tube) connects both reservoirs (23). We reduce the ternary mixture to a quasibinary mixture (see SI Appendix for comments on implications of this simplification). We define the diffusion potential as  , where μi is the chemical potential of component i of the quasibinary mixture (11). In our model, transport is driven by a curvature-dependent diffusion potential difference
  between both reservoirs (see Fig. 3). We first examine the results of the assumption that
  is time-independent. In that case, analytically integrating the appropriate continuity equation at the inner tube Ld/Lo phase boundary yields (see SI Appendix for details)
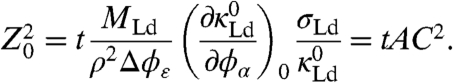 |
[1] |
Eq. 1 is a growth law with parabolic time t dependence demonstrating an increase of domain boundary velocities (phase boundary position is Z0) with lateral tension σLd (and therefore curvature C), which are features in accordance with the experimental observations (Fig. 2). Here, M is a mobility, ρ a lipid density, and Δϕε is related to the width of the miscibility gap (Fig. 3) as well as the ratio of the tube radii RLo/RLd = κLo/κLd ≡ ε (see SI Appendix); Ri and κi are the radius and bending stiffness of phase i, respectively. The quantity A summarizes the time- and curvature-independent parameters on the left-hand side of Eq. 1. It contains the composition dependence of the Ld phase bending stiffness, assumed here to underlie curvature-mediated sorting (11, 12). We note that accounting for nonlinear concentration gradients affects the numerical value of A, but does not otherwise influence the time dependence of Z0 in this model (24). The quantity AC2 can be interpreted as a curvature-dependent interdiffusion coefficient.
Fig. 3.

Schematic of linear irreversible thermodynamics model. (A) Vesicle (left-hand side) and Lo phase tube domain (right-hand side) are considered thermodynamic reservoirs with fixed chemical exchange potential  [(B), difference between reservoirs is
  ] and fixed composition ϕ [(C), maximal composition difference in Ld tube due to curvature is δϕ]. Here, ϕ is defined as the mole fraction of Lo phase lipid in a quasibinary mixture; the width of the phase coexistence region is Δϕ. Due to membrane curvature, the chemical potential in the right-hand side reservoir is larger compared to the left-hand side reservoir, whereas the composition of the Lo phase in both reservoirs is the same. Linear chemical potential and composition gradients are assumed in the Ld phase connecting both reservoirs. At the intratube phase boundary (where the axial coordinate Z = Z0), the curvature is Ct. At the vesicle/tube phase boundary (where Z = 0), the curvature is Cn. The vesicle has negligible curvature.
We note that Eq. 1 is based on numerous simplifications required to obtain an analytically tractable model. These include (i) neglect of area density (ρ) difference between Lo and Ld phases, (ii) assumed absence of friction effects contributed by water (and membrane area) transport among tube and vesicle (see SI Appendix for discussion), (iii) spatially fixed vesicle/tether phase boundary (numerically investigated more accurately below), (iv) assumption of time-independent tube radii of Lo and Ld phases, and (v) absence of concentration gradient in tube Lo phase. We discuss (iv) and (v) immediately below.
The assumption made so far, of an Lo phase tube reservoir with constant curvature at constant reservoir tension, is not in agreement with the experimentally observed pulling force decay, because the pulling force  (25), where mechanical quantities are those near the pulling bead.
We will discuss the following two alternative hypotheses to explain the pulling force decay. The first is that the pulling force decreases due to a change in lateral tension of the tube at fixed (vesicle) reservoir tension, while the composition of the tube domain in the Lo phase remains approximately constant (in accordance with the assumption of an Lo phase reservoir; see Fig. 3). The second hypothesis is that the bending stiffness of the Lo phase of the tube decreases with time because the imposed curvature field could lead to a change in the composition of the Lo phase near the bead to lower the tube free energy (11, 12). If the bending stiffness at the end of the tube would decrease through diffusive composition change, then the time scales of the lipid exchange between the end of the tube and the vesicle would be affected by the total tube length.
In support of the first, rather than the second hypothesis, we found negligible influence of the total tube length on domain growth (Fig. 2F and Fig. S1A). We furthermore verified that pulling force decays were similar (Fig. 2F and Fig. S1B) in serially nucleated domains in the same tube at constant reservoir lateral tension, confirming that the composition at the tube end did not measurably change over the time course of our experiments. Furthermore, secondary (i.e., inner-tube) Lo phase domains were observed to reduce their length during the growth process of the primary domain (Fig. S1C). This is consistent with increasing radius of the secondary domain at constant domain area, due to decreasing lateral tension during the primary domain growth process. As Fig. S1C shows, multiple inner-tube domains displayed similar shortening during the primary domain growth.
We thus concluded that the coupling of lateral tension between the vesicle reservoir and the tube changed with time. In additional support of this conclusion, we observed a rapid (< 1 s) force drop associated with the following phenomenon. Occasionally, small (radius on the order of 1 μm) Ld phase domains diffused from the vesicle into the neck region and became irreversibly trapped at the tube neck. This is shown for three examples in Fig. S3A, where Lo phase tubes were pulled from the vesicle, and no curvature-induced Ld phase nucleation was observed before the small domain was trapped in the neck region. The pulling force was constant before the Ld domain approached the neck region (consistent with the expectation of an approximately time-independent tube composition) and dropped rapidly as the Ld phase was trapped in the neck. This force drop indicated that the detailed geometry of the tube neck was pivotal in determining the pulling force exerted by a tube with phase coexistence. After the fast force drop, no additional force decay occurred (Fig. S3B) while the Ld phase invaded the Lo phase tube (Fig. S3A).
To gain further mechanical insight, the geometry of tube necks was obtained from numerical solutions to the differential shape equations of lipid bilayer membranes with phase separation (26), including an axial pulling force (25, 27). We assumed a membrane suspended from a ring with a zero mean curvature (free hinge) boundary condition (25). In the presence of an axial force, such membranes will show an approximate catenoid shape (25). From this catenoid we suspended a tube with a cylinder shape boundary condition at its tip (16). For all calculated shapes that we show here, the total membrane area was fixed (6). Shapes such as those in Fig. 4 were calculated at constant lateral tension in the Lo phase of the catenoid. The catenoid edge radius was variable to allow for changes in tube geometry at fixed total membrane area. The catenoid thus constituted a membrane area-reservoir, to reflect our experiments shown in Fig. 1 (where the pipette-aspirated membrane fraction of the GUV provided an area-reservoir). The catenoid/tube shape (with phase sequence Lo/Ld/Lo) was parameterized by means of the radius r and the angle ψ of the tangent to the shape, as a function of arc length s (25) (see inset of Fig. 4A and SI Appendix for details). A line tension T could be imposed at each phase boundary. Gaussian bending stiffness differences ζ among phases could also be accounted for (6, 26).
Fig. 4.

Computational shape series from membrane elasticity theory shows pulling force decay. (A) Single phase tube with an Lo phase bending stiffness of 364 pN·nm. Tube radius is minimal in the neck region. Tube force for this shape is 24.0 pN with a lateral tension of 0.020 mN/m (equivalent reservoir tension for all following shapes). The inset illustrates parameterization of shape coordinates. (B) Three-phase tube with Ld phase domain (gray) with a bending stiffness of 81 pN·nm (4.5 times less than the Lo phase). The Ld domain tension is higher than both the reservoir and Lo phase tube tensions. (C) Tube shape with a large Ld phase domain area. The Ld tension is now close to the reservoir tension. The inset shows leading-edge phase boundary. (D) Tube force decreases linearly with domain length until reaching a plateau. Arrows correspond to shapes in B and C. Note that lateral tensions of the Lo and Ld phase regions of the tube decrease during domain growth. (E) Close-up of neck region for shapes shown in A–C. Vesicle/tube phase boundary moves onto the catenoid during domain growth. (F) Mean curvature of Lo (black) and Ld (gray) phases at the catenoid/tube phase boundary as a function of domain length. Both mean curvatures decrease to zero upon reaching the force plateau shown in D. The curvature on the Ld and Lo phase sides of the phase boundary differ, in accordance with the mechanical jump conditions (see SI Appendix).
Fig. 4A shows the profile of a membrane tube without phase separation in order to illustrate a well-known feature: At the tube neck, the radius shows an invagination and a locally increased free energy density (25). This fact explained why the curvature-induced Ld phase always nucleated at the neck.
We next aimed to calculate shapes of phase-separated tubes. Knowledge of the elasticities of the Lo and Ld phases was thus required (6). We derived bending stiffness values from pulling force measurements (5) in homogeneous vesicles with several different compositions corresponding to Ld and Lo phases (see SI Appendix). We found values of roughly 0.8·10-19 J for the Ld phase and 3.6·10-19 J for the Lo phase (see Fig. S4 and Table S1). This yielded a ratio ε ≈ 4.5 of elasticities in the Lo vs. Ld phase, in agreement with previous estimates (6, 7). With this value for ε, we calculated series of tube shapes mimicking the experimental phase-separation process of Figs. 1 and 2, assuming, for the moment, vanishing T (and zero ζ).
Nucleation of an Ld domain led to further constriction of the neck (Fig. 4B). To calculate series of shapes for phase-separated tubes at constant total membrane area, we varied the area fraction of the tube Lo phase and the tube Ld phase, keeping the area of the catenoid Lo phase constant (Fig. 4 B and C). Note that such shape series do not preserve the total Lo/Ld area fraction. Mass conservation of Ld phase and Lo phase lipids can, in principle, be achieved by adding an additional Ld phase to the nearly flat catenoid (as in the experimental vesicles; see Fig. 1). The area fraction of this additional Ld phase could be varied to fix the total area fraction of the Ld phase while varying the tube area fractions (Fig. 4 B and C). Since this amendment in the quasiflat reservoir would have negligible mechanical consequences, we varied the area fraction of the tube domains only and regarded the catenoid as a thermodynamic particle- and area-reservoir, fixing chemical potentials (instead of particle numbers).
Fig. 4 A–C indicate that during invasion of the tube by the growing Ld phase domain, the left-hand side phase boundary moves into the catenoid (note that both phase boundaries thus were not fixed in space but allowed to move to minimize the shape’s total mechanical energy; see SI Appendix). We note for completeness that the inner-tube phase boundary shows a tangent angle of π/2 (inset of Fig. 4C) (16). During the tube invasion, the pulling force decays (see Fig. 4D). Remarkably, the relation between Ld domain length and pulling force is linear in the numerically obtained shape series (Fig. 4D), as in the experiment (Fig. 2D). Note that a force plateau is reached before the Ld phase has completely replaced the tube Lo phase (Fig. 4 C and D).
The reason for the force decay is embedded in the complicated mechanical jump conditions at the vesicle/tube phase boundary (see SI Appendix). However, there is a conceptually straightforward explanation. Before phase separation, the lateral tension within the membrane tube is equivalent to the reservoir tension (Fig. 4A). Near the end of the invasion process, the left-hand phase boundary is located in a membrane region with negligible curvature (Fig. 4C). Fig. 4E shows a magnification of the catenoid/tube phase boundaries. The mechanical jump conditions therefore dictate the lateral tension in the Ld phase domain to be the same as the reservoir lateral tension (in the absence of line tension). At the right-hand (intratube) phase boundary, however, the axial force balance requires σLd/σLo = κLo/κLd = ε (16). If both phase boundaries were localized within the tube (as is approximately the case immediately after nucleation of an Ld domain, Fig. 4B), then the lateral tension within the tube Lo phase would be identical to the reservoir tension. This is because at both phase boundaries the lateral tension would jump, but in opposite directions, according to the axial force balance relation. If only one phase boundary is localized within the tube region, as in Fig. 4C near the end of the invasion process, the lateral tension within the tube Lo phase must be smaller by an amount that is given by the bending stiffness ratio. During the invasion process, the lateral tension of the Lo phase tube domain therefore monotonically decreased from the reservoir tension σres to σLo = σres/ε. In accordance with this interpretation, Fig. 4F shows that the mean curvature at the vesicle/tube phase boundary decreases during domain growth, vanishing at the pulling force plateau of Fig. 4D.
We note that the magnitude of the vesicle/tube phase boundary displacement from the tube neck suggested by Fig. 4 B–C is not microscopically resolvable, consistent with Fig. 1 E–G.
In line with the interpretation of a tension-related force decay, the apparent bending stiffness κapp calculated from the experimentally determined pulling force and σres (i.e., κapp = f2/8π2σres) continuously decreased from Lo phase values (before invasion) to values approaching those for an Ld phase [at the force plateau; see Fig. S5 and Fig. 4D; here  (16), since at the plateau σres = σLd].
We observed that several minutes after primary domain growth was initiated, the lengths of secondary domains remained approximately constant, consistent with the observation of a pulling force plateau at long observation times (Fig. S5 and Fig. 4D). Under such conditions, the domain length of a secondary domain was observed to be linearly related to the square root of systematically varied reservoir tension; see Fig. S6. Since the domain radius is inversely proportional to  (25), this finding shows that the secondary domain area Asec ≈ 2πRsecLsec (excluding the phase boundary geometry; see Fig. 4) was independent of domain curvature. This suggests that the phase diagram is unaffected by curvature (Fig. 3C).
In addition to the parameter ε, we measured the line tension T (0.16 ± 0.06 pN; see SI Appendix). We then calculated numerical shape series for lateral tensions varying over a range matching the experimentally considered reservoir tensions (see Fig. 2) and the measured values for ε and T. We implemented our transport model (Eq. 1) in differential form: dZ0 = dtAC2/2Z0, to calculate a time axis for the change of geometric and mechanical quantities, taking into account the changing curvature at the inner-tube phase boundary during domain growth and choosing a value of A common to all shapes considered. Fig. S7 shows domain length vs. time (Fig. S7A), domain length vs.  (Fig. S7B), pulling force vs. time (Fig. S7C), and pulling force vs. domain length (Fig. S7D), confirming several aspects of the experimental measurements shown in Fig. 2. For the (small) influence of line tension, see Fig. S8.
We note that details of computed shape series differ from the experimental data. Among these are the lateral tension dependence of the slopes of the plots in Fig. S7D (compare Fig. 2D), and the linearity of rescaled domain growth time axes (compare Fig. 2B and Fig. S7B) for high lateral tensions. These differences likely result from the simplifications of our mechanical and transport models. Improvements may involve phase-field modeling (28) or dissipative particle dynamics simulations (29), which are beyond the scope of the present work. We note that further support for our mechanical model may be obtained in future experiments where pulling force is clamped due to continuous tether elongation and feedback.
Discussion
The squared slopes in Fig. 2B can be interpreted as curvature-dependent interdiffusion coefficients. Table S2 shows that their magnitude (0.1 ∼ 10 μm2/s) is in the range of typical lipid diffusion coefficients [from fluorescence correlation spectroscopy (20)]. Interestingly, comparing the lateral tension dependence of the slopes of plots such as in Fig. 2B to our transport model (Eq. 1) suggests that the transport coefficient A increases systematically with increasing curvature. This follows from the exponent of 0.62 ± 0.08 obtained from Fig. 2E, compared to the value of 0.5 expected from Eq. 1. Membrane curvature-dependent diffusion coefficients have been considered in single component membranes before (30) and here are likely influenced by the curvature dependence of the concentration profiles in the tube Ld phase (see Fig. 3).
Our findings suggest a mechanism for intracellular sorting that uses the speed of membrane extraction from a donor reservoir (organelle) as a means for sorting. If high curvature tubes form slowly from a reservoir of essentially flat membranes, then equilibration of chemical potentials between the extracted sheet and the donor organelle is facilitated; in this case, the extracted membranes may show enrichment in Ld lipids and Ld proteins (see Movie S1, where a pulling speed of 0.04 μm/s was used). If, however, membrane patches are extracted quickly, then equilibration may be prevented and Lo rather than Ld membranes may be extracted from the reservoir. Fast pulling is exemplified in Movie S2, using a speed of 1.5 μm/s, which is well within a range of trafficking speeds of intracellular cargo membranes (31).
Materials and Methods
GUVs.
Vesicles were made via electroswelling (11). Lipid mixtures had composition 3∶3.3∶3.7 di-oleoyl-phosphatidylcholine (DOPC)/cholesterol (chol)/di-palmitoyl-phosphatidylcholine (DPPC) indicated by the dot in Fig. 1C. Trace amounts of biotinylated lipid (binding streptavidin-coated beads) and Ld phase-preferring red lipid fluorophore (Texas-Red DHPE) were added (see SI Appendix). For Fig. 1, 1 mol % of the ganglioside GM1 was added.
Pipette Aspiration and Force Measurements.
Vesicles with radius Rv were aspirated by means of glass capillaries (inner radius Rp) at an aspiration pressure of ΔP = Po - Pp, controlling vesicle lateral tension σ = ΔP·Rp/2(1 - Rp/Rv). Forces f were measured via displacement x of the pulling bead from the center of a laser trap, in combination with measured trap stiffness k: f = kx. To pull tubes, the trapping objective was moved laterally.
Supplementary Material
Acknowledgments.
We thank T. Lubensky, S. Das, and T. Powers for discussions, T. Lubensky and B. Capraro for comments on the text, and the A. P. Sloan foundation and NSF for funding.
Footnotes
The authors declare no conflict of interest.
*This Direct Submission article had a prearranged editor.
This article contains supporting information online at www.pnas.org/cgi/content/full/0913997107/DCSupplemental.
References
- 1.Bonifacino JS, Rojas R. Retrograde transport from endosomes to the trans-Golgi network. Nat Rev Mol Cell Bio. 2006;7:568–579. doi: 10.1038/nrm1985. [DOI] [PubMed] [Google Scholar]
- 2.Mukherjee S, Maxfield FR. Role of membrane organization and membrane domains in endocytic lipid trafficking. Traffic. 2000;1:203–211. doi: 10.1034/j.1600-0854.2000.010302.x. [DOI] [PubMed] [Google Scholar]
- 3.Simons K, Ikonen E. Functional rafts in cell membranes. Nature. 1997;387:569–572. doi: 10.1038/42408. [DOI] [PubMed] [Google Scholar]
- 4.Veatch SL, Keller SL. Separation of liquid phases in giant vesicles of ternary mixtures of phospholipids and cholesterol. Biophys J. 2003;85:3074–3083. doi: 10.1016/S0006-3495(03)74726-2. [DOI] [PMC free article] [PubMed] [Google Scholar]
- 5.Roux A, et al. Role of curvature and phase transition in lipid sorting and fission of membrane tubules. EMBO J. 2005;24:1537–1545. doi: 10.1038/sj.emboj.7600631. [DOI] [PMC free article] [PubMed] [Google Scholar]
- 6.Baumgart T, Das S, Webb WW, Jenkins JT. Membrane elasticity in giant vesicles with fluid phase coexistence. Biophys J. 2005;89:1067–1080. doi: 10.1529/biophysj.104.049692. [DOI] [PMC free article] [PubMed] [Google Scholar]
- 7.Semrau S, Idema T, Holtzer L, Schmidt T, Storm C. Accurate determination of elastic parameters for multicomponent membranes. Phys Rev Lett. 2008;100:088101–0881014. doi: 10.1103/PhysRevLett.100.088101. [DOI] [PubMed] [Google Scholar]
- 8.Jiang HY, Powers TR. Curvature-driven lipid sorting in a membrane tubule. Phys Rev Lett. 2008;101:0181031–0181034. doi: 10.1103/PhysRevLett.101.018103. [DOI] [PubMed] [Google Scholar]
- 9.Parthasarathy R, Yu CH, Groves JT. Curvature-modulated phase separation in lipid bilayer membranes. Langmuir. 2006;22:5095–5099. doi: 10.1021/la060390o. [DOI] [PubMed] [Google Scholar]
- 10.Rozycki B, Weikl TR, Lipowsky R. Stable patterns of membrane domains at corrugated substrates. Phys Rev Lett. 2008;100:098103. doi: 10.1103/PhysRevLett.100.098103. [DOI] [PubMed] [Google Scholar]
- 11.Tian A, Baumgart T. Sorting of lipids and proteins in membrane curvature gradients. Biophys J. 2009;96:2676–2688. doi: 10.1016/j.bpj.2008.11.067. [DOI] [PMC free article] [PubMed] [Google Scholar]
- 12.Sorre B, et al. Curvature-driven lipid sorting needs proximity to a demixing point and is aided by proteins. Proc Natl Acad Sci USA. 2009;106:5622–5626. doi: 10.1073/pnas.0811243106. [DOI] [PMC free article] [PubMed] [Google Scholar]
- 13.Leibler S. Curvature instability in membranes. J Phys. 1986;47:507–516. [Google Scholar]
- 14.Seifert U. Curvature-induced lateral phase separation in two-component vesicles. Phys Rev Lett. 1993;70:1335–1338. doi: 10.1103/PhysRevLett.70.1335. [DOI] [PubMed] [Google Scholar]
- 15.Derby MC, Gleeson PA. New insights into membrane trafficking and protein sorting. International Review of Cytology: A Survey of Cell Biology. 2007;261:47–116. doi: 10.1016/S0074-7696(07)61002-X. [DOI] [PubMed] [Google Scholar]
- 16.Allain JM, Storm C, Roux A, Amar MB, Joanny JF. Fission of a multiphase membrane tube. Phys Rev Lett. 2004;93:158104–158104. doi: 10.1103/PhysRevLett.93.158104. [DOI] [PubMed] [Google Scholar]
- 17.Yuan J, Hira SM, Strouse GF, Hirst LS. Lipid bilayer discs and banded tubules: Photoinduced lipid sorting in ternary mixtures. J Am Chem Soc. 2008;130:2067–2072. doi: 10.1021/ja710305c. [DOI] [PubMed] [Google Scholar]
- 18.Tian A, Capraro BR, Esposito C, Baumgart T. Bending stiffness depends on curvature of ternary mixture tubular membranes. Biophys J. 2009;97:1636–1646. doi: 10.1016/j.bpj.2009.07.012. [DOI] [PMC free article] [PubMed] [Google Scholar]
- 19.Hochmuth RM, Wiles HC, Evans EA, Mccown JT. Extensional flow of erythrocyte membrane from cell body to elastic tether. II. Experiment. Biophys J. 1982;39:83–89. doi: 10.1016/S0006-3495(82)84493-7. [DOI] [PMC free article] [PubMed] [Google Scholar]
- 20.Scherfeld D, Kahya N, Schwille P. Lipid dynamics and domain formation in model membranes composed of ternary mixtures of unsaturated and saturated phosphatidylcholines and cholesterol. Biophys J. 2003;85:3758–3768. doi: 10.1016/S0006-3495(03)74791-2. [DOI] [PMC free article] [PubMed] [Google Scholar]
- 21.Evans E, Yeung A. Hidden dynamics in rapid changes of bilayer shape. Chem Phys Lipids. 1994;73:39–56. [Google Scholar]
- 22.Stefan J. Ueber die Theorie der Eisbildung, insbesondere über die Eisbildung im Polarmeere. Ann Phys. 1891;278:269–286. [Google Scholar]
- 23.De Groot SR, Mazur P. Non-Equilibrium Thermodynamics. Amsterdam: North-Holland Publishing Company; 1963. [Google Scholar]
- 24.Crank J. Free and Moving Boundary Problems. Oxford: Oxford Univ Press; 1984. [Google Scholar]
- 25.Derenyi I, Julicher F, Prost J. Formation and interaction of membrane tubes. Phys Rev Lett. 2002;88:238101. doi: 10.1103/PhysRevLett.88.238101. [DOI] [PubMed] [Google Scholar]
- 26.Julicher F, Lipowsky R. Shape transformations of vesicles with intramembrane domains. Phys Rev E. 1996;53:2670–2683. doi: 10.1103/physreve.53.2670. [DOI] [PubMed] [Google Scholar]
- 27.Bozic B, Svetina S, Zeks B. Theoretical analysis of the formation of membrane microtubes on axially strained vesicles. Phys Rev E. 1997;55:5834–5842. [Google Scholar]
- 28.Lowengrub JS, Ratz A, Voigt A. Phase-field modeling of the dynamics of multicomponent vesicles: Spinodal decomposition, coarsening, budding, and fission. Phys Rev E. 2009;79:031926. doi: 10.1103/PhysRevE.79.031926. [DOI] [PMC free article] [PubMed] [Google Scholar]
- 29.Illya G, Lipowsky R, Shillcock JC. Two-component membrane material properties and domain formation from dissipative particle dynamics. J Chem Phys. 2006;125:114710. doi: 10.1063/1.2353114. [DOI] [PubMed] [Google Scholar]
- 30.Daniels DR, Turner MS. Diffusion on membrane tubes: A highly discriminatory test of the Saffman-Delbruck theory. Langmuir. 2007;23:6667–6670. doi: 10.1021/la0635000. [DOI] [PubMed] [Google Scholar]
- 31.Kural C, et al. Kinesin and dynein move a peroxisome in vivo: A tug-of-war or coordinated movement? Science. 2005;308:1469–1472. doi: 10.1126/science.1108408. [DOI] [PubMed] [Google Scholar]
Associated Data
This section collects any data citations, data availability statements, or supplementary materials included in this article.