

Abstract
Cre promotes recombination at the 34 bp LoxP sequence. Substitution of a critical C-G base pair in LoxP with an A-T base pair, to give LoxAT, reduced Cre binding in vitro and abolished recombination in vivo. We demonstrated that LoxAT can be recombined in vitro. However, Cre discriminates against this substrate both before and after DNA binding. The preference for LoxP over LoxAT is the result of reduced binding and a slower turnover rate, amplified by changes in cooperativity of complex assembly. With LoxAT, similar levels of substrate turnover required 2–2.5-fold higher protein–DNA concentrations compared to LoxP, but the sigmoidal behavior of the concentration dependence was more pronounced. Further, the Cre–LoxAT complexes reacted 4–5-fold more slowly. In the 2.3 Å resolution Cre–LoxAT complex structure, the major groove Arg259–guanine interaction was disrupted, explaining the reduced binding. Overall structural shifts and mobility changes indicate more favorable interactions between subunits, providing a hypothesis for the reduced turnover rate. Concomitant with the displacement of Arg259 from the DNA, adjacent charged residues Glu262 and Glu266 shifted to form salt bridges with the Arg259 guanidinium moiety. Substitution of Glu262 and Glu266 with glutamine increased Cre complex assembly efficiency and reaction rates with both LoxAT and LoxP, but diminished Cre’s ability to distinguish them. The increased rate of this variant suggests that DNA substrate binding and turnover are coupled. The improved efficiency, made at some expense of sequence discrimination, may be useful for enhancing recombination in vivo.
Phage P1 Cre protein promotes recombination at its 34 bp LoxP sequence (1), in vitro, in cultured cells, and in living organisms (2). Cre is a member of the Int family of tyrosine recombinases and type 1B topoisomerases, which share a conserved active site structure and chemical mechanism (3-5). Crystallographic studies by van Duyne and co-workers (6) defined both the structures of key reaction intermediates and the details of the chemical mechanism suggested by earlier investigations. The active synaptic complex contains a pseudo-four-fold protein tetramer bound to two antiparallel Lox sites (Figure 1a). The four Cre molecules are differentiated into two alternating conformations. The “cleaving” subunits, represented by the B chain, perform strand exchange, while the “noncleaving” subunits, represented by the A chain, perform an architectural role. Recombination is effected by two consecutive transesterification reactions that exchange the pairs of homologous strands via 3′-phosphotyrosine and Holliday junction (HJ)1 intermediates (7-9). The natural substrate LoxP consists of two 13 bp repeats in an inverted orientation, which participate in Cre binding, separated by an 8 bp asymmetric spacer, in which strand cleavage and religation occur (Figure 1b) (10, 11).
Figure 1.
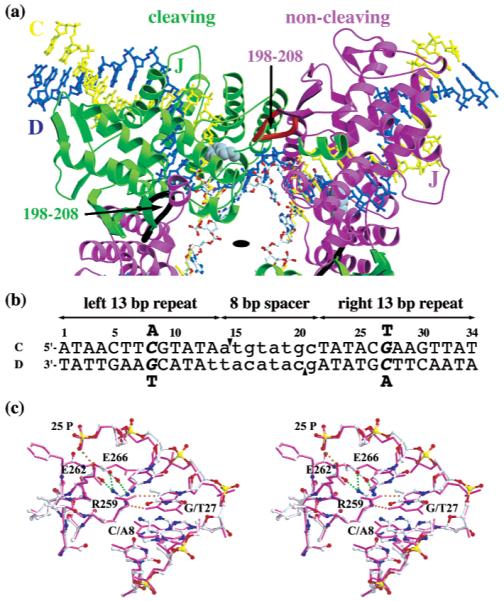
Cre–Lox architecture, Lox sequences, and the substitution site. (a) One-half of the Cre–LoxP-G5 Holliday junction tetramer with the crystallographic 2-fold axis indicated (black oval). The Cre cleaving (green ribbons) and noncleaving subunits (purple ribbons), with the Lox C (yellow balls and stick) and D (blue ball and stick) DNA strands, are shown. Indicated with a J are the positions of the J helices and the loops of residues 276–285 of the Cre subunits, which contain Arg259, Glu262, and Glu266, and are proximal to the A8/T27 Lox substitution. The arrows indicate the loops of residues 198–208 from the cleaving (black) and noncleaving (red) subunits, which both pack near the cleaving subunit active site. The active site Tyr324 side chain is rendered as gray CPK spheres. (b) LoxP and LoxAT recombination sites. The sequence of LoxP is shown. Each Lox site binds two Cre molecules via sequence-specific interactions with the 13 bp inverted repeat sequences (uppercase), while the strand cleaving and rejoining reactions occur within the 8 bp spacer (lowercase) at the scissile phosphate between the 14th and 15th nucleotides on each strand (arrowheads). The position numbering proceeds from left to right, from 1 to 34. Because of the 13 bp repeat symmetry, Lox substitutions are indicated by their positions on each Lox arm. The LoxAT site contains an adenine substitution at position 8 and the corresponding thymine substitution at position 27 (italics). The A8/T27 mutations are shown above and below the two LoxP strands. (c) Stereodiagram of the A8/T27 substitution site. Structure of Cre–LoxP-G5 (purple stick) and Cre–LoxAT (atom color ball and stick) complexes in the vicinity of Arg259 and position 8/27, after superposition of the main chain atoms of the cleaving subunits. Note the rearrangements of the Arg259, Glu262, and Glu266 side chains, as well as the shifts in the D strand of Lox. Dotted lines represent hydrogen bond contacts in Cre–LoxP-G5 (orange) and Cre–LoxAT (cyan) complexes.
Because only protein and two Lox sites are required for efficient strand exchange (10, 12, 13), Cre has been a valuable reagent for manipulation of chromosome structure in cells for site-specific gene deletion, insertion of transgenes, and generation of chromosomal translocations (14, 15). While no exact matches for LoxP have been discovered in mammalian genomes, LoxP-related sequences containing six or seven substitutions in the two 13 bp repeats have been identified (16). However, they lack sufficient function to effectively promote Cre-mediated genome rearrangements. Cre’s utility would be greatly enhanced if it could be reprogrammed to recombine natural chromosomal sequences. To this end, random mutation and in vitro selection techniques have be used to isolate Cre variants that recognize highly substituted Lox sites (17, 18). Rational design would be an alternative strategy for obtaining Cre specificity variants, but little is known about the sequence dependence of Cre reactivity and at what level(s) Cre exerts specificity for LoxP. To delineate these aspects of Cre function, we are investigating the structural and biochemical basis for the reduced activity of substituted Lox sites.
Hartung and Kisters-Woike evaluated Cre binding to LoxP variants containing single symmetrical substitutions in the 13 bp repeats, using an electrophoretic mobility shift assay (EMSA) (19). Cre bound less well to all of the Lox mutants, and substitutions at several critical positions caused a more than 10-fold reduction in occupancy. The Cyt8 → Ade/Gua27 → Thy2 substitution, denoted here as “A8/T27”,3 substantially reduced the affinity for Cre, and the resulting site, denoted here as “LoxAT”, could not promote intramolecular recombination in vivo (see Figure 1b for the numbering system).
To investigate the deleterious effects of this potent substitution and the disruption of a canonical specific protein–DNA interaction, we examined the structural and biochemical properties of the Cre–LoxAT complex. The 8/27 base pair is recognized via a bidentate major groove interaction (Figure 1c), in which Arg259 forms hydrogen bonds between its guanidinium NE and NH2 atoms and the N7 and O6 atoms of Gua27. The interaction is conserved in the FLP recombinase-FRT (20), the λ integrase-attP (T. Ellenberger and H. Aihara, personal communication), and possibly other recombinase–substrate complexes (4). This mode of guanine recognition is relatively common for DNA binding proteins and enzymes (21). Our survey of a limited database of 93 unique protein–DNA complex structures showed that guanine is recognized by arginine 41% (91/220) of the time, and in this manner 8% (17/220 occurrences) of the time. Our results demonstrate that, although the substitution causes only a local perturbation at the protein–DNA interface, Cre discriminates between LoxAT and LoxP at the level of both binding and turnover. Unexpectedly, a glutamate side chain that is near the substitution site, and contacts the phosphate backbone, plays a key role in modulating DNA binding and recombination activity. The enhanced properties of the glutamine-substituted Cre suggest a general connection between DNA affinity and the reactivity of the recombination complex.
EXPERIMENTAL PROCEDURES
Proteins, Plasmids, Oligonucleotides, and 32P Labeling
His-tagged Cre (Cre) was purified by Ni–chelate and cation exchange chromatographies, and treated as previously described (22). All preparations were free of measurable endo- and exonuclease activities under assay conditions. Mutants Cre(E262Q/E266Q), Cre(E262Q), and Cre(E266Q) were created by the method of Kunkel (23).
The substrate plasmids, pLoxP(+) and pLoxA8/T27(+), were created by ligation of a synthetic LoxP duplex into SnaBI/EcoRV-digested pLITMUS38(+) (NEB). The 220 bp BanI/StuI “fLox” fragments for assays were prepared as previously described (9) and labeled at the 5′-end with 2 μM [γ-32P]ATP (3000 Ci/mmol, Amersham) using 50 units/mL T4 polynucleotide kinase (NEB) followed by purification using a Quiagen nucleotide purification kit.
Synthetic oligonucleotides for crystallization and activity assays were obtained from DNA Express (1 μmol scale, RPC-purified) and resuspended in 100 μL of 10 mM Tris-HCl and 1 mM EDTA (pH 8.0) at concentrations of 0.5–2 mM, determined by UV absorbance (24). The synthetic Lox duplexes, “sLox” sites, were created by annealing oligonucleotide pairs in 10 mM Tris-HCl, 1 mM Na-EDTA, and 100 mM NaCl (pH 7.8) from 95 to 25 °C over the course of 30 min using a thermocycler.
Recombination Assays and Analysis
Stock sLoxP was obtained by annealing the component strands at 3–12 μM. Recombination reactions were carried out at 21 °C in optimized reaction buffer (22) [20 mM Tris-acetate, 1 mM Na-EDTA, and 300 mM lithium acetate (pH 8.2)], approximately 1–2 nM 32P-labeled fLox fragment for titration reactions and 1–5 nM for time course reactions, and various amounts of Cre–sLox complexes. Reactions were initiated by combining equal volumes of sLox and labeled fLox DNA with Cre in a 2-fold concentrated reaction buffer solution and quenched as described below. Aliquots (7 μL) were loaded onto 10% polyacrylamide gels (20:1 bisacrylamide: acrylamide ratio) containing Laemmli SDS–PAGE buffers (25) and were electrophoresed at 200 V for 2–2.5 h. Vacuum-dried gels (at 80 °C for 1 h) were used to expose an image plate (Fuji BAS-MS 2040), which was then scanned with an image plate reader (Molecular Dynamics Storm 860). The data were visualized and analyzed with ImageQuant (Molecular Dynamics).
In complex assembly titration assays, 15 μL reaction mixtures contained ~1 nM labeled fLoxP or fLoxAT and 30, 60, 90, 120,150, 200, or 400 nM sLoxAT and 120, 240, 360, 480, 600, 800, or 1600 nM Cre or CreQQ, or 15, 30, 45, 60, 90, 150, or 400 nM sLoxP and correspondingly 60, 120, 180, 240, 360, 600, or 1600 nM Cre or CreQQ. The reactions were quenched after 4–16 h with 1% SDS, 6% glycerol, and 20 mM DTT (final concentration), digested with proteinase K (0.5 mg/mL, 30–60 min, 37 °C), and analyzed by gel electrophoresis.
Complex turnover kinetic assays contained 1200 nM sLoxP or sLoxAT, the corresponding labeled fLox (~5 nM), and 4800 nM Cre or CreQQ, in a total volume of 100 μL. Time point samples, 10 μL, were removed from the reaction at 30, 60, 120, 240, 480, 960, or 1720 s, and the reactions were quenched with 3 μL of loading buffer (final concentrations of 1% SDS, 20 mM DTT, 6% glycerol, and 0.05% BPB).
Assembly parameters were determined by fitting the gel data, using Excel, to the following modified Hill equation (26):
where the measured quantities were [complex], the total complex concentration in the reaction mixture, and v’, 100 minus the observed percentage of substrate reacted, based on the fraction of counts in the 220 bp substrate band compared to the total counts that could be attributed to substrate, intermediates, and products. The fit parameters were as follows: f, maximum percentage of substrate that can react, or “extent”; KD, apparent dissociation constant; and α, apparent Hill coefficient. The initial estimates were obtained from the linear regression of the Hill equation, followed by manual fitting in which R2 and the residual v’(obs) – v’(calc) were minimized.
The kinetic parameters were determined as previously described (9) by fitting the progress data to the biexponential function
where the measured quantities were as follows: t, time from starting the reaction until quenching; and v’, defined as described above. The fit parameters were as follows: f, percentage of substrate reacted at infinite time, i.e., the extent of the reaction for that experiment; A and k1, amplitude and rate constant for the slow phase, respectively; and k2, rate constant for the fast phase.
Crystallization, Data Collection, and Refinement
Crystals of the Cre–LoxAT complex were grown using hanging drops over reservoirs containing, at pH 5.25, 24–28% 2-methyl-2,4-pentanediol, 25 mM sodium acetate, 30 mM CaCl2, and 40 mM NaCl, at 21 °C as previously described (9). Crystals diffracted to 2.3 Å and were in space group C2221, isomorphous to those for the Cre–LoxP-G5 complex (9) and other Cre structures (8). Data were collected at SSRL beamline 9-2 using a CCD camera (ADSC Quantum 4). Diffraction data were indexed and processed with MOSFLM (27), and scaled using SCALEA (28) assisted by the Wedger program from the Elves package (29). Data collection statistics for the Cre–LoxAT complex are given in Table 2.
Table 2.
Data Collection and Refinement Statistics for the Cre–LoxAT Complexa
| Data Set | |
| resolution (Å) (last shell) | 2.3 (2.35–2.3) |
| no. of measurements | 168540 |
| no. of unique reflections | 51997 (3473) |
| coverage (%) | 96.5 (97.7) |
| Rosy (%) (last shell) | 3.4 (27.5) |
| wavelength (Å) | 0.9800 |
| Refinement | |
| resolution (Å) | 5–2.3 |
| space group | C2221 |
| unit cell (Å) |
a = 107.54, b = 122.24, c = 180.03 |
| no. of reflections (% completeness) | |
| working set | 43981 (92) |
| free set | 2383 (5) |
| total no. of atoms | 6699 |
| no. of protein atoms | 5069 |
| no. of DNA atoms | 1347 |
| no. of solvent atoms | 283 |
| average B | 55.8 |
| protein | 56.7 |
| DNA | 52.3 |
| solvent | 57.3 |
| rmsd for bond lengths (Å) | 0.006 |
| rmsd for bond angles (deg) | 1.19 |
| rms B (overall) (Å2) | 2.68 |
| R factor | 0.240 (0.390) |
| R free | 0.290 (0.363) |
| PDB entry | 1MA7 |
Data were collected at SSRL, beamline 9-2, using an ADSC CCD detector, integrated by MOSFLM (27), and merged with SCALEA (28) assisted by Wedger Elves (29). The merging R values were based on intensities for all of the data calculated by SCALEA (28). Rfree and Rfactor values were calculated by TNT (30) using the following scaling parameters as described in Experimental Procedures: K = 1.2204, B = 0.28672, and KSOL and BSOL = 0. Model deviations from ideal geometry were calculated by TNT using Engh and Huber parameters (31) and the modified BCORRELS library (9, 32). Average model B factors were calculated by EDPDB (34).
Refinement was carried out using TNT (30) with geometry (31) and B factor restraints (32) as previously described (9). The Rfree value, calculated with 5% of the data, was used to optimize the number of refinement cycles and other variables throughout the procedure (33). The starting model was the Cre–LoxP-G5 complex (PDB entry 1KBU). LoxP nucleotides were modeled at positions Cyt5C and Gua30D,4 and the occupancies of atoms for the Cyt8 and Gua27 bases and Arg259, Gu262, and Glu266 side chains were set to zero. Initial rigid body refinements were performed using first the entire asymmetric unit at 4 Å, then individual subunits at 4 Å, and finally elements of secondary structure at 3.3 Å and then at 3.0 Å. At this point, all data were used and observed structure factors were scaled to the model using the following parameters: B = 0.0, KSOL = 0.9, and BSOL = 150.0. All B factors were set initially to the Wilson B, and between positional refinements, an overall B factor for each rigid body was refined. Subsequently, positional refinement, and then positional with restrained B factor refinements, were performed at 2.6 Å resolution and then at 2.3 Å resolution. The resulting structure had an Rfree value of 33.7%. In Fo – Fc maps, both the Lox substitutions and side chain rearrangements were readily apparent and were fit at this time. To guide model building, Fo – Fc difference maps were generated from models in which 30-residue segments were omitted prior to refinement. Water molecules were added by inspection of difference maps. In the later rounds of model building and refinement, only the 5–2.3 Å data and no solvent model were used because of poor low-resolution scaling (22).
The final model contains an asymmetric Cre dimer, a complete LoxP DNA site, and 283 solvent atoms. The final refinement statistics are given in Table 2. Twelve percent and 3% of the protein or DNA atoms have B factors of 80–99 and 100 Å2, respectively, but are included in the model because there was corresponding electron density visible in omit maps. Density for “hinge” residues 328B–332B was completely absent, and these atoms were not included in the final model. This region was also absent in the Cre–LoxP-G5 complex. There was no apparent electron density for the entirety of residues 188A, 191A, 215A, and 278A, and the side chains of 22A, 132A, 210B, 277B, 60B, and 320B. The occupancies of these atoms are set to zero, and their inclusion in the model is based primarily on geometric constraints. In addition, residues 184A–195A, 275A–285A, 303A–319A, and 300B–341B have interrupted or somewhat blurry electron density. The combination of density and geometric constraints is adequate for approximating their positions, but the model in these regions has lower precision.
Structural Comparisons
Superpositions, root-mean-square deviations (“rmsd”), root-mean-square B factor differences (“rmsΔB”), and other structural comparison parameters for model analysis were determined with the aid of EDPDB (34). Unless specified, structural shifts were measured as the rmsd of common sets of atoms between structures. For protein comparisons, the following sets of main chain atoms were used: 20A–341A, 20B–328B, and 333B–341B. For DNA comparisons, all atoms were used except those for the bases at substituted sites, positions 5C, 30D, 8C, 8D, 27C, and 27D.
Except where noted, omit refine difference maps were calculated by first removing atoms from the final structure and then refining with 30 cycles of conjugate directions minimization using TNT to reduce the contribution of model bias. The refinement weights were adjusted to maintain geometry and B correlation deviations. Figures were created with MOLSCRIPT (35) followed by rendering with RASTER 3D (36).
Protein Data Bank Accession Numbers
The structure factors and coordinates for the Cre–LoxAT structural model were deposited in the Protein Data Bank (entry 1MA7). Structural comparisons were performed with the Cre–LoxP-G5 structure (PDB entry 1KBU).
RESULTS
LoxAT Is a Functional Substrate with a Reduced Affinity for Active Complex Assembly
Since LoxAT failed to promote recombination in vivo (19), we determined whether Cre could recombine it in vitro. Cre-mediated reaction between a synthetic 34 bp LoxP site and a 5′-end-labeled LoxP-containing 220 bp restriction fragment resulted in the accumulation of labeled 141 and 113 bp products and the Holliday junction intermediate (HJ). When 1200 nM Cre and 300 nM synthetic LoxP were reacted in optimized buffer with ~1 nM labeled LoxP restriction fragment, nearly 70% of the labeled substrate was converted to HJ and products (Figure 2a, lane 7). Incomplete substrate conversion in Cre reactions has been previously documented (18, 38) and attributed to the inability of the recombination complex to dissociate (18). An alternate explanation is that approximately one-third of the complexes are aberrantly assembled in vitro. When the same concentrations of Cre and synthetic LoxAT were reacted with the labeled LoxAT fragment, a similar level of turnover was observed, demonstrating that it is a functional substrate (Figure 2a, lane 14). While this work was in progress, another report appeared showing that Cre recombined a variant Lox site containing several substitutions, including Cyt8 → Ade, in an intramolecular excision reaction (37).
Figure 2.
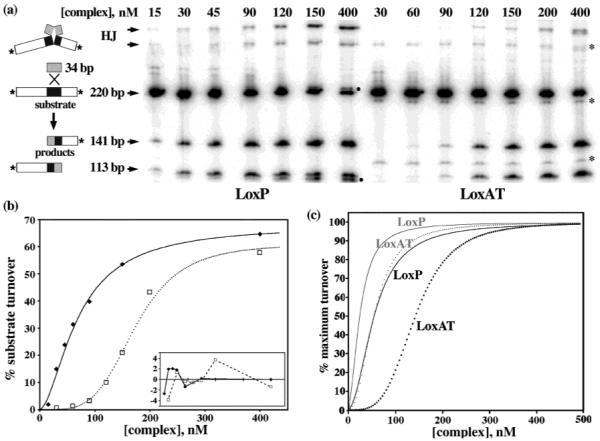
Cre–LoxP and Cre–LoxAT complex assembly titration reactions. (a) Reaction scheme and raw gel data from phosphorimaging. Cre-mediated recombination between synthetic LoxP or LoxAT duplexes (34 bp) and end-labeled LoxP- or LoxAT-containing restriction fragments (220 bp) yields Holliday junction intermediates (HJ) and two products (141 bp and 113 bp). The HJ designation is assigned on the basis of the strand composition determined from denaturing electrophoresis of gel-purified material, with the upper and lower bands having identical compositions (K. Gelato and E. P. Baldwin, unpublished results). Different concentrations of the 4/1 Cre–Lox complex were reacted for 14 h, quenched, digested with proteinase K, and electrophoresed on a 10% SDS gel, as described in Experimental Procedures. The products that are derived from proteinase K digestion of covalent intermediates (●) are seen only in Cre–LoxP reactions. Impurities in the LoxAT preparation are also marked (*), and were not quantified. The results after incubation for 4 h were similar (data not shown). (b) Quantification and fitting of data for a single experiment from the gel shown in panel a. Data were fit to a modified Hill function, as described in Experimental Procedures. The fit parameters for this experiment, apparent KD, Hill coefficient, and reaction extent, were as follows: 70 nM, 1.7, and 68%, respectively, for the Cre–LoxP complex (–) and 174 nM, 4.1, and 61%, respectively, for the Cre–LoxAT complex (⋯). The residuals for the two curves are shown in the inset. (c) Titration curves for the Cre–LoxP (black solid line), Cre–LoxAT (black dotted line), CreQQ–LoxP (gray solid line), and CreQQ–LoxAT (gray dotted line) complexes, generated from the Hill equation for data normalized to an extent of 100% and the averaged parameters from Table 1.
To quantitatively characterize Cre’s interaction with LoxAT, we used an “assembly titration assay”. Different concentrations of Cre and synthetic LoxP or LoxAT, in a fixed 4:1 ratio, were reacted with 1 nM labeled LoxP or LoxAT fragments, and the “end point” amount of the substrate that reacted was determined. We chose this approach because of the complex equilibria that are involved. The high affinity and cooperative dimerization of Cre on LoxP (38) would require using low nanomolar Lox concentrations to avoid stoichiometric binding. However, the dissociation constant for formation of the Cre4LoxP2 tetramer from Cre2LoxP dimers is unknown. In our experiments, the amount of product formed at 5 nM synthetic LoxP at saturating Cre is barely detectable (data not shown). To avoid this problem, Santoro and Schultz (18) determined the concentration dependence of intramolecular recombination, but we felt that potential constraints from the DNA loop formation might contribute to assembly equilibria and kinetics. Our assay has the advantages that Cre concentration is never limiting, and with low concentrations of labeled Lox fragment, the free Cre2Lox concentration is approximated by the total. However, we cannot effectively uncouple monomer binding, dimerization, and tetramerization to obtain quantitative measurements of the dissociation constant for the Cre–DNA complex. Nonetheless, this approach allows for semiquantitative assessment of Cre–substrate interactions, in a context that is directly relevant to recombination activity.
The raw results of representative reactions are shown in Figure 2a. Both reaction end points plateau at similar maxima, but more Cre–LoxAT complex is required to achieve the same reaction extent. The concentration dependence observed here and by others (18) suggests that there is a critical time-dependent assembly step, and if active complexes do not form within a specific interval, they are sequestered into a dead-end pathway. While both reactions had sigmoidal concentration dependences, this behavior was more pronounced for LoxAT. To quantitatively compare the two titrations, the data for each replicate were individually fit to a Hill function as described in Experimental Procedures, with three variables: reaction extent, an apparent dissociation constant (KD), and a Hill coefficient. It is unlikely that more than a single turnover occurs under these reaction conditions. The stability of the reactive complex (38) and the presence of a 15–400-fold excess of unlabeled substrate limit Cre’s ability to dissociate and reassemble on other labeled substrates or products. Therefore, the apparent KD is expected to reflect the distribution between reactive and nonreactive species prior to recombination. The exact meaning of the Hill coefficient is unclear but may reflect a combination of the number of Cre or Lox molecules and their cooperative interactions involved in assembling the reactive species.
The apparent KD values were 58 nM for the Cre–LoxP complex and 146 nM for the Cre–LoxAT complex; that is, 2.5-fold more Cre–LoxAT complex was required to achieve half-maximal substrate turnover compared to the amount of Cre–LoxP complex. The Hill coefficient of the LoxAT reaction was nearly twice as large as that for LoxP, 2.1 versus 3.9. The averaged values and their standard deviations for five to six completely independent reactions are shown in Table 1. The theoretical curves shown in Figure 2c were generated using the averaged fit parameters.
Table 1.
Parameters for Complex Assembly and Single-Turnover Reactions of Cre and CreQQ with LoxP and LoxAT Substratesa
| binding parameters |
kinetic parameters |
|||||
|---|---|---|---|---|---|---|
| complex | extent | KD (nM) | Hill coefficient | A | k1 (×103 s−1) | k2 (×103 s−1) |
| Cre–LoxP | 67 ± 8 | 58 ± 13 | 2.1 ± 0.8 | 0.42 ± 0.02 | 4.5 ± 1.3 | 32 ± 3 |
| Cre–LoxAT | 57 ± 8 | 146 ± 22 | 3.9 ± 0.3 | 0.87 ± 0.04 | 2.7 ± 0.6 | 35 ± 6 |
| CreQQ–LoxP | 41 ± 9 | 27 ± 6 | 2.0 ± 0.6 | 0.54 ± 0.05 | 14 ± 0.2 | 120 ± 5 |
| CreQQ–LoxAT | 56 ± 3 | 58 ± 7 | 2.5 ± 0.4 | 0.43 ± 0.01 | 9 ± 0.1 | 93 ± 6 |
Binding parameters are given as the averaged values ± standard deviation for five (CreQQ) or six (Cre) completely independent experiments, in which sets of seven data points from individual experiments were fit to a modified Hill function (see Experimental Procedures). Representative data for individual experiments are shown in Figure 2. Kinetic parameters are given as the averaged values ± standard deviation for three (Cre–LoxP, CreQQ–LoxP, and CreQQ–LoxAT) or five (Cre–LoxAT) independent measurements. The parameters were fit as described in ref 9 and in Experimental Procedures. Representative data and the averaged data points with fit progress curves are shown in Figure 3.
The half-saturating concentration for Cre in the LoxP reaction was higher than that reported previously for Cre binding, 4 nM, measured using mobility shifts (38). This discrepancy may be a result of the higher salt level in our assay buffer (320 mM) compared to the bandshift conditions (210 mM), and the fact that one substrate is a minimal 34 bp LoxP site rather than an ~100 bp restriction fragment. The dimer–tetramer equilibrium may also contribute to these isotherms. Our result is closer to that reported for an end point assay of intramolecular recombination, 28 nM (18) performed under similar ionic strengths, but at pH 7.5 rather than at pH 8.2. The increased Hill coefficient is also consistent with the reduced level of Cre dimerization on LoxAT observed in EMSA experiments (19). Intramolecular titrations with another reduced binding substrate yielded a similar increase in the Hill coefficient (18).
Cre Kinetically Distinguishes between LoxAT and LoxP after Recruitment of Protein to DNA
To determine whether Cre reactivity is modulated by the Lox DNA sequence, we followed the time courses of LoxP and LoxAT reactions under conditions of saturating Cre2Lox complex, 1200 nM Lox, and 4800 nM Cre. Under these conditions, turnover rates had no concentration dependence, since progress curves obtained at half the complex concentration were virtually superimposable (data not shown). Since DNA was saturated with protein and the initial association steps were not rate-limiting, the reaction time courses were expected to reflect single-turnover rates for the complex. As depicted in Figure 3a, the LoxAT reaction is clearly slower than the LoxP reaction. To quantitate this difference, the progress data were fit to an arbitrary kinetic model. As we previously observed for Cre reactions with suicide substrates (9), the time evolution of products was less well fit by a two-parameter single-exponential model than by a four-parameter two-exponential model (see Experimental Procedures). In Figure 3b, the time course data are plotted with theoretical curves generated from the averaged parameters after normalization to the different reaction extents. The rate parameters in Table 1 are given for comparison purposes, but their correspondence to actual mechanistic steps is unknown. Nonetheless, it is clear that Cre distinguishes between the two substrates through reaction velocity as well as through the ability to assemble an active complex.
Figure 3.
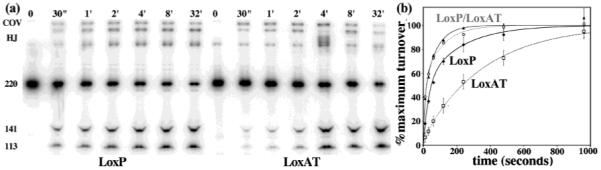
Raw gel data and progress curves for single-turnover time course reactions. (a) Aliquots were withdrawn from reaction mixtures containing 1200 nM LoxP or LoxAT and 4800 nM Cre at the indicated times, quenched, and electrophoresed using SDS–PAGE, as described in Experimental Procedures. The various reaction products and intermediates are indicated on the left. The covalent intermediate (“COV”) is visible because the samples were not digested with proteinase K. (b) Averaged reaction progress data and curve fits for the Cre–LoxP (◆ and line), Cre–LoxAT (□ and dotted black line), CreQQ–LoxP (▲ and solid gray line), and CreQQ–LoxAT (○ and dotted gray line) complexes. Data for each independent experiment were fit to the biexponential function described in Experimental Procedures. The data points were then normalized to 100% using the fit reaction extents, and averaged. The error bars correspond to ±standard deviation for each time point from three to five experiments. The normalized curves are drawn using the parameters from Table 1. The amount of substrate conversion for the 16 min time points, not shown on the gel, was similar to the amount for the 32 min time points not shown on the graphs.
The kinetic behaviors suggest that substrate turnover is partitioned into two processes whose rates differ by 1 order of magnitude. The apparent slower turnover rate of the Cre–LoxAT complex compared to that of the Cre–LoxP complex was primarily a consequence of a nearly 9-fold preference for reacting via the slower pathway compared to LoxP. In addition, there was a 40% reduction in the rate of the slower phase. Overall, the initial rate for the Cre–LoxAT complex was 4-fold slower, and the half-time increased by nearly 5-fold, as extracted from the simulated curves.
Crystal Structure of the Cre–LoxAT Complex
To examine the structural basis for the altered reactivity of LoxAT, we crystallized the Holliday junction complex (9) and determined the structure to 2.3 Å resolution (as described in Experimental Procedures). The final Cre–LoxAT model had Rwork and Rfree values of 24.0 and 29.0%, respectively. The data collection and refinement statistics are given in Table 2. The structure was isomorphous to previously reported Cre–Lox structures (6, 8), but was most similar to the Cre–LoxP-G5 structure, which we previously determined at 2.2 Å resolution (9). The Cre–LoxP-G5 complex was used as a starting model for the refinement of the Cre–LoxAT complex as well as for our “wild-type” reference model for comparisons, since the Gua5 substitution caused minimal structural perturbations when compared to the Cre–LoxP complex at 2.6 Å resolution (K. Gelato, J. Abel, and E. P. Baldwin, unpublished data).
As with the Cre–LoxP-G5 complex, Cre and LoxAT spontaneously formed a Holliday junction complex in which the DNA strands were uncleaved, indicating that the first set of strand exchanges had occurred (9). Overall, the complexes are quite similar, and the Cre–LoxAT structure corroborated previous observations, such as the association of the cleaving subunit with the left arm of Lox, the positioning of the loop of residues 198–208 in the active site, and interactions between Lys86 and Lys201, and the scissile nucleotide. The “open” Holliday junction that predominated in the Cre–LoxP-G5 complex was even more highly populated. The completely paired junction, observed in the Cre–Holliday junction complex from Gopaul et al. [PDB entry 3CRX (40)], was not sufficiently occupied to be included in the refined structure. There are also several poorly defined protein regions in both structures (see Experimental Procedures for details).
Structural Changes near the Substitution Site
Because of the symmetrical substitutions within LoxAT, each mutation site is associated with a cleaving subunit or a noncleaving subunit. The overall cleaving subunit conformation was quite similar to that of the Cre–LoxP-G5 complex, with rmsd values of 0.76 and 0.45 Å for all atoms and main chain atoms after superposition, respectively (Figure 7a). In this subunit, structural changes were localized to three side chains near the mutation site, Arg259, Glu262, and Glu266, with an rmsd of 0.23 Å for atoms within 7 Å of Arg259, excluding the Arg259, Glu262, and Glu266 side chains (Figures 1c and 4a). The initial omit-refine Fo – Fc difference map at the substitution site is shown in Figure 4a, superimposed on the final model. The omit-difference density confirmed the presence of the Ade-Thy base pair substituted for the Cyt-Gua base pair, and revealed the response of Cre to the substitution. In other Cre–Lox complexes, the Arg259 guanidinium group is nearly coplanar with Gua27D forming a bidentate hydrogen bond interaction. In the Cre–LoxAT complex, this moiety shifted 1 Å, away from 27D, and rotated 41° out of plane. Potential interaction with the Thy27D O4 atom was sterically occluded by the thymine methyl group, which contacted CZ of Arg259 at 3.5 Å. The shift in the Arg259 side chain was accompanied by repositioning of two nearby negatively charged residues, Glu262 and Glu266. The Glu262 side chain shifted 0.5 Å to form a hydrogen bond with NH1 of Arg259, while Glu266 rotated 120° and shifted 3.3 Å to form a hydrogen bond with NH2 of Arg259. Other than the hydrogen bond with Arg259 in the Cre–LoxAT complex, Glu266 has few interactions with protein or DNA in either structure. However, in the Cre–LoxP-G5 complex (9) and other Cre–Lox complexes (8, 39, 40), Glu262 makes a close contact, 2.7 Å, with the phosphate backbone O1P of residue 25D. The shift in the Cre–LoxAT complex moved Glu262 closer to the phosphate, forming an in-line hydrogen bond bridge between Arg259 and the phosphate oxygen (Figure 4b). In all likelihood, this buried negative charge contributes unfavorably to the Cre–Lox interaction. The observed close contact distance may be promoted by protonation of Glu262 under crystallization conditions (pH 5.25), but the proximity of Glu262 to the DNA is enforced by the steric environment. In all complex structures, the gauche(−) χ1 rotamer is occluded by the carbonyl of Arg259. In the Cre–LoxAT complex, the trans rotamer would be blocked by Glu266. In other Cre–Lox complexes, the trans rotamer would be barely allowed, but Arg259 and Ser287 (not shown) would hinder rotation of the carboxyl group, about χ2, away from the 25D and 26D phosphates.
Figure 7.
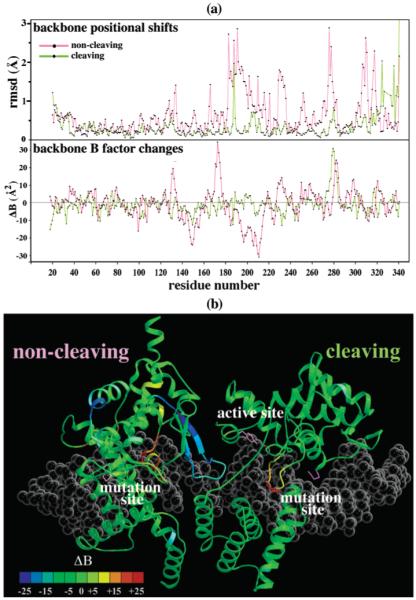
Structure and mobility differences between the Cre–LoxP-G5 and Cre–LoxAT complexes. (a) Main chain rmsd for the cleaving (green) and noncleaving (purple) subunits after superposition (see Experimental Procedures) and main chain B factor differences between the cleaving (green) and noncleaving (purple) subunits. A negative value of ΔB indicates a lower mobility in the Cre–LoxAT complex. (b) B factor differences mapped onto a ribbon diagram of the cleaving (right) and noncleaving (left) subunits. The color scale is given at the bottom left. The positions of the active site and Lox mutation sites are labeled. The side chains for Arg259A, Arg259B, and Tyr234B are shown as purple sticks.
Figure 4.
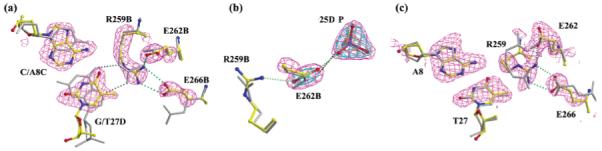
Fourier omit-difference maps and structure comparisons at the substitution sites. Difference maps were calculated using the coefficients Fobs – Fcalc and model phases. (a) Structural changes in the cleaving subunit. The model was derived from initial refinement using the Cre–LoxP-G5 structure, as described in Experimental Procedures, in which the base atoms for positions 8C and 27D and the side chain atoms of Arg259B, Glu262B, and Glu266B were first removed (Rfree = 33.7%). The contour level of the map is 3.0σ. The Cre–LoxP-G5 structure (gray sticks) is compared with the final LoxAT structure (atom-colored ball and sticks) after superposition of the main chain atoms for residues B20–B325. (b) Structural changes in the interaction between Arg259B, Glu262B, and the 25D phosphate, comparing the Cre–LoxP-G5 structure (gray sticks) and the final LoxAT structure (atom-colored ball and sticks) after subunit superposition as in panel a. The omit-refine difference map was calculated as described in Experimental Procedures from refinement of the final model with Glu262B, and the 25D phosphate atoms were removed. The Rfree after refinement was 29.3%. The map is contoured at 15σ (gold), 7σ (blue), and 3.5σ (purple). (c) Structural comparison of cleaving (gray sticks) and noncleaving subunit (atom-colored ball and sticks) substitution sites. The omit-refine difference map was calculated as described in Experimental Procedures from refinement of the final model after removal of base atoms for position 8D and 27C nucleotides and the side chain atoms of Arg259A, Glu262A, and Glu266A. The Rfree after refinement was 29.2%. The map is contoured at 2.0σ.
In the noncleaving subunit, the structural changes near the substitution site were qualitatively similar, but with differences in the details of positioning and order (Figure 4c). In the Cre–LoxP-G5 complex, the helix containing Arg259 is translated 0.5 Å toward its C-terminus and 0.5 Å below the plane of the Cyt8-Gua27 base pair, accompanying a 10° difference in the twist of the Gua27 base, relative to the cleaving subunit position. This interface is less well ordered, with increased B factors for residues 257-266 of the recognition helix (rmsΔB = 19 Å2) and for the three base pairs centered on positions 8 and 27 (rmsΔB = 9 Å2). In the Cre–LoxAT complex, the A8/T27 mutation was associated with a further increase in flexibility as evidenced by the less well-defined electron density (Figure 4c). Relative to the cleaving subunit in the Cre–LoxAT complex, the Arg259 side chain rotated 120° about χ3, shifting the guanidinium group further away from the 8/27 base pair. In conjunction, Glu262 rotated 90° and maintained the salt linkage with Arg259, but had a somewhat different interaction with the DNA backbone, with the carboxyl plane packed against O1P of residue 25C (not shown). The Fo – Fc density is also consistent with fluctuation of Arg259 and Glu262 between the positions depicted in Figure 4c and those in the cleaving subunit (Figure 4a).
The DNA conformation near the mutation site was altered in terms of the base stacking patterns, phosphate backbone position, and nucleotide mobilities (Figures 1c and 5). These changes were localized to the strand that contains the Gua27 → Thy substitution and faces away from the Cre–DNA interface. In contrast, the strand containing the Cyt8 → Ade substitution had only small perturbations, presumably because of constraints imposed by Cre contacts. In the cleaving subunit-bound half-site, the Thy27 nucleotide was rotated ~13° in the base plane perpendicular to the helical axis, in association with the close steric contact between Arg259 and the 5-methyl group of Thy27 (Figure 1c). This shift moved residue 27D’s sugar-phosphate backbone by 1.6 Å, locally overwinding the DNA and reducing the minor groove width by up to 2 Å. The backbone shifts were localized to residues 26–28 and were associated with a restacking of bases 26 and 27 (Figure 5b, left panel). Base Thy27D unstacked with Ade28D via a 0.5 Å increase in rise and an 8° increase in tilt. The Cyt26D base also unstacked with Thy27D via a 14° propeller twist in the Gua9D-Cyt26D base pair and instead stacked on Ade25D. In the noncleaving subunit half-site, the DNA backbone shift was comparable (Figure 5a). While Cyt26C was similarly restacked, Thy27C unstacked with Ade28C via a 0.3 Å change in rise, with no change in tilt (Figure 5b, right panel). These Lox alterations were accompanied by decreased order in the loop of residues 276–285, which loosely contact the phosphodiester backbone in this region (Figure 7b,c).
Figure 5.
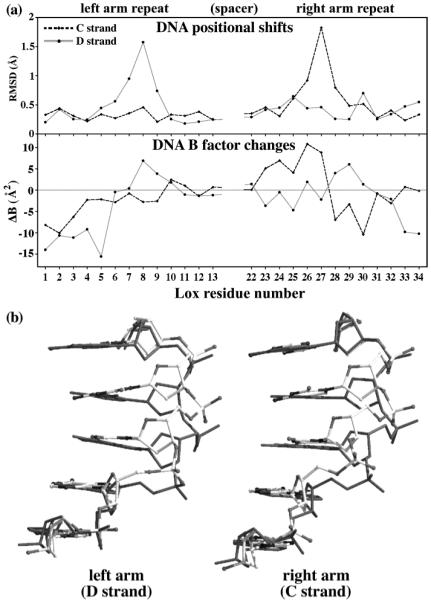
Structure and mobility differences between the 13 bp repeats of Cre–LoxP-G5 and Cre–LoxAT complexes. (a) Comparisons of the C strand (gray solid line) and D strand (black dotted line), with residue numbers as in Figure 1b: (top) averaged nucleotide rmsd after superposition of the individual repeats and (bottom) averaged B factor differences. A negative ΔB corresponds to a decreased B factor in LoxAT. (b) Comparison of base stacking patterns in LoxP (solid dark gray sticks) and LoxAT (ball and sticks) for the strand containing the guanine-to-thymine substitution for the left and right arm repeats.
Structural Changes at the Active Site
We compared the cleaving subunit active sites of the Cre–LoxP-G5 and Cre–LoxAT complexes to determine structural changes that might be associated with the reduced reactivity of LoxAT. After superposition, the rmsd in atom positions is 0.8 Å for the six key catalytic residues and the scissile nucleotides (Figure 6). The Arg173, Trp315, and Tyr324 side chain shifts apparently improved hydrogen bonding with the scissile phosphate in the Cre–LoxAT complex. The hydrogen bonds from Arg173 and Trp315 were more coplanar with the guanidinium and indole moieties. The hydrogen bond of the Tyr324 phenolic oxygen was transferred from the Thy15C phosphate to the scissile phosphate, facilitated by a 0.9 Å shift of its associated helix M toward the active site (where the shift is the main chain rmsd for residues 318–326 after superposition of the cleaving subunits). Although the overall orders of the active sites are similar (rmsΔB = −1.5 Å2), the improved hydrogen bonding of Arg173 and Trp315 was associated with increased order, with rmsΔB values of −5.0 and −6.4 Å2, respectively. The active site structure of LoxP-G5 is corroborated by the 2.6 Å Cre–LoxP structure, mentioned above.
Figure 6.
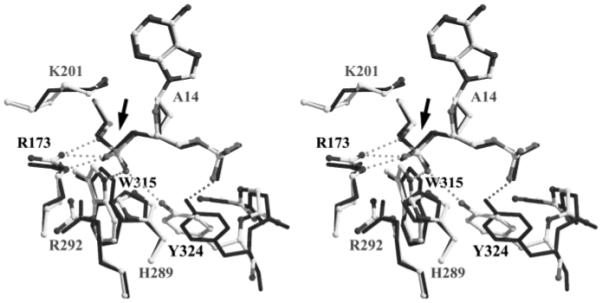
Comparison of the active site structures. Active site atoms of the Cre–LoxP complex (solid sticks) were superimposed using the main chain atom positions of Arg173 (R173), Lys201 (K201), His289 (H289), Arg292 (R292), Trp315 (W315), and Tyr324 (Y324) and the scissile phosphorus atom (arrow) of the Cre–LoxAT complex (gray scale ball and sticks). Discernible changes in hydrogen bonding with the scissile phosphate (arrow) are shown in stippled lines, and the residues that are involved are indicated by black type.
Long-Range Changes in the Complex
Aside from the shifts near the substitutions and active site, the atom positions and B factors in the Cre–LoxAT cleaving subunit were comparable to those in the Cre–LoxP-G5 complex (Figure 7a). In Cre–Lox complex structures in general, the noncleaving subunit is less well-ordered and makes fewer protein–DNA contacts. In the Cre–LoxAT complex, the noncleaving subunit exhibited larger perturbations, with a main chain rmsd of 0.8 Å (Figure 7b). Compared to the Cre–LoxP-G5 complex, the LoxAT noncleaving subunit center of mass was shifted 0.4 Å relative to its half-site, and shifted 0.3 Å and rotated 1.4° relative to the cleaving subunit. The positional differences were concentrated in the C-terminal domain, residues A132–A326, which were shifted 0.5 Å and rotated 1.2° relative to the DNA, and shifted 0.6 Å and rotated 2.3° relative to the cleaving subunit. The loop of residues 198–208 showed the greatest positional shifts, with a main chain rmsd of 1.2 Å after superposition of the noncleaving subunit, and became significantly more well ordered, with an rmsΔB of −18 Å2 (Figure 7b). In the noncleaving subunit, this loop forms an interface with the cleaving subunit near the active site and DNA junction via contacts with residues B85, B86, B125, B130, B131, and B232 (Figure 7b), while in the cleaving subunit, it places catalytic residue Lys201 in its own active site (Figures 1a and 6). The reduction in mobility for this segment may indicate a more stable association of this loop with the neighboring active site or DNA (Figure 7b).
Cre Substituted with Q262 and Q266 Has Increased Assembly Proficiency and Turnover Rate but a Reduced Capacity for Substrate Discrimination
What are the functional implications of the apparent compensation of lost hydrogen bonds between DNA position 27 and Arg259 by Glu262 and Glu266? To investigate their role in substrate recognition, we mutated Glu262 and Glu266 to glutamine and tested the resulting protein, CreQQ, for reactivity with LoxP and LoxAT. CreQQ assembled complexes more readily with LoxAT than Cre (Figure 2c and Table 1), having a 2.5-fold lower apparent KD (58 nM). More strikingly, the sigmoidal concentration dependence for the CreQQ–LoxAT complex was much less pronounced, as evidenced by the smaller Hill coefficient, 2.5, compared to a value of 3.9 for the Cre–LoxP complex. CreQQ also bound more tightly to LoxP (27 nM versus 58 nM), but with a concentration dependence similar to that of the Cre–LoxP complex, and Hill coefficients of 2.0 versus 2.1.
CreQQ reacted with both substrates much more rapidly with a greatly diminished ability to distinguish them (Figure 3b and Table 1). In contrast to the substrate differences in Cre reactions, the initial rates and half-times in CreQQ reactions were nearly identical. Both the slow and rapid phases increased between 3- and 4-fold for both substrates. Further, in contrast to the difference between the Cre–LoxP and Cre–LoxAT complexes, both CreQQ complexes preferred to react via the fast pathway.
DISCUSSION
Studies of restriction enzymes have defined the modes for sequence specificity in protein–DNA catalysts (41-43). While enzyme recruitment to the recognition site through favorable sequence-dependent contacts contributes to specificity (“binding specificity”), regulation of turnover through specific DNA–protein interactions (“postbinding specificity”) can be even more significant. Other enzymes also exhibit substantial postbinding specificity (44). Generally, such substrate discrimination is exerted at the catalytic step via a direct connection between substrate recognition elements and the catalytic machinery.
How specificity is mediated in Cre–Lox recombination is open to question. The large protein–DNA interface and favorable protein–protein interactions might be expected to lead to greater tolerance of single-nucleotide changes, and the ability to modulate reactivity through connections between DNA binding and active site residues would likely weaken over the distance between them. Our results suggest that Cre utilizes both binding and postbinding mechanisms for discriminating between LoxP and the LoxAT substrate, since a higher concentration of Cre and LoxAT was required to achieve the same level of substrate turnover as with LoxP and, once formed, the complexes reacted more slowly.
The difference in the apparent association constants for complex assembly was modest, and likely a result of poorer substrate binding by Cre monomers suggested by previous EMSA data (19). The increased Hill coefficient is consistent with a reduction in the level of cooperative Cre dimerization on Lox, which also corroborates the EMSA results. However, the equilibria that are responsible for the titration behavior are open to question, since the contributions of Cre monomer binding, dimerization, and tetramer assembly are not separable. While the previously recorded EMSA data and the observed structural perturbations would suggest a DNA binding defect, Lox mutations might also affect the dimerization or tetramer assembly through changes in subunit positioning. The limiting equilibrium might be different for each substrate, for example, tetramer formation with LoxP and DNA binding with LoxAT.
This modest difference in concentration dependence in vitro does not readily account for LoxAT inactivity in vivo, as such assays are generally highly sensitive with a large dynamic range, >104 (16, 18, 19). Although reactions in vitro are not directly comparable to those in vivo, a sigmoidal concentration dependence for assembly would amplify relative small differences in KD. This amplification would be particularly significant at the low complex concentrations expected in Escherichia coli, ~10−8–10−9 M for an intermolecular recombination reaction between a single unlinked pair of Lox sites (45) and ~10−7–10−8 M for intramolecular recombination between optimally spaced sites between 500 and 1000 bp apart (46). The degree of specificity at particular complex concentrations can be estimated by the ratio of their fractional saturations, determined from the Hill functions. Maximum specificity occurs at the vanishing complex concentration, given by the KD(LoxAT)Hill(LoxAT)/KD(LoxP)Hill(LoxP) ratio. For the averaged parameters, the maximum specificity is ~5 × 10⁴, but decreases to less than 103 at 10 nM complex. The situation for intramolecular recombination is complicated by the potential influence of the intervening DNA, such as loop size and site phasing, and unknown factors in vivo. The discrepancy between the different results may also be explained by a requirement for tight DNA binding to overcome torsional stress from loop formation or local topological barriers.
Cre also discriminates between substrates after complex assembly. The 5-fold difference in rates between LoxP and LoxAT suggests that substitutions relatively far from the scissile bond (17 Å) can regulate activity. The combination of decreased turnover rate, modest reductions in binding, and changes in assembly cooperativity leads to a maximum specificity of ~2.5 × 10⁵-fold. Partitioning of complexes between slow and fast reaction pathways was a more significant contributor than intrinsic rate differences, suggesting that substrate binding influences a conformational distribution. We cannot tell from our data whether these fast and slow phases are parallel or collinear, but we have previously observed evidence of sequentially occurring species in a Cre–suicide substrate reaction (9).
The loss of the hydrogen bonding interaction between Arg259 and the Gua27 base depicted in the Cre–LoxAT complex provides the basis for the weaker protein–DNA interaction (19). Hydrogen bonding between the guanidinium of Arg295 and O4 of Thy27 was obviated by new salt bridges formed with Glu262 and Glu266. We suggest that electrostatic compensation for Arg259 would maintain overall complex stability, with minimal favorable contribution to the Cre–DNA interaction. We had hypothesized that eliminating this electrostatic sink might induce Arg259 to interact with the Thy base or the DNA backbone, reducing the energetic differences between LoxP and LoxAT binding and, therefore, the ability to distinguish between them. However, mutating Glu262 and Glu266 to glutamine barely decreased the difference in the apparent KD values. Instead, the reduced level of discrimination by CreQQ was due to the smaller difference in assembly cooperativity with LoxP and LoxAT. A general increase in the extent of DNA association could account for this behavior, if the dissociation constants for monomer binding and synaptic complex formation from two LoxP-bound dimers are on the same order of magnitude, or if the protein–protein interactions involved in dimer or tetramer assembly are made at the expense of DNA binding.
Unlike wild-type Cre, CreQQ exhibited little distinction in rates between LoxP and LoxAT, and both reactions were faster than the Cre–LoxP reaction. The individual rates of the two phases were increased 4-fold, and the faster process was favored. These results suggest that while Cre’s rate may be affinity-limited, CreQQ reactions have other rate-limiting steps. Taken together, the effects of the 262Q/266Q substitutions greatly reduce the ability of Cre to distinguish between LoxP and LoxAT, with a maximum level of discrimination of only 35 by CreQQ, compared to 2.5 × 10⁵ by Cre, or 10 versus 4 × 10³ at 10 nM complex.
What is the origin of the properties of CreQQ? Mutations that increase bulk positive charge increase the extent of DNA binding and activity and reduce sequence specificity in other DNA–protein interaction systems (47-50). However, our preliminary investigations suggest that this effect is positions-pecific (S. S. Martin and E. P. Baldwin, unpublished data). Cre(262Q) has properties nearly identical to those of CreQQ in the assembly titration assays (data not shown), while Cre-(266Q) has titration behavior similar to that of Cre. In contrast, the kinetic effects of the separate mutations were more complex: Cre(262Q) had slightly lower turnover rates than CreQQ, but reacted to a smaller extent and was less soluble. In contrast, Cre(266Q) reacted more slowly than Cre, and had a distinct lag in reaction progress, reminiscent of Cre’s reaction with one suicide substrate (9). Removal of the unfavorable charge–charge interaction between Glu262 and the DNA backbone is the likely explanation for tighter binding, and the Gln262 substitution potentially converted this contact to a favorable amide–phosphate hydrogen bond. That disrupting the carboxyl–phosphate interaction generally decreases Cre’s ability to distinguish between LoxP and other substrates is supported by results of mutation–selection experiments. Ten of 24 random Cre variants selected in vitro for reactivity with the highly substituted LoxH site contained the Q262 substitution, and five others contained A262 or G262 (17). In addition, position 262 substitutions enabled Cre to recognize another Lox variant with base replacements at positions 6 and 7 (51). The increased rate and substrate binding properties of CreQQ make it potentially useful for catalyzing recombination in intracellular applications where Cre reactivity is shown to be limiting.
What is the structural basis for the reduced rate of turnover of LoxAT by Cre? The partitioning between slow and fast phases may be governed by the strength of the protein–DNA interaction. Reactions of other Lox substrates exhibit a qualitative association between complex assembly competence and turnover rate (data not shown), as well as an increased turnover rate with CreQQ. How could Cre DNA binding affinity influence recombination rate? While direct coupling of the recognition sequence to the active site conformation is possible, the complex structure offers few clues as to how this coupling might be transduced. Restacking of the bases and rearrangements of the DNA backbone propagated one to two base pairs from the substitution site, but had little structural effect except for disordering and repositioning of the loop of residues 276–285, which did not obviously perturb the most proximal active site residue, His289. Instead, hydrogen bond changes between the scissile phosphate and catalytic residues suggest ground-state ES stabilization, rather than active site disruption. The importance of these subtle active site changes will remain unknown until we obtain higher-resolution structures of complexes containing unmodified LoxP or other fully active substrates. Somewhat surprisingly and more significantly, the most dramatic differences in atom position and order between the Cre–LoxP-G5 and Cre–LoxAT complexes were in the noncleaving subunit (see above), which was shifted relative to the bound DNA and the cleaving subunit. Increased order at the subunit interface, mediated by the loop of residues 198–208 (Figure 7b), might dampen fluctuations in the active site or the overall complex that promote turnover. A reduced level of DNA binding may allow greater freedom for the noncleaving subunits to optimize this contact, providing a rationalization for the relationship between binding and turnover. This structural mechanism, in which conformational changes incurred by ligand binding release intersubunit contacts leading to increased enzyme flexibility and activity, is similar to a mechanism proposed by Monod, Wyman, and Changeux (52), and other enzymes appear to be regulated in this way (53-55). From this viewpoint, the Lox DNA acts as both a substrate and an allosteric effector.
ACKNOWLEDGMENT
Many thanks to James Endrizzi, James Holton, and Tom Alber (University of California, Berkeley, CA) for synchrotron access and data collection assistance. Protein purifications, home-source data collections, and all computations were carried out in the W. M. Keck Protein Expression and X-ray Crystallographic Facilities at the University of California (Davis, CA). Synchrotron data were obtained at the Stanford Synchrotron Radiation Laboratory (SSRL), a national user facility operated by Stanford University on behalf of the U.S. Department of Energy, Office of Basic Energy Sciences. The SSRL Structural Molecular Biology Program is supported by the Department of Energy, Office of Biological and Environmental Research, and by the National Institutes of Health, National Center for Research Resources, Biomedical Technology Program, and the National Institute of General Medical Sciences.
Footnotes
This work was funded by Molecular and Cellular Biology startup funds, University of California, Davis, and the National Institutes of Health, General Medical Sciences (Grant GM63109).
Protein Data Bank entry 1MA7.
- HJ
- Holliday junction (intermediate)
- rmsd
- root-mean-square difference in position between atom sets, in angstroms
- rmsΔB
- root-mean-square difference in B factor between atom sets, in square angstroms
Amino acids and deoxynucleotides are denoted by their three-letter code.
A8/T27 is the substitution of the Cyt-Gua and Gua-Cyt base pairs at positions 8 and 27 in Lox with Ade-Thy and Thy-Ade base pairs, respectively.
Specific DNA and protein residues are denoted by their residue type, residue number, and chain designator. For example, Arg259B refers to the arginine at position 259 in the B chain (cleaving subunit).
REFERENCES
- 1.Sternberg N. Bacteriophage P1 site-specific recombination. III. Strand exchange during recombination at lox sites. J. Mol. Biol. 1981;150:603–608. doi: 10.1016/0022-2836(81)90384-3. [DOI] [PubMed] [Google Scholar]
- 2.Nagy A. Cre recombinase: the universal reagent for genome tailoring. Genesis. 2000;26:99–109. [PubMed] [Google Scholar]
- 3.Cheng C, Kussie P, Pavletich N, Shuman S. Conservation of structure and mechanism between eukaryotic topoisomerase I and site-specific recombinases. Cell. 1998;92:841–850. doi: 10.1016/s0092-8674(00)81411-7. [DOI] [PubMed] [Google Scholar]
- 4.Nunes-Duby SE, Kwon HJ, Tirumalai RS, Ellenberger T, Landy A. Similarities and differences among 105 members of the Int family of site-specific recombinases. Nucleic Acids Res. 1998;26:391–406. doi: 10.1093/nar/26.2.391. [DOI] [PMC free article] [PubMed] [Google Scholar]
- 5.Sherratt DJ, Wigley DB. Conserved themes but novel activities in recombinases and topoisomerases. Cell. 1998;93:149–152. doi: 10.1016/s0092-8674(00)81566-4. [DOI] [PubMed] [Google Scholar]
- 6.Van Duyne GD. A structural view of cre-loxp site-specific recombination. Annu. Rev. Biophys. Biomol. Struct. 2001;30:87–104. doi: 10.1146/annurev.biophys.30.1.87. [DOI] [PubMed] [Google Scholar]
- 7.Hoess R, Wierzbicki A, Abremski K. Isolation and characterization of intermediates in site-specific recombination. Proc. Natl. Acad. Sci. U.S.A. 1987;84:6840–6844. doi: 10.1073/pnas.84.19.6840. [DOI] [PMC free article] [PubMed] [Google Scholar]
- 8.Guo F, Gopaul DN, van Duyne GD. Structure of Cre recombinase complexed with DNA in a site-specific recombination synapse. Nature. 1997;389:40–46. doi: 10.1038/37925. [DOI] [PubMed] [Google Scholar]
- 9.Martin SS, Pulido E, Chu VC, Lechner TS, Baldwin EP. The order of strand exchanges in Cre-LoxP recombination and its basis suggested by the crystal structure of a Cre-LoxP Holliday junction complex. J. Mol. Biol. 2002;319:107–127. doi: 10.1016/S0022-2836(02)00246-2. [DOI] [PMC free article] [PubMed] [Google Scholar]
- 10.Hoess RH, Ziese M, Sternberg N. P1 site-specific recombination: nucleotide sequence of the recombining sites. Proc. Natl. Acad. Sci. U.S.A. 1982;79:3398–3402. doi: 10.1073/pnas.79.11.3398. [DOI] [PMC free article] [PubMed] [Google Scholar]
- 11.Hoess RH, Abremski K. Mechanism of strand cleavage and exchange in the Cre-lox site-specific recombination system. J. Mol. Biol. 1985;181:351–362. doi: 10.1016/0022-2836(85)90224-4. [DOI] [PubMed] [Google Scholar]
- 12.Abremski K, Hoess R, Sternberg N. Studies on the properties of P1 site-specific recombination: evidence for topologically unlinked products following recombination. Cell. 1983;32:1301–1311. doi: 10.1016/0092-8674(83)90311-2. [DOI] [PubMed] [Google Scholar]
- 13.Abremski K, Hoess R. Bacteriophage P1 site-specific recombination. Purification and properties of the Cre recombinase protein. J. Biol. Chem. 1984;259:1509–1514. [PubMed] [Google Scholar]
- 14.Yu Y, Bradley A. Engineering chromosomal rearrangements in mice. Nat. Rev. Genet. 2001;2:780–790. doi: 10.1038/35093564. [DOI] [PubMed] [Google Scholar]
- 15.Gorman C, Bullock C. Site-specific gene targeting for gene expression in eukaryotes. Curr. Opin. Biotechnol. 2000;11:455–460. doi: 10.1016/s0958-1669(00)00127-0. [DOI] [PubMed] [Google Scholar]
- 16.Thyagarajan B, Guimaraes MJ, Groth AC, Calos MP. Mammalian genomes contain active recombinase recognition sites. Gene. 2000;244:47–54. doi: 10.1016/s0378-1119(00)00008-1. [DOI] [PubMed] [Google Scholar]
- 17.Buchholz F, Stewart AF. Alteration of Cre recombinase site specificity by substrate-linked protein evolution. Nat. Biotechnol. 2001;19:1047–1052. doi: 10.1038/nbt1101-1047. [DOI] [PubMed] [Google Scholar]
- 18.Santoro SW, Schultz PG. Directed evolution of the site specificity of Cre recombinase. Proc. Natl. Acad. Sci. U.S.A. 2002;99:4185–4190. doi: 10.1073/pnas.022039799. [DOI] [PMC free article] [PubMed] [Google Scholar]
- 19.Hartung M, Kisters-Woike B. Cre mutants with altered DNA binding properties. J. Biol. Chem. 1998;273:22884–22891. doi: 10.1074/jbc.273.36.22884. [DOI] [PubMed] [Google Scholar]
- 20.Chen Y, Narendra U, Iype EL, Cox MM, Rice AP. Crystal structure of a Flp recombinase-Holliday junction complex: assembly of an active oligomer by helix swapping. Mol. Cell. 2000;6:885–897. [PubMed] [Google Scholar]
- 21.Luscombe NM, Laskowski RA, Thornton JM. Amino acid–base interactions: a three-dimensional analysis of protein-DNA interactions at an atomic level. Nucleic Acids Res. 2001;29:2860–2874. doi: 10.1093/nar/29.13.2860. [DOI] [PMC free article] [PubMed] [Google Scholar]
- 22.Woods KC, Martin SS, Chu VC, Baldwin EP. Quasi-equivalence in site-specific recombinase structure and function: crystal structure and activity of trimeric Cre recombinase bound to a three-way Lox DNA junction. J. Mol. Biol. 2001;313:49–69. doi: 10.1006/jmbi.2001.5012. [DOI] [PubMed] [Google Scholar]
- 23.Kunkel TA, Bebenek K, McClary J. Efficient site-directed mutagenesis using uracil-containing DNA. Methods Enzymol. 1991;204:125–139. doi: 10.1016/0076-6879(91)04008-c. [DOI] [PubMed] [Google Scholar]
- 24.Cantor CR, Warshaw MM, Shapiro H. Oligonucleotide interactions. 3 Circular dichroism studies of the conformation of deoxyoligonucleotides. Biopolymers. 1970;9:1059–1077. doi: 10.1002/bip.1970.360090909. [DOI] [PubMed] [Google Scholar]
- 25.Laemmli UK. Cleavage of structural proteins during the assembly of the head of bacteriophage T4. Nature. 1970;227:680–685. doi: 10.1038/227680a0. [DOI] [PubMed] [Google Scholar]
- 26.Cantor CR, Schimmel PR. Biophysical Chemistry, Part III: The behaVior of biological macromolecules. W. H. Freeman and Co.; San Francisco: 1980. [Google Scholar]
- 27.Leslie AGW. Joint CCP4 and ESF-EACMB Newsletter on Protein Crystallography. Daresbury Laboratory; Warrington, U.K.: 1992. [Google Scholar]
- 28.Collaborative Computational Project Number 4 The CCP4 suite programs for protein crystallography. Acta Crystallogr. 1994;D50:760–763. doi: 10.1107/S0907444994003112. [DOI] [PubMed] [Google Scholar]
- 29.Holton JH. The ELVES Manual. 2001 http://ucxray.berkeley.edu/~jamesh/elves/release.html.
- 30.Tronrud D. TNT refinement package. Methods Enzymol. 1997;277:306–319. doi: 10.1016/s0076-6879(97)77017-4. [DOI] [PubMed] [Google Scholar]
- 31.Engh R, Huber R. Accurate bond and angle parameters for X-ray protein structure refinement. Acta Crystallogr. 1991;A47:392–400. [Google Scholar]
- 32.Tronrud D. Knowledge-Based B-Factor Restraints for the Refinement of Proteins. J. Appl. Crystallogr. 1996;29:100–104. [Google Scholar]
- 33.Brunger A. Assessment of phase accuracy by cross validation: the free R value. Methods and Applications. Acta Crystallogr. 1993;D49:24–36. doi: 10.1107/S0907444992007352. [DOI] [PubMed] [Google Scholar]
- 34.Zhang X-J, Matthews BW. EDPDB: A Multi-Functional Tool for Protein Structure Analysis. J. Appl. Crystallogr. 1995;28:624–630. [Google Scholar]
- 35.Kraulis PJ. MOLSCRIPT: a program to produce both detailed and schematic plots of protein structures. J. Appl. Crystallogr. 1991;24:946–950. [Google Scholar]
- 36.Merritt EA, Murphy MEP. Raster3d Version 2.0: a Program For Photorealistic Molecular Graphics. Acta Crystallogr. 1994;D50:869–873. doi: 10.1107/S0907444994006396. [DOI] [PubMed] [Google Scholar]
- 37.Kim ST, Kim GW, Lee YS, Park JS. Characterization of Cre-LoxP interaction in the major groove: hint for structural distortion of mutant Cre and possible strategy for HIV-1 therapy. J. Cell. Biochem. 2001;80:321–327. [PubMed] [Google Scholar]
- 38.Ringrose L, Lounnas V, Ehrlich L, Buchholz F, Wade R, Stewart AF. Comparative kinetic analysis of FLP and cre recombinases: mathematical models for DNA binding and recombination. J. Mol. Biol. 1998;284:363–384. doi: 10.1006/jmbi.1998.2149. [DOI] [PubMed] [Google Scholar]
- 39.Guo F, Gopaul DN, Van Duyne GD. Asymmetric DNA bending in the Cre-loxP site-specific recombination synapse. Proc. Natl. Acad. Sci. U.S.A. 1999;96:7143–7148. doi: 10.1073/pnas.96.13.7143. [DOI] [PMC free article] [PubMed] [Google Scholar]
- 40.Gopaul DN, Guo F, Van Duyne GD. Structure of the Holliday junction intermediate in Cre-loxP site-specific recombination. EMBO J. 1998;17:4175–4187. doi: 10.1093/emboj/17.14.4175. [DOI] [PMC free article] [PubMed] [Google Scholar]
- 41.Pingoud A, Jeltsch A. Structure and function of type II restriction endonucleases. Nucleic Acids Res. 2001;29:3705–3727. doi: 10.1093/nar/29.18.3705. [DOI] [PMC free article] [PubMed] [Google Scholar]
- 42.Jen-Jacobson L. Protein-DNA recognition complexes: conservation of structure and binding energy in the transition state. Biopolymers. 1997;44:153–180. doi: 10.1002/(SICI)1097-0282(1997)44:2<153::AID-BIP4>3.0.CO;2-U. [DOI] [PubMed] [Google Scholar]
- 43.Lesser DR, Kurpiewski MR, Jen-Jacobson L. The energetic basis of specificity in the Eco RI endonuclease–DNA interaction. Science. 1990;250:776–786. doi: 10.1126/science.2237428. [DOI] [PubMed] [Google Scholar]
- 44.Hollis T, Lau A, Ellenberger T. Crystallizing thoughts about DNA base excision repair. Prog. Nucleic Acid Res. Mol. Biol. 2001;68:305–314. doi: 10.1016/s0079-6603(01)68109-1. [DOI] [PubMed] [Google Scholar]
- 45.von Hippel PH, Revzin A, Gross CA, Wang AC. Non-specific DNA binding of genome regulating proteins as a biological control mechanism: I. The lac operon: equilibrium aspects. Proc. Natl. Acad. Sci. U.S.A. 1974;71:4808–4812. doi: 10.1073/pnas.71.12.4808. [DOI] [PMC free article] [PubMed] [Google Scholar]
- 46.Muller J, Oehler S, Muller-Hill B. Repression of lac promoter as a function of distance, phase and quality of an auxiliary lac operator. J. Mol. Biol. 1996;257:21–29. doi: 10.1006/jmbi.1996.0143. [DOI] [PubMed] [Google Scholar]
- 47.Nelson HC, Sauer RT. Interaction of mutant lambda repressors with operator and non-operator DNA. J. Mol. Biol. 1986;192:27–38. doi: 10.1016/0022-2836(86)90461-4. [DOI] [PubMed] [Google Scholar]
- 48.Nickell C, Anderson WF, Lloyd RS. Substitution of basic amino acids within endonuclease V enhances nontarget DNA binding. J. Biol. Chem. 1991;266:5634–5642. [PubMed] [Google Scholar]
- 49.Pan CQ, Lazarus RA. Hyperactivity of human DNase I variants. Dependence on the number of positively charged residues and concentration, length, and environment of DNA. J. Biol. Chem. 1998;273:11701–11708. doi: 10.1074/jbc.273.19.11701. [DOI] [PubMed] [Google Scholar]
- 50.Grillo AO, Royer CA. The basis for the super-repressor phenotypes of the AV77 and EK18 mutants of trp repressor. J. Mol. Biol. 2000;295:17–28. doi: 10.1006/jmbi.1999.3317. [DOI] [PubMed] [Google Scholar]
- 51.Rufer AW, Sauer B. Non-contact positions impose site selectivity on Cre recombinase. Nucleic Acids Res. 2002;30:2671–2674. doi: 10.1093/nar/gkf399. [DOI] [PMC free article] [PubMed] [Google Scholar]
- 52.Monod J, Wyman J, Changeux J-P. On the nature of allosteric transitions: a plausible model. J. Mol. Biol. 1965;12:88–118. doi: 10.1016/s0022-2836(65)80285-6. [DOI] [PubMed] [Google Scholar]
- 53.Beernink PT, Endrizzi JA, Alber T, Schachman HK. Assesment of the allosteric mechanism of aspartate transcarbamoylase based on the crystalline structure of the unregulated catalytic subunit. Proc. Natl. Acad. Sci. U.S.A. 1999;96:5388–5393. doi: 10.1073/pnas.96.10.5388. [DOI] [PMC free article] [PubMed] [Google Scholar]
- 54.Buchbinder JL, Fletterick RJ. Role of the active site gate of glycogen phosphorylase in allosteric inhibition and substrate binding. J. Biol. Chem. 1996;271:22305–22309. doi: 10.1074/jbc.271.37.22305. [DOI] [PubMed] [Google Scholar]
- 55.Xu W, Doshi A, Lei M, Eck MJ, Harrison SC. Crystal structures of c-Src reveal features of its autoinhibitory mechanism. Mol. Cell. 1999;3:629–638. doi: 10.1016/s1097-2765(00)80356-1. [DOI] [PubMed] [Google Scholar]