

Abstract
Context
Regulation of fat mass appears to be associated with immune functions. Studies of knockout mice show that endogenous interleukin (IL)-6 can suppress mature-onset obesity.
Objective
To systematically investigate associations of single nucleotide polymorphisms (SNPs) near the IL-6 (IL6) and IL-6 receptor (IL6R) genes with body fat mass, in support for our hypothesis that variants of these genes can be associated with obesity.
Design and Study Subjects
The Gothenburg Osteoporosis and Obesity Determinants (GOOD) study is a population-based cross-sectional study of 18-20 years old men (n=1 049), from the Gothenburg area (Sweden). Major findings were confirmed in two additional cohorts consisting of elderly men from the Osteoporotic Fractures in Men (MrOS) Sweden (n=2 851) and MrOS US (n=5 611) multicenter population-based studies.
Main Outcome
The genotype distributions and their association with fat mass in different compartments, measured with dual-energy X-ray absorptiometry (DXA).
Results
Out of 18 evaluated tag single nucleotide polymorphisms (SNPs) near the IL6 and IL6R genes, a recently identified SNP rs10242595 G/A [minor allele frequency (MAF) = 29%] 3′ of the IL6 gene was negatively associated with the primary outcome total body fat mass (effect size -0.11 standard deviation (SD) units/A allele, P=0.02). This negative association with fat mass was also confirmed in the combined MrOS Sweden and MrOS US cohorts (effect size -0.05 SD units/A allele; P=0.002). When all three cohorts were combined (n= 8 927, Caucasian subjects), rs10242595*A showed a negative association with total body fat mass (effect size -0.05 SD units/A allele, P<0.0002). Furthermore, the rs10242595*A was associated with low body mass index [(BMI, effect size -0.03, P<0.001)] and smaller regional fat masses. None of the other SNPs investigated in the GOOD study were reproducibly associated with body fat.
Conclusions
The IL6 gene polymorphism rs10242595*A is associated with decreased fat mass in three combined cohorts of 8 927 Caucasian men.
Keywords: IL6, IL6R, obesity, SNP, rs10242595
Introduction
Interleukin-6 (IL-6) is a cytokine that mainly stimulates immune responses, such as B cell proliferation and acute phase production by the liver (1). The immune modulating effects of IL-6 have been shown with the IL-6 neutralizing drug tocilizumab which has beneficial effects on autoimmune diseases such as juvenile and adult rheumatoid arthritis (2, 3). However, IL-6 also has some anti-inflammatory properties such as inhibition of the effects of tumor necrosis factor-alpha (TNFα) (4, 5).
The IL-6 receptor (IL-6R) belongs to the type I cytokine receptor group of transmembrane receptors and is expressed on the cell surface. The IL-6R complex consists of two parts, the ligand binding IL-6R (also known as IL-6Rα, encoded by the IL6R gene) and the IL-6 signal transducer (previously designated gp130, encoded by IL6ST gene). The IL-6R specifically binds IL-6 and is expressed on few cell types including immune cells and hepatocytes. IL6ST is much less specific than the IL-6R, as it is a component of several cytokine receptors, and is expressed on the surface of most cell types (6). It has been claimed that pro-inflammatory and other pathophysiological effects of IL-6 to a large extent are exerted via so called trans-signaling, i.e. when a complex between IL-6 and a soluble isoform of the IL-6R is activating membrane bound IL-6ST in various cell types (6). The physiological effects of IL-6 have been suggested to be exerted via the classic route, with free IL-6 acting on membrane bound IL-6R/IL6-ST dimers (6).
Recent results indicate that IL-6, in addition to regulating various immune functions, also affects metabolic functions, including fat metabolism. IL-6 is one of several so called adipokines which are produced and released by white adipose tissue, and has been assumed, together with other adipokines, to contribute to obesity related metabolic and cardiovascular disturbances (7). On the other hand, IL-6 is released from working skeletal muscle in the absence of substantial release of other pro-inflammatory cytokines such as TNF-α. It has been suggested that IL-6 in this context exerts beneficial effects on the carbohydrate and fat metabolism as well as the exercise capacity (5, 8). In addition, IL-6 knockout mice as well as IL-6/IL-1 double knockout mice get obese, indicating that endogenous IL-6 exerts beneficial effects on fat mass in healthy individuals (8-10). The obesity preventing mechanism by IL-6 is unknown, but there are indications that endogenous IL-6 is of importance for leptin sensitivity in healthy individuals, and that the site of its action is in the hypothalamus (10-14). More recent data are in line with effects by IL-6 via the paraventricular nucleus of the hypothalamus (15). This in turn may lead to activation of the sympathetic nerve system and increased energy expenditure (16, 17).
In early studies, there was an association between a supposedly functional polymorphism of the IL6 gene promoter, the -174G/C single nucleotide exchange (rs1800795), described by Fishman et al. (18), and body mass index (BMI) as reported by for instance Grallert et al (19). However, the association with BMI did not reach the level of significance in two meta-analyses on over 25 000 subjects per study (20, 21). Nevertheless, in a recent study of more than 3 000 individuals, an association between variants in the IL6 gene and BMI was shown (21). Moreover, there was an association between rs1800795 and total and regional fat masses as determined by DXA in a cohort with 3 014 elderly men (22). A possible reason for the above described discrepancy could be not yet clarified interference by other parameters such as gender, age, cohort and other gene polymorphisms. For example, the studied SNPs may be in linkage disequilibrium (LD) with yet unknown functional polymorphisms in the IL6 which are the primary regulators of body fat (23).
In the IL6R there is a non-synonymous SNP (rs8192284, also called rs2228145), that seems to affect the proteolytic cleavage of a part of the extracellular domain of the IL-6R. This SNP has been associated with BMI and blood glucose in some, but not all studies, possibly due to differences between ethnic groups (24-28). In summary, the issue of possible associations between IL-6 system gene polymorphisms and obesity does not seem to be settled.
Based on the obesity observed in IL-6 knockout mice (IL6-/-) (8-10), the aim of the present study was to carefully investigate whether polymorphisms in the IL-6 system genes are associated with body fat mass in humans. We used several means to obtain novel information as compared with earlier literature. We used a gene-tagging approach to find common genetic variants in IL6 and IL6R, the two genes which are important for the unique biological effects of IL-6. The tag SNPs were investigated in relation to total body fat mass measured by dual energy X-ray absorbtiometry (DXA), a more specific measure than BMI (29). To increase statistical power, three different populations (8 927 subjects in total) which were relatively homogeneous for age, gender and ethnicity were investigated.
Subjects and Methods
Study subjects: young adult men
The population-based Gothenburg Osteoporosis and Obesity Determinants (GOOD) study was initiated to determine environmental and genetic factors involved in the regulation of bone and fat mass. Study subjects were randomly identified using national population registers, contacted by telephone, and asked to participate in this study. Men aged 18 – 20 years from the greater Gothenburg area in Sweden were approached. There were no specified exclusion criteria. Almost half (49%) of the study candidates agreed to participate and were enrolled (n = 1 068, mean age 18.9 ± 0.6 yr) (30, 31). Informed consent was obtained from all study participants. The study was approved by the ethics committee at the University of Gothenburg.
A total of 1 049 subjects with both successful genotyping and available data on body composition (Table 1) were included in the initial screening of variants in the IL6 and IL6R genes and their association with total body fat mass.
TABLE 1.
Characteristics of the study subjects
Table 1. Values are given as mean ± SD; n = number of subjects with both successful genotyping and available fat parameters.
| Variables | GOOD (n = 1 049) |
MrOS Sweden (n = 2 851) |
MrOS US (n = 5 611) |
|---|---|---|---|
| Age (yr) | 18.9 ± 0.6 | 75.4 ± 3.2 | 73.7 ± 5.9 |
| Height (cm) | 181.4 ± 6.8 | 174.8 ± 6.5 | 174.1 ± 6.8 |
| Weight (kg) | 73.8 ± 11.9 | 80.6 ± 11.8 | 83.1 ± 13.2 |
| Total fat (kg) | 13.3 ± 8.0 | 22.1 ± 7.6 | 21.8 ± 7.1 |
| Total lean tissue (kg) | 57.4 ± 6.2 | 55.5 ± 6.8 | 58.0 ± 7.4 |
| BMI (kg/m2) | 22.4 ± 3.2 | 26.4 ± 3.5 | 27.4 ± 3.8 |
| Trunk fat (kg) | 6.8 ± 4.3 | 12.8 ± 5.0 | 12.3 ± 4.3 |
| Arm fat (kg) | 0.56 ± 0.41 | 1.12 ± 0.41 | 1.23 ± 0.49 |
| Leg fat (kg) | 2.5 ± 1.4 | 3.1 ± 1.1 | 3.0 ± 1.1 |
| Total Fat (%) | 17.2 ± 7.4 | 27.9 ± 6.9 | 26.2 ± 5.4 |
Study subjects: elderly men
The major findings in the initial screening study were replicated in two large cohorts of elderly men [Osteoporotic Fractures in Men (MrOS) Sweden and MrOS US] with available data on body composition (Table 1). Study subjects of the population-based MrOS Sweden cohort (n = 3 014; men aged 69–81 yr) were randomly identified using national population registers, contacted, and asked to participate (32). A total of 2 851 subjects with both successful genotyping and available data on body composition were included in the first replication analysis.
The MrOS US cohort consists of 5 995 community-dwelling, ambulatory men aged ≥65 years (33, 34). A total of 5 611 MrOS US subjects with both successful genotyping and available data on body composition (Table 1) were included in this study.
Assessment of body composition
In the GOOD cohort, lean tissue mass and fat masses for total body, arm, leg, and trunk were determined by using DXA (Lunar Prodigy DXA, GE Lunar Corp., Madison, WI). In the MrOS Sweden cohort, lean tissue mass and total fat mass were determined using the Lunar Prodigy DXA (n = 1 997) for subjects investigated in Malmö (n = 998) and Uppsala (n = 999) or the Hologic DXA Hologic QDR 4500/A-Delphi (Hologic, Whaltman, MA) (n = 953) for subjects investigated in Gothenburg. The QDR 4500 Hologic machine was also used at all six MrOS US clinical sites.
Assessment of covariates
A standardized questionnaire was used to collect information about amount of physical activity and smoking. In the GOOD cohort, physical activity was assessed as hours of physical activity per week, as previously described (31). In the MrOS Sweden cohort physical activity was the subject's average total daily walking distance (in km), including both walking as a means of exercise and leisure, and as a means of outdoor transportation in activities of daily life (32). In the MrOS US cohort, physical activity was assessed as the self-reported number of city blocks walked each day, including both walking as a means of exercise and walking as a part of daily routine. In order to be able to merge the measure of physical activity for the MrOS Sweden and MrOS US into a common variable it was assumed that 1 city block = 200 meters.
Genotyping
In all three cohorts conducted, genotyping was completed using genomic DNA prepared from whole blood.
GOOD cohort
Altogether 19 SNPs with MAF≥5% in the IL6 (n=9, Table 2) and the IL6R (n=10, Table 1S) were selected from HapMapData Rel 21/phasell (http://hapmap.ncbi.nlm.nih.gov/) using a pair-wise correlation method (r2≥0.80) including the sequence 10 kb upstream and 5 kb downstream of each gene. The SNPs were genotyped using the GoldenGate™ assay (35) from Illumina Inc (San Diego CA, USA). The genotyping was performed by the SNP Technology Platform in Uppsala, Sweden (www.genotyping.se). Of the genotyped SNPs, all 19 had a genotype call rate of ≥99 % in the study subjects. One of these SNPs, rs12700386, was not polymorphic, leaving 18 SNPs for further analysis. The reproducibility of the genotyping was 100% according to duplicate analysis of 5% of the samples. There were no deviations from HWE for these markers (P>0.05, Table 2 and Table 1S).
TABLE 2.
Allele and genotype frequencies of SNPs in the IL6 gene (GOOD cohort)
Table 2. 1 - major allele; 2 - minor allele; n = number of subjects carrying the genotype; 11 - homozygotes for the major allele; 22 - homozygotes for the minor allele; HWE - Hardy-Weinberg equilibrium; IL - interleukin
| Marker | Gene | Localization | Allele frequency | Genotype frequency | PHWE | |||
|---|---|---|---|---|---|---|---|---|
| 1 | 2 | 11 | 12 | 22 | ||||
| (%) | (%) | n (%) | n (%) | n (%) | ||||
| rs7801617 | IL6 | 5′ near gene | 91 (G) | 9 (A) | 867 (83) | 169 (16) | 12 (1) | 0.25 |
| rs1880242 | IL6 | 5′ near gene | 54 (G) | 46 (T) | 302 (29) | 525 (50) | 218 (21) | 0.28 |
| rs2056576 | IL6 | 5′ near gene | 74 (C) | 26 (T) | 581 (55) | 387 (37) | 80 (8) | 0.17 |
| rs1800795 | IL6 | 5′ near gene | 54 (C) | 46 (G) | 312 (30) | 496 (48) | 235 (23) | 0.16 |
| rs2069840 | IL6 | intron 3 | 70 (C) | 30 (G) | 525 (50) | 424 (40) | 100 (10) | 0.29 |
| rs2069861 | IL6 | 3′ near gene | 89 (C) | 11 (T) | 832 (79) | 207 (20) | 8 (1) | 0.21 |
| rs10242595 | IL6 | 3′ near gene | 71 (G) | 29 (A) | 537 (51) | 424 (40) | 88 (8) | 0.74 |
| rs11766273 | IL6 | 3′ near gene | 92 (G) | 8 (A) | 881 (84) | 162 (15) | 6 (1) | 0.62 |
MrOS Sweden cohort
rs10242595 in the IL6 and rs4075015 in the IL6R were analyzed using the Sequenom MassARRAY platform (San Diego, CA, USA). The overall call rate was ≥98 %, and 167 samples were run in duplicates with 100% genotyping concordance rate. The SNPs rs10242595 and rs4075015 were both in HWE.
MrOS US cohort
Genotyping was performed using TaqMan® technology (Applied Biosystems, Foster City, CA). Genotypes were called under standard conditions on a 7900HT Real-time PCR instrument. All genotype calls were determined by two independent investigators, and only concordant calls were used. The average genotyping call rate was 98.2%. The genotyping concordance rate among 849 replicate samples was 99.9%. There was no deviation in HWE for rs10242595, the only SNP analysed in this cohort.
Statistics
All SNPs were checked for HWE with χ2-analysis. LD between the SNPs was measured by D′ (Figure 1 for the IL6 and Figure 1S for the IL6R). We performed multiple linear regressions with total body fat mass for each SNP. Covariates for these calculations were determined as factors significantly associated with the primary outcome total fat in each cohort. Backward selection was then used to determine whether these covariates were suitable. Effect sizes and P-values for the remaining covariates are shown in Table 2S. Power calculations for the MrOS cohorts were based on the estimates for the two SNPs which were significantly associated with total fat mass in the GOOD cohort.
Figure 1.
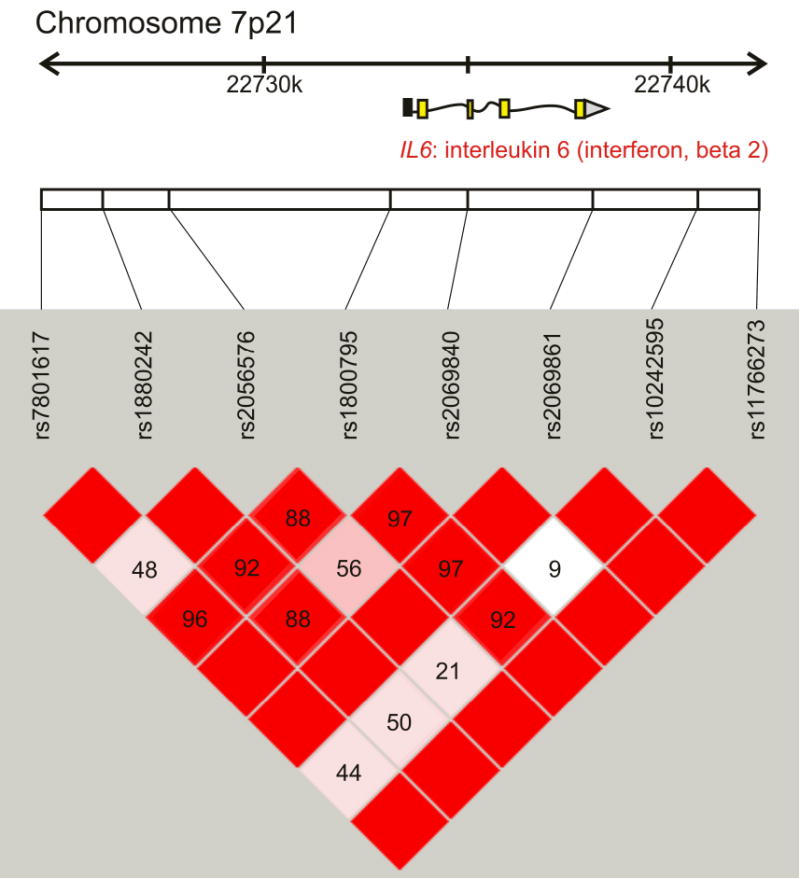
The LD pattern of the interleukin 6 gene (IL6, also known as interferon, beta 2) based on results from tag-SNP genotyping in the GOOD cohort. The location of each tested SNP along the chromosome is indicated on top and the number in each square indicates the magnitude of linkage disequilibrium (LD) expressed as D′ between respective pairs of SNPs. Color scheme: bright red squares indicate strong LD (D′≈1); squares colored by lighter shades of pink indicate weaker LD; white color indicates very weak or no LD (D′≈0). Modified from Haploview (37).
Covariates in the GOOD cohort
Linear regression under the assumption of an additive model was used to analyze the relationships between total body fat mass and the SNPs (DD = 0, Dd =1, dd=2, where D and d are the major and minor alleles, respectively). Current physical activity and total body lean mass were used as covariates on log-transformed response, in a similar way as done previously [(36, 37) Table 3 and Table 2S].
TABLE 3.
SNPs in the IL6 gene in relation to total fat mass in GOOD
Table 3. The association between individual SNPs in the IL6 gene and total fat mass. P-values are calculated on log-transformed response (total fat mass measured by DXA) using linear regression under an additive model. P-values are specified for an unadjusted model and for the model adjusted for tissue lean mass and present physical activity (hours per week) as done previously (36).
| SNP ID | Minor allele | Unadjusted | Adjusted | Pc | |
|---|---|---|---|---|---|
| P | Effect size* | P | |||
| rs7801617 | A | 0.19 | -0.080 (0.072) | 0.26 | 0.89 |
| rs1880242 | T | 0.55 | -0.020 (0.043) | 0.63 | 0.99 |
| rs2056576 | T | 0.44 | 0.033 (0.047) | 0.48 | 0.99 |
| rs1800795 | C | 0.25 | 0.039 (0.041) | 0.34 | 0.86 |
| rs2069840 | G | 0.06 | 0.082 (0.045) | 0.07 | 0.48 |
| rs2069861 | T | 0.93 | -0.027 (0.070) | 0.96 | 1 |
| rs10242595 | A | 0.01 | -0.109 (0.011) | 0.02 | 0.19 |
| rs11766273 | A | 0.77 | -0.014 (0.087) | 0.86 | 1 |
Effect size (regression coefficient) and SEM values are expressed in SD units per additional minor allele and presented for the adjusted model Pc is corrected for multiple testing by permutation test.
Covariates in the MrOS Sweden cohort
Linear regressions were performed assuming additive models for rs10242595 (GG = 0; AG =1; AA = 2) and for rs4075015 (AA=0; AT=1; TT=2). Correction was made for study site (subjects were collected in three geographically separated regions), age, current physical activity, current smoking status and height. One limitation in the MrOS Sweden study is that the clinical sites used DXA machines from different manufacturers (see assessment of body composition above). In the multiple linear regression analysis we have used site as a covariate which to a large extent should compensate for this discrepancy. Moreover, when the subjects not measured with the Hologic DXA machine (i.e. MrOS Sweden from Uppsala and Malmö) were excluded from the calculation of combined elderly men (Table 4), the results remain very similar (see Results section). A sub-analysis with respect to type of DXA machine in MrOS Sweden could not be performed due to greatly reduced the sample size and power (not shown).
TABLE 4.
Associations of rs10242595 with total fat mass in men
Table 4. Linear regression analysis of association between rs10242595 and total body fat mass in young men (GOOD) and elderly men (MrOS Sweden and MrOS US). n = number of subjects with both successful genotyping and available data on body composition. P-values are calculated on log-transformed response (total fat mass measured by DXA) using linear regression under an additive model. Model I is only adjusted for cohort, race and site, and Model II is adjusted for cohort, race, site, age, current physical activity, current smoking status, height, and total body lean mass. The covariates differed between calculations, as they were corrected for race in the whole MrOS US study, for site in the MrOS study and when cohorts were combined and for cohort when cohorts were combined. Other differences in covariates:
| Cohort | n | A allele frequency | MODEL I | MODEL II | P |
|---|---|---|---|---|---|
| P | Effect size* | ||||
| GOODa (Caucasian) |
1049 | 0.29 | 0.01 | -0.111 (0.046) | 0.02 |
| MrOS Swedenb (Caucasian) |
2738 | 0.25 | 0.08 | -0.044 (0.027) | 0.10 |
| MrOS US | 5611 | 0.35 | 0.08 | -0.037 (0.017) | 0.03 |
| Caucasians | 5041 | 0.32 | 0.03 | -0.047 (0.018) | 0.009 |
| Black/African American | 198 | 0.49 | 0.13 | 0.126 (0.101) | 0.21 |
| Asian | 180 | 0.93 | 0.06 | -0.297 (0.160) | 0.07 |
| Hispanic/Latino | 116 | 0.48 | 0.43 | 0.065 (0.105) | 0.53 |
| Combined elderly men Caucasian |
7779 | 0.29 | 0.005 | -0.046 (0.015) | 0.002 |
| All cohorts combined Caucasian |
8927c | 0.29 | 0.001 | -0.052 (0.016) | 0.0002c |
Physical activity (hours per week).
Physical activity (km/day).
Physical activity not included as a covariate.
Effect size (regression coefficient) and SEM values are expressed as change in SD units per additional A (minor) allele and presented for the Model II.
Covariates in the MrOS US cohort
Linear regression for rs10242595 was performed in a similar way as for MrOS Sweden. All covariates were the same as for MrOS Sweden with the addition of race. Information about effect sizes and standard errors (SEM), as well as confidence intervals (CI) and covariates used for adjustments in the three cohorts and the three cohorts combined are given in table legends (Table 3, Table 4 and Table 5).
TABLE 5.
IL6 rs10242595 in relation to fat parameters in Caucasian elderly men from the combined MrOS cohorts
Table 5. Linear regression analysis of the associations between rs10242595 SNP and fat parameters in Caucasian elderly men from the combined MrOS cohorts. Data are mean with confidence intervals (CI). P-values are calculated on log-transformed response (tissue fat mass measured by DXA) using linear regression under an additive model. Model I is adjusted for cohort and site, and Model II is adjusted for cohort, site, age, current physical activity, current smoking status, height, and total body lean mass.
| Variables | MODEL I | MODEL II | P |
|---|---|---|---|
| P | Effect size* (CI) | ||
| Total fat (kg) | 0.005 | -0.046 (-0.075 – -0.016) | 0.002 |
| Total fat (%) | 0.006 | -0.049 (-0.081 – -0.016) | 0.003 |
| Weight (kg) | 0.02 | -0.029 (-0.046 – -0.011) | 0.002 |
| BMI (kg/m2) | 0.8 | -0.033 (-0.053 – -0.015) | 0.001 |
| Lean body mass (kg)a | 0.5 | 0.031 (0.005 – 0.056) | 0.02 |
| Trunk fat (kg) | 0.01 | -0.041 (-0.070 – -0.011) | 0.007 |
| Arm fat (kg) | 0.0002 | -0.065 (-0.095 – -0.034) | 0.00003 |
| Leg fat (kg) | 0.006 | -0.041 (-0.071 – -0.010) | 0.009 |
Lean tissue mass not included as a covariate.
Effect size (regression coefficient) and SEM values are expressed as change in SD units (CI) per additional A (minor) allele and presented for the P2 model.
Softwares
Haploview (v 4.1) was used for LD measurements, to generate figures representing LD-patterns in the IL6 and IL6R based on tag-SNP genotypes from the GOOD cohort, and for a haplotype analysis using case/control model. Haplotypes were also analyzed by sliding window approach using Helix Tree (v 7) (36). For linear and multiple linear regression analyses we used SPSS (v 17.0.0). Values are given as mean ± SD. All tests were two tailed and conducted at the 5% significance level.
Results
Characteristics of the SNPs in the IL6 and IL6R Genes
To investigate whether SNPs in the IL-6 system are associated with body fat, we analyzed several SNPs in the IL6 and IL6R genes in relation to the primary outcome total body fat mass as measured by DXA. We successfully genotyped 18 SNPs distributed across the IL6 (n=8) and IL6R (n=10). The general SNP localizations within the genes, allele and genotype frequencies, and HWE are shown in Table 2 for the IL6 SNPs and in Table 1S for the IL6R SNPs. χ2 analysis showed no deviation from HWE for any of the 18 investigated SNPs. The allelic frequencies obtained are consistent with the dbSNP allelic frequencies for the European population.
Pair-wise LD tests between consecutive SNPs, genotyped in the GOOD cohort, showed that the LD (expressed as D′) was mostly strong and significant across the IL6 (also known as interferon, beta 2). rs10242595, located about 2 kb downstream from the IL6 coding region, had weak LD with the other SNPs, with the exception for rs2069861 and rs1800795 (Figure 1). In the IL6R gene, we could define two distinct LD-blocks (Figure 1S).
Associations between individual SNPs in the IL6 and IL6R and fat mass
The SNP associated with body fat close to IL6 was rs10242595 (effect size -0.11 SD units change per A allele, P=0.02, Pc = 0.19) with adjustment for covariates as presented in the legend of Table 3. In the IL6R gene, rs4075015 was associated with fat mass (effect size -0.09 SD units per T allele, P = 0.03, Pc = 0.17; Table 3S). Based on these estimates, the power to detect an association was approximately 95% in MrOS Sweden and >99% in MrOS US for both SNPs.
Replication of major findings in MrOS Sweden and MrOS US
Multiple linear regression analysis showed a borderline association between rs10242595*A and a decrease in the primary outcome total body fat mass (effect size -0.044 SD units/A allele, P=0.10 for the fully adjusted model; Table 4). There was no such association for the rs4075015*T (effect size 0.034 SD units/T allele, P=0.23, data not shown) and no further calculations were done on this SNP. Having found a borderline association between total body fat mass and rs10242595*A in the elderly Caucasian subjects of the MrOS Sweden cohort (n=2 851) we expanded the replication effort to include also the MrOS US cohort (n=5 609). The A allele of rs10242595 was significantly associated with low total body fat in the Caucasian subpopulation of the MrOS US cohort (effect size -0.047 SD units/A allele, P=0.009), and this was also seen in the MrOS US cohort as a whole (effect size -0.037 units/A allele, P=0.03). rs10242595*A was significantly associated with decreased total body fat in combined elderly Caucasian men from MrOS Sweden and MrOS US cohorts (effect size -0.046 SD units/A allele, P=0.002) and in combined Caucasian men from GOOD, MrOS Sweden and MrOS US (effect size -0.052 SD units/A allele, P=0.0002). When only subjects measured with the Hologic DXA machine [(effect size -0.042, P=0.01 in Caucasian subjects (n=5 994)] or only subjects measured with the Lunar Prodigy DXA machine [(effect size 0.048, P=0.006 in Caucasian subjects (n=3 046)] were included in the combined cohorts, similar results were obtained. In addition to the primary outcome total body fat mass, this analysis showed associations between the rs10242595*A variant and, decreases of secondary outcomes total fat %, body weight, body mass index (BMI), as well as for regional measures of fat (Table 5). There was also a negative correlation between the A allele and most of the fat related parameters in the GOOD study (data not shown). The A allele was associated with increased lean body mass in Caucasians in the combined MrOS Sweden and US Study (Table 5). However, there was no correlation between the A allele and lean body mass in the GOOD study (data not shown). The effect sizes for the different parameters, calculated as SD units per A allele, are also shown in Table 5. In the MrOS US Study a decrease in body weight by 0.03 SD units per A allele equals a body weight decrease of about 0.5% per A allele, or about 0.4 kg body weight per A allele for a man weighing 80 kg. There was no association between rs10242595*A on one hand and serum levels of insulin, glucose and fats on the other (data not shown).
Haplotype analysis showed no association between IL6 or IL6R genes and body fat mass as calculated by case/control analysis or a sliding window approach (not shown).
Discussion
Although IL-6 is mostly associated with pathophysiologic adaptations during inflammation (1), there is evidence that endogenous IL-6 suppresses fat mass in healthy experimental animals (8-10). In this translational candidate gene study we performed a systematic investigation of how genetic variations in the IL6 and IL6R genes are associated with total body fat mass and regional fat parameters, as measured by DXA, in a well characterized population of 1 049 healthy young men within a two year age span. By using this approach, we identified one SNP (rs10242595) in the IL6 gene, not previously associated with any phenotypic changes, which was clearly associated with body fat mass and this observation was confirmed in two other cohorts consisting of in total 7 779 Caucasian elderly men.
As discussed above, IL-6 knockout mice develop obesity (8-10), but there are several other reasons to investigate possible associations between the IL-6 gene system polymorphisms and metabolic functions in humans. IL-6 belongs to the same family of proteins as leptin (38) and ciliary neurotrophic factor (CNTF), which both are known to suppress obesity. A variant of CNTF suppressed body fat in clinical phase 2 studies in humans, but the clinical development of CNTF as an anti-obesity drug was later discontinued due to technical problems with appearances of neutralizing antibodies to the drug (39). Moreover, IL-6 is released into the blood from adipose tissue in humans and there is a positive correlation between serum IL-6 levels and body fat (40, 41). IL-6 is also released from working skeletal muscle and has been suggested to be of importance for the metabolic adaptation to exercise (5, 42, 43). In resting lean individuals, the level of IL-6 may be higher in cerebrospinal fluid than in serum suggesting that IL-6 is also produced by the brain (14). Finally, the recent introduction of the IL-6 receptor antibody tocilizumab for treatment of autoimmune diseases makes it necessary to foresee possible side effects, including metabolic ones, after suppression of endogenous IL-6 (2, 3).
In earlier studies, several groups, including ours, found an association between the well described polymorphism in the IL6 promoter, -174G/C SNP (rs1800795), and BMI. However, this effect could not be confirmed in two large meta-analyses (20, 21) recently, it was reported by Qi et al. that certain haplotypes as well as some individual SNPs in the IL6 gene were associated with BMI and waist circumference in two cohorts with about 3 000 men and women in total (21). rs2069827, the individual SNP most associated with BMI in this study (21), was in strong LD (r2=0.92) with one of our tag SNPs (rs11766273, Tables 2 and 3), but the latter was not associated with body fat mass in the young adult men from the GOOD study. The interrelation between the present IL6 gene polymorphism and the variants reported by Qi et al. and functional consequences of all of these polymorphisms need to be clarified. One possibility is that they are merely in LD with yet unknown functional polymorphisms. Some polymorphisms of the IL6R gene have also been associated with metabolic parameters (24-28). In the present study, we saw no reproducible associations between polymorphisms of the IL6R gene, including the non-synonymous rs2228145 (also known as rs8192284), and total body fat mass.
There are some strengths and weaknesses of the present study. One strength is that the major finding of this study, significant association of rs10242595*A with decreased fat mass in young adult men, was replicated in two other population-based studies consisting of 7 779 elderly Caucasian men. The statistical power increases not only thanks to the comparatively large sample, but also due to the fact that the cohorts are homogenous. Moreover, the fact that the effect size of the rs10242595*A on fat was similar (approximately -0.04 SD units/A allele) in each one of the two replication cohorts with men of similar age (MrOS Sweden and MrOS US) may support the validity of the present findings. The measurement of body fat with DXA is considerably more specific than the surrogate parameter BMI used in many other studies(29). As discussed above, the theoretical background for regarding IL6 as a candidate gene for obesity is strong. A clear drawback is that rs10242595 is likely to only be in LD with a functional polymorphism of the IL6 gene. However, it seems unlikely that rs10242595 is affecting another gene then IL6. The closest gene to rs10242595, besides IL6, is the translocase of outer mitochondrial membrane 7 homolog (yeast, TOMM7) gene that is located 81 kb 3′ of IL6. It would be important to determine if this association holds true in women and other ethnic groups as well. In the MrOS USA cohort there were no significant associations between the rs101242595 and body fat in comparatively small groups of non-Caucasian subjects, but more detailed studies on considerably larger cohorts are needed to investigate this issue.
In summary, several earlier studies have indicated that IL-6 is important for metabolism. We now found that the IL6 polymorphism rs10242595*A, which has not been described to be in association with phenotypes earlier, is associated with decreased fat mass in three combined cohorts of 8 927 Caucasian men. The relation of the present data to possible metabolic side effects of IL-6 neutralizing therapy (2, 3) may be a topic of future investigation.
Supplementary Material
Acknowledgments
This work was supported by Swedish Research Council (No K2007-54X-09894-16-3), EC FP6 funding (contract no. LSHM-CT-2003-503041), Johan och Jakob Söderbergs Foundation, Marcus Borgströms Foundation, Nilsson-Ehle Foundation, NovoNordisk Foundation, Swedish Medical Society, Swedish Society for Medical Research, and Sahlgrenska Center for Cardiovascular and Metabolic Research (CMR, no. A305:188) which is supported by the Swedish Strategic Foundation. The MrOS US study was supported, in part, by grants R01-AR049747 from the National Institute of Arthritis and Musculoskeletal and Skin Diseases (NIAMS). The Osteoporotic Fractures in Men Study is supported by the National Institutes of Health (NIH) funding. The following Institutes provide support: the National Institute of Arthritis and Muscosceletal and Skin Diseases (NIAMS), the National Institute on Aging (NIA), the National Center for Research Resources (NCRR) and NIH Roadmap for Medical Research under the following grant numbers: U01 AR45580, U01 AR45614, U01 AR45632, U01 AR45647, U01 AR45654, U01 AR45583, U01 AG18197, U01 AG027810, UL1 RR024140, AR052000 and AR048841.
Footnotes
Supplementary information is available at the International Journal of Obesity's website.
Disclosure: The authors declared no conflict of interests.
References
- 1.Kamimura D, Ishihara K, Hirano T. IL-6 signal transduction and its physiological roles: the signal orchestration model. Rev Physiol Biochem Pharmacol. 2003;149:1–38. doi: 10.1007/s10254-003-0012-2. [DOI] [PubMed] [Google Scholar]
- 2.Smolen JS, Beaulieu A, Rubbert-Roth A, Ramos-Remus C, Rovensky J, Alecock E, et al. Effect of interleukin-6 receptor inhibition with tocilizumab in patients with rheumatoid arthritis (OPTION study): a double-blind, placebo-controlled, randomised trial. Lancet. 2008;371:987–997. doi: 10.1016/S0140-6736(08)60453-5. [DOI] [PubMed] [Google Scholar]
- 3.Yokota S, Imagawa T, Mori M, Miyamae T, Aihara Y, Takei S, et al. Efficacy and safety of tocilizumab in patients with systemic-onset juvenile idiopathic arthritis: a randomised, double-blind, placebo-controlled, withdrawal phase III trial. Lancet. 2008;371:998–1006. doi: 10.1016/S0140-6736(08)60454-7. [DOI] [PubMed] [Google Scholar]
- 4.Xing Z, Gauldie J, Cox G, Baumann H, Jordana M, Lei XF, et al. IL-6 is an antiinflammatory cytokine required for controlling local or systemic acute inflammatory responses. J Clin Invest. 1998;101:311–320. doi: 10.1172/JCI1368. [DOI] [PMC free article] [PubMed] [Google Scholar]
- 5.Pedersen BK, Febbraio MA. Muscle as an endocrine organ: focus on muscle-derived interleukin-6. Physiol Rev. 2008;88:1379–1406. doi: 10.1152/physrev.90100.2007. [DOI] [PubMed] [Google Scholar]
- 6.Scheller J, Rose-John S. Interleukin-6 and its receptor: from bench to bedside. Med Microbiol Immunol. 2006;195:173–183. doi: 10.1007/s00430-006-0019-9. [DOI] [PubMed] [Google Scholar]
- 7.Yudkin JS, Stehouwer CD, Emeis JJ, Coppack SW. C-reactive protein in healthy subjects: associations with obesity, insulin resistance, and endothelial dysfunction: a potential role for cytokines originating from adipose tissue? Arterioscler Thromb Vasc Biol. 1999;19:972–978. doi: 10.1161/01.atv.19.4.972. [DOI] [PubMed] [Google Scholar]
- 8.Faldt J, Wernstedt I, Fitzgerald SM, Wallenius K, Bergstrom G, Jansson JO. Reduced exercise endurance in interleukin-6-deficient mice. Endocrinology. 2004;145:2680–2686. doi: 10.1210/en.2003-1319. [DOI] [PubMed] [Google Scholar]
- 9.Chida D, Osaka T, Hashimoto O, Iwakura Y. Combined interleukin-6 and interleukin-1 deficiency causes obesity in young mice. Diabetes. 2006;55:971–977. doi: 10.2337/diabetes.55.04.06.db05-1250. [DOI] [PubMed] [Google Scholar]
- 10.Wallenius V, Wallenius K, Ahren B, Rudling M, Carlsten H, Dickson SL, et al. Interleukin-6-deficient mice develop mature-onset obesity. Nat Med. 2002;8:75–79. doi: 10.1038/nm0102-75. [DOI] [PubMed] [Google Scholar]
- 11.Chai Z, Gatti S, Toniatti C, Poli V, Bartfai T. Interleukin (IL)-6 gene expression in the central nervous system is necessary for fever response to lipopolysaccharide or IL-1 beta: a study on IL-6-deficient mice. J Exp Med. 1996;183:311–316. doi: 10.1084/jem.183.1.311. [DOI] [PMC free article] [PubMed] [Google Scholar]
- 12.Flores MB, Fernandes MF, Ropelle ER, Faria MC, Ueno M, Velloso LA, et al. Exercise improves insulin and leptin sensitivity in hypothalamus of Wistar rats. Diabetes. 2006;55:2554–2561. doi: 10.2337/db05-1622. [DOI] [PubMed] [Google Scholar]
- 13.Rothwell NJ, Busbridge NJ, Lefeuvre RA, Hardwick AJ, Gauldie J, Hopkins SJ. Interleukin-6 is a centrally acting endogenous pyrogen in the rat. Can J Physiol Pharmacol. 1991;69:1465–1469. doi: 10.1139/y91-219. [DOI] [PubMed] [Google Scholar]
- 14.Stenlof K, Wernstedt I, Fjallman T, Wallenius V, Wallenius K, Jansson JO. Interleukin-6 levels in the central nervous system are negatively correlated with fat mass in overweight/obese subjects. J Clin Endocrinol Metab. 2003;88:4379–4383. doi: 10.1210/jc.2002-021733. [DOI] [PubMed] [Google Scholar]
- 15.Benrick A, Schele E, Pinnock SB, Wernstedt-Asterholm I, Dickson SL, Karlsson-Lindahl L, et al. Interleukin-6 gene knockout influences energy balance regulating peptides in the hypothalamic paraventricular and supraoptic nuclei. J Neuroendocrinol. 2009;21:620–628. doi: 10.1111/j.1365-2826.2009.01879.x. [DOI] [PubMed] [Google Scholar]
- 16.Li G, Klein RL, Matheny M, King MA, Meyer EM, Scarpace PJ. Induction of uncoupling protein 1 by central interleukin-6 gene delivery is dependent on sympathetic innervation of brown adipose tissue and underlies one mechanism of body weight reduction in rats. Neuroscience. 2002;115:879–889. doi: 10.1016/s0306-4522(02)00447-5. [DOI] [PubMed] [Google Scholar]
- 17.Wernstedt I, Edgley A, Berndtsson A, Faldt J, Bergstrom G, Wallenius V, et al. Reduced stress- and cold-induced increase in energy expenditure in interleukin-6-deficient mice. Am J Physiol Regul Integr Comp Physiol. 2006;291:R551–557. doi: 10.1152/ajpregu.00514.2005. [DOI] [PubMed] [Google Scholar]
- 18.Fishman D, Faulds G, Jeffery R, Mohamed-Ali V, Yudkin JS, Humphries S, et al. The effect of novel polymorphisms in the interleukin-6 (IL-6) gene on IL-6 transcription and plasma IL-6 levels, and an association with systemic-onset juvenile chronic arthritis. J Clin Invest. 1998;102:1369–1376. doi: 10.1172/JCI2629. [DOI] [PMC free article] [PubMed] [Google Scholar]
- 19.Grallert H, Huth C, Kolz M, Meisinger C, Herder C, Strassburger K, et al. IL-6 promoter polymorphisms and quantitative traits related to the metabolic syndrome in KORA S4. Exp Gerontol. 2006;41:737–745. doi: 10.1016/j.exger.2006.05.002. [DOI] [PubMed] [Google Scholar]
- 20.Huth C, Illig T, Herder C, Gieger C, Grallert H, Vollmert C, et al. Joint analysis of individual participants' data from 17 studies on the association of the IL6 variant -174G>C with circulating glucose levels, interleukin-6 levels, and body mass index. Ann Med. 2009;41:128–138. doi: 10.1080/07853890802337037. [DOI] [PMC free article] [PubMed] [Google Scholar]
- 21.Qi L, Zhang C, van Dam RM, Hu FB. Interleukin-6 genetic variability and adiposity: associations in two prospective cohorts and systematic review in 26,944 individuals. J Clin Endocrinol Metab. 2007;92:3618–3625. doi: 10.1210/jc.2007-0877. [DOI] [PubMed] [Google Scholar]
- 22.Strandberg L, Mellstrom D, Ljunggren O, Grundberg E, Karlsson MK, Holmberg AH, et al. IL6 and IL1B polymorphisms are associated with fat mass in older men: the MrOS Study Sweden. Obesity (Silver Spring) 2008;16:710–713. doi: 10.1038/oby.2007.95. [DOI] [PubMed] [Google Scholar]
- 23.Chanock SJ, Manolio T, Boehnke M, Boerwinkle E, Hunter DJ, Thomas G, et al. Replicating genotype-phenotype associations. Nature. 2007;447:655–660. doi: 10.1038/447655a. [DOI] [PubMed] [Google Scholar]
- 24.Wolford JK, Gruber JD, Ossowski VM, Vozarova B, Antonio Tataranni P, Bogardus C, et al. A C-reactive protein promoter polymorphism is associated with type 2 diabetes mellitus in Pima Indians. Mol Genet Metab. 2003;78:136–144. doi: 10.1016/s1096-7192(02)00230-5. [DOI] [PubMed] [Google Scholar]
- 25.Wang H, Zhang Z, Chu W, Hale T, Cooper JJ, Elbein SC. Molecular screening and association analyses of the interleukin 6 receptor gene variants with type 2 diabetes, diabetic nephropathy, and insulin sensitivity. J Clin Endocrinol Metab. 2005;90:1123–1129. doi: 10.1210/jc.2004-1606. [DOI] [PubMed] [Google Scholar]
- 26.Hamid YH, Urhammer SA, Jensen DP, Glumer C, Borch-Johnsen K, Jorgensen T, et al. Variation in the interleukin-6 receptor gene associates with type 2 diabetes in Danish whites. Diabetes. 2004;53:3342–3345. doi: 10.2337/diabetes.53.12.3342. [DOI] [PubMed] [Google Scholar]
- 27.Esteve E, Villuendas G, Mallolas J, Vendrell J, Lopez-Bermejo A, Rodriguez M, et al. Polymorphisms in the interleukin-6 receptor gene are associated with body mass index and with characteristics of the metabolic syndrome. Clin Endocrinol (Oxf) 2006;65:88–91. doi: 10.1111/j.1365-2265.2006.02553.x. [DOI] [PubMed] [Google Scholar]
- 28.Qi L, Rifai N, Hu FB. Interleukin-6 receptor gene, plasma C-reactive protein, and diabetes risk in women. Diabetes. 2009;58:275–278. doi: 10.2337/db08-0968. [DOI] [PMC free article] [PubMed] [Google Scholar]
- 29.Prentice AM, Jebb SA. Beyond body mass index. Obes Rev. 2001;2:141–147. doi: 10.1046/j.1467-789x.2001.00031.x. [DOI] [PubMed] [Google Scholar]
- 30.Lorentzon M, Swanson C, Andersson N, Mellstrom D, Ohlsson C. Free testosterone is a positive, whereas free estradiol is a negative, predictor of cortical bone size in young Swedish men: the GOOD study. J Bone Miner Res. 2005;20:1334–1341. doi: 10.1359/JBMR.050404. [DOI] [PubMed] [Google Scholar]
- 31.Lorentzon M, Mellstrom D, Ohlsson C. Age of attainment of peak bone mass is site specific in Swedish men--The GOOD study. J Bone Miner Res. 2005;20:1223–1227. doi: 10.1359/JBMR.050306. [DOI] [PubMed] [Google Scholar]
- 32.Mellstrom D, Johnell O, Ljunggren O, Eriksson AL, Lorentzon M, Mallmin H, et al. Free testosterone is an independent predictor of BMD and prevalent fractures in elderly men: MrOS Sweden. J Bone Miner Res. 2006;21:529–535. doi: 10.1359/jbmr.060110. [DOI] [PubMed] [Google Scholar]
- 33.Blank JB, Cawthon PM, Carrion-Petersen ML, Harper L, Johnson JP, Mitson E, et al. Overview of recruitment for the osteoporotic fractures in men study (MrOS) Contemp Clin Trials. 2005;26:557–568. doi: 10.1016/j.cct.2005.05.005. [DOI] [PubMed] [Google Scholar]
- 34.Orwoll E, Blank JB, Barrett-Connor E, Cauley J, Cummings S, Ensrud K, et al. Design and baseline characteristics of the osteoporotic fractures in men (MrOS) study--a large observational study of the determinants of fracture in older men. Contemp Clin Trials. 2005;26:569–585. doi: 10.1016/j.cct.2005.05.006. [DOI] [PubMed] [Google Scholar]
- 35.Fan JB, Oliphant A, Shen R, Kermani BG, Garcia F, Gunderson KL, et al. Highly parallel SNP genotyping. Cold Spring Harb Symp Quant Biol. 2003;68:69–78. doi: 10.1101/sqb.2003.68.69. [DOI] [PubMed] [Google Scholar]
- 36.Andersson N, Strandberg L, Nilsson S, Ljungren O, Karlsson MK, Mellstrom D, et al. Variants of the interleukin-1 receptor antagonist gene are associated with fat mass in men. Int J Obes (Lond) 2009;33:525–533. doi: 10.1038/ijo.2009.47. [DOI] [PubMed] [Google Scholar]
- 37.Barrett JC, Fry B, Maller J, Daly MJ. Haploview: analysis and visualization of LD and haplotype maps. Bioinformatics. 2005;21:263–265. doi: 10.1093/bioinformatics/bth457. [DOI] [PubMed] [Google Scholar]
- 38.Zhang Y, Proenca R, Maffei M, Barone M, Leopold L, Friedman JM. Positional cloning of the mouse obese gene and its human homologue. Nature. 1994;372:425–432. doi: 10.1038/372425a0. [DOI] [PubMed] [Google Scholar]
- 39.Ettinger MP, Littlejohn TW, Schwartz SL, Weiss SR, McIlwain HH, Heymsfield SB, et al. Recombinant variant of ciliary neurotrophic factor for weight loss in obese adults: a randomized, dose-ranging study. JAMA. 2003;289:1826–1832. doi: 10.1001/jama.289.14.1826. [DOI] [PubMed] [Google Scholar]
- 40.Mohamed-Ali V, Goodrick S, Rawesh A, Katz DR, Miles JM, Yudkin JS, et al. Subcutaneous adipose tissue releases interleukin-6, but not tumor necrosis factor-alpha, in vivo. J Clin Endocrinol Metab. 1997;82:4196–4200. doi: 10.1210/jcem.82.12.4450. [DOI] [PubMed] [Google Scholar]
- 41.Vgontzas AN, Papanicolaou DA, Bixler EO, Hopper K, Lotsikas A, Lin HM, et al. Sleep apnea and daytime sleepiness and fatigue: relation to visceral obesity, insulin resistance, and hypercytokinemia. J Clin Endocrinol Metab. 2000;85:1151–1158. doi: 10.1210/jcem.85.3.6484. [DOI] [PubMed] [Google Scholar]
- 42.Steensberg A, van Hall G, Osada T, Sacchetti M, Saltin B, Klarlund Pedersen B. Production of interleukin-6 in contracting human skeletal muscles can account for the exercise-induced increase in plasma interleukin-6. J Physiol. 2000;529(Pt 1):237–242. doi: 10.1111/j.1469-7793.2000.00237.x. [DOI] [PMC free article] [PubMed] [Google Scholar]
- 43.Glund S, Krook A. Role of interleukin-6 signalling in glucose and lipid metabolism. Acta Physiol (Oxf) 2008;192:37–48. doi: 10.1111/j.1748-1716.2007.01779.x. [DOI] [PubMed] [Google Scholar]
Associated Data
This section collects any data citations, data availability statements, or supplementary materials included in this article.