Abstract
The variability of results in microarray technology is in part due to the fact that independent scans of a single hybridised microarray give spot images that are not quite the same. To solve this problem and turn it to our advantage, we introduced the approach of multiple scanning and of image integration of microarrays. To this end, we have developed specific software that creates a virtual image that statistically summarises a series of consecutive scans of a microarray. We provide evidence that the use of multiple imaging (i) enhances the detection of differentially expressed genes; (ii) increases the image homogeneity; and (iii) reveals false-positive results such as differentially expressed genes that are detected by a single scan but not confirmed by successive scanning replicates. The increase in the final number of differentially expressed genes detected in a microarray experiment with this approach is remarkable; 50% more for microarrays hybridised with targets labelled by reverse transcriptase, and 200% more for microarrays developed with the tyramide signal amplification (TSA) technique. The results have been confirmed by semi-quantitative RT–PCR tests.
INTRODUCTION
Gene expression profiling by means of platforms of large-scale arrayed DNAs (microarrays) is an extraordinarily powerful technology that enables the retrieval of thousands of pieces of data from a simple hybridisation experiment (1). Canonically, two different mRNA populations are first labelled with diverse fluorochromes and then challenged in competitive hybridisation with a single array platform that contains thousands of gene probes. Two fluorescence signals remain on each gene spot and are detected by confocal laser scanners. It is easy at this point to calculate the differences in gene expression between the two test mRNAs. Two main issues can still be regarded as intrinsic limits of this technology: because of its general sensitivity, genes that are expressed at low levels are not detected as differentially expressed genes (2); furthermore, the microarray technology is extremely sensitive to experimental changes and, as a consequence, the results can be highly variable. Different approaches have been formulated to control the variables in the different steps of the microarray experiments. For example, gene probes can be deposited in replicates and in different regions of the platform to control for local variations of the complex hybridisation reaction. Replications of the same hybridisation experiment are normally made to account for inter-experimental variation (3). Statistical algorithms for local and general normalisation of the fluorescence signals have been established (4), together with threshold levels for the definition of differentially expressed genes, and significance assessments of expression data (5). The variability of results in the gene expression profiling might also arise during the scanning process of the hybridised microarray. Usually, each microarray is scanned with a single laser run for each fluorochrome, and the intensity values of spots are then calculated. However, we have noticed that if a single microarray undergoes multiple scanning runs, the DNA spot images obtained are not exactly superimposable. To overcome this problem, and indeed take advantage of it, we have developed a software, called ΣPOT, for the management of multiple scan array images. Using the repeated measurements of pixel intensities, the software creates a virtual image that statistically summarises a series of consecutive scans of a microarray. Here we report experimental evidence that the approach of multiple scanning of a microarray enhances the robustness of signal detection and can remarkably increase the recognition of differentially expressed genes. Supplementary Material that accompanies this manuscript and the software developed for this work are available at NAR Online and http://muscle.cribi.unipd.it/microarrays/spot/.
MATERIALS AND METHODS
Microarray experiments
The microarrays used for this work were constructed arraying in duplicate on glass slides PCR-amplified inserts from a collection of 4801 3′-end-specific cDNA clones corresponding to transcripts expressed in human heart and skeletal muscle (Human Muscle Array 2.0, see http://muscle.cribi.unipd.it/microarrays/). We use a GenPackArray 21 spotting device (Genetix, UK) with 16 stealth micro pins (TeleChem, CA, USA). Microarray construction, extraction and reverse transcriptase (RT) direct labelling of total and linearly amplified (aRNA, see below) RNAs, and array hybridisations were carried out as described (6). The sources of RNA used in this study were samples of human adult heart and skeletal muscle or muscle biopsies from normal or dystrophic donors, kindly provided by Dr Corrado Angelini, Department of Neurology and Psychiatric Sciences, University of Padova. Linear amplification of mRNA from total RNA (7) was obtained using the Message-Amp-aRNA kit (Ambion, TX, USA) with two consecutive amplification steps according to the manufacturer’s recommendations. Fluorescent labelling of cDNA targets using the aminoallyl method was performed as for RT direct labelling with the addition of aminoallyl-derivatised nucleotides (Sigma-Aldrich, MO, USA). The dendrimer and tyramide signal amplification (TSA) labelling technologies were performed using the MICROMAX-TSA labelling and detection kit (Perkin Elmer, MA, USA) and the 3DNA-submicro-array (Genisphere, PA, USA) commercial kits, respectively, following the protocols recommended by the manufacturers. Two replicates of each experiment were carried out using different microarray slides where the RNA samples from two different sources were labelled with either Cy3- or Cy5-conjugated deoxyribonucleotides (Amersham Biosciences, Germany).
Software development
ΣPOT is written in C language with functions of library libtiff running on a UNIX system; it provides a brief help for the command syntax. The program can be downloaded at no charge at the following address: http://muscle.cribi.unipd.it/microarrays/spot/.
Statistical analysis
Array scanning was carried out using a Perkin Elmer LITE dual confocal laser scanner with Scan Array software. Row multiple images were processed through ΣPOT software and finally analysed with QuantArray software (Perkin Elmer) using median pixel intensities for each spot. The normalisation of the expression levels was performed with SNOMAD (8). Global and local mean normalisations across element signal intensity were applied, and then logarithmic transformation was performed for each expression level. The detection of differentially expressed genes was done with the SAM program available at http://www-stat.stanford.edu/~tibs/SAM/index.html (5). The false discovery rate (FDR) chosen for gene detection was set at 1%. All other statistical analyses were carried out with the statistical package R, available at http://www.r-project.org.
Spot and background uniformity indexes are calculated according to QuantArray image analysis software. Imin and Imax are respectively the minimum and the maximum intensity values of the pixels within a spot (or within the local background area) that are calculated after the exclusion of the 2% of the pixels that have the highest and lowest intensity values. The spot (background) uniformity index is:
γ = 1 – [(Imax – Imin) / range]
where ‘range’ is defined as the difference between Imax and Imin (before the exclusion of the 2% of extreme values).
Semi-quantitative RT–PCR
Specific primers were designed on the 3′-untranslated portions of the target transcripts, and the optimal annealing temperatures were determined by performing pilot PCRs in a temperature gradient-controlled thermal cycler, using the corresponding cDNA plasmid clones as templates. Aliquots of the total RNAs used for microarray experiments were retro-transcribed with Superscript II and oligo(dT) primers (Invitrogen, CA, USA). Template RNA was hydrolysed with NaOH and the first-strand cDNA was subjected to PCR with the transcript-specific primers. Replicates of the RT–PCRs were performed for each transcript, stopped at 18, 22, 29 and 35 cycles, and analysed by agarose gel electrophoresis. The band quantification was done with ImageMaster VDS (Amersham Biosciences, Germany).
RESULTS AND DISCUSSION
When microarrays undergo a series of scans, a single pixel belonging to a certain spot image often appears with different degrees of fluorescence intensity (Fig. 1, rows 1–10). It is reasonable to assume that only a portion of the fluorochromes is excitable by the laser beam and measurable by the photomultiplier, while the confocal scanning system is detecting the fluorescence of a spot subregion. Image variability implies a variability of quantification outputs and, thus, different microarrays results (Fig. 1, and Supplementary Material). Starting from this observation, we have introduced a multiple scanning protocol for hybridised microarrays, applying an approach that is similar to that used by astronomers to better reveal the light emissions of very distant stars (9). Our approach implies a series of consecutive scans of a hybridised microarray followed by the construction of a virtual final array image. To handle the multiple imaging of microarrays, we have developed a new software called ΣPOT. This program loads as input the n images obtained by serial scanning of a microarray and returns as output a single virtual array image where the intensity of each pixel is the result of two possible statistics: (i) the average of the intensity levels of each pixel of the input images; and (ii) the maximum intensity value of each pixel of the input images (Fig. 1, columns 11 and 12). For this second calculation, we have introduced the option of excluding saturated values unless they are detected in all the replicated images of a pixel.
Figure 1.
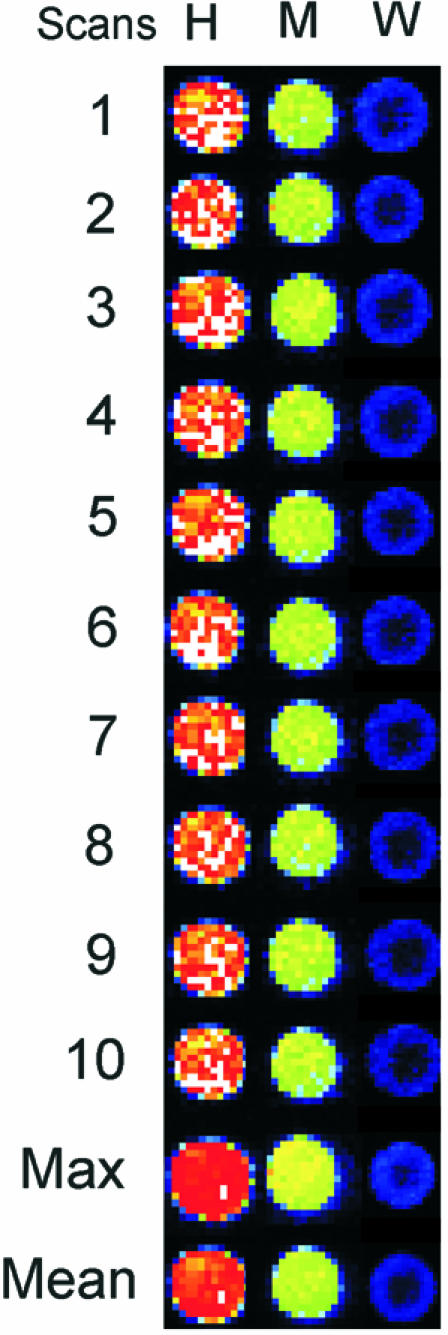
Variability of signal detection on microarray spots with multiple scans. A single microarray was subjected to 10 consecutive laser scans for Cy3 fluorescence. Three spots representing high (H), medium (M) and weakly expressed (W) transcripts were chosen, and the corresponding pixel regions obtained in the 10 images are shown in rows 1–10. Note that pixels with the same localisation within the spots often have different intensities. ΣPOT software integrations of the 10 images are reported in rows 11 and 12. The image in 11 has been obtained using the highest intensity value of each pixel, while the image in 12 has been obtained by using the average intensities of each pixel among the 10 scans. The enhancement of spot intensity after both calculations is evident, especially for the low-intensity spot.
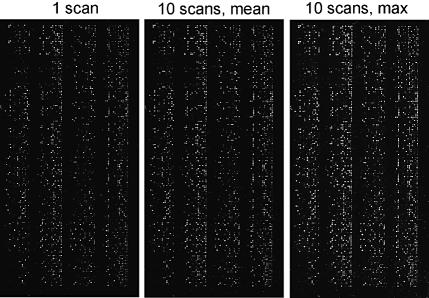
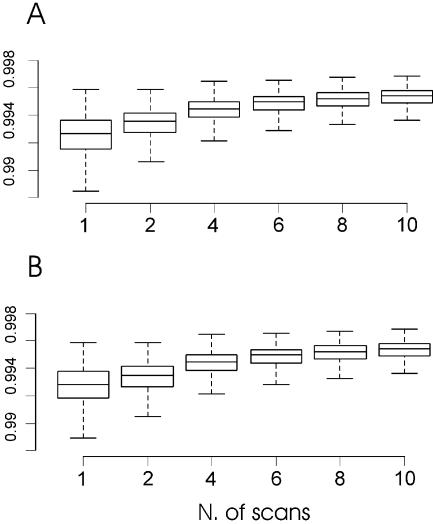
Figure 2 shows an example of integrated images produced by the software ΣPOT on the whole area of a microarray using the maximum and mean pixel intensity options. As can be seen, the virtual images have the following advantages: (i) they enhance the detection of low intensity spots; and (ii) they give more homogeneous spots and background (see also the images in the Supplementary Material). Figure 3 shows the distributions of spot and background homogeneity indexes with increasing numbers of multiple images. Both indexes range from 0 (minimum homogeneity) to 1 (maximum homogeneity) and show a significant increase in levels when our methodology is used. High image homogeneity is crucial in the process of spot detection and quantification, and it seems that with our virtual images, both steps can be improved.
Figure 2.
Multiple imaging and integration of a microarray. A microarray composed of 9600 features was hybridised with fluorescent cDNA target and analysed with a single confocal laser scan or with 10 consecutive scans followed by image overlay and integration with the software ΣPOT, according to the mean or to the maximum pixel principle. Note the general improvement of the signal across the entire microarray area. Significant reduction of background is achieved with the mean pixel calculation.
Figure 3.
Improvement of microarray imaging by integration of multiple scans. This graph shows the variation of the spot (A) and background (B) homogeneity of a microarray image with an increasing number of serial scans overlaid and processed by our ΣPOT software. These two indexes, described in Materials and Methods, measure two variables that are highly important for consistent imaging of hybridised microarrays. The central body of each plot is representative of 50% of the values, and the middle lines that divide the box are representative of the median value. Lines over and under the central body indicate the minimum and the maximum values of the distribution.
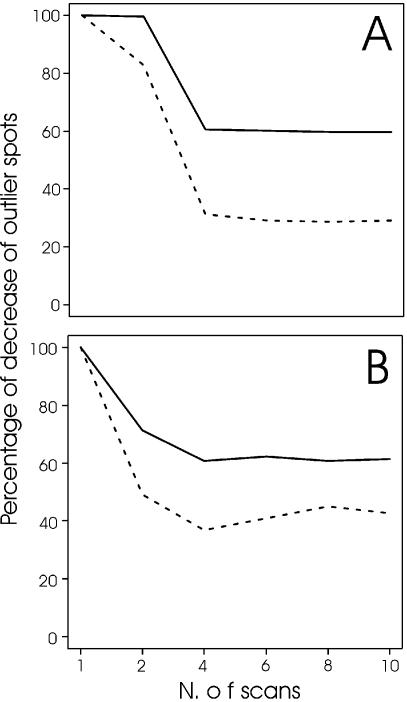
The approaches of serial scanning and image integration make the measuring of microarray spots more reliable. This statement is further substantiated by the following data. We performed two experiments with the Human Muscle Array where two equal aliquots of skeletal muscle RNA (first experiment) and heart muscle RNA (second experiment) were labelled with Cy3 and Cy5 fluorochromes and challenged in competitive hybridisation. In these cases, all the Cy3/Cy5 ratios of spot intensities should lie at around 1. However, due to experimental variability of the complex hybridisation, a portion of spots results with intensity ratios that diverge from 1. In microarray technologies, such trial experiments are used to define threshold values that contain the majority of spot intensity ratios (usually ∼99%); these threshold values are then used in parallel microarray experiments to define as differentially expressed the transcripts whose intensities lie outside the thresholds. Figure 4 shows that in a microarray experiment, where the same RNA is used for competitive hybridisation, the number of spots that lie outside arbitrary threshold values of 1 and –1 intensity ratios is strongly reduced by an increasing number of microarray scans. In the approach described above, this means that the thresholds for defining up- and downregulated transcripts can be lowered accordingly, and that a greater number of outlier spots can be consistently measured. In this respect, the maximum pixel method seems to be more effective than average. Probably the first methodology is able to balance more efficiently the expression levels in the case of unequal fluorochrome distribution or detection around the spot area.
Figure 4.
The multiple scanning procedure improves the reliability of microarray experiments. Two experiments were performed in which the Human Muscle Array was subjected to competitive hybridisation with two aliquots of the same RNA labelled with fluorochromes Cy3 and Cy5. Arbitrary threshold levels for spot intensity ratios were fixed at +1 and –1, and the number of outlier spots was counted after the analysis of a single microarray scan or of increasing numbers of serial scans as indicated. The number of outliers in the single scan was made equal to 100 and the numbers obtained with serial microarray scans are reported as a percentage of this initial value. (A) Microarray experiment with Cy3- versus Cy5- labelled heart RNA. (B) Microarray experiment with Cy3- versus Cy5- labelled skeletal muscle RNA. Dotted and solid lines refer to the results obtained with the maximum and average pixel methodology, respectively. See text for comments on these experiments.
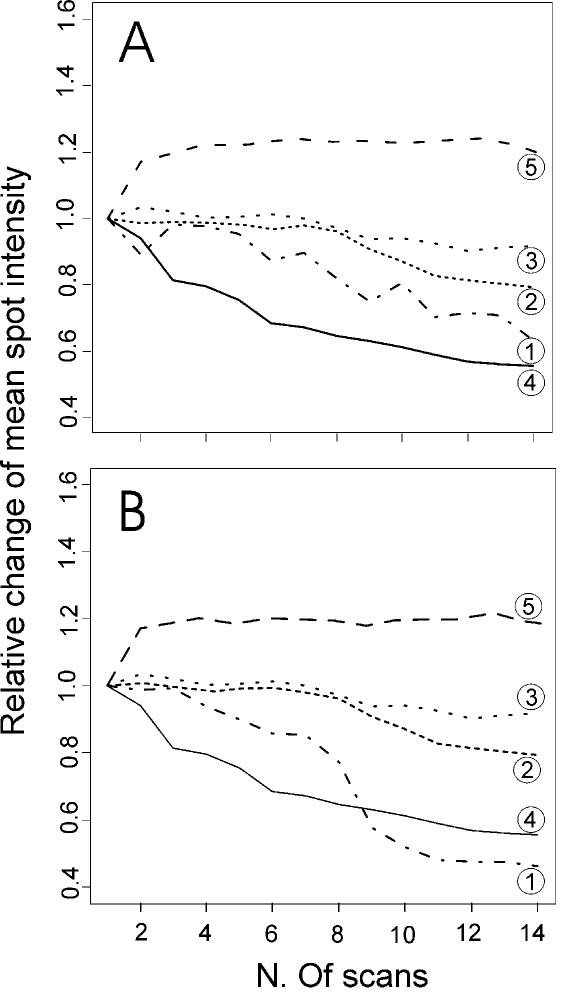
The total number of useful scans should depend on the different protocols that are used for signal development in microarrays. After a threshold number of scans, probably different for each protocol, the fluorescence of the spots is expected to decline. To test this point, we performed five microarray experiments where the target and the hybridisation signals were generated by the most used technologies. They are: (i) RT labelling of total RNA; (ii) RT labelling of linearly amplified mRNA (7); (iii) the aminoallyl dye coupling protocol (10); (iv) DNA dendrimer probes (11); and (v) the TSA technique (12). We performed 14 serial scans of the arrays, together with signal quantification. Then, among the spots that showed intensity values at around 40 000 and 500 arbitrary units (background was around 50 units), we randomly selected two groups of 20 transcripts, and analysed the trends of their intensities with the scan progression. Figure 5 shows that with RT labelling and aminoallyl techniques, the signal decreases after the fifth scan, while with linear amplification and DNA dendrimers, the extent of the decrease is much smaller. On the other hand, the TSA technique shows an increase after the first scan, and a substantial plateau is reached after the second scan. This experiment shows that the principle of using multiple serial scans of a microarray is suitable for all these established technologies for target labelling and signal detection, albeit with different advantages.
Figure 5.
Variation of spot signal with incremental scans of microarrays developed with different technologies. Microarrays processed with five different labelling and hybridisation protocols were subjected to 14 consecutive confocal laser scannings for Cy5 fluorescence. The averaged intensity values for groups of spots with intensity levels around 40 000 (A) and 500 (B), as revealed by QuantArray software, have been calculated for each scan and plotted. The protocols compared are: RT direct labelling of total RNA (1), direct labelling of aRNA (2); aminoallyl dye coupling (3); DNA dendrimer probes (4); and TSA technology (5). For each technology, a value of 1.0 was given to the mean intensity obtained after a single scan, and the intensities obtained after successive scans are reported in proportion to this reference value. From these experiments, it appears that six successive scans will give the maximum improvement of spot signal detection when microarrays are developed with technologies 2, 3 and 5, whereas for the others techniques (1 and 4) after four scans the performance begins to deteriorate and probably there would be no further benefit to the integrated image analysis.
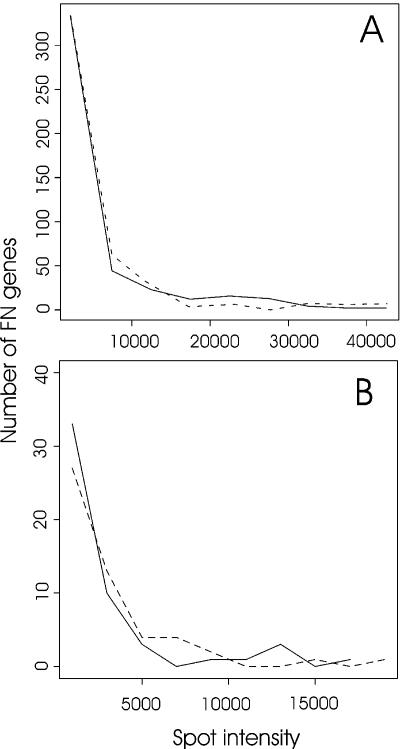
To measure the improvement of spot detection given by multiple images overlay, we performed and analysed a microarray hybridised with a target made with RT labelling, and a second one developed according to the TSA methodology, representative of two opposite signal detection trends (Fig. 5). In the first experiment, we challenged RNAs of skeletal and heart muscle in competitive hybridisation. In the second one, we compared RNAs of dystrophic (facioscapulohumeral muscular dystrophy) and normal muscle. The microarray platforms were made with a muscle-specific cDNA collection (see Materials and Methods). Each hybridised array was scanned 10 times (with either Cy5 or Cy3 lasers) and then the ΣPOT software was applied to obtain virtual images that were the integration of the first two, four, six, eight and 10 serial scans. The image analysis was performed on all the virtual images (20 images for each experiment) and, after data normalisation, differentially expressed genes were counted (the complete lists of differentially expressed genes are available in the Supplementary Material). Taking as reference the expression data canonically obtained with a single scan, we have compared the numbers of differentially expressed genes obtained from virtual images that were derived by superimposing different serial scans. We have grouped these results into two classes: false-negative (FN) are differentially expressed genes that were not identified by the first scan, and false-positive (FP) are genes that were recognised as differentially expressed by the first scan, but not confirmed by the successive scans. Moreover, we have distinguished in both classes genes that resulted in the competitive hybridisations as over-expressed or under- expressed in the skeletal muscle versus heart or normal muscle versus dystrophic. Tables 1 and 2 show the absolute and relative numbers of FP and FN genes in the two experiments with increasing number of overlaid images. It is clear that the multiple imaging approach increases the number of differentially expressed genes detected by a single scan. The increment is more striking for the under-expressed genes, i.e. the class generally more difficult to measure consistently in microarray experiments. In fact, it is often difficult to consider as statistically significant the fluorescence values of transcripts that are expressed at low levels, and under-expressed genes fall into this category. This is because they could be very close to the general background or because they have a too large standard deviation when they are measured repeatedly in replicate experiments. We think that our method, by enhancing the general performance of a spot and by reducing the variability of pixel intensities (Fig. 3), actually improves the significance of fluorescence measures of spots corresponding to weakly expressed transcripts and therefore enhances the number of under-expressed genes that can be detected in a competitive microarray hybridisation experiment. If the number of ‘consistent’ FNs (CFNs, defined later on in the discussion) is expressed as a function of the signal intensities of the corresponding spots in the microarray (Fig. 6), it appears evident that the greatest improvement in differentially expressed genes revealed by the multiple scanning approach concerns the spots in the low intensity region. The improvements obtained are somewhat different for the two methods used for microarray development. In the direct RT labelling experiment, the multiple imaging reveals that a high percentage of differentially expressed genes found after a single scan could be false positives. This is not seen with the TSA technology. TSA is based on an enzymatic reaction for fluorescence generation and this gives a more uniform signal on the spots. On the other hand, the number of differentially expressed genes that are measurable by serial scans of TSA-treated microarrays is really remarkable (∼140% increment of over-expressed genes and ∼200% increment of under-expressed genes). This should, of course, be correlated with the better fluorescence intensity trend shown by microarrays developed with TSA technology, with serial scans (Fig. 5).
Table 1. Improved detection of differentially expressed genes with multiple scans (RT labelling).
| 2 scans | 4 scans | 6 scans | 8 scans | 10 scans | ||||||
|---|---|---|---|---|---|---|---|---|---|---|
| Mean | Max | Mean | Max | Mean | Max | Mean | Max | Mean | Max | |
| Over-expressed | ||||||||||
| FP | 26 (13) | 19 (10) | 21 (11) | 21 (11) | 24 (12) | 19 (10) | 20 (10) | 30 (15) | 24 (12) | 24 (12) |
| CFP | – | – | 19 | 15 | 18 | 13 | 15 | 13 | 16 | 14 |
| NFP | 26 | 19 | 2 | 6 | 3 | 2 | 1 | 7 | 2 | 2 |
| FN | 18 (9) | 41 (21) | 37 (19) | 36 (18) | 36 (18) | 53 (27) | 50 (25) | 18 (9) | 34 (17) | 29 (15) |
| CFN | – | – | 15 | 20 | 22 | 20 | 24 | 17 | 34 | 15 |
| NFN | 18 | 41 | 10 | 5 | 4 | 10 | 4 | 0 | 0 | 3 |
| Under-expressed | ||||||||||
| FP | 6 (19) | 7 (22) | 2 (6) | 5 (16) | 2 (6) | 3 (9) | 4 (13) | 3 (9) | 4 (13) | 1 (3) |
| CFP | – | – | 2 | 4 | 2 | 3 | 2 | 2 | 2 | 1 |
| NFP | 6 | 7 | 0 | 1 | 1 | 0 | 1 | 0 | 1 | 1 |
| FN | 7 (22) | 12 (38) | 13 (41) | 15 (47) | 14 (44) | 18 (56) | 23 (72) | 15 (47) | 20 (63) | 20 (63) |
| CFN | – | – | 4 | 7 | 10 | 9 | 13 | 11 | 17 | 14 |
| NFN | 7 | 12 | 9 | 8 | 3 | 8 | 7 | 3 | 2 | 3 |
A cDNA microarray was subjected to competitive hybridisation with skeletal muscle and heart RNAs, both made fluorescent by RT labelling and subjected to single and then to increasing numbers of laser scans, as indicated. After analysis with ΣPOT and the programs described in Materials and Methods, the differentially expressed transcripts were counted. The single scan analysis showed 200 over- and 31 under-expressed transcripts in skeletal muscle versus heart. The absolute and percentage (in parentheses) increments of over- and under-expressed transcripts with respect to the first scan are indicated for every two scans added. The results of ΣPOT analysis according to the mean pixel (Mean) or the maximum pixel (Max) calculation principle are reported separately in two flanking columns.
FP = false positive; FN = false negative; CFP and CFN = consistent false positive and negative; NFP and NFN = novel false positive and negative. See text for the description and discussion of this classification.
Table 2. Improved detection of differentially expressed genes with multiple scans (TSA technology).
| 2 scans | 4 scans | 6 scans | 8 scans | 10 scans | ||||||
|---|---|---|---|---|---|---|---|---|---|---|
| Mean | Max | Mean | Max | Mean | Max | Mean | Max | Mean | Max | |
| Over-expressed | ||||||||||
| FP | 0 (0) | 0 (0) | 0 (0) | 0 (0) | 1 (1) | 1 (1) | 0 (0) | 1 (1) | 0 (0) | 0 (0) |
| CFP | – | – | 0 | 0 | 0 | 0 | 0 | 1 | 0 | 0 |
| NFP | 0 | 0 | 0 | 0 | 1 | 1 | 0 | 0 | 0 | 0 |
| FN | 110 (74) | 90 (61) | 154 (104) | 131 (89) | 184 (124) | 137 (93) | 198 (134) | 158 (107) | 207 (140) | 169 (114) |
| CFN | – | – | 107 | 85 | 152 | 117 | 175 | 131 | 189 | 150 |
| NFN | 110 | 90 | 47 | 46 | 31 | 17 | 21 | 16 | 14 | 14 |
| Under-expressed | ||||||||||
| FP | 2 (2) | 2 (2) | 2 (2) | 2 (2) | 1 (1) | 2 (2) | 2 (2) | 2 (2) | 2 (2) | 2 (2) |
| CFP | – | – | 2 | 2 | 0 | 2 | 1 | 2 | 1 | 2 |
| NFP | 2 | 2 | 0 | 0 | 0 | 0 | 0 | 0 | 0 | 0 |
| FN | 175 (164) | 157 (147) | 214 (200) | 198 (185) | 229 (214) | 191 (179) | 263 (246) | 212 (198) | 255 (238) | 244 (228) |
| CFN | – | – | 170 | 149 | 203 | 173 | 223 | 179 | 241 | 197 |
| NFN | 175 | 157 | 44 | 49 | 22 | 17 | 32 | 23 | 6 | 21 |
A cDNA microarray was subjected to a competitive hybridisation with normal and dystrophic muscle RNAs. Hybridisation signals have been generated with TSA technology and the microarray was subjected to single and then to increasing numbers of laser scans, as indicated. After a single scan of the microarray, 149 over- and 107 under-expressed transcripts in normal versus dystrophic muscle RNA were found. The additional differentially expressed transcripts obtained after microarray analysis with ΣPOT software are reported and classified as in the footnotes of Table 1.
Figure 6.
Relationship between number of false-negative genes and spot intensities. Spot intensities of FN genes determined by the multiple imaging approach were categorised into nine classes of intensity: from 0 to 18 000 arbitrary units (over background), in 2000 unit intervals. Frequencies of each class were plotted along spot intensity for Cy3 (dotted lines) and Cy5 channels (plain lines). (A) Microarray experiment with normal versus dystrophic muscle RNAs. (B) Microarray experiment with skeletal muscle versus heart RNAs.
Not all the FP or FN genes detected with a certain number of superimposed images are confirmed after the addition of more serial scans. In this context, we need a rule to define FP and FN. We decided to count as ‘consistent’ FN and FP (CFN and CFP) those genes that are calculated after a given superimposed image and confirmed in all the previous scans, and ‘novel’ FP and FN (NFP and NFN) those genes identified for the first time by each additional scan. The numbers of NFP and NFN therefore indicate the real improvement achieved by the inclusion of each additional serial microarray image. The comparison of the results obtained with the maximum and mean methodologies shows that >80% of the FN and FP transcripts are identical. In particular, in the TSA experiment, 144/164 upregulated FNs and 192/218 downregulated FNs are common between the mean and maximum methodologies. In the RT labelling experiment, 16/18 upregulated FN, 14/16 upregulated FP and 13/17 downregulated FN transcripts are common between the mean and maximum methodologies. Data from both Tables 1 and 2 show that a remarkable improvement in the detection of differentially expressed genes is obtained with 4–6 scans of microarrays developed either with TSA or with direct RT labelling methodologies (see numbers of NFPs and NFNs). It should be pointed out, however, that the threshold number of scans could vary slightly from experiment to experiment as a consequence of many variables such as the specific activity of the labelled RNA targets, stringency of microarray hybridisation, washing, etc. Also considering the more restricted classification and CFN, the approach of multiple imaging shows a great improvement for the detection of over- and under-expressed genes in microarray experiments carried out with RT-labelled targets and TSA technology for signal generation. Complete transcript lists are available in the Supplementary Material.
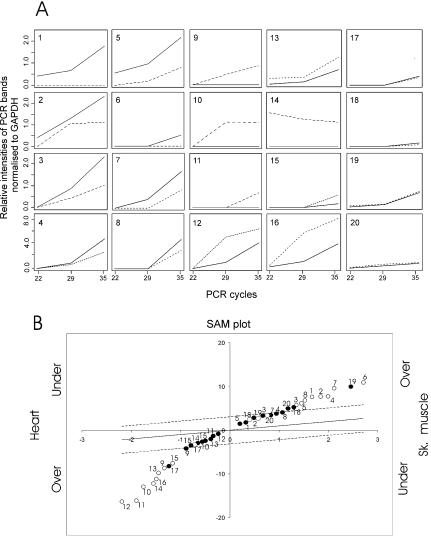
To experimentally validate these findings, the level of expression of a randomly chosen group of CFN genes, detected after 10 serial scans, was checked by semi- quantitative RT–PCR on the same RNA sources used for microarray hybridisations. We tested a series of over-expressed and under-expressed transcripts in skeletal muscle which resulted from the ΣPOT analysis of the microarray hybridised with skeletal muscle and heart RNAs. All the RT–PCR tests done on CFN genes are in agreement with the results obtained by the analysis of multiple microarray images. We have also checked by semi-quantitative RT–PCR a group of transcripts that were found to be differentially expressed after a single scan but not confirmed after 10 serial scans (CFPs). Roughly half of these did not give measurable bands after agarose gel separation of RT–PCR products and the remainder gave amplification products of similar intensity for the skeletal and heart muscle RNA. This could mean that many of these FP spots are generated by spurious scanning signals that are not reproduced by further laser detections. The RT–PCR expression profiles of a sample of the tested CFN and CFP transcripts are reported in Figure 7A. For comparison, Figure 7B shows the fluorescence intensities of the tested transcripts calculated after a single scan or after integration of 10 serial microarray images.
Figure 7.
Validation of the results of the multiple scan approach by RT–PCR. (A) RT–PCR profiles of a selected sample of CFN and CFP transcripts. Specific primers were designed for 16 transcripts that were found to be differentially expressed between skeletal and heart RNAs after 10 serial scans of the microarray experiment made with RT direct labelling (CFN, Table 1) and for four transcripts that were found to be differentially expressed after a single scan of a microarray but not confirmed by successive scans (CFP, Table 1). Semi-quantitative RT–PCR tests were made on the same RNA sources used for microarray target production. For each reaction, replicates have been stopped at 22, 29 and 35 PCR cycles and subjected to agarose gel electrophoresis. RT–PCR reference reactions have been made on skeletal and heart RNAs with primers for the housekeeping transcript glyceraldehyde-3-phosphate dehydrogenase. Gel bands were detected and quantified, and the intensity values were normalised to the GADPH reference bands of the corresponding PCR cycle. The CFN transcripts tested were as follows (GenBank accession nos are in parentheses). Over-expressed in skeletal muscle versus heart: (1) myosin-binding protein C, fast-type (MYBPC2, NM_004533); (2) titin (TTN, XM_038278); (3) human DNA sequence from clone RP11-343H5 on chromosome 1 (AL591846); (4) Homo sapiens partial mRNA for putative homologues to Mus musculus sex-determination protein (HSPD04604_FL105, AF064447); (5) H.sapiens mRNA for striate muscle-specific hypothetical protein (ORF1), clone 00275 (HSPD00275_FL148, AJ276555); (6) human sequence from clone RP3-365I19 on chromosome 1 (AL078463); (7) H.sapiens acetyl-coenzyme A transporter (ACATN, NM_004733); and (8) human autoantigen small nuclear ribonucleoprotein Sm-D (NM_006938). Under-expressed in skeletal muscle versus heart: (9) troponin T2, cardiac (TNNT2, NM_000364); (10) α-actin, cardiac muscle (ACTC, NM_005159); (11) myosin-binding protein C, cardiac (MYBPC3, X84075); (12) H.sapiens heat shock 90 kDa protein 1, alpha (HSPCA, NM_005348); (13) H.sapiens haplotype M*2mitochondrion (AF382013, AF382013); (14) H.sapiens chromosome 5, BAC clone 282B7 (AC005216); (15) H.sapiens macrophage migration inhibitory factor (glycosylation-inhibiting factor) (MIF, NM_002415); and (16) H.sapiens ring finger protein 28 (RNF28, NM_032588). The FP transcripts tested were: (17) H.sapiens clone alpha_est218/52C1, (AF001542); (18) H.sapiens CD27-binding (Siva) protein transcript variant 1 (SIVA, U82938); (19) human skeletal muscle 1.3 kb mRNA for tropomyosin; and (20) H.sapiens cathepsin H (CTSH, NM_004390). (B) The expression levels of the 20 transcripts checked in (A) by RT–PCR, calculated after a single scan (filled circles) or 10 (open circles) laser scans of the microarrays. The numbers near the circles are used to indicate the transcripts as in the plots of (A). It is clear that only the use of multiple imaging can reveal the CFN transcripts as differentially expressed (1–16) and that, conversely, multiple imaging is able to unmask false outliers found after a single scan of a microarray (17–20).
In conclusion, we propose the introduction of multiple scans and image integration in the routine of microarray technology. Serial repetition of hybridisation experiments is another strong method for the reduction of the experimental error in microarray technology. However, this approach is not always applicable since the RNA source is often a limiting factor (e.g. human biopsies or a specific subpopulation of cells). In any case, each replicated microarray experiment undergoing a single laser scan will suffer from the same phenomenon of spot intensity variability; therefore, our approach should improve the consistency of the final expression data even in a protocol of replicated hybridisations. We have provided evidence that in this way both the detection of differentially expressed genes and the robustness of spot intensity values can be improved. Our ΣPOT software can be easily integrated with common computer programs for microarray image generation and analysis associated with the most diverse microarray scanners. We are working towards a complete, user-friendly interfacing of the ΣPOT software with the programs of our currently used confocal laser scanner.
SUPPLEMENTARY MATERIAL
Supplementary Material is available at NAR Online.
Acknowledgments
ACKNOWLEDGEMENTS
The authors wish to thank Professor Giorgio Giacometti and Paolo Scannapieco, Department of Biology, University of Padova for stimulating discussions. This work was supported by the Fondazione Telethon ONLUS, Italy (grants B57 and GGP02271) and the Ministero dell’Università e Ricerca Scientifica, Italy (grants COFIN2001 No. 2001058259_001, COFIN2002 No. 2002065411_002 and FIRB No. RBNE015AX4_002). Instrumentations for microarray construction and analysis are a generous donation of the Fondazione della Cassa di Risparmio di Padova e Rovigo, Padova, Italy.
REFERENCES
- 1.Schena M., Shalon,D., Davis,R.W. and Brown,P.O. (1995) Quantitative monitoring of gene expression patterns with complementary DNA microarray. Science, 270, 467–470. [DOI] [PubMed] [Google Scholar]
- 2.Duggan D.J., Bittner,M., Chen,Y., Meltzer,P. and Trent,J.M. (1999) Expression profiling using cDNA microarrays. Nature Genet., 21 (1 Suppl.), 10–14. [DOI] [PubMed] [Google Scholar]
- 3.Lee M.-L.T., Kuo,F.C., Whitmorei,G.A. and Sklar,J. (1997) Importance of replication in microarray gene expression studies: statistical methods and evidence from repetitive cDNA hybridizations. Proc. Natl Acad. Sci. USA, 97, 9834–9839. [DOI] [PMC free article] [PubMed] [Google Scholar]
- 4.Yang Y.H., Dudoit,S., Luu,P., Lin,D.M., Peng,V., Ngai,J. and Speed,T.P. (2002) Normalization for cDNA microarray data: a robust composite method addressing single and multiple slide systematic variation. Nucleic Acids Res., 30, e15. [DOI] [PMC free article] [PubMed] [Google Scholar]
- 5.Tusher V.G., Tibshirani,R. and Chu,G. (2001) Significance analysis of microarrays applied to the ionizing radiation response. Proc. Natl Acad. Sci. USA, 98, 5116–5121. [DOI] [PMC free article] [PubMed] [Google Scholar]
- 6.Campanaro S., Romualdi,C., Fanin,M., Celegato,B., Pacchioni,B., Trevisan,S., Laveder,P., De Pittà,C., Pegoraro,E., Hayashi,Y.K., Valle,G., Angelini,C. and Lanfranchi,G. (2002) Gene expression profiling in dysferlinopathies using a dedicated muscle microarray. Hum. Mol. Genet., 11, 3283–3298. [DOI] [PubMed] [Google Scholar]
- 7.Philips T. and Eberwine,J.A. (1996) Antisense RNA amplification: a linear amplification method for analyzing the mRNA population from single living cells. Methods, 10, 283–288. [DOI] [PubMed] [Google Scholar]
- 8.Colantuoni C., Henry,G., Zeger,S. and Pevsner,J. (2002) SNOMAD (Standardization and NOrmalization of MicroArray Data): web-accessible gene expression data analysis. Bioinformatics, 18, 1540–1541. [DOI] [PubMed] [Google Scholar]
- 9.Zapatero Osorio M.R., Bejar,V.J., Martin,E.L., Rebolo,R., Barrado y Navascues,D., Bailer-Jones,C.A. and Mundt,R. (2000) Discovery of young, isolated planetary mass objects in the final sigma Orionis star cluster. Science, 290, 103–107. [DOI] [PubMed] [Google Scholar]
- 10.Hughes T.R., Mao,M., Jones,A.R., Burchard,J., Marton,M.J., Shannon,K.W., Lefkowitz,S.M., Ziman,M., Schelter,J.M., Meyer,M.R., Kobayashi,S., Davis,C., Dai,H., He,Y.D., Stephaniants,S.B., Cavet,G., Walker,W.L., West,A., Coffey,E., Shoemaker,D.D., Stoughton,R., Blanchard,A.P., Friend,S.H. and Linsley,P.S. (2001) Expression profiling using microarrays fabricated by an ink-jet oligonucleotide synthesizer. Nat. Biotechnol., 19, 342–347. [DOI] [PubMed] [Google Scholar]
- 11.Stears R.L., Getts,R.C. and Gullans,S.R. (2000) A novel, sensitive detection system for high-density microarrays using dendrimer technology. Physiol. Genomics, 3, 93–99. [DOI] [PubMed] [Google Scholar]
- 12.Adler K., Broadbent,J., Garlick,R., Joseph,R., Khimani,A., Mikulskis,A., Rapiejko,P. and Killian,J. (2000) MICROMAX™: a highly sensitive system for differential gene expression on microarrays. In Schena,M. (ed.), Microarray Biochip Technology. Eaton Publishing, Natick, MA, pp. 221–230. [Google Scholar]
Associated Data
This section collects any data citations, data availability statements, or supplementary materials included in this article.


