

1 Introduction
1.1 A brief account of the chemical shift
The chemical shift of a nucleus, i, in a molecule arises from the nuclear shielding effect of an applied magnetic field, caused by an induced magnetic field resulting from circulation of surrounding electrons [1–6]. The magnitude of such an induced magnetic field is proportional to the strength of the applied external magnetic field B0, so that the effective field Beff at the nucleus is given as
| (1) |
where σi is the second-rank nuclear shielding tensor and 1 is the unit matrix. In normal NMR experiments B0 is a uniform field along the z-axis; therefore, σi= σizz. The resonance NMR frequency, νi, of a given nucleus in a molecule is thus related to its gyromagnetic ratio, γi, as given by
| (2) |
The most commonly used isotropic chemical shift (ppm) δi parameter is defined as the difference between the resonance frequency of a nucleus of interest, νi, and that of a reference nucleus, νref [1–4,6]:
| (3) |
In normal NMR experiment B0 is uniform field along z. Only 1 term survives so that νi = (γi/2π)B0 (1− σizz). In an isotropic, liquid sample we can replace σizz by σI and δi is a scalar quantity due to the fast tumbling of molecules as shown below by an average parameter, δiso. In a solid or oriented samples (such as a liquid crystalline or single crystalline sample), the chemical shift is not an isotropic parameter but is a second-rank tensor. The components of the anisotropic chemical shift tensor in these samples can be specified by δij; where i,j = x, y, or z in a reference frame fixed on the nucleus in a molecule. A transformation of the shielding tensor to a frame of reference defined by axes X, Y, and Z [in the principal axis system (PAS)] diagonalizes the matrix to give the three principal components (δXX, δYY, δZZ). The isotropic average of the tensor is given by
| (4) |
In the “Haeberlen notation”, each of the three principal components is related to δiso by [7,8]:
| (5) |
where δZZ is the principal component farthest from the isotropic value, and δYY is the component closest to δiso: the ordering of the components can be either δZZ ≥ δYY ≥ δXX or δZZ ≤ δYY ≤ δXX, depending on the chemical structure in question. Therefore, the “reduced anisotropy” is defined as
| (6) |
or
| (7) |
These two definitions are related by
| (8) |
The shielding asymmetry η is defined as
| (9) |
In the “Mehring notation”, the principal components, δ11, δ22 and δ33, are defined as [9],
| (10) |
Analogous to Eq (4), the definition of an isotropic shielding is given as
| (11) |
but the relationships for anisotropy and asymmetry are more difficult to express than that under the Haeberlen convention, since they depend on the position of σ22 between σ11 and σ33 [7,9].
These anisotropy/asymmetry conventions can be replaced by span (Ω) and skew (κ) parameter with the following definitions [7,10]:
| (12) |
| (13) |
In the case of a symmetric nuclear site, however, those components may be expressed relative to the symmetry axis, δ|| (δ11) and its perpendicular axes δ⊥ (δ22 and δ33), with the chemical shielding (or shift) anisotropy
| (14) |
The magnitude of the anisotropy Δδ and the asymmetric parameter η are also defined as
| (15) |
and
| (16) |
Here, δ|| =δ11 and δ⊥ = (δ22 + δ33)/2.
Undoubtedly, the nomenclature based on the chemical shift parameter δii is directly related to the chemical shift anisotropy (CSA) which is one of the main topics discussed in this article. Nevertheless, there are many previous papers utilizing shielding constants δi’s, instead chemical shifts δ’s. In such cases, it should be bore in mind that Δδ = − Δσ and σ33 ≥ σ22 ≥ σ11.
Isotropic chemical shifts of nuclei in different chemical groups of a molecule, are usually available from a solution sample [1–6] where there is motional averaging of the anisotropic shielding tensor. They are undoubtedly one of the most important NMR parameters measured from high-resolution NMR experiments, besides other parameters such as spin coupling constants and nuclear relaxation times, for determining primary or secondary structures of molecules, their dynamics, intermolecular interactions, etc. The chemical shift anisotropy (CSA) is usually obtained from NMR experiments on a solid or a liquid crystalline sample; the corresponding isotropic chemical shifts can also be measured from solid samples [11–15]. It should be mentioned that CSA is an important source of spin-lattice (T1) and spin-spin (T2) relaxation at high magnetic fields even for solution samples, although not affecting the shapes of solution NMR spectral lines. The contribution of the CSA to T2, and hence the width of the resonance increases with magnetic field strength leading to broad, unresolved lines.
Under such circumstances, transverse relaxation-optimized spectroscopy (TROSY) [16–20] can be utilized to record well-resolved spectra of large proteins or protein complexes with molecular weight on the order of 100 kDa, with the advantage of an attenuated T2 relaxation by mutual cancellation of dipole-dipole coupling and CSA under the proton-coupled condition. For this purpose, it is essential to have a prior knowledge of the magnitude of the CSA values for nuclei under consideration to optimize the condition for TROSY-type experiments. This has stimulated much interest in evaluating the CSA values of nuclei in individual amino acid residues of large globular proteins in aqueous solutions or micelles. Determination of residue-specific 15N CSA for proteins in solution is now feasible by careful evaluation of T1 and T2 values at various external magnetic fields [21]. Such data are currently available from the literature. It is emphasized here that we are now in an era when solid-state and solution NMR approaches are frequently utilized in the analyses of CSA parameters and their applications for structural and dynamical studies of biomolecules.
It is therefore very important to gain insights into how and to what extent the isotropic or anisotropic chemical shift of a nucleus under consideration are related to molecular and electronic structure. The existence of conformation-dependent chemical shifts was initially recognized for a variety of biological molecules by solid-state NMR studies on polypeptides, polysaccharides, antibiotics, and so on [22–24] and later by a careful examination of a robust database of chemical shifts available from multidimensional NMR studies of globular proteins in aqueous solution [25–28]. Detailed analyses of such data showed that these chemical shift parameters are indispensable restraints for determining 3D structures of large proteins with or without the usual NOE constraints. Chemical shift anisotropies (CSAs) of individual nuclei were initially obtained by solid-state NMR studies on single crystalline, static, or slowly rotating samples. These CSA parameters for nuclei in challenging proteins are now also available from samples using fast magic angle spinning (MAS) experiments [29].
The values of isotropic and anisotropic chemical shift parameters accumulated so far have been utilized to reveal either secondary or 3D structures of fibrous, membrane and globular proteins in solid-state or aqueous solution-state [22–30]. Further, CSA parameters are essential to characterize atomic-level dynamics in the solid-state, or to search for an optimal condition for obtaining TROSY spectra on globular proteins of larger molecular weight, and also to determine relaxation mechanisms in solution. In particular, the chemical shifts are now utilized as a means to reveal 3D structures of large globular proteins, in the absence of NOE constraints which are difficult to obtain because of broad resonances with low signal-to-noise ratio.
Because of the increasing interest in utilizing CSA parameters, there has been a plethora of studies determining CSA values of nuclei in different types of samples. There are several excellent review articles that deal with the topics of isotropic [22–28] and anisotropic [29–39] chemical shifts. In this review, it is our intention to deal equally with these topics from both solid-state and solution NMR studies based on the recent progress in the field, especially dealing with these studies from a historical point of view. Emphasis, however, is also made on how to reveal necessary chemical and biological insights into a variety of biological molecules, including peptides, proteins, lipids, etc. using isotropic or anisotropic chemical shift data. However, we believe that our treatment can also be extended to other areas of chemistry. In the solid-state, unlike in solution, the chemical shielding experienced by a nucleus depends on the direction of the applied magnetic field in the molecule frame. Therefore the Hamiltonian for the Zeeman interaction, HCSA, in the solid-state is given by:
| (17) |
Thus, the chemical shift tensor component δzz as stated above is related to components δ11, δ22 and δ33 in the molecular principal axis system (PAS) frame by,
| (18) |
| (19) |
where α and β are the polar angles that the field B0 makes in the PAS (X, Y, and Z) molecular frame (Fig. 1A) for single crystals or oriented samples [1,2]. An NMR signal from microcrystalline or powder samples arises from the sum of all possible contributions of α and β angles (powder pattern), for either axially symmetric (left) (δ11= δ22≠δ33) or (axially) asymmetric (right) (δ11≠ δ22≠ δ33) as illustrated in Fig. 2. The principal components of the CSA tensor can be obtained from the peak at δ22 as well as the two edges at δ11 and δ33 of the powder pattern signal.
Fig. 1.

(a) Euler angles which relate principal axis system (X,Y, and Z) in a molecule and laboratory frame (x, y, and z, in which z is taken along the direction of applied field. (b) Sample is rotated with angular velocity of ωr about an axis inclined at an angle of β to the applied field B0 at angles χ1, χ2, and χ3 to the principal axes of σ. Magic angle for β = 54°44′
Fig. 2.
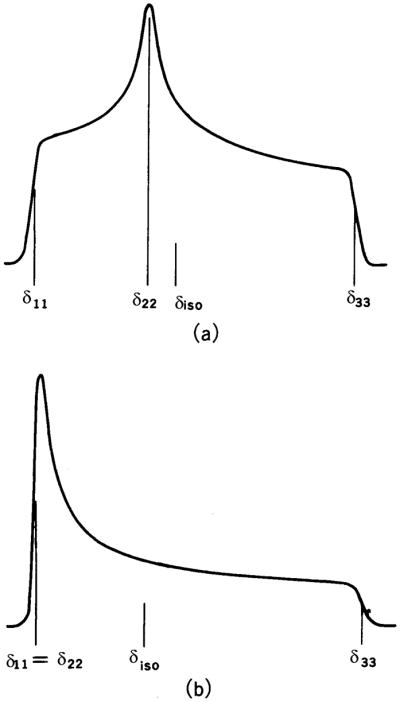
Powder pattern spectra for spin ½ nuclei. (a) axially asymmetric (δ11 ≠ δ22 ≠ δ33), (b) axially symmetric (δ11 = δ22 ≠ δ33). δiso = (1/3)(δ11 + δ22 + δ33).
The chemical shift of an nucleus depends on its electronic and molecular environment [2] and can be given in terms of various contributions by the following equation.
| (20) |
where σd is known as the diamagnetic term, σp the paramagnetic term, and σ′ is a term from neighbors which accounts for the magnetic anisotropy effect, polar effect, ring current effect, etc. Intrinsically, σ is a tensor quantity, from a theoretical point of view, which depends on its electronic and molecular environments [1,3,4,7]. Indeed, by placing the nucleus of interest and the zero point of the vector potential due to the external magnetic field at the origin, the contributions to σd and σp are given by:
| (21) |
where α and β are subscripts labeling the Cartesian components (x, y or z), μ0 is the vacuum permeablity, e is the elementary charge and m is the electron mass, rk is the position of the kth electron compared to the nucleus of interest. Lk is the corresponding orbital angular momentum operator, δαβ is the Kronecker delta function. |0> and |n> refer to the electronic ground and excited states of molecules with energies E0 and En, respectively.
The paramagnetic term in the case of a nucleus for 13C, 15N and 17O atoms having 2, 3 and 4 2p electrons considered here, in particular, is expressed as a function of excitation energy, bond order, and electron density according to the sum-over-states method in a simple form as follows [40]
| (22) |
where (Em − Em) the singlet-singlet excitation energy between the nth occupied orbital and the mth unoccupied orbital, and Qαβ is a factor including the bond order and the electron density. The quantity <r−3>2p is the spatial dimension for a 2p electron, and C is the coefficient incorporating the universal constants. The term σpαβ can be evaluated by a variety of molecular orbital calculations, such as semi-empirical, non-empirical, or ab initio MO methods. It should be noted that a quantum chemical calculation gives all nine chemical shielding tensor components of the CSA tensor. The isotropic chemical shielding constant is obtained as an average of the magnitudes of the three principal components of the chemical shielding tensor. The chemical shielding anisotropy, therefore, arises from the distortion from symmetry of the distribution of electrons around a nucleus in molecules in the presence of the applied magnetic field. Using these procedures, it is possible to calculate the chemical shielding tensor components of a nucleus in a molecule with any specified conformation.
As mentioned above, the CSA originates from a distortion from a spherical distribution of 2p electrons around a nucleus. Each of the three diagonal shielding tensor components is more sensitive to structural changes such as torsion angle and hydrogen bonding as compared to the average isotropic shielding constant. Also, the directions of the principal axes of the shielding tensor depend on the molecular structure. Therefore, the determination of the orientation of the principal axes in the molecular frame gives us detailed information about the molecular structure.
For atoms with 2p electrons such as 13C, 15N and 17O considered in polypeptides and proteins, the relative chemical shift is predominantly contributed by σp and is little contributed by σd and σ′. Thus, it is very important to estimate σp values with good precision for these nuclei. On the other hand, for a 1H nucleus the relative chemical shift is more significantly determined by contributions from σd and σ′ as compared to σp. The σd can be easily estimated from the calculated electron density. Using these procedures, one can calculate the chemical shift tensor components of a nucleus in a molecule with any specified conformation [41–54]. A negative sign of the chemical shielding constant σ indicates deshielding and so shielding variations can be compared with the observed chemical shift δ where a positive sign denotes deshielding.
1.2 Determination of CSA values
Several approaches have been proposed to determine CSA tensors: (1) static NMR measurements on a single crystal or an oriented liquid crystalline sample, (2) simulations of static powder pattern spectra obtained from polycrystalline samples, (3) analysis of spinning sidebands in MAS spectra obtained under slow-spinning conditions, (4) CSA recoupling procedures based on multidimensional, fast-spinning MAS NMR. All six CSA parameters, including the three principal values δ11, δ22 and δ33 and three direction cosines specifying the principal axis system, can be unambiguously determined by performing NMR experiments on single crystals. Some of direction cosines are also available from experimental measurements on uniaxially oriented samples. Further, relative orientations of such principal axes with respect to the 13C-15N bond axis can be also determined from [13C, 15N]-doubly labeled polycrystalline samples. In many cases, isotope enrichment by 13C, 15N and 17O nuclei is essential in order to determine reliable and precise CSA parameters.
1.2.1 Single crystal or aligned samples
The experimental procedures to determine CSA values from single crystals by a stepwise rotation of a sample holder attached to a goniometer are well documented [9,31,55]. Static NMR signals available from a single crystal in the laboratory frame as shown in Eq.(17) should be converted into the principal values (Eq. (18)) through transformations of coordinate frames: from laboratory frame → goniometer frame → crystal frame → principal axis frame. For this purpose, it is essential to have a prior knowledge of the 3D structure of the molecule under consideration in the crystal frame determined either by X-ray or neutron diffraction study. The magnitudes of the principal values and direction cosines can be determined by fitting the observed chemical shift frequencies, obtained by stepwise rotation of the direction of a crystalline sample relative to the applied magnetic field, to Eqs. (18) and (19).
Such analyses, however, can be more complicated for quadrupolar nuclei such as 17O (spin number 5/2), since the central (½↔−½) transition signal becomes broad by the second-order perturbation by the very large quadrupolar interaction [11]. The quadrupolar interaction (νQ) in addition to the chemical shift tensor interaction (νCS) is expressed by
| (23) |
where
| (24) |
| (25) |
| (26) |
| (27) |
| (28) |
Here, θ and φ are the polar and azimuthal angles, respectively, in the principal axes of the electric field gradient tensor, e2qQ/h is the quadrupolar coupling constant, and ηQ is the asymmetry factor of the electric field gradient defined by its principal components VXX, VYY and VZZz. Recording 17O spectra at the highest magnetic field currently available is essential in order to minimize the relative contributions of the quadrupolar interaction which is decreased at a higher field, as seen from the νQ2/nu;0 factor in Eq. (23). It is also important to measure static spectra at several magnetic field strengths, in order to determine the total eight parameters including the quadrupolar coupling constant and asymmetry factor ηQ.
Next, we are concerned with aligned samples. For example, orientation-dependent 15N and 13C solid-state static NMR spectra of [15N]- or [13C]-labeled silk fibroin fibers were observed when the fiber axis was arranged at various angles between 0° and 90° relative to the external magnetic field direction [56,57]. A 1D spectrum convoluted with 1H-15N dipolar coupling and 15N chemical shift interactions has been obtained from a [15N]Gly-collagen fiber with the fiber axis oriented parallel to the external magnetic field [58]. Orientation-dependent spectra of lipid bilayers are discussed below in Section 4.3.2.
1.2.2 Static powder pattern spectra
While static solid-state NMR measurements from a high quality single crystal are the best way of determining accurate CSA tensors, obtaining single crystals is extremely difficult and sometimes impossible for biological systems. In addition, a single crystal study is very time-consuming in spite of some fast approaches to reduce the number of experiments [59]. The three principal values alone, however, are available from the analysis of the powder pattern spectra (see Fig. 2). Following Eq. (19), the observed frequency of spectral lines can be expressed in terms of Euler angles (α, β) which relate the principal axes of the CSA tensor to the laboratory frame. As a result, δ11, δ22 and δ33 can be determined from the peak at δ22 of the divergence of the line-shape function and two edges at δ11 and δ33 of the shoulder [9,31]. More accurately, these parameters can be determined by line-shape analyses of the experimental spectra based on a treatment by Bloembergen and Rowland [60]; discussions about the line-shape analysis can be found in the literature [9,15,31].
It is possible to determine the orientation of a 15N or 13C CSA tensor in the molecular frame by measuring the correlated/convoluted chemical shift spectra with 13C-15N or 15N-1H dipolar interactions. Several studies have reported 15N and 13C CSA tensors of peptides and proteins selectively labeled with these isotopes [61–64]. For example, the orientation of the 15N chemical shift tensor relative to the molecular frame was determined from a polycrystalline L-[1-13C]alanyl-L-[15N]alanine sample using a 13C chemical shift spectrum convoluted with the 13C-15N dipolar coupling interaction. The reported angles are βCN = 106°, αCN = 5° and βNH = −19°, αNH = 12° [65].
1.2.3 Spinning side-band analysis
The free induction decay from a spinning sample having inhomogeneous anisotropic interactions takes the form of a train of rotational spin echoes. The Fourier transform of these rotational spin echoes results in a spectrum with spinning side bands which contain information concerning the CSA. Maricq and Waugh [66] showed that the second (M2) and third (M3) moments [67] of such NMR spectra can be used to obtain the CSA from the side-band intensities. Thus,
| (29) |
| (30) |
Herzfeld and Berger showed that the principal CSA values can be derived from the intensities of a relatively small number of sidebands, based on general integral and series expansions for sideband intensities [68]. The expressions are evaluated for a wide range of shift parameters and the results are commonly used to construct graphical and numerical methods for extracting the principal values of chemical shift tensors from the intensities of just a few spinning sidebands. To accurately measure CSA parameters, Fenzke, et al.[69] developed an alternative approach to determine the principal values of a CSA tensor from MAS sideband intensities, in which one attempts to minimize the mean square deviation between the calculated and experimental sideband intensities. Another approach was proposed for the analysis of MAS NMR spectra which combines nonlinear and linear analytical procedures for fitting sideband spectra [70]. This method is particularly useful for the analysis of spectra with lower S/N ratio or overlapping lines.
The reliability of the determination of the anisotropy and the asymmetry parameter of the chemical shift interaction was calculated using the Cramér-Rao lower bounds [71]. Based on numerous studies, it is realized that CSA tensors can be more accurately determined from a spinning sample experiment than from a static experiment on a powder sample.
1.2.4 CSA recovery under MAS
While MAS averages CSA, a number of multidimensional separation and correlation techniques have been utilized to recover CSA interactions [15]. Magic angle hopping is a 2D technique which utilizes a mechanical device for rotating the sample in discrete 120° jumps, during the 120° jump time interval between the jumps with a “hop” about the magic angle axis, with the proton decoupling switched off during the “hop” period [72]. The CSA is averaged to zero by allowing the magnetization to evolve at three suitable orientations of the sample relative to the magnetic field. The static anisotropic pattern is observed in the detection period, after such an effective isotropic evolution. This technique was further modified by replacing the discrete magic angle hopping technique which requires special flip apparatus with a continuous slow MAS experiment, yielding similar result [73]. The sensitivity of this method (magic angle turning (MAT)) was increased by this modification due to acquisition of the full echo rather than only half of the echo. Alternatively, the switched-angle sample-spinning (SASS) method allows the 13C magnetization to evolve under the sample spinning at an off-magic-angle and under proton decoupling, and then makes measurements at the magic angle [74].
A phase corrected MAT (PHORMAT) technique has been developed to overcome the shortcomings of the previous version of the MAT experiment [75]. An excellent spectrum of methyl-α-D-glucopyranoside free of baseline artifact provided the principal values of 13C CSA with an accuracy comparable to the values obtained from a single crystal study. A complete separation of isotropic and anisotropic chemical shifts was established by a 2D MAS experiment, relying on the fact that the magnetization evolution under the TOSS sequence [76] can be reversed by the application of a “mirror image” sequence [77]. A 2D phase adjusted spinning sideband (PASS) method was developed to separate anisotropic and isotropic chemical shift interactions under MAS using sequences of five π pulses [78,79].
One revolutionary technique, polarization inversion spin exchange at magic angle (PISEMA), that correlates 15N CSA and 1H-15N dipolar coupling greately improves the resolution and sensitivity of separated-local-field (SLF) spectroscopy [61]. The PISEMA sequence was combined with the MAT technique, taking advantages of high-resolution and high-sensitivity of PISEMA and the ability to resolve isotropic resonances using MAT [62]. 1D magic-angle decoupling and magic-angle turning (MADMAT) NMR was also developed by combining the magic-angle rf decoupling in one time period and the MAT pulse sequence in another time period [63]. Application of the 1D dipolar-shift method under MAS was used to determine the 15N CSA and 1H-15N dipolar interaction tensors from a powder sample of a model peptide [64].
Another experiment was introduced to obtain undistorted CSA lineshape under MAS [80]. This utilizes the time dependence of the resonance frequency of an isolated spin under MAS ω (t) [66], which can be written as
| (31) |
Here, Ci(Ω) are coefficients that depend on the molecular orientation relative to the rotor axis Ω at time 0. For a stationary sample, the C1(Ω)+ C2(Ω) term gives rise to the usual CSA pattern. By means of four rotor-synchronized π pulses under fast MAS in a 2D experiment, the anisotropy effects of C1(Ω) and C2(Ω) are reintroduced with equal prefactors, while those of S1(Ω) and S2(Ω) remain equal to zero over a rotor period. This 2D iso-aniso experiment was further developed (and named as RAI, recoupling of anisotropy information) to produce the static chemical shift spectra in the indirect dimension and isotropic chemical shift spectra in the direct dimension [81,82]. This approach decreases the influence of finite pulse length effects in the original sequence by recoupling the CSA over three rotor periods instead of one. Then, it is even possible to use a spinning speed as fast as 10 kHz. Cogwheel (COG) phase-cycled, constant time, and optimized implementations of the CSA recoupling experiment demonstrated that the modifications give reliable, undistorted CSA powder patterns using a standard experimental hardware and methods [83]. The constant time (CT-2DCSA (COG)) variant was shown to give optimum lineshapes of the powder patterns while the optimized (OPT-2DCSA(COG)) version of the experiment maximized the signal-to-noise ratio as illustrated in Fig. 3.
Fig. 3.

F1 slices of the 13C resonance of carbonyl site of glycine extracted from the 100.56 MHz 2D spectra for (a) the conventional implementation of the 2DCSA experiment, (b) the 2DCSA(COG) implementation, (c) the OPT-2DCSA(COG) implementation, (d) the CT-2DCSA(COG) implementation, (e) a simulated powder pattern. Reproduced with permission from [83]. Copyright 2006 Elsevier.
No significant artifacts, with standard rf power levels and spinning speeds between 2.5 and 5 kHz, were observed using the SUPER (separation of undistorted powder patterns by effortless recoupling) approach [84] which utilizes 360° instead of 180° pulses in the above-mentioned iso-aniso 2D MAS experiment [80]. The SUPER method has been applied to samples containing various sp2- and sp3- hybridized carbon sites. A variant of this technique was proposed to recover the CSA by combining a pair of selective and non-selective π pulses to suppress the 13C-13C scalar and dipolar interactions [85]. Another approach was proposed for the recovery of CSA under MAS while retaining a static CSA powder pattern line shape and simultaneously attenuating homonuclear dipole–dipole interactions [86]. This was accomplished by a rotor-synchronized rf pulse sequence with symmetry properties that permit static CSA line shapes to be obtained by a pulse sequence called ROCSA Σrecoupling of chemical shift anisotropyΠ, with the scaling factors of 0.272 for CSA, and approximately 0.05 for homonuclear dipole–dipole interactions. Analysis of the CSA patterns in the Aβ11-15 (a 15-residue peptide fragment in which four amino-acid residues were uniformly 13C and 15N labeled) demonstrated the utility of ROCSA measurements for probing peptide conformations in noncrystalline solids, as illustrated for the Val residue of the peptide in Fig. 4.
Fig. 4.

13C ROCSA spectra for Val-18 of Aβ11– 25. The C′ spectrum was measured at νR=20 kHz and 9.39 T. The other spectra were measured at νR= 11 kHz and 14.09 T. Upper traces are experimental spectra. Lower traces are best-fit simulations for a one-spin system. Reproduced with permission from [86]. Copyright 2003 American Institute of Physics.
1.2.5 Solution NMR experiments
NMR signals split by CSA in the solid are time-averaged in solution by fast isotropic tumbling motions, yielding narrow spectral lines. Nonetheless, the CSA information is present in the individual isotropic signals through their nuclear spin relaxation times T1 or T2, especially when solution NMR spectra of globular proteins are examined at a high magnetic field when the contribution of the CSA relaxation mechanism becomes dominant as compared to that of the dipole-dipole interaction. Therefore, it is possible to retrieve CSA data from the spin-spin relaxation rates by careful examination of relaxation data available from solution NMR, as will be described in more detail in Section 3.3. For this reason, a prior knowledge of the magnitude of the CSA values in solution is essential to optimize the experimental condition to record high-resolution TROSY spectra for large proteins or protein complexes with a molecular weight of ~100 kDa [16–20].
1.2.6 Quantum chemical calculations
Quantum chemical methods have been used to calculate CSA tensors for nuclei in a variety of molecules. The accuracy of such calculated nuclear shielding constants and the orientations of the principal axes depends strongly on the quantum chemical calculations used, for example semiempircal, ab inito, or DFT (density functional theory) [40,47,50–52,87,88]. These calculations have proved to be very useful for providing insights into the underlying mechanism of nuclear shielding, including the dependence on molecular conformational changes and intermolecular interactions such as hydrogen bonding, even theough such calculations have long remained qualitative for prediction of the experimental data. Currently, more accurate data are available from ab initio Hartree-Fock theory using perturbation methods with the inclusion of the electronic correlation, or DFT theory [87,88]. Studies have shown that these calculations are useful in understanding the variation of CSA tensors from one molecule to another, and one amino acid residue to another in a given protein. Some of these studies are highlighted later in this review.
2. Isotropic chemical shifts
2.1 Referencing chemical shifts
A IUPAC recommendation proposed to delete the factor of 106 in Eq. (3), and to express the numerator in Hz and the denominator in MHz [7,89]. Tetramethylsilane (TMS) in dilute solution in organic solvents such as CDCl3 or 2,2-dimethylsilapentane-5-sulfonic acid (DSS) in aqueous solutions are commonly used as internal reference compounds for reporting 1H and 13C NMR spectra. Without significant differences in chemical shifts between these references, chemical shifts can also be given by “Ξ” which is defined as the resonance frequency in a magnetic field in which TMS has a resonance frequency of 100.0 MHz,
| (32) |
The data, however, must be reported to eight or nine significant figures as shown in Table 1 and therefore it is cumbersome for discussion. Hence, chemical shifts of any nuclei are commonly expressed relative to secondary references by the δ scale as discussed above. It should be taken into account, however, that 13C chemical shifts based on DSS and TMS differ by about 2 ppm, which can cause confusion if not clarified [4].
Table 1.
Alternative secondary references
| Isotope | Recommended secondary references | Alternative secondary references | ||||
|---|---|---|---|---|---|---|
| Reference compound | Sample conditions | NMR Frequency Ξ/% | Reference compound | Sample conditions | NMR Frequency Ξ/% | |
| 1H | DSS | Internal | 100.000 000 |
TMSa | Internal | 100.000 000 |
| 2H | DSS | Internal | 15.350 608 |
TMSa | Internal | 15.350 609 |
| 13C | DSS | Internal | 25.144 953 |
TMSa | Internal | 25.145 020 |
| 31P | (CH3O3)PO | Internal | 40.480 864 |
H3PO4 (85%) | External | 40.480 742 |
| 15N | NH3(liquid) | External | 10.132 912 |
CH3NO2 | External | 10.136 767 |
| 15N | [(CH3)4N]I | Internal | 10.133 356 |
|||
| 14N | [(CH3)4N]I | Internal | 7.223 885 |
CH3NO2 | External | 7.226 717 |
Volume fraction 1% in CDCl3
0.075M in DMSO-d6
Reproduced from R. K. Harris, E. D. Becker, S. M. C. de Menezes, R. Goodfellow, F. Granger, Pure Appl Chem. 73 (2001) 1795–1918
In contrast, reporting 13C chemical shifts obtained from high-resolution solid-state NMR is more complicated as compared to solution NMR results based on an internal reference, because referencing for solids is usually done by a substitution method using a secondary reference compound, such as the carboxyl peak of glycine (176.03 ppm from neat TMS) or CH2 carbon of adamantine (29.50 ppm from the high-field doublet from a neat TMS). Chemical shifts with respect to other reference systems such as TMS in a sealed capillary of 1% CDCl3 solution or DSS should be compared with the data after subtracting or adding the correction factors given in Table 2 [90]. The following conversion scheme has also been proposed [91]:
| (33) |
Table 2.
Correction of 13C chemical shifts primarily referenced to glycine or adamatane (italic) and then secondarily referenced to TMS or DSS (ppm)
| Standard reference | Primary reference (with reference to the respective standard reference) | Chemical-shift correctiona | ||
|---|---|---|---|---|
| Glycine C=O | Adamantane Low field | Adamantane High field | ||
| TMS neat | 176.03 | 38.04 | 29.00 | 0 |
| TMS neat | 38.5 | 29.5 | −0.5 | |
| TMS 1% CDCl3 | 37.8 | 28.8 | +0.2 | |
| DSS solid | 38.1 | 29.1 | −0.1 | |
| 5% D2O | 40.4 | 31. 4 | −2.4 | |
| 1% D2O | 40.6 | 31.5 | −2.5 | |
Chemical shifts were calibrated by the peak position expressed by italic as the primary reference. Chemical shift correction should be made to compare the data based on different reference system to each other, after adding or subtracting “chemical shift correction”. Reproduced with permission from [90].
In order to retrieve any meaningful results from experimental data, a careful check on the reference system is also essential. Here we have dropped the label ‘iso’ on δ when isotropic terms alone are concerned.
2. 2 Isotropic chemical shifts
2.2.1 13C chemical shifts
In the solid-state, displacements of 13C NMR peaks as large as 8 ppm are noticed between different conformations in polysaccharides, polypeptides, proteins and several types of ionophores [22–24]. Even though the magnitude of these displacements is still small compared with the total chemical shift spread of 200 ppm, it is sufficiently large to provide a convenient intrinsic probe for conformational characterization. In particular, 13C chemical shifts of the backbone Cα and C=O, as well as the side-chain Cβ signals, are significantly displaced for a variety of amino acid residues in polypeptides, depending on their local conformation such as α-helix, β-sheet, 31 helix, silk I, collagen type triple helix, random coil, etc [22–24,92–101]: the Cα and C=O 13C chemical shifts of all residues in an α-helix are displaced downfield by 3.5–8.0 ppm with respect to those of a (antiparallel) β-sheet form, while the Cβ shifts in an α-helix are displaced upfield by 3.4–5.2 ppm with respect to those of a β-sheet, as summarized in Table 3 (referenced to neat TMS, through the chemical shift of C=O carbonyl peak of Gly). The transferability of these parameters for particular residues, from simple model peptides to more complicated proteins, has proved to be an excellent diagnostic means of determining local conformations of specific amino acid residues in proteins such as silk fibroin [102, 103], collagen [104–106] and transmembrane peptides [107]. This is a consequence of a dominant contribution from the paramagnetic term of the shielding constant in Eq. (21).
Table 3.
13C chemical shifts characteristic of the α-helix, β-sheet and random coil forms (ppm from TMS)
| Amino acid Residues in Polypeptides | Cα |
Cβ |
C=O |
|||||||||
|---|---|---|---|---|---|---|---|---|---|---|---|---|
| α-helix | β-sheet | random coilb | Δa | α-helix | β-sheet | random coilb | Δa | α-helix | β-sheet | random coilb | Δa | |
| Ala | 52.4 | 48.2 | 51.1 | 4.2 | 14.9 | 19.9 | 15.7 | −5.0 | 176.4 | 171.8 | 176.1 | 4.6 |
| 52.3 | 48.7 | 3.6 | 14.8 | 20.0 | −5.2 | 176.2 | 171.6 | 4.6 | ||||
| 52.8 | 49.3 | 3.5 | 15.5 | 20.3 | −4.8 | 176.8 | 172.2 | 4.6 | ||||
| Leu | 55.7 | 50.5 | 55.2 | 5.2 | 39.5 | 43.3 | 39.7 | −3.8 (4.1) | 175.7 | 170.5 | 175.7 | 5.2 |
| 55.8 | 51.2 | 4.6 | 43.7c | 39.6 | 175.8 | 171.3 | 4.5 | |||||
| Val | 65.5 | 58.4 | 61.2 | 7.1 | 28.7 | 32.4 | 31.7 | −3.7 | 174.9 | 171.8 | 174.4 | 3.1 |
| 58.2 | 32.4 | 171.5 | ||||||||||
| Ile | 63.9 | 57.8 | 61.1 | 6.1 | 34.8 | 39.4 | 37.1 | −4.6 | 174.9 | 172.7 | 175.8 | 2.2 |
| 57.1 | 33.1 | 171.0 | ||||||||||
| Glu(OBzl) | 56.4 | 51.2 | 5.2 | 25.6 | 29.0 | −3.4 | 175.6 | 171.0 | 4.6 | |||
| 56.8 | 51.1 | 5.7 | 25.9 | 29.7 | −3.8 | 175.4 | 172.2 | 3.2 | ||||
| Asp(OPBzl) | 53.4 | 49.2 | 4.2 | 33.8 | 38.1 | −4.3 | 174.9 | 169.8 | 5.1 | |||
| 53.6d | 34.2d | 174.9 | ||||||||||
| Lyse | 57.4 | 29.9 | 176.5 | |||||||||
| Lys (Z) | 57.6 | 51.4 | 6.2 | 29.3 | 28.5 | −0.8 | 175.7 | 170.4 | 5.3 | |||
| Arge | 57.1 | 28.9 | 176.8 | |||||||||
| Phe | 61.3 | 53.2 | 8.1 | 35.0 | 39.3 | −4.3 | 175.2 | 169.0 | 6.2 | |||
| Met | 57.2 | 52.2 | 5.0 | 30.2 | 34.8 | −4.6 | 175.1 | 170.6 | 4.5 | |||
| Gly | 43.2 | 168.4 | ||||||||||
| 44.3 | 169.2 | |||||||||||
| 171.6f | 168.5 | 3.1 | ||||||||||
Difference in the 13C chemical shifts of the α-helix form relative to those of the β-sheet form.
in CF3COOH solution. A few drops of H2SO4 were added in the cases of (Ile)n and (Leu)n
This assignment should be reversed.
Erroneously assigned from the left-handed α-helix.
Data taken from the data of salt-induced α-helix in neutral aqueous solution
Averaged values from the data of polypeptides containing 13C-labeled glycine residues.
Reproduced with permission from [24]
The 13C chemical shift peaks of polypeptides, involved in a random coil form in CF3COOH or aqueous solution, always appear between the peaks of α-helix and β-sheet conformations, as a consequence of time-averaging of the shifts of the allowed conformations. In some instances, however, the 13C chemical shifts of the α-helix are very close to those of a random coil as encountered for Ala and Leu residues (Table 3). This is also the case for a variety of membrane proteins, for instance, [3-13C]Ala-labeled bacteriorhodopsin (bR) in which an α-helical Ala Cβ from the flexible C-terminal region resonates at the lowest boundary position accidentally overlapped at the frequency typical of a random coil [24,108]. Even in such cases, a distinction between α-helix and random coil peaks can be made, by taking into account that the signal from the α-helix under consideration can be recorded only by a CPMAS experiment in the presence of persistent C-H dipolar interactions, but the peak from random coil can be obtained by either solution NMR or by DD (direct-detection or dipolar-decoupled, without cross-polarization) MAS because of averaged such dipolar interactions. Even though the antiparallel structure is known as the major form in the β-sheet form, the parallel β-sheet form [109,110] plays an important role in the secondary structure of amyloid peptides [111] and silk fibroin from S.c.ricini [112]. In reflecting the presence of different types of hydrogen bonding between the two types of β-sheet forms, more wide spread of Ala Cβ 13C chemical shifts (16.1–22.8 ppm, with reference to a neat TMS) in N- and C-terminal Ala residues in a parallel β-sheet (Ala)3 and (Ala)4, as confirmed by X-ray diffraction studies, turned out to be an excellent means to distinguish the types of both conformations as compared with those of an antiparallel form (18.9–21.1 ppm) [112]. Consequently, the 13C chemical shifts as measured in the solid-state with reference to those from model polypeptides in Table 3 and parallel β-sheet form turned out to be a very valuable means as intrinsic probes to determine the secondary structure of peptides and proteins, irrespective of neighboring amino acid residues.
Further, it is interesting to note that carbonyl 13C chemical shifts (C′) in peptides and proteins are also related to the nature of participating hydrogen bonds. In particular, it was empirically shown that the observed isotropic 13C′ chemical shifts in Gly, Ala, Leu, Val and Asp residues move linearly downfield with a decrease in the hydrogen-bonding length RN…O, according to Eq. (34) [113–115],
| (34) |
where a and b are 206.0 (ppm) and 12.4 (ppm/Å) for Gly residue, 237.5 (ppm) and 21.7 (ppm/Å) for Ala residue, 215.4 (ppm) and 14.2(ppm/Å) for Val residue, 202.2 (ppm) and 10.0 (ppm/Å) for Leu residue, and 199.0 (ppm) and 9.6 (ppm/Å), respectively. Alternatively, the RN…O values of some polypeptides in the crystalline state can be evaluated by these relations from the observed amide C′ chemical shifts.
The above-mentioned conformation-depence of 13C chemical shifts in polypeptides or proteins has been explained theoretically by calculation of the 13C shielding constants of Ala fragment (N-acetyl-N′-methyl-L-alanine amide; Ac-L-Ala-NHMe) as a function of the torsion angles (dihedral angles) (φ, ψ) by means of the FPT-INDO method [41]. The 13C chemical shift for the Ala Cβ carbon, for instance, in any specified conformation can be found from the calculated contour map of the shielding constant as illustrated in Fig. 5 [41]. These calculations verified that 13C chemical shifts of Ala residues in polypeptides and proteins vary with conformation and can be utilized as convenient probes for predicting conformation. However, for the interpretation of Cα and C=O 13C chemical shifts, however, it turned out to be essential to include hydrogen bonds at N-H and C=O in addition to the effects of the torsion angles, although the Cβ chemical shift is not affected by such hydrogen bonds. Instead of this fragment approach, calculation of Cα, Cβ and C=O 13C chemical shifts of (Gly)n, (Ala)n, and (β-benzyl-L-Asp)n, have been made which take tight-binding MO theory suitable for treating infinite molecular chain into account of the infinite chain-length of peptides including appropriate intramolecular hydrogen bond network and these are consistent with the experimental data [116,117]. Consistent results were further obtained by more elaborate calculations of 13C chemical shifts for Ac-L-Ala-NHMe and Ac-Gly-NHMe on the basis of ab initio MO approaches [43,44,117,118].
Fig 5.

The calculated 13C chemical shift (shielding constant) map of the Cβ carbon of N-acetyl-N′-methyl-L-alanine amide obtained by using the FPT-INDO method. The chemical shielding constants were calculated at 15° intervals for the torsion angles (φ, ψ). Reproduced with permission from [41]. Copyright 1984 American Chemical Society.
Average 13C chemical shifts obtained by multidimensional solution NMR experiments for Cα and C=O carbons of all 20 amino acid residues taking α-helix, β-sheet and random coil forms have been reported [25,120]. Both the 13C resonances experience downfield shifts in the α-helix and upfield shifts in the β-sheet forms with respect to those in a random coil. Solution NMR structural studies have extended this approach to formulate a chemical shift index (CSI) to identify the secondary structure of proteins [28,121,122]. This method can be thought of as a filtration procedure to separate out spurious chemical shift signals, by assigning an index value of +1, 0, or −1 for the α-helix, random coil and β-sheet structures, respectively. The CSI values which are graphically represented against the amino acid sequence were originally developed for the analysis of Hα signals and extended to include 13Cα, 13Cβ and 13C=O chemical shifts to identify and locate the secondary structure of proteins without recourse to NOE measurements by utilizing these four independent chemical shift measurements [122]. For example, the secondary structure of the first 65 residues of interleukin 4 experimentally determined by the CSI values are consistent with the secondary structure determined by X-ray and NOE data, as depicted by the arrows (β-strand) and coils (helices) in Fig. 6 [28].
Fig. 6.

Chemical shift index plotted for the first 65 residues of interleukin 4 using assignments supplied by Powers et al. [123]. (a) Hα, (b) Cα, and (c) carbonyl resonances. Reproduced with permission from [28]. Copyright 1994 Elsevier.
13C chemical shifts of the Cα and Cβ carbons of individual residues can be used to obtain the corresponding torsion angles φ and ψ of the peptide unit, whose values available from high-resolution x-ray diffraction studies in which their 3D structures have been resolved at 1.0–2.2 Å [25]. Average secondary shifts of (Δ (φ, ψ)) as a function of the torsion angles (φ, ψ) were calculated by convolution of each of the deviation from random coil chemical shift as a secondary shift of residue k, δ (φk, ψk), with a Gaussian function
| (35) |
Plots of these functions for Cα and Cβ signals are illustrated in Fig. 7 (A and B, respectively), together with histograms of secondary shift distribution in α-helix and β-sheet forms (C). This is consistent with the data obtained from polypeptides in the solid-state as summarized in Table 3 and in Fig. 5. An extensive database of Cα and Cβ chemical shifts of proteins in solution has been generated, for which high-resolution crystal structures exist and they have been shown to be essentially identical to the solution structures [124]. The effects of backbone dihedral angles, side-chain dihedral angle χ1 and hydrogen bonding on the Cα and Cβ chemical shifts were analyzed. These chemical shift data, together with those of 15N and 1H chemical shifts, are currently utilized as most important structural restraints for 3D construction as discussed in Section 4. 1.
Fig. 7.
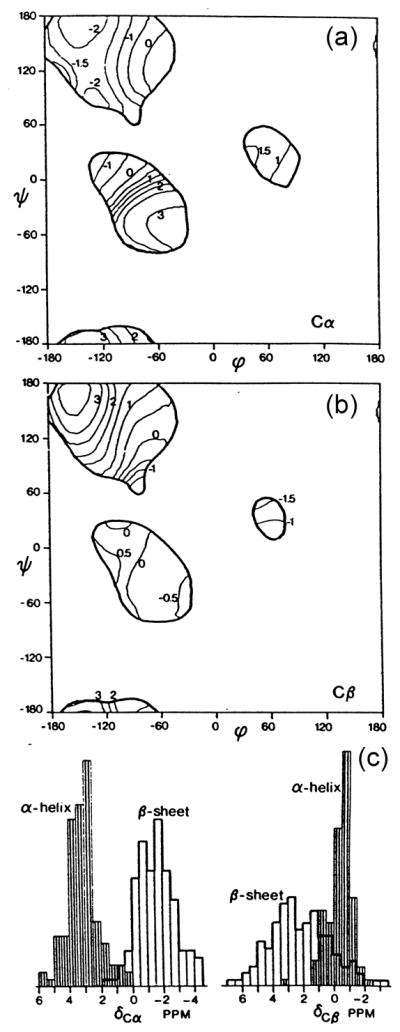
Contour plots of the average secondary shift Δ(φ, ψ) of (a) Cα and (b) Cβ resonances and histogram (c) of secondary shift distributionin α-helix and β-sheet form. Reproduced with permission from [25]. Copyright 1991 American Chemical Society.
2.2.2 15N chemical shifts
It was also anticipated that amide-15N chemical shifts of polypeptides and proteins would also be sensitive to their secondary structures. In studies of 15N-labeled homo- and copolypeptides in the solid-state [30, 125–127], the conformation-dependency of 15N chemical shifts is found be not so simple as compared to the above-mentioned 13C chemical shifts, because 15N chemical shifts depend mainly on the conformation and side-chain structure of an individual amino acid residue [30]. In fact, the amide-15N signals of α-helial homopolypeptides (97.0–99.2 ppm) are found at a higher field than that of the β-sheet conformation (99.5–107.0 ppm), as demonstrated in Fig. 8, consistent with the isotropic and δ22 component of the 15N shielding map calculated for poly(β-benzyl L-aspartate) [128]. The δ22 component of the 15N shielding tensor, which lies perpendicular to the H-N-C plane as illustrated in Fig. 10 for the amide-15N nuclei, can be utilized as a good parameter for distinguishing α-helix and β-sheet conformations. In Fig. 8, 15N chemical shifts of other conformations including forms I and II of (Pro)n [PP] and (Gly)n [PG], αL (left-handed α-helix) and ωL (omega) helix are also included. It is also noted that the 15N chemical shifts of the β-sheet form of Leu, Val or Ile residues with alkyl side-chains appear at a lower field than that of an Ala residue, while the 15N chemical shifts of the β-sheet forms of Asp(OBzl), Glu(OBzl) or Glu(OMe) residues appear at higher fields than that of an Ala residue. In fact, 15N chemical shifts are strongly influenced by the side-chain bulkiness of residue i-1 affecting the backbone 15N shift of the ith residue [30].
Fig. 8.

The diagram of the observed isotropic 15N chemical shifts of some homopolypeptides (X)n with various conformations [α-helix, β-sheet, αL-helix, ωL-helix, (Gly)n I (PGI), (Gly)n II (PGII), (Pro)n I (PPI) and (Pro)n II (PPII) forms]. Reproduced with permission from [30]. Copyright 1993 Elsevier.
Fig. 10.

Correlation between the 15N chemical shift for protonated 6-s-trans-retinal Schiff bases (SB) and the counterion strength measurd by 1/d2, where d is the center-center distance between the SB nitrogen and the counterion. Reproduced with permission from [144]. Copyright 1997 American Chemical Society.
In a similar manner, a 3–4 ppm difference in amide-15N chemical shift was observed between the α-helix and β-sheet residues from various globular proteins in aqueous solution [118]. In relation to the neighboring effect as described above, an empirical correlation between 15N chemical shifts, in BPTI and apamin, and the torsion angle of the preceding residue ψi−1 was proposed for the β-sheet residues [129]. Empirical correlation between 15N chemical shifts and the torsion angles φi and ψi−1 was searched for a variety of proteins with known 3D structures [130]: on average, the rms error between experiment and prediction is about 3.5 ppm, although results for Thr, Val and Ile residues are worse (~4.8 ppm). Ab initio calculations were performed for several peptide fragments in order to estimate the contributions to 15N chemical shifts of peptide residues such as the torsion angles (φi−1, ψi−1 φi, ψi and χ1) and hydrogen bond [43,131]. It was shown that the two backbone torsion angles closest to the peptide group (ψi−1 and φi) have the largest effects up to 20 ppm on 15N chemical sifts. The adjacent (preceding) torsion angles φi−1 and ψi have a smaller contribution up to 8 ppm. Different side chain conformations produced chemical shift variations of only 4 ppm [131].
Further, it should be taken into account that 15N chemical shifts are very sensitive to the nature of hydrogen bonding: the 15N signal of a proton donor (N-H) is displaced downfield by about 15 ppm, while the 15N shift of a proton acceptor (tertiary nitrogen atom) is shifted upfield by about 20 ppm [132–136]. Therefore, displacement of 15N chemical shifts arising from hydrogen bonds may surpass the effect due to the above-mentioned conformational changes. In addition to the isotropic 15N chemical shifts, the three principal tensor components were measured for Gly residue in a variety of peptides with a terminal Boc group in order to clarify the relationship between the 15N shifts and RN..O distances: the isotropic 15N chemical shifts (δiso of the glycine residues move downfield with a decrease of hydrogen bond lengths (RN…O) between the nitrogen and oxygen atoms in the amide groups, and that the pricipal value of δ33 moves linearly downfield with a decrease of RN…O. There is no relationship, however, between the principal value of σ11 or σ12 and RN…O, although the decrease of the N-H bond length (RN-H) leads to a linear increase in the 15N chemical shift value [137,138]. Nevertheless, Gly N-H 15N chemical shifts of collagen (Gly-Xaa-Yaa repeating units) and its model polypeptides [(Pro-Ala-Gly)n or (Pro-Pro-Gly)10] were found to be very sensitive probes for locating the interchain (Gly)N-H..O=C (Xaa or Pro) hydrogen bond which is believed to be essential for the stabilization of the coiled-coil triple-helix conformation [139]. In particular, the 15N peak of the Gly N-H group and the high-field (low-frequency) shoulder peak of Pro nitrogen signals in (Pro-Pro-Gly)10 are shifted downfield (4.9 ppm and 6.8 ppm, respectively) with increasing relative humidity by forming N-H … O = C hydrogen bonds, while the corresponding peaks for collagen and (Pro-Ala-Gly)n are unchanged and close to the 15N chemical shift of (Pro-Pro-Gly)10 in the hydrated state. For establishment of the above-mentioned relationship between the 15N chemical shifts and RN..O distances, it is more preferable to use the tensor component δ33 (approximately, parallel to the C-N bond) (see Fig. 9) rather than the isotropic peak [140]. In addition, the N–H bond lengths determined from the N–H dipolar interaction, when the amplitude of a thermal vibration of N–H moiety is significantly enhanced as encountered for weakly hydrogen bonded systems. This means that special care should be exercised when one uses the NMR-derived N–H distances involved in different types of hydrogen bonded systems as parameters for characterizing hydrogen bonded systems.
Fig. 9.

Orientations of the principal axes for the 13C, 17O, 15N and 1H CSA tensors for an amide fragment. The most shielded component δ33 for the 13C and 17O tensors is located perpendicular to the peptide plane. The δ22 and δ11 components for the 15N and 1H Tensors, respectively, are also located perpendicular to the peptide plane.
Naturally, the 15N chemical shift is also strongly affected by electrostatic interactions such as effects of electronic charge or counter ion in the vicinity of the nitrogen atom under consideration [135,136]. Thus, the 15N chemical shift of the Schiff base nitrogen in retinylidenes bacteriorhodopsin can be used to identification and detailed characterization of individual photo intermediates [141–145]. The frequencies of the maximum visible absorbance and the 15N chemical shifts of the 13-cis and all trans retinylidene compounds are found to be linearly related to the strength of the protonated Schiff base (pSB)-counterion (CI) interaction as measured by (1/d2), where d is the center-to-center distance between the pSB and the CI, as illustrated in Fig. 10 [143]. With these calibrations, d = 4.0, 3.9, 3.7, 3.6 and 3.8 Å (±0.3Å) distances were estimated for the J625, K590, L550, N520 and bR555 states for 13-cis-compounds of bR, respectively. These distances are comparable with similarly determined values of about 4.16 Å ± 0.03 Å and 4.66 Å ± 0.04 Å for the all-trans bR568 and O640 states, respectively. The effective SB counter ion distance in regenerated bovine rhodopsin expressed by using suspension cultures of HEK293S cells was estimated by means of 15N chemical shift consideration using the empirical relationship as shown in Fig. 10 [146].
2.2.3 1H chemical shifts
Conformation-dependent 1H chemical shifts, if any, can be caused by the last term in Eq. (21), consisting of neighboring group effects such as magnetic anisotropy, hydrogen bonding, electric field effects, etc. An attempt to evaluate such effects from protein data of known 3D structures showed that Hα protons in the β-sheet regions experience downfield secondary shifts, whereas Hα protons in α-helix regions experience upfield secondary shifts with respect to those of the random coil form. Correlations between the chemical shifts of amide and Cα protons and the length of hydrogen bonds formed by these groups have been made [119,147–152]. The existence of such close correlations between 1H chemical shifts and local secondary structure has been recognized for a variety of proteins of known 3D structures as demonstrated in Fig. 11 [118]. Semi-empirical quantum chemical calculations have been made in attempts to evaluate the contribution of the magnetic anisotropy and electric field effects besides the diamagnetic shielding to 1H chemical shifts of α-helical polypeptide (initially for (Ala)n) and the calculated chemical shifts agree fairly well with the observed values [150]. An empirical analysis of proton chemical shifts referenced to the chemical shift values in random coil protein from a variety of proteins of known structure [151–155] was made to decompose the last term in Eq. (21) into the following contributions:
| (36) |
where the individual terms are contributions from aromatic ring currents, magnetic anisotropy effects from the peptide groups, electric fields from distant polar groups which can polarize the C-H bond, and solvent effects, respectively. The term for the ring current contributions in [155] is
Fig. 11.

Distribution of α-proton chemical shifts in helices and β-strands. The black vertical bar indicates the median chemical shift. Reproduced with permission from [26]. Copyright 1991 Elsevier.
| (37) |
where r is the vector from the observed proton to the aromatic ring, G(r) is a geometric factor, and i and B are constants [156]. The magnetic anisotropy contribution is given by [157]
| (38) |
where L0 is the Avogadro constant, R is the distance from the proton to the amide group which has the magnetic anisotropy Δχ = −5.1 ±0.6 × 10⁻⁶erg/(G2mol) (formamide) [158]. The term for the electrostatic contribution is
| (39) |
based on the charge model from the CHARMM (version 19) parameters. The parameter fitting of chemical shifts for 5678 protons bonded to carbon into these classical contributions yielded a linear correlation coefficient of 0.88 between calculated and observed structural shifts, with a root mean square error of 0.23 ppm: contributions from the peptide group are especially noticeable for protons at the Cα, although predictions for protons bonded to nitrogen are much worse [152]. Various models for calculating the above-mentioned contributions have been compared [159] and also their relative proportions as illustrated in Fig. 12. The success of such an empirical treatment of 1H chemical shifts of a variety of proteins from the database is promising and further extends to the base of chemical shift restraints for revealing unknown 3D structures of proteins.
Fig. 12.

Comparison of calculated and observed Hα secondary structure shifts. (a) ring current only, (b) magnetic anisotropy only, (c) electric field only, (d) ring current plus magnetic anisotropy, (e) using all three. Values for ubiquitin, turkey ovomucoid third domain, human lysozyme and BTPI are plotted. Reproduced with permission from [159]. Copyright 1991 Elsevier.
As compared with 13C and 15N NMR spectra, recording 1H NMR spectra of polypeptides and proteins in the solid-state is not an easy task because of the large line broadening caused by dipolar interactions among dense 1H spins. Nevertheless, it was shown that Hα 1H NMR signals of the β-sheet form of (Ala)n and (Leu)n resonate downfield as compared to their signals from the α-helical form as recorded by a combined rotational and multipulse spectroscopy (CRAMPS) method [160,161], consistent with the data from proteins in aqueous solution. Well-resolved N-H proton signals in solid-state are observed either by CRAMPS of 15N-labeled polypeptides [162] or high field/fast MAS measurements [163–165], in order to avoid 14N-1H dipolar splitting caused by the effect of the 14N quadrupole coupling [166]. The measured 1H chemical shift values (δiso) of hydrogen-bonded Gly amide-protons of Gly-containing peptides and polyglycines in the solid-state have been plotted against the hydrogen-bond lengths between amide nitrogen and oxygen atoms (RN…O) determined by X-ray diffraction studies, as illustrated in Fig. 13 [164]. The bars indicate the experimental errors in the spectra. It was found that as RN…O is decreased from 3.12 to 2.72 Å, the amide-1H chemical shift moves downfield by 2.46 ppm from 7.76 to 9.04 ppm. Well-resolved 1H NMR signals including those of amide-NHs were observed for antiparallel and parallel alanine tripeptide (Ala)3 by high-field (930 MHz) MAS (20 kHz) NMR [165]. In particular, amide-NH and NH3+ 1H NMR signals of parallel (Ala)3 were well resolved at 7.5 and 8.9 ppm, respectively, whereas amide-NH and NH3+ signals of antiparallel (Ala)3 resonated at the same frequency (9.5 ppm) which is at lower field than that of the parallel peptide. In a similar manner, amide-15NH signals of antiparallel (Ala)3 resonate at a lower field by 2 to 5 ppm than those of parallel (Ala)3, although the 15NH3+ signal of the former resonates at the peak-position between the two 15N peaks of the latter. These findings based on the 1H and 15N hydrogen bond shifts are consistent with the relative hydrogen bond lengths of inter-strand N-H..O=C bonds as evaluated by x-ray diffraction studies, and are also consistent with DFT calculations for antiparallel and parallel (Ala)3 [165].
Fig. 13.

Plots of the observed 1H chemical shift values (δ) of hydrogen-bonded Gly amide protons of Gly-containing peptides and polyglycines in the solid against the hydrogen bond lengths between amide nitrogen and oxygen atoms (RN…O). Reproduced with permission from [164]. Copyright 2002 Elsevier.
The 1H chemical shielding calculations of hydrogen-bonded Gly amide-protons of two hydrogen-bonded GlyGly molecules have been made using the Gaussian 96 HF program with ab initio 6-31G** basis set by changes of RN…O from 3.5 to 2.6 Å as referred to its crystal structure determined by X-ray diffraction. The calculated chemical shifts move to downfield by 2.5 ppm from 6.9 to 9.4 ppm as RN…O is decreased from 3.30 to 2.72 Å [167].
2.2.4 Chemical shifts can provide torsion angles
Incorporation of both 1H and 13C chemical shift as additional restraints into the refinement of protein structures using the simulated annealing protocol with NOE and J coupling data has been achieved [168,169]. An approach to obtain the most probable φ and ψ angles from multidimensional hypersurface correlations of backbone chemical shifts (13Cα, 13Cβ, 1Hα, 1HN and 15N) of a given residue with its backbone torsion angles was proposed [170]. It was claimed that this information considerably improves the structural quality when used for cases where only a very small number of NOE restraints is available. Indeed, the use of chemical shifts is now recognized as important tool in understanding, generating or refining macromolecular structures: chemical shift refinement options are now available in the simulated annealing protocols, AMBER, XPLOR, and CNS [171]. To this end, a computer program (SHIFTY) was developed to accurately and automatically predict the 1H and 13C chemical shifts of unassigned proteins on the basis of sequential homology of proteins against the database from BioMagResBank [172].
A hybrid approach, [called TALOS (Torsion Angle Likelihood Obtaiend from Shifts and sequence similarity), http://spin.nidak.nih.ov/bax], which searches a database for triplets of adjacent residues with secondary chemical shifts and sequence similarity, in order to provide the best match to the query triplet of interest to predict the most likely backbone angles for a given residue of unknown structure [173]. For each query triplet of consecutive residues, the similarity to a triplet with center-residue j in the database is evaluated by computing a similarity factor, S(i, j) given by:
| (40) |
and the value of S(i,j) is evaluated for all triplets j in the database. Δδ denotes the secondary shifts of the 13Cα, 13Cβ, 13C′, 1Hα and 15N nuclei. Using the empirical weighting factors k0n through k5n values and the residue similarity factors ΔResType, the values of S(i,j) typically range from 5 to 600. As demonstrated in Fig. 14 for comparison of the torsion angles between predicted and observed values in the crystal structure, it appears that the accuracy of the TALOS prediction exceeds that of even some of the best solution structures calculated on the basis of NOEs and J coupling [173]. Alternatively, a computer program (SHIFTX, http://redpoll.pharmacy.ualberta.ca) uses a hybrid predictive approach that employs precalculated, empirically derived chemical shift hypersurfaces in combination with classical or semi-classical equations (for ring current, electric field, hydrogen bond and solvent effects) to calculate 1H, 13C and 15N chemical shifts from atomic coordinates [174]. Data mining techniques were used to extract the largest pairwise contributor (from a list of ~20 derived geometric, sequential and structural parameters) to generate the necessary hypersurfaces which capture dihedral angle, sidechain orientation, secondary structure and nearest neighbor effects. The program was able to attain a correlation coefficient (r) between observed and calculated shifts of 0.911 (1Hα), 0.980 (13Cα), 0.996 (13Cβ), 0.863(13CO), 0.909 (15N), 0.741 (1HN), and 0.907 (sidechain 1H) with RMS errors of 0.23, 0.98, 1.10, 1.16,2.43, 0.49 and 0.30 ppm, respectively. A TALOS-like database searching procedure, which utilizes both the protein sequence and the structural homology, was used after the inclusion of the nearest neighbor, ring current, and hydrogen bond effects to predict the backbone 15N, 1HN, 1Hα, 13Cα, 13Cβ and 13C′ chemical shifts for a protein of known structure, as a computer program SPARTA (Shift Prediction from Analogy in Residue type and Torsion angle) [175]. The predicted and experimental shifts were shown with a standard deviation of 2.52, 0.51, 0.27, 0.98, 1.07 and 1.08 ppm for 15N, 1HN, 1Hα, 13Cα, 13Cβ and 13C′, respectively.
Fig. 14.

Plots of the backbone angles (a) φ, and (b) ψ predicted by TALOS, versus those observed in the crystal structure for ubiquitin. Reproduced with permission from [173]. Copyright 1999 Springer.
The following three computer packages that are currently available on the internet are useful for protein structure determination using chemical shifts: CHESHIRE (CHEmical Shift Restraints) [176], CS-ROSETTA [177], and CS23D (Chemical Shift to 3D structure) [178].
3 Anisotropic chemical shifts
3.1 CSAs of nuclei in peptides and proteins
It is expected that CSA tensors can provide insights into the local secondary structure and dynamics for individual residues in peptides and proteins, as well as their inter-residual besides their inter-residual interactions through N-H..O=C hydrogen bond networks. Both principal components and orientations of CSA tensors are straightforwardly obtained in the solid-state, as described in section 1.2. The orientation information can also be derived from polycrystalline samples through the interactions between X CSA and X-Y dipolar tensors, where spins X and Y are dipolar coupled.
3.1.1 13C CSA
The Gly 13C′ principal values (δ11, δ22 and δ33 for 13C′ nucluei in Gly and their orientations for several single crystalline [179,180] and polycrystalline [42,113,181,182] peptides reported in the literature are summarized in Table 4. The frequency values of many of the principal components are converted and reported with reference to TMS. These values span a wide range of 242–88 ppm. It is noted that the orientations of the principal component δ22 for 13C′ is not always collinear with the C=O bond [179–182] although the δ33 axis is perpendicular to the peptide plane [42 113,179–182], except for [1-13C, 10%] 1Gly2Gly·HCl·H2O (tilt angle of 85°) [180], as illustrated in Fig. 9. It is also noteworthy that the peak positions corresponding to δ22 differ substantially among the peptides, although the peak positions of δ11 and Δδ are almost unchanged. The 13C′ δ11 of [1-13C]Gly[15N]Gly·HCl·H2O lies in the peptide plane and forms an angle of 77° relative to the C=O bond [179]. Measurements have been made of the magnitudes of the deviation of the bond axis for single crystalline samples of [1-13C, 10%]GlyGly, [1-13C, 10%] GlyGly·HNO3, and [1-13C, 10%] 1Gly2Gly·HCl·H2O for various hydrogen bond angles in O-H..O=C< type was examined [180]. For the 13C′ principal values of Ala residue in some peptides, see Table 4 [42,114].
Table 4.
The amide 13C chemical shift tensors of peptides in the solid state
| Peptides | Angle between δii and X-Y bond axis | δ11a ppm | δ22a ppm | δ33a ppm | Δδb ppm | δiso ppm | Remarks | Ref |
|---|---|---|---|---|---|---|---|---|
| [1-13C]Gly[15N]Gly HCl H2O | δ22: 13° from C=O bond axis | 244.1 | 177.1 | 87.9 | 111.6 | 169.7 | single crystal. δ convertedc | 179 |
| Ac[1-13C]Gly[15N]GlyNH2 | δ22: parallel to C=O bond axis | 243.0 | 184.9 | 91.2 | 105.0 | 172.8 | 15N-dipole coupled powder. δ converted | 181 |
| Ac[1-13C]Gly[15N]AlaNH2 | δ22: parallel to C=O bond axis | 242.1 | 184.9 | 90.0 | 104.7 | 172.3 | 15N-dipole coupled powder. δ: converted | 181 |
| Ac[1-13C]Gly[15N]TyrNH2 | δ22: −6° from C=O bond axis | 242.5 | 165.5 | 95.3 | 112.1 | 167.8 | 15N-dipole coupled powder. δ: converted | 181 |
| Ac[1-13C]Gly[15N]Gly HCl | δ22: −12° from C=O bond axis | 243.8 | 177.2 | 89.1 | 110.7 | 170.0 | 15N-dipole coupled powder. δ: converted | 181 |
| [1-13C]Ala[15N]Ala | δ22: 3.6° from C=O bond axis. | 244 | 170.8 | 95 | 111.1 | 169.9 | 13C-15N dipole coupled powder. δ: converted | 182 |
| Ac[1-13C]Gly[15N]AlaNH2 | δ11: −36.6° from C′-N bond axis. | 242.1 | 184.9 | 90.0 | 104.7 | 172.3 | 13C-15N dipole coupled powder. δ: converted | 182 |
| Ac[1-13C]Gly[15N]TyrNH2 | δ11: −40.7° from C′-N bond axis. | 242.5 | 165.5 | 95.3 | 112.1 | 167.8 | 13C-15N dipole coupled powder. δ: converted | 182 |
| [1-13C]Gly[15N]Gly HCl | δ11: −46.6° from C′-N bond axis. | 243.8 | 177.2 | 89.1 | 110.7 | 170.0 | 13C-15N dipole coupled powder. δ: converted | 182 |
| Ac[1-13C]Gly[15N]GlyNH2 | δ11: −34.5° from C′-N bond. | 243 | 184.2 | 91.2 | 105.3 | 172.8 | 13C-15N dipole coupled powder. δ: converted | 182 |
| [1-13C, 10%]GlyGly HCl H2O | δ22: 13° from C=O bond axis | 242.1 | 177.1 | 87.9 | 109.6 | 169.7 | single crystal. | 180 |
| [1-13C, 10%]GlyGly HNO3 | δ22: 5° from C=O bond axis | 248.1 | 167.8 | 89.1 | 119.7 | 168.3 | single crystal. | 180 |
| [1-13C, 10%]GlyGly | δ22: 10° from C=O bond axis | 242.3 | 173.8 | 88.2 | 111.3 | 168.1 | single crystal. | 180 |
| [1-13C, 99%]AlaGly H2O | 245 | 179 | 93 | 109 | 172.6 | Polycrystalline; spinning side bands | 42 | |
| [1-13C, 99%]AlaSer | 249 | 172 | 89 | 118.5 | 170.1 | polycrystalline; spinning side bands | 42 | |
| [1-13C, 99%]AlaProGly H2O | 235 | 178 | 95 | 98.5 | 169.3 | polycrystalline; spinning side bands | 42 | |
| [1-13C, 90%]ValGlyGly | 245 | 170 | 93 | 113.5 | 169.2 | polycrystalline; spinning side bands | 114 | |
| BocPro[1-13C, 90%]IleGly | 249 | 183 | 88 | 113.5 | 173.0 | polycrystalline; spinning side bands | 114 | |
| D,L-[1-13C, 90%]LeuGlyGly | 246 | 178 | 92 | 111 | 172.0 | polycrystalline; spinning side bands | 114 | |
| [1-13C, 90%]AspGly | 242 | 175 | 93 | 108 | 170.3 | polycrystalline; spinning side bands | 114 | |
| N+H3CH(CH3) COO− | 1. δ11: 9.4° from C′-Cα bond axis, | 242.9 | 183.5 | 106.7 | 97.8 | 177.7 | single crystal. δ: converted | 55 |
| 1. COO− 2. CH3(Cβ) |
2. δ33: 4.3° from Cα-Cβ bond axis. | 30.3 | 21.4 | 8.3 | 15.5 | 20.0 |
δ11 > δ22 > δ33. δ11 is most deshielded component and δ33 the most shielded component. δ: relative to TMS.
Δδ = δ33 − (1/2)(δ11 + δ22)
δ: converted from liq. benzene reference to TMS reference [δ for liq. benzene: 128.5 ppm relative to TMS.
Magnitudes of displacements of chemical shifts accompanying conformational changes were examined for Gly 13C′ CSAs of [2-13C, 8 %] (Gly)n, taking I (β-sheet) and II (31-helix) forms, and the guest [2-13C, 8%] Gly incorporated into host (β-benzyl L-aspartate)n or (β-benzyl L- glutamate)n [127,183,184], and also for Ala C′, Cα and Cβ CSAs [185]. Magnitudes of displacement upon conformational changes are larger for δ22 and δ33, while δ11 is almost unchanged (Table 5). Ala 13Cα and 13Cβ CSAs of (Ala)n with the αR-helix and β-sheet forms indicate that the most deshielded value of δ11 for Ala Cα and Cβ are very sensitive to conformational changes and are responsible for the observed conformation-dependent isotropic chemical shifts [186]. The 13Cα CSAs of Ala, Val and Leu in a series of various crystalline peptides of known structure have also been determined [187]. The magnitudes and orientations of the principal components of 13Cα and 13Cβ CSAs of a L-alanine single crystal have been reported and these tensors are not axially symmetric but their values are very small [55]. The direction of the most shielded δ33 axis for Cβ and Cα carbons is almost parallel to the Cα-Cβ bond within ± 5° and is tilted by 25° from the Cα-N bond, respectively.
Table 5.
Conformation-dependent changes in the 13C principal values of some polypeptides
| Sample | Conformation | Amino-acid residues | Carbons | δ11 ppm | δ22 ppm | δ33 ppm | Δδ ppm | δiso ppm | Ref |
|---|---|---|---|---|---|---|---|---|---|
| (Gly)n I | β–sheet | Gly | C′ | 243 | 174 | 88 | 121 | 168.3 | 183 |
| (Gly)n II | 31 -helix | Gly | C′ | 243 | 179 | 94 | 117 | 171.8 | 183 |
| (Gly)n I | β–sheet | Gly | CH2 | 60 | 45.0 | 28 | 25 | 44.3 | 184 |
| (Gly)n II | α-helix | Gly | CH2 | 61 | 45.7 | 25 | 28 | 43.7 | 184 |
| (Asp(OBzl), Gly*)n | α-helix | Gly | CH2 | 65 | 44.1 | 25 | 29.6 | 44.8 | 184 |
| (Asp(OBzl), Gly*)n | ω-helix | Gly | CH2 | 65 | 46.5 | 24 | 31.8 | 45.1 | 184 |
| (Ala, Gly*)n | α-helix | Gly | C′ | 244 | 178 | 94 | 116 | 176.4 | 183 |
| (Leu, Gly*)n | α-helix | Gly | C′ | 242 | 179 | 94 | 117 | 175.7 | 183 |
| (Glu(OBzl), Gly*)n | α–helix | Gly | C′ | 243 | 178 | 95 | 116 | 172.0 | 183 |
| (Asp(OBzl), Gly*)n | α– helix | Gly | C′ | 243 | 178 | 95 | 116 | 172.0 | 183 |
| (Asp(OBzl), Gly*)n | ω–helix | Gly | C′ | 242 | 178 | 93 | 117 | 171.1 | 183 |
| (Val, Gly*)n | β-sheet | Gly | C′ | 242 | 171 | 93 | 114 | 168.5 | 183 |
| (Ala)n | α-helix | Ala | C′ | 247.1 | 192.5 | 93.8 | 104.0 | 177.8 | 186 |
| (Ala)n | α-helix | Ala | Cα | 72.1 | 54.3 | 31.7 | 29.2 | 52.7 | 186 |
| (Ala)n | α-helix | Ala | Cβ | 25.3 | 19.5 | 0.6 | 15.3 | 15.1 | 186 |
| (Ala)n | α-helix | Ala | C′ | 243 | 194 | 99 | 177 | 178.7 | 42 |
| (Ala)n | β-sheet | Ala | C′ | 245.4 | 173.2 | 95.3 | 111.2 | 171.3 | 186 |
| (Ala)n | β-sheet | Ala | Cα | 59.7 | 54.6 | 31.6 | 16.6 | 48.6 | 186 |
| (Ala)n | β-sheet | Ala | Cβ | 37.7 | 16.1 | 5.3 | 27.0 | 19.7 | 186 |
| (Ala)n | α-helix | Ala | Cα | 72.0 | 51.9 | 39.0 | 26.6 | 53.3 | 185 |
| (Ala)n | α-helix | Ala | Cβ | 23.4 | 18.1 | 2.3 | 13.2 | 15.8 | 185 |
| (Ala)n | β-sheet | Ala | Cα | 64.6 | 49.7 | 32.4 | 23.6 | 48.9 | 185 |
FPT-INDO MO calculations have been performed for Gly and Ala residues having torsion angles of an α-helix taken from N-acetyl-N′-methyl glycine amide and N-acetyl-N′-methyl L-alanine amide, respectively, both of which are hydrogen bonded to two formamide molecules to reveal the directions of principal components of 13C CSA tensors [113,114]. More accurate predictions for the directions of 13C chemical shift tensor components for Ala Cα and Cβ from the latter were carried out by the GIAO-CHF method with the 4–31 basis set, as illustrated in Fig. 15 [118]. It was shown that the direction of the most shielded δ33 axis of Ala Cβ lies almost along the Cα-Cβ bond for αR-helix, βA-sheet, 310R-helix and the helix near the 31-helix with small deviations of 7.4°, 11.0°, 5.8° and 7.4°, and also that the δ11 axis is nearly perpendicular to the plane defined by Cβ, Cα, and N atoms in Ala residue and δ22 is parallel to the plane [118]. These results agree with the experimentally determined direction of δ33 of the 13Cβ CSA of L-alanine [50].
Fig. 15.


The calculated 13C chemical shift map of the Cβ and Cα carbons of N-acetyl-N′-methyl-L-alanine amide calculated by using the GIAO-CHF method with a 4-31G ab initio basis sets. The 4-31G optimized geometries for the peptide were employed. (a) σiso, (b) σ11, (c) σ22, and (d) σ33 for the Cβ carbon (in ppm), and (e) σiso, (f) σ11, (g) σ22, and (h) σ33 for the Cα carbon (in ppm). A positive σ means shielding. Reproduced with permission from [118]. Copyright 1994 Elsevier.
3.1.2 15N CSA
15N CSA principal components and their orientations for a variety of single crystalline [188–190] and polycrystalline [58,62–65,126,127,181,182, 191–204] peptides reported in the literature are summarized in Table 6. It is seen that the orientation of δ11 lies approximately close to the N-H bond with a deviation of up to 25°, δ33 lies approximately along the N-C(=O) bond, and δ22 is aligned in the direction perpendicular to the peptide plane (see Fig. 9). The orientation of the tensor can be also described by the angle that δ11 makes with the C′-N bond axis. The δ11 axis of Ala-[15N]Pro-Gly in a single crystal, deviates 23° from the N-Cα bond and lies 5° below the peptide plane, whereas the orientation of δ22 is 4° away from the peptide plane normal and δ33 lies approximately in the peptide plane [189]. The δ11 of Ala-[15N]Gly-Gly is 11° out of the peptide plane defined by accurate heavy atom positions N(Gly-2), Cα(Gly-2), and C(=O)(Ala-1), and δ22 is rotated by 15° away from the peptide plane normal. The most deshielded δ11 axis of Gly-[15N]Gly-Val is 1° out of the peptide plane and is tilted by 23° from the N-H bond, but the δ22 and δ33 axes are substantially rotated about δ11 such that δ22 is off from the peptide plane normal by 36°. The possibility of conformation-dependent 15N CSA principal values for α-helix, 31-helix and β-sheet structures has been examined for (Ala)n, (Gly)n and Ala- or Gly-residues involved in polypeptides (Table 7). It appears that the values of δ22 of Ala residues, and δ11 of Gly residues are sensitive parameters for distinguishing between α-helix and β-sheet conformations, but the rest of the components including Δδ are insensitive. In contrast, only the δ11 values are sensitive differences between α-helix and β-sheet conformations. It is not easy, however, to distinguish the 31-helix from the α-helix and β-sheet conformations by using 15N CSA information.
Table 6.
The amide 15N chemical shift tensors of peptides and proteins in the solid state
| Peptides | Angle between δii and X-Y bond axis | δ11a ppm | δ22a ppm | δ33a ppm | Δ δb ppm | δiso ppm | Remarks | Ref |
|---|---|---|---|---|---|---|---|---|
| Ac[1-13C]Ala [15N]AlaNH2 | δ11: 100° from C′-N bond axis, | 229.4 | 85.1 | 44.6 | 164.6 | 119.7 | 15N-dipole coupled powder. | 190 |
| Ac[1-13C]Ala [15N]TyrNH2 | δ11: 98° from C′-N bond axis | 209.3 | 77.1 | 52.1 | 144.7 | 112.8 | 15N-dipole coupled powder. | 190 |
| [1-13C]Gly[15N]GlyHCl | δ11: 20° from N-H bond axis | 210.0 | 59.8 | 57.3 | 151.5 | 108.9 | 15N-dipole coupled powder. | 190 |
| Gly[15N]Gly | δ11: 21° from N-H bond axis | 222.9 | 79.7 | 46.8 | 159.6 | 116.5 | dipolar/CS | 199 |
| Gly[15N]GlyH2O | δ11: 25° from N-H bond axis | 223.7 | 78.9 | 48.4 | 160.0 | 117.0 | 2D dipolar/CS | 140 |
| Gly[15N]GlyHClH2O | 210.2 | 64.8 | 59.2 | 148.2 | 111.4 | 2D dipolar/CS | 140 | |
| [1-13C]Gly[15N]GlyNH2 | δ11: 100° from C′-N bond axis. | 210.6 | 64.2 | 40.7 | 158.2 | 105.2 | 15N-dipole coupled powder. | 190 |
| [1-13C]Gly [15N]GlyHCl H2O | δ11: 21.3° from N-H bond axis | 215.9 (188.6) | 70.9 (43.6) | 60.3 (33.0) | 150.3 | 115.7 (88.4) | single crystal. δ: converted | 188 |
| [13C]Ala[15N]Ala | δ11: 106° away from C′-N bond axis | 215.5 | 78.1 | 65.3 | 143.8 | 119.6 | 15N-dipole coupled powder. | 182 |
| Ac[13C]Gly[15N]AlaNH2 | δ11: 100° away from C′-N bond axis. | 229.4 | 85.1 | 44.6 | 164.6 | 119.7 | 15N-dipole coupled powder. | 182 |
| [13C]Gly[15N]GlyHCl | δ11: 99° away from C′-N bond axis. | 210.0 | 59.8 | 57.3 | 151.5 | 109.0 | 15N-dipole coupled powder. | 182 |
| Ac[13C]Gly[15N]GlyNH2 | δ11: 100° away from C′-N bond axis. | 210.6 | 64.2 | 40.7 | 158.2 | 105.2 | 15N-dipole coupled powder | 182 |
| Ac[13C]Gly[15 N]TyrNH2 | δ11: 98° away from C′-N bond axis. | 209.3 | 77.1 | 52.1 | 144.7 | 112.8 | 15N-dipole coupled powder. | 182 |
| BocGlyGly[15N, 2H]GlyOBzl 1. monoclinic form 2. triclinic form |
1. δ11: 22° from N-H bond axis | 227.2 (157.2) | 66.3 (318.1) | 59.3 (325.1) | 164.4 | 117.6 | proton decoupled 15N NMR. δ: converted | 191 |
| 2. δ11: 24° from N-H bond axis | 224.6 (159.8) | 87.6 (296.8) | 40.6 (343.8) | 160.5 | 117.6 | |||
| Ala[15N]Leu | δ11: 17° from N-H bond axis | 217 | 77 | 64 | 83 | 119.3 | 15N-dipole coupled powder. | 194 |
| N-acetyl[15N]glycine | δ11: 25.5° or 154.5°° from the N-H bond axis. | 220.4 | 82.8 | 37.0 | 160.5 | 113.4 | 1H-15N dipolar 15N chemical shift NMR | 58 |
| [15N] collagen powder | δ11: 24.5° or 155.5° from the N-H bond axis. | 223.4 | 67.0 | 42.3 | 168.8 | 110.9 | 1H-15N dipolar 15N chemical shift NMR | 58 |
| [15N-Gly-18]magainin 2 | Angle β: 22°±1°; α: 30°±19° | 218.0 | 75.4 | 45.0 | 157.8 | 112.8 | 1H-15N dipolar 15N chemical shift NMR | 58 |
| [15N-Phe-16]magainin 2 | Angle β: 22°±3°; α: 45°±15° | 220 | 80 | 55 | 148.9 | 118 | 1H-15N dipolar 15N chemical shift NMR | 58 |
| [15N] collagen oriented | δ11: 24.5° from the N-H bond axis. | 223.4 | 67.0 | 42.3 | 168.8 | 110.9 | 1H-15N dipolar 15N chemical shift NMR | 58 |
| [1-13C]glycyl2 [15N]alanyl3-gramicidin A | δ11: 104° from C′-N bond axis. | 228.8 (206) | 85.4 (63) | 59.4 (37) | 156 | 124.5 | 15N chemical shift powder pattern. δ: converted | 198 |
| [1-13C]alanyl3-D-[15N]leucyl4-gramicidin A | δ11: 105° from C′-N bond axis | 223.4 (201) | 86.4 (64) | 55.4 (33) | 152.5 | 121.7 | 15N chemical shift powder pattern. δ: converted | 198 |
| [15N]Gly-D-Pro-Gly-[15N]Ala-D-Pro | 3D solid state NMR, 1H homonuclear spin exchange | 62 | ||||||
| Gly-1 | Angle β: 25°; angle α: 0° | 207 | 77.3 | 57 | 139.8 | 113.8 | ||
| Ala-4 | Angle β: 18°; angle α: 0° | 220 | 80 | 73 | 143.5 | 124.3 | ||
| GlyPro-D-Leu- [15N]Gly | δ33: parallel to C′-N bond axis. | 205.3 | 39.7 | 54.3 | 158.3 | 99.8 | dipolar coupled 15N powder pattern | 140 |
| Gly-[15N]Gly | δ33: parallel to C′-N bond axis. | 204.7 | 56.5 | 26.1 | 163.4 | 95.9 | dipolar coupled 15N powder pattern | 140 |
| Val-[15N]GlyGly | δ33: parallel to C′-N bond axis. | 199.6 | 62.5 | 19.9 | 158.4 | 94.0 | dipolar coupled 15N powder pattern | 140 |
| ValGly-[15N]Gly | δ33: parallel to C′-N bond axis. | 203.3 | 54.9 | 18.7 | 166.5 | 92.3 | dipolar coupled 15N powder pattern | 140 |
| Tyr-[15N]GlyGlyPheLeu | δ33: parallel to C′-N bond axis. | 194.2 | 46.0 | 10.0 | 166.2 | 83.4 | dipolar coupled 15N powder pattern | 140 |
| AcPro--[15N]GlyPhe | δ33: parallel to C′-N bond axis. | 190.7 | 33.9 | 20.5 | 163.5 | 81.7 | dipolar coupled 15N powder pattern | 140 |
| Ala-[15N]ProGly | δ11: 23° from C′-N bond axis | 231 | 127 | 38 | 148.5 | 132 | single crystal. 15 N NMR | 189 |
| Ala-[15N]GlyGly | δ11: 1° out of peptide plane and δ22: rotated by 15° from peptide plane normal. N-H bond vector deviates 12° from peptide plane. | 207 | 59 | 48 | 153.5 | 105 | single crystal. 15N NMR | 189 |
| Gly-[15N]GlyVal | δ11: 23° from N-H bond axis | 218 | 63 | 53 | 160 | 111 | single crystal. 15N NMR | 189 |
| N-AcVal Leu | 2D magic angle decoupling and MAT | 202 | ||||||
| Val | Angle β: 20°±2°; α: 34°±12° | 230.1 | 87.1 | 60.2 | 156.0 | 125.7 | ||
| Leu | Angle β: 18°±2°; α: 36°±11° | 232.8 | 93.7 | 58.7 | 156.5 | 128.4 | ||
| [15N-Leu-19]paradaxin | Angle β: 20°±3°; α: 30°±15° | 224.4 | 76.9 | 52.3 | 159.8 | 117.4 | 2D magic angle decoupling and MAT | 202 |
| [15N-Leu-19]SA peptide | Angle β:: 20°±3°; α: 30°±15° | 221.4 | 76.9 | 51.0 | 156.0 | 117.0 | 2D magic angle decoupling and MAT | 202 |
δ11 > δ22 > δ33. δ11 is most deshielded component and δ33 the most shielded component. δ relative to liquid NH3.
Δδ = δ33 − (1/2)(δ11 + δ22)
Table 7.
Conformation-dependent changes of 15N CSA for some polypeptides
| Sample | Conformation | δ11 ppm | δ22 ppm | δ33 ppm | Δδ ppm | δiso ppm | Remarks | Ref |
|---|---|---|---|---|---|---|---|---|
| (Ala)n | α-helix | 225 | 75.5 | 50 | 158 | 119.9 | static, 15N CP | 126 |
| (Ala)5 | β-sheet | 222 | 82.8 | 65 | 148 | 123.3 | static, 15N CP | 126 |
| (Ala*, Leu)n | α-helix | 225 | 78. | 56 | 158 | 119.7 | static, 15N CP | 126 |
| (Ala*, Asp(OBzl))n | α-helix | 229 | 79.8 | 59 | 160 | 122.6 | static, 15N CP | 126 |
| (Ala*, Glu(OBzl))n | α-helix | 227 | 77.8 | 60 | 158 | 121.5 | static, 15N CP | 126 |
| (Ala*, Glu(OMe)n | α-helix | 226 | 79.2 | 58 | 157 | 121.0 | static, 15N CP | 126 |
| (Ala*, Val)n | α-helix | 222 | 74.2 | 63 | 154 | 119.7 | static, 15N CP | 127 |
| (Ala*, Val)n | β-sheet | 223 | 83.5 | 56 | 153 | 120.8 | static 15N CP | 126 |
| (Ala*Ile)n | β-sheet | 221 | 84.1 | 61 | 149 | 122.1 | static, 15N CP | 126 |
| (Ala*D-Ala)n | αL-helix | 219 | 76.2 | 57 | 153 | 117.6 | static, 15N CP | 127 |
| (Ala*Gly)n | α-helix | 223 | 78.5 | 57 | 155 | 119.7 | static, 15N CP | 127 |
| (Ala*Gly)n | β-sheet | 221 | 80.7 | 58 | 152 | 119.9 | static, 15N CP | 127 |
| (Ala*, Sar)n | 219 | 83.3 | 58 | 148 | 120.1 | static, 15N CP | 127 | |
| (Gly)n | β-sheet | 206 | 61.4 | 46 | 152 | 104.2 | static, 15N CP | 48 |
| (Gly)n | α1- helix | 215 | 62.8 | 50 | 158 | 109.2 | static, 15N CP | 48 |
| (Gly*, Ala)n | α-helix | 213 | 57.6 | 45 | 162 | 104.9 | static, 15N CP | 48 |
| (Gly*, Leu)n | α-helix | 211 | 61.7 | 46 | 157 | 106.0 | static, 15N CP | 48 |
| (Gly*, Glu(OBzl))n | α-helix | 211 | 61.2 | 48 | 156 | 106.5 | static, 15N CP | 48 |
| (Gly*, Lys(Z))n | α-helix | 209 | 69.2 | 41 | 154 | 106.1 | Static, 15N CP | 48 |
| (Gly*, Leu)n | β-sheet | 207 | 66.2 | 41 | 153 | 104.4 | Static, 15N CP | 48 |
| (Gly*, Val)n | β-sheet | 204 | 74.6 | 40 | 147 | 105.8 | Static, 15N CP | 48 |
| (Gly*, Ile)n | β-sheet | 210 | 68.3 | 46 | 153 | 108.5 | Static, 15N CP | 48 |
| (Gly*, Asp(OBzl))n | β-sheet | 209 | 71.5 | 40 | 153 | 106.7 | Static, 15N CP | 48 |
| (Gly*, Sar)n | 205 | 65.8 | 39 | 152 | 103.1 | Static, 15N CP | 48 | |
| (Asp(OBzl)n | αR-helix | 205 | 52.8 | 39 | 159.1 | 98.9 | Static, 15N CP | 128 |
| αL-helix | 201 | 48.3 | 41 | 156.4 | 96.8 | Static, 15N CP | 128 | |
| ωL-helix | 202 | 47.4 | 40 | 158.3 | 96.3 | Static, 15N CP | 128 | |
| β-sheet | 203 | 56.4 | 41 | 154.3 | 100 | Static, 15N CP | 128 |
The orientations of principal axes for 15N CSA of Boc-GlyGly-[15N,2H]Gly benzyl ester in triclinic and monoclinic crystalline phases have been determined from the measured 15N-2H dipolar coupling[191]. Roberts, et al. have determined 15N CSA tensor values and N-H bond lengths for a few peptides and amino acids using MAS dipolar/chemical shift experiments as given in Table 6, and found that N-H distances measured from NMR experiments are uniformly ~0.035 Å longer that those determined from neutron diffraction studies [192]. The principal values of the amide 15N CSA for [15N]-labeled Gly in BocGly, BocGlyAla, Boc GlyPhe, BocGlyAib and BocGlyProOBzl have been examined in relation to >N-H…O=C< hydrogen bonding [193]. The principal axes of the 15N CSA for the amide nitrogen were obtained by FPT calculations on N-acetyl-N′-methylglycine hydrogen-bonded to a formamide molecule. The δ22 axis lies approximately along the N-C(=O) bond and δ33 is aligned in the direction perpendicular to the peptide plane, which is opposite to the previous assignment [138] but close to the reported experimental data [188]. Indeed, the δ22 and δ33 axes can be substantially rotated about the δ11 axis.
It was also shown that δ33 in Ala-[15N]Leu is tilted by 17° away from the N-H bond, and any deviation of the direction of δ33 from the peptide plane would result in an equivalent rotation of the other two principal components of CSA about the N-H bond axis, and that δ11 is tilted by about 20° from the peptide plane [194]. 15N CSAs of a synthetic peptide c(Gly-D-Pro-Gly-Ala-D-Pro), labeled with 15N at both the Gly-1 and Ala-4 amide sites were examined using the 2D PISEMAMAT technique [62]. These experiments revealed that isotropic 15N resonances of both the Gly-1 and Ala-4 residues are well-resolved in one frequency dimension of the 2D spectrum while the full CSA powder patterns can be directly measured in the other dimension.
The relative orientation of a 15N CSA tensor and the N-H bond vector can be obtained by the 1D MADMAT technique from heteronuclear dipolar-coupled powder patterns [63]. This method was demonstrated on a 15N labeled polycrystalline N-acetylvaline(NAV) sample, and the simulation of the dipolar-shift powder pattern giving the 15N CSA tensor parameters of δ11 = 235.1 ± 1 ppm, δ22 = 78.3 ± 0.5 ppm, and δ33 = 56.9 ± 0.5 ppm, and the angle between the N-H bond and the least shield axis = 19 ± 2°, assuming an N-H bond length of 1.07Å. This method has also been applied to 15N labeled N-acetylglycine (NAG), in both unoriented and oriented [15N-Gly] collagen samples, and in [15N-Gly-18] [58] and [15N-Phe-16] [195] magainine 2 samples. These studies demonstrated that the δ33 axis is tilted away from the peptide plane (α = 25 – 45°). This simple 1D method was applied under MAS conditions, and the dipolar-shift sidebands were analyzed to yield the orientation of the 15N CSA tensors [64]. A 15N-labeled NAV polycrystalline sample was studied under various MAS speeds ranging from 0.5 to 2.5 kHz. It was found that the errors in determining the α angle increased with the spinning speed, which could be attributed to the smaller number of sidebands present at a higher spinning speed, while the measured β angle was essentially unchanged at different spinning speeds (Table 6), where α and β are defined to be the angle between δ11 and the projection of the N-H bond on the δ11 - δ22 plane, and the angle between the δ33 axis and the N-H bond.
15N CSA tensors have been determined for the amide fragment of (Z)-acetanilide and (E)-N-methylacetanilide, revealing striking variations due to the difference in the orientation of the N-phenyl substituent with respect to the amide plane [196]. Recently, the amide-15N CSA tensor of GlyGly was determined by spectral simulation of the observed 15N chemical shift and 15N-1H dipolar-chemical shift powder patterns, and its backbone dynamics was examined by analyzing the 15N line shapes and 13C relaxation rates [197]. An analytical approach to determine the orientation of the δ11 component of the amide-15N CSA tensor with respect to the 13C-15N bond in the backbone by observing the dipolar-coupled 15N chemical shift powder patterns was suggested [198]. The amide-15N tensors of of all 15 residues in gramicidin A have been determined from aligned lipid bilayer samples [199] and used as orientational constraints to evaluate different models for the channel conformation of gramicidin A. Recently, the changes in amide 15N CSA of gramicidin A induced by cation binding were studied using aligned DMPC bilayers [200]. Upon cation binding, the δ11 component of Trp-13 changed significantly, up to 6 ppm. It was demonstrated that the changes in chemical shift observables were primarily due to through-bond polarization by cations, while no significant change in dynamics was observed.
A new method employing the REDOR technique to obtain the orientation of a 15N chemical shift tensor relative to a 15N-13C′ bond has been proposed [201]. Using this method on a doubly 15N and 13 C′ labeled polycrystalline acetanilide sample, the orientation of the 15N CSA tensors in the molecular frame with respect to the 15N-13 C′ and 15N-1H bond vectors was obtained from a 15N-13C′ REDOR and 15N-1H dipolar-shift MAS experiments, respectively (see Table 6).
To resolve CSA line shapes of 15N in peptides labeled at multiple sites, multidimensional solid-state NMR experiments are highly desirable. A 2D MADMAT method was applied to polycrystalline N-acetylvaline (NAV) and N-acetylvalylleucine (NAVL) samples [202] to obtain a correlation of the 15N CSA with the isotropic chemical shift (Fig. 16). Another 2D method that correlates isotropic chemical shifts by fast MAS and amplified spinning sidebands by rotor synchronized π pulses has been developed [203]. This experiment has a high sensitivity due to the fast spinning, while the rotor-synchronized π pulses effectively reduce the effect of the spinning speed in the indirect dimension.
Fig. 16.

(a) Correlation of 15N CSA and isotropic shifts of polycrystalline NAVL recorded by the 2D MADMAT method at 40.59 MHz. (b) and (c) 15N CSA powder patterns obtained from slices of the triple-echo MAT 2D spectrum at 9.4T. Reproduced with permission from [202]. Copyright 2001 American Chemical Society.
It is interesting to examine a possible conformation-dependent anisotropic 15N chemical shift of Ala- or Gly-residues involved in either the α-helix or β-sheet conformation of polypeptides as summarized in Table 7 [48,125,126]. It is noteworthy that the values of δ22 of the 15N nuclei in β–sheets are more displaced downfield as compared with those in an α-helix: they are 80–85 ppm (β-sheet) and 66–72 ppm (α-helix) for Ala or Gly residues, respectively. 15N isotropic (δiso) and 15N CSA tensor components of 15N-labeled PBLA taking the αR-helix, αL-helix, ωL-helix and antiparallel β-sheet conformations in the solid-state have been reported. It was shown that δ22 values are significantly changed depending on the conformation of the peptide [128].
Amide-15N CSA tensors for several dipeptides, as well as for a series of model Ala-X and X-Ala sequences in both α-helical and β-sheet conformations (where X is one of the naturally occurring amino acids) have been investigated by quantum chemical calculations [204]. The tensor of a 15N shifts in a given peptide residue is unaffected by residues other than those adjacent to it, which implies that the amide-15N CSA tensor should be considered in the context of tripeptide sequences. DFT-IGLO calculations have been performed for shielding tensors of a glycyl-glycine dipeptide [205]. The δ11 component of the amide-15N CSA tensor is always tilted (18°–22°) from the N–H bond for a variety of selected conformations considered.
3.1.3 17O CSA
It is not easy to record the full 17O NMR spectrum of a solid, because of the widely spread signals produced by large quadrupolar interactions (spin quantum number 5/2), and its low natural abundance (0.037 %), even if spectral regions arising from the central (½ ↔−½) transition alone are observed. Nevertheless, several attempts to record solid-state 17O NMR have been made with an emphasis on attempts to elucidate the hydrogen-bonded structure of peptides and polypeptides [206–218]. 17O enrichment [206–211,216,217] together with higher-frequency solid-state NMR techniques are necessary to overcome the detection problems [219]. Indeed, acquisition of solid-state NMR spectra of quadrupolar nuclei at very high magnetic fields (25 and 40T) has been shown to improve the spectral sensitivity and resolution substantially. Excellent review articles on this subject are available [33,213].
CSAs and quadrupolar interaction
To unambiguously determine eight NMR parameters in Eq.(24) from spectra with large CSA and quadrupolar interactions, it is essential to record 17O spectra for at least two different resonance frequencies. For instance, quite different spectral features are available from the static 17O cross-polarization spectra of [17O](Ala)n (Fig. 17) and [17O](Gly)n, taking the α-helix, β-sheet or 31-helix conformations recorded at 36.6 and 67.8 MHz [206,209,210]. The eight parameters were obtained by applying a curve-fitting procedure to the experimental spectra, and the results are summarized in Table 8. Static 17O NMR spectra of the central Gly residues in two single crystalline 17O labeled Gly*GlyVal (GGV) and Ala*GlyGly (AGG) were measured, where *Gly indicates 17O labeled Gly [218]; the determined tensor orientations in the two peptides are very similar but the principal components are different. The most shielded CSA and smallest magnitude quadrupolar coupling (QC) components are normal to the peptide plane, while the most deshielded CSA and largest QC components are in the peptide plane either at an angle of 17° (CS) or perpendicular (QC) to the C=O bond (see Fig. 10). Comparisons of principal components from experiments and DFT calculations indicate that the smaller shielding tensor span in GGV (549 ppm) compared to that observed in AGG (606 ppm) is likely caused by two factors: a shorter “direct” H-bond distance to the peptide carbonyl oxygen and an “indirect” H-bond of the peptide NH to a carboxylate rather than a carbonyl oxygen. It was predicted by a FPT-MNDO-PM3 MO calculation that δ22 lies approximately along the amide C=O bond, that δ11 is aligned in the direction perpendicular to the C=O bond in the peptide plane, and that the most shielded component δ33 is along the direction perpendicular to the peptide plane [206,207]. This assignment for the directions of δ11 and δ22 is opposite to that determined from a single-crystal NMR measurement [219]. This shows that the MNDO-PM3 semi-empirical MO method for the prediction of the direction of the principal axes may be an insufficient approximation for the carbonyl oxygen with lone-pair electrons to obtain accurate direction for the principal axes [207].
Fig. 17.

Static 36.6 and 67.8 MHz 17O CP NMR spectra of (Ala)n (a) with the α-helix form (n=100) and (b) the β-sheet form (n=5) in the solid state together with the computer simulations (bottom traces). Reproduced with permission from [209]. Copyright 1998 Elsevier.
Table 8.
The 17O chemical shift tensors of peptides and amino acids in the solid state
| (Ala)n and oligopeptides | ||||||||||
|---|---|---|---|---|---|---|---|---|---|---|
| δ11a ppm | δ22a ppm | δ33a ppm | Δδb ppm | δiso ppm | e2qQ/h MHz | ηQ | Remarks | Ref | ||
| (Ala)n | α-helix | 595 | 435 | −121 | 438 | 303 | 9.28 | 0.38 | Static/36.6 & 67.8 MHz | 209 |
| 319 | 8.59 | 0.28 | MAS/108.6 MHz | 210 | ||||||
| β-sheet | 514 | 390 | −110 | 373 | 265 | 8.65 | 0.41 | Static/36.6 &67.8 MHz | 209 | |
| 286 | 8.04 | 0.28 | MAS/108.6 MHz | 210 | ||||||
| [17O]-D-Ala | O1 | 275 | 7.6 | 0.60 | MQMAS/67.78 MHz; 17O in two different sites | 211 | ||||
| O2 | 262 | 6.40 | 0.65 | |||||||
| L-Ala | O1 | 284 | 7.86 | 0.28 | MAS/81.345 MHz | 214 | ||||
| O2 | 260. | 6.53 | 0.70 | |||||||
| L-Ala HCl | O1 (C=O) | 327.8 | 8.31 | 0.0 | MAS/81.345 MHz | 214 | ||||
| O2 (OH) | 176.7 | 7.29 | 0.2 | |||||||
| fmoc-Ala | O1 | 303.3 | 7.89 | 0.16 | MAS/81.345 MHz | 214 | ||||
| O2 | 175.7 | 6.95 | 0.12 | |||||||
| 17O-[Ala12] WALP23 | lyophilized | 317 | 8.45 | 0.21 | MAS/81.345 & 108.419 MHz | 212 | ||||
| DSPC vesicle | 311 | 8.42 | 0.21 | MAS/81.345 & 108.419 MHz | 212 | |||||
| Hydrated DSPC vesicle | 315 | 8.55 | 0.24 | MAS/81.345 & 108.419 MHz | 212 | |||||
| Ala [17O] AlaAla | Anti-parallel β-sheet | 302 | 8.7 | 0.40 | MAS/126 MHz NMR. | 226 | ||||
| 270 | 8.7 | 0.35 | Two forms have two unique molecules in the unit cell. | |||||||
| Parallel β-sheet | 293 | 8.7 | 0.35 | |||||||
| 293 | 8.7 | 0.35 | ||||||||
| (Gly)n and oligopeptides | ||||||||||
| [17O] (Gly)n | β-sheet | 574 | 425 | −101 | 412 | 299 | 8.55 | 0.26 | static 36.6, 54.2 & 67.8 MHz NMR | 207 |
| 304 | 8.36 | 0.30 | MAS/108.6 MHz NMR | 210 | ||||||
| α1 –helix | 562 | 410 | −108 | 411 | 288 | 8.30 | 0.29 | static 36.6, 54.2 & 67.8 MHz NMR | 207 | |
| 293 | 8.21 | 0.33 | MAS 108.6 MHz NMR | 210 | ||||||
| Gy[17O]-Gy | 562 | 382 | −132 | 421 | 265 | 8.55 | 0.45 | static 36.6, 54.2 & 67.8 MHz NMR | 207 | |
| Gy[17 O]GlyHNO3 | 559 | 408 | −127 | 418.5 | 280 | 8.75 | 0.47 | static 36.6, 54.2 & 67.8 MHz NMR | 207 | |
| GlyHCl | O1 (C=O) | 336 | 8.4 | 0.0 | MAS 81.345 MHz NMR | 214 | ||||
| O2 (OH) | 185 | 7.6 | 0.25 | |||||||
| 17O-[D-Leu] Gramicidin A lyophilized | 490 | 400 | −35 | 307.5 | 285 | 8.0 | 0.3 | MAS and static 122 MHz NMR | 220 | |
| Gly[17O]-GlyGly | 533 | 420 | −50 | 348 | 301 | 8.2 | 0.28 | MAS and static 113 MHz NMR | 216 | |
| Gly[17O]-GlyGly CaCl2 | 427 | 337 | −24 | 270.5 | 247 | 7.4 | 0.70 | MAS and static 113 MHz NMR | 216 | |
| Gly[17O]-GlyGly LiBr | 453 | 365 | −43 | 292 | 258 | 7.5 | 0.32 | MAS and static 113 MHz NMR | 216 | |
| Gly[17O]-GlyGly HCl | 535 | 395 | −52 | 363.5 | 293 | 7.9 | 0.48 | MAS and static 113 MHz NMR | 216 | |
| Gly-[17O]-GlyVal | δ11: 17° from C=O bond axis | 526 | 388 | −23 | 343.5 | 297 | single crystal. Static/67.15 MHz; Powder MAS/81 MHz & static 122 MHz NMR | 218 | ||
| Ala-[17O]-GlyGly | δ11: 17° from C=O bond axis | 546 | 405 | −60 | 373.5 | 297 | single crystal; static/67.15 MHz; powder MAS/81 MHz & static 122 MHz NMR | 218 | ||
δ11 > δ22 > δ33. δ11 is most deshielded component and δ33 the most shielded component
δ: relative to liquid water.
Δδ = δ33 − ½(δ11 + δ22)
High field and fast-speed MAS
By employing high-speed MAS at high field, 17O spectra can be obtained from which one can obtain three NMR parameters, namely, the isotropic chemical shift δiso, the quadrupole coupling constant e2qQ/h and ηQ (Eqs.(25) and (29)). It is easy to determine these three NMR parameters from a high speed MAS/high field 17O spectrum as compared with use of the static 17O spectrum, because the influence of quadrupolar interactions becomes extremely small in the high speed MAS/high field 17O spectrum. Indeed, 17O MAS spectra of a solid (Ala)n (n=100; α-helix) and (Ala)n (n=5; β-sheet) at 54.2 MHz and 67.8 MHz spun at 15 kHz showed that the center-band signal is separated from the side-band signals at the latter frequency, allowing to determine more accurate values for the isotropic chemical shifts, quadrupole coupling constants and asymmetry parameter [207]. The center-band linewidth at 54.2 MHz is broadened compared with that at 67.8 MHz, because the center-band linewidth is proportional to ωQ2/ωL2, where ωL is the Larmor frequency and ωQ is proportional to the square of ωq (= e2qQ/h) as shown in Eq.(23). Therefore, high-frequency NMR measurements are needed for a 17O MAS experiment, together with fast-speed MAS. The 108.6 MHz 17O MAS NMR spectra of a solid (Ala)n with α-helix (n=100) and β-sheet form (n=5) and (Gly)n I (β-sheet) and II (31 helix) were recorded using a spinning rate of 25 kHz [209,210].
High field/fast speed 17O MAS spectra of a selectively labeled transmembrane peptide (17O-[Ala12]-WALP23) (examined as a lyophilized powder incorporated in hydrated vesicles) were recorded at frequencies 81.345 and 108.419 MHz, spun at 11–22 kHz, as illustrated in Fig. 18 [212]. Here, WALP23 is a synthetic peptide which represents a consensus sequence for transmembrane protein segments. A single resonance was centered at ~280–300 ppm from the single label at alanine-12. The decrease of the second-order quadrupole broadening and the associated increase in spectral resolution with increasing applied magnetic field is clearly evident. The observed 17O NMR parameters are consistent with those of poly(L-alanine) with the α-helix conformation [210].
Fig. 18.

17O MAS NMR spectra of [17O]Ala12-WALP23 in hydrated DSPC vesicles at 14.1T and 18.8T at room temperature. (a) at 14.1T, spinning at ~15 kHz with simulation (the continuous line). (b) at 18.8T, spinning at ~22 kHz with simulation (the continuous line). The spinning sidebands are marked by the asterisks. Reproduced with permission from [212]. Copyright 2004American Chemical Society.
The effect of Li+1 and Ca2+ binding to the carbonyl oxygen sites of a model Gly(17O-Gly)Gly peptide system was studied by a combination of stationary and fast MAS at a high magnetic field 19.6 T [216]. It was shown that the ion binding leads to significant upfield shift in δ11 and δ22 in the peptide plane and, thus, to significant upfield shift in the δiso, together with a decrease in the quadrupole coupling constants of up to 1 MHz. 17O MAS and static NMR spectra of a lyophilized 17O-[D-Leu10]-gramicidin A (gA) sample were recorded and simulated with a set of parameters to elucidate the orientation of gA in uniformly aligned DMPC bilayers [220] (Fig. 19). It was found that the carbonyl 17O anisotropic chemical shift of Leu10, one of the three carbonyl oxygens contributing to the ion binding site in gramicidin A, is altered by 40 ppm when K+ ion binds to the channel, demonstrating a high sensitivity to such interactions. Moreover, considering the large range of the carbonyl 17O chemical shift (>500 ppm), the recording of anisotropic17O chemical shifts in bilayers aligned with respect to the magnetic field B0 offers high-quality structural restraints similar to 15N and 13C anisotropic chemical shifts.
Fig. 19.

1H-decoupled 17O MAS NMR spectra of 17O-[D-Leu10]-gramicidin A uniformly aligned in DMPC bilayer at 21T. Reproduced with permission from [220]. Copyright 2005 American Chemical Society.
2D 17O multiple quantum MAS (MQMAS) NMR spectra for amino acids, [17O2]-D-alanine, [17O4]-D,L-glutamic acid HCl and other 17O labeled organic compounds, have been recorded at 67.78 MHz and 14.5 kHz MAS using rotor synchronized aquisition, were recorded [211] with a z-filter pulse sequence [221]. There are two magnetically distinct alanine oxygen sites (O1 and O2) sites in which O1 is involved in only one C=O…H-N hydrogen bond (hydrogen-bond length between O1 and H atoms (RO…H) = 1.242 Å) and O2 is involved in two hydrogen bonds (RO…H = 1.258Å). The NMR parameters for the examined amino acids show a wide variation of δiso, from 83 to 353 ppm, e2qQ/h, from 6.4 to 8.6 MHz, ηQ, from 0.0 to 0.9. 17O NMR spectra of L-alanine and Glycine·HCl with high resolution (~ 1 ppm) were obtained by combining 1H-decoupled double-rotation (DOR), which narrows the lines by a factor of ~ 100 compared to conventional MAS, and manipulation of the satellite transition populations to transfer magnetization to the central transition, which produces a signal enhancement of ~ 2 [222]. 17O NMR of some other amino acids have also been examined [223–225].
17O MAS spectra at 21.8 T (126 MHz) and 20 kHz MAS have been reported for two kinds of Ala-[17O]Ala-Ala one with parallel (P) and the other with anti-parallel (AP) β-sheet structures [226]. The (δiso, e2qQ/h and ηQ) values are (O1: 302±5 ppm, 8.7±0.5 MHz, 0.40±0.1; O2: 270±5 ppm, 8.7±0.5 MHz, 0.35±0.1) and (O1: 293±5 ppm, 8.7±0.5 MHz, 0.30±0.1; O2: 293±5 ppm, 8.7±0.5 MHz, 0.30±0.1) for P and AP β-sheet structures, respectively. Calculated values of these parameters obtained using the DFT method were found to be in good agreement with those obtained from the spectra.
3.1.4. 1H CSA
The principal values and axes for the amino-1H chemical shift tensor of Ac-D, L-valine single crystal have been reported[227]. They were obtained from the 2H amide CSA tensor obtained on a sample in which the amide and carboxyl protons had been exchanged with deuterons. The 1H shielding tensor was obtained by converting from the 2H amide chemical shift tensor and taking into account the isotope effect between proton and deuteron. The determined absolute 1H shielding tensor components summarized in Table 9 were obtained by converting the data relative to TMS by using a value for the absolute shielding of TMS of 30.5 ppm. The directions of the principal axes were also determined: δ33 is aligned with the N-H bond axis with a deviation of 9° and δ11 is perpendicular to the peptide plane with a deviation of 11° (see Fig. 10). The direction of the most shielded amide 1H δ33 of 15N labeled Ala-15N-Leu is collinear with the N-H bond and the orientations of the 1H and 15N tensors are related by the Euler angles 45°, 90° and 75° from the analysis of the 2D 1H chemical shift – 15N chemical shift correlation spectrum [194].
Table 9.
The amide 1H chemical shift tensors of peptides in the solid state
| Peptides | Angle between δii and N-H bond (degree) | δ11a ppm | δ22a ppm | δ33a ppm | Δδb ppm | δiso ppm | Remarks | Ref. |
|---|---|---|---|---|---|---|---|---|
| Ac D, L-Valine | δ33: aligned with N-H bond axis | 15.6 (14.9) | 11.9(18.6) | 0.4 (30.1) | 13.4 | 9.3 | single crystal. 2H NMR. δ in the brackets is absolute shielding. |
227 |
| Ala[15N]Leu | δ33: collinear with N-1H bond axis | 17 | 8 | 3 | 9.5 | 9.3 | 3D solid-state NMR | 194 |
δ11 > δ22 > δ33. δ11 is most deshielded component and δ33 the most shielded component δ: relative to TMS.
Δδ = δ33 − (1/2)(δ11 + δ22)
The Flip-flop Lee-Goldburg (FFLG-2) homo-nuclear dipolar decoupling method combined with a 12 kHz MAS save signals with better resolution from amide-proton directly bonded to the amide-14N for Gly containing peptides [164]. By using the same method, high resolution 1H spectra of nylon 4 as a kind of polyamides have been measured by changing temperature to 214°C and then the structural behavior has been studied [228]. The use of a continuously phase-modulated homonuclear decoupling sequence DUMBO-1 gave well resolved proton spectra both at slow and fast MAS conditions for L-alanine amino acid, Ala–Asp dipeptide and cyclosporin A [229]. In the case of L-alanine, a proton line width of less than 0.5 ppm was obtained under DUMBO-1 decoupling.
3.1.5 CSA can reveal the geometry of hydrogen bonding
The values of δ22 for the amide 13C′ of Gly, Ala, Leu and Asp-containing peptides in the solid-state were found to vary with the hydrogen-bond length (RN…O), as illustrated in Fig. 20, by a similar relationship to that of the isotropic 13C chemical shift(Eq. (34)):
| (41) |
where the coefficients a and b were readily estimated from plots of the experimental values of the δ22[42,114,115]; the δ11 and δ33 are insensitive to changes in RN…O. This approach was extended to evaluate the RN…O value for the guest 13C-labeled Gly residue as the 5–8 % minor amount incorporated into host polypeptides (Ala, Gly*)n taking the αR-helix as the major form [114,115,184]. The RN…O values in the guest Gly residue in some host polypeptides have been determined using Eq.(41). The RN…O values of the guest Gly residue in (Gly*,Leu)n and (Gly*,Ala)n are very close to those of the host polypeptides. This indicates that the guest Gly residue is completely incorporated into host polypeptides with an αR-helix or a β-sheet conformation.
Fig. 20.

Plots of the experimental 13C chemical shift tensor components for (a) δ11, (b) δ22 and (c) δ33 for the amide carbonyl carbon in Gly (●), Ala (■), Val (□), Leu (△) and Asp (○) residues in peptides against the hydrogen-bond length (RN…O). The experimental errors of δ11 and δ33 are indicated by an error bar. Reproduce with permission from [114]. Copyright 1996 Elsevier.
Further, the conformational stability of the αR-helx and ωL-forms was analyzed through the RN…O values in guest 13C labeled Gly residues that were incorporated into host (β-benzyl L-aspartate)n [PBLA; (Asp(OBzl))n] [114,115]. It was shown that the former is longer by 0.07 Å than the latter. This means that the hydrogen bond for the αR-helix form is somewhat stronger than that for the ωL-form, and thus the αR helical stability is somewhat higher than ωL helical stability. The 13C-labeled Ala residue incorporated into PBLA with various conformations [230–232] show displacement of the 13C chemical shift of the Cβ-carbon on changing temperature, which indicates significant conformational changes of PBLA [233].
The diamagnetic contribution to δ33 for Ala Cα is mainly affected by changes in the main-chain torsion-angles but also by the hydrogen-bonding structure, especially in the comparison between the αR-helix and the βA-sheet main-chain torsion-angles [117,186]. This comes from the interaction between the atomic-orbitals aligned to the δ33 axis and the n-orbital (for lone-pair electrons) that is spread around the outside of the carbonyl bond.
The inclusion of intermolecular effects such as hydrogen bonding in the ab initio calculations of CSA tensors of 13Cα in peptides provides a better agreement between the calculated and experimental values [234].
The protonation state of the amide carboxyl group of amino acids and peptides in the solid-state can easily be evaluated by 13C CSA tensors but not by isotropic shifts, and the substantial variation in the δ22 element for both protonated and deprotonated forms is shown to be a result of the hydrogen bonding [235].
Behavior of the 15N isotropic shifts and 15N CSA tensors of the Gly amide nitrogen nuclei in various 15N-labeled glycylglycine (X-Gly1Gly2) sequence peptides (where Gly1 is 15N-labeled and X is some other amino acid) in the crystalline state have been studied [137], in order to relate the shift tensors with aspects of the hydrogen-bonded structure such as the hydrogen-bond length RN…O and/or the N-H bond length. The 15N CSA components of 15N-labeled BocGlyY dipeptides (Y: amino acid residues other than Gly) with an RN…O range of 2.95 to 3.08 Å were measured, in which some effect of the amino acid residues X on the 15N chemical shift of the amide-nitrogen for the Gly residue can be neglected [138]. The experimental values of δ33 move linearly downfield with a decrease in RN…O, while the experimental values of δ11 and δ22 are approximately independent of RN…O. FPT INDO calculations were used to explore the effect of a change of the hydrogen bond angle θ, and it was shown that the values of δ33 are relatively insensitive to a change in θ, but those of δ11 and δ22 are relatively sensitive to a change in θ.
The N-H bond lengths of the fully 15N-labeled (Ala)n in the β-sheet form has been shown to be 0.03 Å longer than that in the α-helix form from measurements of 15N-1H dipolar couplings obtained from 1H CRAMPS experiments [236].
3.2 CSA values of nuclei in solid-state globular and fibrous proteins
CSA recovery MAS experiments enable the measurement of CSA values of nuclei in individual amino acid residues in large molecular systems. The CSA values of 13C at multiple sites in selectively and extensively 13C-labeled and uniformly 15N-labeled ubiquitin (the 76 residue protein) have been measured by reintroducing them under MAS using a train of 180° pulses in which the second half of the pulse train is displaced with respect to the first half [237]. The 2D CSA-filtered 15N-13C 2D correlation spectrum at a delay of half a rotor period corresponds predominantly to 13C nuclei in α-helical residues which have smaller CSA values for Cα CSAs than those in the sheet residues. The helical CSA values obtained in this way for 13C in helical structure are significantly larger than the values estimated by solution NMR studies [238].
The CSA values of 13C in several peptides and (Ala)n were determined by 1D CPMAS and 2D PASS NMR experiments [187]. The carbonyl 13C CSA tensor was found to correlate with the backbone hydrogen bond distance. The 13Cα CSA tensors of alanine residues have a small dependency on the protein secondary structure and can vary from 20 to 30 ppm. For alanine and leucine, which are not branched at the β-carbon, the values of CSA span (Ω) are large, about 30 ppm, independent of whether the residues adopt a helical or a sheet conformation. In contrast, the CSA values (Δσ) obtained from solution NMR data for alanine, valine and leucine residues in proteins show major differences, with helical residues having Δσ values of ~6 ppm while sheet residues have Δσ ≈ 27 ppm.
The orientation of 13Cα CSA tensors was obtained under MAS by modulating a recoupled CSA pattern with various dipolar couplings [239]. These dipolar coupling modulated CSA spectra are equivalent to the projection of a 2D static separated-local-field spectrum onto its chemical shift dimension [240], except that its dipolar coupling frequency dimension is multiplied with a modulation function. It was demonstrated that both 13C-1H and 13C-15N dipolar couplings can modulate the CSA spectra of the Cα site in an amino acid and yield the orientations of the chemical shift principal axes relative to the C-H and C-N bonds. The magnitude of the Cα chemical shift tensors in two peptides with α-helical torsion angles was determined using the SUPER sequence under MAS [84] for the Ala residue in G*AL (φ = −65.7°, ψ = −40°) and Val residue in GG*V (φ = −81.5°, ψ = −50.7°) [241]. The helical Ala Cα chemical shift tensor has a span of 36 ppm and an asymmetry parameter of 0.89. Its σ11 axis is 116±5° from the Cα-Hα bond while the δ22 axis is 40±5° from the Cα-N bond. The 13Cα CSA tensor of Val has an anisotropic span of 25 ppm and an asymmetry parameter of 0.33, both are much smaller than the values measured for a β-sheet Val [239]. The δ33 axis in Val is tilted by 115±50° from the Cα-Hα bond and 98±5° from the Cα-N bond.
A recent study reported 13C and 15N CSA measurements from a uniformly 15N, 13C labeled microcrystalline protein (the 56 residue β1 immunoglobulin binding domain of protein G, GB1) using a 3D experiment incorporating ROCSA [242–244]. This 3D experiment correlating CSA powder line shape with isotropic chemical shifts enabled 127 site-specific CSA measurements to be made [242]. The displayed “triple plot” illustrates the CSA tensor for the Cα resonances of the Gly and Ala residues of GB1 (Fig. 21), and compares experimental values with calculated based on the GB1 crystal structure. While there is little change in the span of these tensors, there are important overall shifts of the principal elements. The residue G14, for example, resides in a turn, whereas G38 is positioned at the transition between the α-helix and the β3-strand, as clearly seen from the corresponding displaced principal values in the δ11 and δ22 (see Fig. 21(b)). The residue A20, in a reverse β-turn, displays an upfield Cα isotropic shift due to δ33, which shows a larger variation relative to the helical Ala residues. Determination of 91 independent 15N CSA tensors at 51 of the 55 backbone amide sites was also achieved by ROCSA measurements based on resolved 15N-13Cα and/or 15N-13C′ cross peaks [243]. A systematic variation between β-sheet and α-helix residues were also observed; the average value for the anisotropy parameter δ for α-helical residues is 6 ppm greater than that of β-sheet residues. High-quality slow-MAS spectra were acquired in a relatively simple experiment employing a diluted 13C labeling scheme for GB1, in combination with triple-resonance experiments based on a 15N-13C correlation method at a high magnetic field [244]. The average value of δ (15N) analyzed by the Herzfeld-Berger method throughout the protein is −109 ppm, slightly smaller in magnitude for β-sheet residues (−106 ppm) and larger (−115 ppm) for α-helix (Fig. 22a). The measured values for the carbonyl CSA tensors show trends as a function of secondary structure and isotropic chemical shift, with an average δ(13C′) over the entire protein of −79.3 ppm, −83.5 ppm for helical and −77.7 for β-sheet residues (Fig. 22b). The symmetry parameter η has a greater dependency on the secondary structure, with an average of 0.53 in α-helical and 0.72 in β-sheet residues (Fig. 22c). Variations in the isotropic chemical shift are highly correlated with the δyy tensor element (Fig. 22d).
Fig. 21.

(a) ROCSA Cα powder patterns (solid line) obtained at 11.7T with best simulations (dotted). (b) Plot of the principal components of Cα CSA tensors for all Gly and Aa residues in GB1. Experimental and theoretical data are shown as closed circles and diamonds, respectively. Reproduced with permission from [242]. Copyright 2005 American Chemical Society.
Fig. 22.

Fitted CSA tensor parameters determined for GB1; (a) δ(15N), 15N reduced anisotropy (δ = δzz − δiso), for backbone amide sites, (b) δ(13C′), (c) η (13C′) asymmetry parameter, (d) 13C′ principal elements as a function of the 13C′ isotropic chemical shift. Reproduced with permission from [244]. Copyright 2007 American Chemical Society.
3.3 CSA values for 13C, 15N and 1H in globular proteins in solution
The residue-specific CSA data in proteins are also available from solution NMR: 15N relaxation times are utilized, based on a ratio of η/R2 of the cross correlation (η) between 15N CSA and 15N-1H dipolar interaction and of the rate of 15N transverse relaxation (R2) [21,245–247], relying on a “model-free” approach for the interpretation of magnetic resonance relaxation [248]. Because the dependence of the spectral density function J(ω) of the cross correlation rate, η, between 15N CSA and 15N-1H dipolar interaction,
| (42) |
and of the rate, R2, of 15N transverse relaxation,
| (43) |
is similar, where PHF = (1/2)d2[J(ωH-ωN) + 6 J(ωH) + 6 J(ωH + ωN)] denotes the contribution to R2 from high frequency motions, and Rex corresponds to conformational exchange contribution, if any. Here, ωN and ωH are Larmor frequencies of the nitrogen and hydrogen, respectively. θ is the angle between the N-H vector and the unique principal axis of the 15N CSA tensor; d = (μ0/(4π))γHγNh/(4πrHN3), c = −γNB0(δ|| − δ⊥)/3; rHN is the N-H bond length; δ|| − δ⊥ is the anisotropy of 15N CSA tensor, assuming axially symmetry; P2(x) = (3x2 − 1)/2 is the second-rank Legendre polynomial; and h is the Planck’s constant. For the majority of the amide-NH group J(ωH) is much smaller than J(ωN) and J(0), which then allows PHF to be safely neglected to first order. Assuming Rex is negligible, Eq. (43) gives
| (44) |
The ratio
| (45) |
is then independent of protein dynamics, and therefore contains only “structural” information, in the form of the 15N CSA and the angle θ between the N-H vector and the unique principal axis of the 15N chemical shift tensor. The CSA is related to R2, η and θ:
| (46) |
If the 15N CSA is known, θ angle can be determined by the η/R2 ratio:
| (47) |
Usually, neither CSA nor θ is known. Therefore, independent determination of both 15N CSA and the angle θ is not possible from relaxation data at a single frequency, because η/R2 contains the product -(δ|| − δ⊥) P2(cosθ).
Determination of these parameters in ubiquitin is, therefore, feasible from the intersection of the curves representing loci of the CAS and θ solutions to Eq. (46) at the three fields used, 360, 500 and 600 MHz, as shown in Fig. 23 [246]. The 15N CSA values thus obtained fall in the range 125 to 216 ppm, with the average value of 157 ± 19 ppm; the average angle between the NH bond and the unique principal axis of the 15N CSA tensor was found to be 15.7 ± 5.0° (range 6–26°) (Fig. 24). Assuming a Gaussian distribution of 15N CSA values, the mean anisotropy of 15N in the B3 domain of protein G measured at several fields as determined by this procedure is 173.9 to 177.2 ppm (for 1.02 –Å N-H bond length) and the site-to-site CSA variability is ±17.6 to ±21.4 ppm, depending on the method used [247]. The Δδ values for 15N in ribonuclease H are approximately 172 ± 13 ppm, as determined by 1H-15N dipolar/15N chemical shift anisotropy relaxation interference rate [249]. The standard deviation of the site-to-site variation is 5.5 ppm and a 95% confidence limit for this variation is 9.6 ppm. Variability in these CSA values is a significant factor in the interpretation of the spin relaxation rate especially at a high magnetic field. An average 15N CSA of −170 ppm obtained with the assumption that θ = 20° was also demonstrated for ubiquitin by 15N CSA/15N-H dipolar correlation experiment [250]. It is pointed out that the above analysis of the magnetic field depence of the 15N relaxation yielded a considerably (5–20%) higher CSA value (170–175 ppm) [246,252,252] than that observed in the solid-state (~160 ppm) [126, 181,187, 190,192,195,203]. The discrepancy between solid-state and solution NMR data has been attributed to the fact that the solution data have been corrected for the effects of internal motion, whereas solid-state values have been derived from the motionally narrowed powder pattern [251].
Fig. 23.

(a) Correlation between the cross correlation term η and the rate of 15N transverse relaxation R2 in ubiquitin, from 600 MHz (solid circles), 500 MHz (open circles) and 360 MHz (solid triangles) data. (b) Graphical illustration for the deviation of CSA and θ from η/R2 at multiple fields. The curves in (b) represent loci of CSA and θ value solutions for the average values of η/R2 [from the linear fits in (a)]. The intersection of any two curves provides a unique solution for a given pair of η/R2 values at two frequencies, as indicated in the inset. Reproduced with permission from [246]. Copyright 1998 American Chemical Society.
Fig. 24.

A plot of (a) η/R2, (b) σ|| − σ⊥ and (c) θ versus residue number in human ubiquitin determined by 15N relaxation rates. Reproduced with permission from [246]. Copyright 1998 American Chemical Society.
Further, the CSA data are available in solution from the mode-dependent analysis of chemical shifts in the weakly oriented system [253,254]: the difference in apparent chemical shifts observed for weakly aligned (δaniso) and isotropic (δiso) samples is given by:
| (48) |
where Ajj are the principal components of the molecular alignment tensor, δii the principal components of the CSA tensor, and θij is the angle between the jj axis of the alignment tensor and ii axis of the CSA tensor. The dipolar coupling data DAB between two nuclei, A and B, is also related to the traceless alignment tensor according to:
| (49) |
where φi is the angle between the A-B bond vector and the Aii principal axis of the alignment tensor, γA and γB are the gyromagnetic ratios of the two nuclei and <rAB−3> is the vibrationally averaged inverse cube of the distance between the two nuclei. The orientation and magnitude of the rhombic alignment tensor were obtained from fits of the dipolar coupling data to the X-ray diffraction structure of ubiquitin. For the magnitude of alignment typically used in biomolecular NMR, 10−4–10−3, the measured Δδ are on the order of parts per billion (ppb). The determined CSA tensors for 13C′ in ubiquitin have the average values δ11 = 75 ppm, δ22 =12 ppm, and δ33 = −87 ppm with an angle between δ11 and the C′-N bond of 38°, and δ33 orthogonal to the peptide plane. For 15N, δ11 = 108 ppm, σ22 =−46 ppm, and δ33 = −63 ppm, with an angle of 19° between the H-N vector and the σ11 axis, and σ22 orthogonal to the peptide plane. For HN, the commonly used approximation of an axially symmetric shielding tensor was found to be invalid, and the best fit tensor values were found to be δ11 = 6 ppm, δ22 = 0 ppm, and δ33 = −6 ppm, with the δ11 axis orthogonal to the peptide plane and δ33 roughly parallel to the H-N bond axis [253]. The average 15N CSA was thus obtained to be 163.4 ± 4 ppm.
The average 15N CSA tensor was determined for the residues in ubiquitin by an MAS experiment as Δδ = 162.0 ± 4.3 ppm, η = 0.18 ± 0.02, and β = 18.6 ± 0.5°, assuming a 1H-15N bond length of 1.02 Å [255]. Measurement of the relatively small 1H CSA is technically challenging in the solid-state, as described already for Ala-15N-Leu [194], Ac-D,L-valine [227] and acetanilide [256]. The most shielded tensor component of the 1HN CSA tensor (δ33) is roughly collinear with the N-H bond. Amide 1HN chemical shift anisotropies in 15N-enriched proteins, ubiquitin, HIV-protease and HU protein from Bacillus stearothermophilus have been determined in solution utilizing cross-correlation between 15N-1H dipolar interaction and 1HN CSA [257,258]. The 1HN transverse relaxation rates for the two doublet components of a 1HN-15N spin pair are given by [259]:
| (50) |
where the + sign applies to the upfield 1HN – {15N} doublet component (1JNH < 0), and Δ, λ, and η correspond to homonuclear dipolar relaxation, HN – {15N} dipolar relaxation, and the cross correlation between the 1H CSA and the HN – {15N} dipolar interaction, respectively. They are given by
| (51) |
| (52) |
| (53) |
where q = ΣkγH4h2/(80π2rHk6) and the summation extends over all protons k in the vicinity of the amide-proton of interest with rHk being the interproton distance; d = γH2γN2h2/(80π2rHN6), α = 4πB0(δ|| − δ⊥)rHN3/(3hγN), and rHN is the 15N-1H distance, assumed to be 1.02Å. The spectral densities Jdd(ω), Jcc(ω), and Jcd(ω) are for dipolar coupling autocorrelation, CSA autocorrelation, and dipolar coupling-CSA cross correlation, respectively. For the present case, where the angle θ is assumed to be small (θ≪1) and the relative orientation of the dipolar coupling and CSA tensors was assumed to be independent of the internal motion, one has Jdd(ω) = Jcc(ω) = Jcd(ω)/P2(cosθ). Thus, the superscript in the spectral density function may be dropped, and Eq. (53) can be rewritten as
| (54) |
In the absence of contribution to the spectral densities from slow conformational changes, values for J (0) and J (ωH) can be obtained directly from the 15N T1, T2 and 15N-{1H} NOE values:
| (55) |
| (56) |
with
| (57) |
The values of η was determined based on the relaxation interference either by using a 2D experiment which is a simple modification of a HSQC or by a 3D HNH experiments. It was shown that CSA values of 1H in ubiquitin’s five-stranded β-sheet (11 ± 1.6 ppm) are significantly larger than those in its α-helix or its short 310 helix. Interestingly, Fig. 25 shows the correlation between the measured 1H CSA and the hydrogen bond length (RH..O – 1.3)−2. The best agreement is given by the following equation:
| (58) |
Fig. 25.

Correlation between HN CSA and hydrogen bond length (RH..O) in human ubiquitin. Hydrogens were added to the X-ray crystal structure with the program X-PLOR. Amides with low order parameters (S2 < 0.75) and solvent exposed amides for which no hydrogen bonded water was observed in the crystal structure are not included. Reproduced with permission from [257]. Copyright 1997 American Chemical Society.
4 Insights into biological problems
4.1. CSA vs secondary structure
4.1.1 Unoriented samples
Solution NMR
A serious drawback to the study of conformation and dynamics of proteins in solution by conventional NMR is the molecular size limitation (≤ 30 kDa). As discussed already in Section 2.3.3, the transverse relaxation rates for the two doublet components of a 1HN-15N spin pair may differ due to the effect of interference between 1HN-15N dipole-dipole relaxation and CSA of protons [257–260]. The TROSY (transverse relaxation-optimized spectroscopy) technique selects the slowly relaxing resonance line, eliminating the faster relaxing resonance [16,261]. The NMR assignment of a large 13C,15N-labeled protein is made feasible by a TROSY-type triple-resonance experiment [17,262] and indeed was extended to amide groups of a 110 kDa protein using polarization transfer by cross-correlated relaxation approach (CRINEPT) [18]. The optimal TROSY effect can be obtained by choosing an appropriate magnetic field strength, which, for amide protons, is about 23.5T, corresponding to a proton resonance frequency of 1 GHz, since the dipole-dipole interaction is independent of the static magnetic field whereas the CSA increases with the magnetic field strength [19,20]. The 15N nuclei in an amide moiety also show interference between dipole-dipole relaxation and their CSA.
The 2H,13C,15N-labeled 148-residue integral membrane protein OmpX from E. coli reconstituted with dihexanoyl phosphatidylcholine (DHPC) in mixed micelles of molecular mass of about 60 kDa has been studied by TROSY-type triple-resonance NMR experiments [263]. The 13C chemical shifts and the nuclear Overhauser effect data enabled the identification of regular secondary structural elements of OmpX/DHPC in solution. The same type of polypeptide backbone fold is observed in the solution structure and a previously reported crystal structure of OmpX in the presence of the detergent n-octyltetraoxyethylene. Complete sequence-specific assignments of the 121-residue polypeptide chain in an octameric 110 kDa protein, uniformly 2H,13C,15N-labeled 7,8-dihydroopterin aldolase (DHNA) from staphylococcus aureus were obtained using TROSY-type experiments in aqueous solution at 20°C, and the regular secondary structures in the solution conformation were found to coincide nearly identically with those in the crystal structure of the DHNA octamer [264].
NMR analysis of homotetradecameric chaperonin system GroEL-GroES with a molecular weight of up to 900 kDa was achieved by TROSY/CRINEPT-based 15N-1H correlation experiments [265]. Most amino acid residues of GroES show the same resonance whether free in solution or in complex with chaperonin; however, residues 17–32 show a large chemical shift change on binding. It was also shown that the chemical shift mapping can be used to characterize such protein-protein interactions in large complexes.
Solid-state NMR
Application of the conformation-dependent 13C chemical shifts, as summarized in Table 3, to reveal secondary structures of proteins can be readily tested for a variety of fibrous proteins such as silk fibroin, collagen, etc. the amino acids of which consist of the limited numbers of major amino acid residues, and the resulting polymorphic structures in the solid can be mutually converted using a variety of physical treatments. Crystalline silk fibroins are known to exist in one of the polymorphs, either silk I or silk II (β-sheet) and either the α-helix or β-sheet forms, depending on the species of silkworm, Bombix mori or Philosophia Cynthia ricini respectively. It is straightforward to distinguish the two polymorphs of silk fibroin from B. mori by their 13C chemical shifts [95,96,266,267] with reference to the reference chemical shifts of the conformation-dependent 13C chemical shifts [22–24], because the variety of amino acid residues is limited to the following four kinds: Gly (42.9%), Ala (30.0%), Ser (12.2%) and Tyr (4.8%). The signals of Cα in Ala and Ser residues of silk I are displaced downfield by about 2 ppm as compared with those of silk II, whereas the signals of Cβ in silk l are displaced upfield by 3–4 ppm relative to that of silk II. The major advantage is to be able to estimate the relative proportion of the material that is not readily converted to each other (20–30%) [266]. Distinction of α-helical and β-sheet signals in the Ala residue of P.C.ricini fibroin and the hydration-induced conformational change from the less stable α-helix to β-sheet region are also very conveniently examined by the 13C NMR approach [95]. Most of the 13C NMR signals of the collagen fibril, arising from the major amino acid residues, which amount to approximately 65% (Gly, 33 ± 1.3%; Pro, 11.8 ± 0.9 %; Ala, 10.8 ± 0.9 %; Hyp, 9.1 ± 1. 3%), can readily be assigned, with reference to the peak positions of Ala, Pro, Gly and Hyp from model polypeptides, (Pro-Ala-Gly)n, (Pro-Pro-Gly)10 and (Hyp)n, taking the collagen-like triple helix conformation [95,96,268–270].
Conformational characterization is straightforward for synthesized peptides in which nuclei of desired residues are labeled with 13C, yielding ready distinction among α-helix, β-sheet and random coil conformations, from their reference chemical shifts data [22,23,271–275]. This approach is also useful for conformational characterization of a variety of membrane proteins, once assignment of peaks to certain residues could be established. The following three types of approach are conceivable: (1) region-specific assignment of peaks, (2) site-specific assignment of peaks based on site-specific mutagenesis and proteolysis, and (3) sequential assignment. The region-specific assignment of peaks is straightforward by differentiation of mobile C- or N-terminal peaks from less mobile transmembrane peaks by comparative recording of peaks between CPMAS and DDMAS NMR spectra [276], together with the data of site-specific proteolytic enzymatic cleavage [277].
The 13C NMR spectral features of fully-hydrated [3-13C]Ala-labeled bacteriorhodopsin (bR) in 2D crystals from purple membrane differ between the 13C DD and CPMAS NMR spectra recorded at ambient temperature, as demonstrated in Fig. 26 [276,277]. Several 13C NMR signals are suppressed in the CPMAS NMR, because the C-terminal α-helix and its tail undergo fluctuation motions with correlation times of the order of 10−6 to 10−8 s, respectively. The three intense 13C NMR signals from the membrane surface (gray; top) in the DDMAS spectrum (consisting of contributions from a total 29 Ala residues) are unambiguously assigned to Ala 228 and 233 (C-terminal α-helix), Ala 240, 244–246 (C-terminal tail taking random coil), and Ala 235 (at corner of the C-terminal α-helix) from the upper to the lower field, with reference to the conformation-dependent 13C chemical shifts. The twelve Ala Cβ 13C NMR peaks in the CPMAS NMR (bottom) can be ascribed to 22 Ala residues present in the transmembrane α-helices and loops. The assigned peaks indicated at the individual peaks were obtained in view of the selectively reduced 13C NMR peak-intensity of relevant mutant, in which an individual Ala residue was replaced by other amino acid residues (for instance, A196G, A126V, A215G, etc.) as compared with that of the wild-type, provided that a global conformational change is not induced. Such a 13C NMR peak from the transmembrane α-helices can be identified as a single Ala residue by the difference 13C NMR spectrum between wild-type and a mutant, together with suppressed signals from residues located near the surface (within ca. 8.7 Ǻ) by accelerated transverse relaxation due to surface-bound Mn2+ [278]. Site-specific assignments of 13C NMR signals have been attempted for [1-13C]Val-, Pro-, Trp- and, Ile-labeled bR [279–281]. [3-13C]Ala-, [1-13C]Val-labeled ppR were also utilized for the resonance assignment [282,283].
Fig. 26.

13C DDMAS (a) and CPMAS NMR (b) spectra at 100 MHz of [3-13C]Ala-labeled bR from purple membrane. Peaks in gray from the C-terminus are preferentially suppressed by the CPMAS NMR, caused by a time-averaged 13C-1H dipolar interaction in the presence of isotropic motions in the C-terminus. Naturally, the remaining peaks in the DDMAS are identical to those of the CPMAS NMR, except for the reduced peak-intensities in the former. Reproduced with permission from [276]. Copyright 1999 Biophysical Society.
The database of 13C, 15N or 1H chemical shifts of various globular proteins of known crystalline structure [26,28,173] was utilized as a reference for sequential assignment of 2D correlation NMR studies on a uniformly 13C, 15N-labeled 144 kDa membrane protein complex, E. coli cytochrome bo3 oxidase [284] and Natromononas pharaonis sensory rhodopsin II (NpSRII or ppR) uniformly labeled with the exception of the four dominant residue types (valine, leucine, phenylalanine, and tyrosine), which occur in natural abundance U[13C, 15N V, L, F, Y)]NpSRII [285].
Resonance assignments based on the isotropic chemical shifts have also been accomplished on a uniformly-13C-labeled cytochrome-b5 embedded in bicelles without having to freeze the sample [286]. Similar studies have also been reported for complex non-crystalline complex systems such as intact bovine cortical bone [287]. This MAS approach has been utilized to investigate the effect of the dehydration process in the intact bone. Tentative site-specific assignment of peaks was attempted for uniformly labeled α-synuclein in a 3D 15N-13C-13C experiment at a low temperature (−40°C) in order to analyze the fibril structure [288]. Most of the signals, however, were not observed at 0 ±3°C and acquisition of spectra at a low temperature is essential for the assignment of chemical shifts. In such cases, it is essential to examine whether one is able or not to record all the expected 13C resonances without any suppressed peaks due to interference of the motional frequency, if any, with the frequency of either proton decoupling or MAS, as will be discussed in the next section. Conformational constraints based on isotropic or anisotropic chemical shifts have also been reviewed [289, 290].
4.1.2 Oriented samples
Secondary structure of peptides and proteins can be determined from orientational constraints such as dipole-dipole, CSA and quadrupolar interactions. These NMR parameters are routinely measured from mechanically (sandwiched between thin glass plates) or spontaneously, magnetically aligned systems. Indeed, orientational constraints from CSAs were utilized to study the polypeptide backbone of [13C] or [15N]labeled gramicidin A in oriented lipid bilayers [198–200,291–295]. In these samples, the observed chemical shifts vary with the relative orientation of the principal axes of the CSAat respective sites relative to the applied magnetic field. Orientational constraints for gramicidin A from 15N CSAs and 15N-1H dipole-dipole interactions were determined by recording SLF spectra [61,296]. The line widths in the dipolar coupling dimension of the 2D SLF spectrum are reduced by more than an order of magnitude by suppression of the broadening effects from inter-proton coupling by I-I homonuclear decoupling using the flip-flop Lee-Goldburg irradiation. The 2D PISEMA (Polarization Inversion Spin Exchange at the Magic Angle) spectrum has turned out to be indispensable for elucidating conformational feature of peptides and proteins in uniaxially oriented lipid bilayers. Details of the PISEMA pulse sequence, steps for the experimental set-up, data interpretation, effects of pulse imperfections and approaches to overcome such effects, and applications can be found in a recent review article [297].
The characteristic wheel-like patterns of resonances observed in these PISEMA spectra reflect helical wheel projections of residues in both transmembrane and in-plane helices called PISA (polarity index slant angle) without resonance assignments and hence provide direct indices of the secondary structure and topology of membrane proteins as viewed from the tilt angles of the transmembrane peptides relative to the bilayer normal [298,299]. Fig. 27(A) illustrates 15N-1H dipolar couplings observed from PISEMA spectra of multiple and single-site labeled preparations of a viral M2-TMP (transmembrane peptide) in hydrated lipid bilayers aligned with the bilayer normal parallel to the magnetic field direction [299]. A mirror image pair of “PISA wheels” is immediately apparent as shown in Fig. 27(B). The PISEMA spectra calculated for a full-range of possible orientations of an ideal 19-residue α-helix, with 3.6 residues per turn and identical backbone dihedral angles (φ = −65°, and ψ = −40°) for all residues are shown in Fig. 28 [300]. When the helical axis is parallel to the bilayer normal all of the amide sites have an identical orientation relative to the direction of the applied magnetic field and therefore all of the resonances overlap with the same 1H-15N dipolar coupling and 15N chemical shift frequencies. Tilting the helix away from the membrane normal breaks the symmetry, introducing variations in the orientations of the amide NH bond vectors relative to the field direction. This is manifested in the spectra as dispersions of both 1H-15N dipolar coupling and 15N chemical shift frequencies, as shown in Figure 28J. No structural information, however, is available for the sites of the N- and C-terminal residues with isotropic resonances because of complete motional averaging of dipolar interactions. When the helical axis is parallel to the bilayer normal all of the amide sites have an identical orientation relative to the direction of the applied magnetic field and therefore all of the resonances overlap with the same 1H-15N dipolar coupling and 15N chemical shift frequencies.
Fig. 27.

(a) Dipolar splittings observed in the 15N PISEMA spectra of multiple and single site labeled preparations of M2-TMP in hydrated lipid bilayers aligned with the bilayer normal to the parallel to the magnetic field direction. (b) Display of the dipolar splittings (*) at their observed chemical shift. The resonances are connected in helical wheel fashion. Reproduced with permission from [299]. Copyright 2000 Elsevier.
Fig. 28.

15N PISEMA spectra calculated for a 19-residue α-helix with 3.6 residue per turn and uniform dihedral angles (φ = −65, and ψ = −40) at various tilt angles relative to the bilayer normal. (a) 0°, (b) 10°, (c) 20°, (d) 30°, (e) 40°, (f) 50°, (g) 60°, (h) 70°, (i) 80°, (j) 90°. The principal values and molecular orientation of the 15N tensor (δ11 =64 ppm, δ22 =77 ppm, δ33 = 217 ppm, ∠ δ33 NH =17°. Reproduced with permission from [300]. Copyright 2000 Elsevier.
An algorithm for fitting the protein structure to PISEMA spectra has been described [301] and its application to helical proteins in oriented samples was demonstrated using both simulated and experimental results. Although the algorithm can be applied in an “assignment-free” manner to spectra of uniformly labeled proteins, the precision of the structure fitting is improved by the addition of resonance assignment information, for example the identification of resonances by residue type from spectra of selectively labeled proteins. In addition, a simple, qualitative approach has been proposed for determination of a membrane protein secondary structure, including β-strands associated with membranes, and topology in lipid bilayers based on PISEMA and HETCOR spectra [302]. Indeed, PISA wheels are extremely sensitive to the tilt, rotation, and twist of β-strands in the membrane. A “shotgun” NMR approach relies solely on the spectra from one uniformly and several selectively labeled 15N samples, and on the fundamental symmetry properties of PISA wheels to enable the simultaneous sequential assignment of resonances and the measurement of the orientationally dependent frequencies [303]. The shotgun NMR approach short-circuits the laborious and time-consuming process of obtaining complete sequential assignments prior to the calculation of a protein structure from the NMR data by taking advantage of the orientational information inherent to the spectra of aligned proteins.
A total of five two-dimensional 1H/15N PISEMA spectra, from one uniformly and four selectively 15N-labeled samples, were reported to be sufficient to determine the structure of the membrane-bound form of the 50 residue major pVIII coat protein of magnetically aligned fd filamentous bacteriophage, as shown in Fig. 29 [304]. The imperfections of the PISEMA sequence were overcome by the use of the HIMSELF or HERSELF sequence [305,306]. This method was utilized to determine the tilt of the transmembrane domain of the full-length uniformly-15N-labeled cytochrome-b5 in aligned bicelles under physiologically-relevant experimental conditions [307]. This study demonstrated the spectral editing approach to distinguish resonances from the soluble and transmembrane domains based on dynamical differences among them. It should also be noted that the combination of SLF and using aligned lipid bilayers have been powerful in providing insights into the mechanism of membrane disruption by antimicrobial peptides [308,309].
Fig. 29.

Model of a section of the Y21M fd filamentous bacteriophage capsid built from the coat protein subunit structure, which was determined byPISEMA spectra. The symmetry was derived from fiber diffractionstudies. (a) and (b): Representations of the electrostatic potential on themolecular surface of the virus. ((a) is a bottom view and (b) is a side view along thevirus axis). (c) and (d): Views of the capsid structure showing the arrangement of the coat proteins in pentamers and further assembly of the 2-fold helical structure. Reproduced with permission from [304]. Copyright 2003 National Academy of Sciences, U.S.A.
Numerous studies have utilized these approaches to address biological questions and to obtain structural insights: for transmembrane domains of M2 protein from influenza A [310], phospholambin [311–313,], membrane β-barrels [314], pore forming protein TatAd of the twin-arginine translocase [315], bacteriorhodopsin [316], and membrane-associated peptaibols ampullosporin A and alamethicin [317]. In all these applications, one could use CSA tensors accurately measured from model peptides to determine the structural parameters. These studies considerably benefit from the investigation of the variation of CSA tensors in proteins in different environments. PISA spectra of uniformly 15N-labeled chemokine receptor, CXCR1as a GPCR and selectively labeled E. coli diacylglycerol kinase (DAGK) were examined on the basis of PISEMA spectra recorded in magnetically aligned bicelles and liquid crystalline bilayers, respectively [318,319].
The determined torsion angles (Φ, ψ) of oriented sillk II structure of Bombyx mori silk fibroin, (−140°, 142°) for the Ala residues and (−139°, 135°) for the Gly residues [56,57], are very close to those proposed by X-ray diffraction [320,321]. Highly-oriented α-helical chains of poly(γ-benzyl L-glutamate) (PBLG) film can be prepared by evaporating slowly the solvent from the PBLG LC solution in a strong magnetic field of an NMR magnet [322]. It was demonstrated that there exists a linear relationship between the order parameter S of the α-helical polypeptide chains with respect to the applied magnetic field and the observed main-chain carbonyl 13C chemical shift, δobs, such that S = 0.024 × δobs − 3.758. Using the δobs value and the S-δobs relation, the order parameter S of PBLG in the liquid crystalline state at 300K was determined to be 0.875 ± 0.025.
4.2. CSA and dynamics
4.2.1 Solution NMR
Backbone fast picoseconds to nanosecond dynamics for biomacromolecules in solution has been extensively analyzed by the examination of their nuclear relaxation times, utilizing the model-free approach [248,323] based on a generalized order parameter, S, which is a measure of the spatial restriction of motions, and an effective correlation time, τe, which is a measure of the rate of motion. For the special case that the overall motion can be described by a single correlation time τM, our approach to extracting the unique information (i.e. S and τe) is based on the following simple equation for the spectral density S:
| (59) |
with
| (60) |
In addition, S is a model-independent measu re of the degree of spatial restriction of motion with the inequalities 0 ≤ S2 ≤ 1: if the internal motion is isotropic, then S = 0. If the motion is completely restricted, then S = 1.
The longitudinal relaxation rate (R1) for fast motions, as viewed from 15N or 13C nuclei, is the sum of the contributions of the dipole-dipole and CSA effects, and in the absence of the term of chemical exchange is given by
| (61) |
where d = −(μ0/(4π))γHγNh/(4π r3NH) and c = −ωN (δ|| − δ⊥) are dipole-dipole and CSA interactions, respectively. The relaxation data for 15N- enriched human ubiquitin are incompatible with isotropic rotational diffusion but agree well with an axially symmetric rotational diffusion with rotational diffusion anisotropy D||/D⊥ of 1.17, consistent with hydrodynamic calculations [324]. Anisotropic rotational diffusion of perdeuterated HIV protease complexed with the sub-nanomolar inhibitor DMP323 has been studied at two different magnetic field strengths [252].
Cross-correlation between 15N-1H dipolar and 15N CSA gives rise to different relaxation rates for the doublet components of 15N-{1H} backbone amides [250]. The relaxation interference is directly proportional to the generalized order parameter S2 of the N-H bonds in the peptide backbone, and this relation can be utilized to obtain approximate values for these order parameters. In contrast, Engelke and Rüterjans examined the backbone dynamics of uniformly 13C/15N-enriched ribonuclease T1 using carbonyl carbon relaxation times, to determine the order parameters (S2) and the effective internal correlation times (τi) [325]. Dayie and Wagner recorded proton-detected 13C,15N spectra of the N-terminal 14 kDa domain of the actin-binding protein, villin, at 9.4, 11.7, and 17.6T [326]. Three rate measurements were used to obtain the values of the spectral density functions at zero [J(0)], nitrogen [J(ωN)], and carbonyl [J(ωC)] frequencies. In addition, 13C carbonyl NMR studies are potentially useful for probing hydrogen-bond dynamics, as significantly different average J(0) values are observed for hydrogen-bonded and solvent-exposed carbonyls. The anisotropy of rapid fluctuations of peptide planes in ubiquitin is explored by combined 15N and 13C′ nuclear spin relaxation measurements and molecular dynamics (MD) computer simulation [327]. They show that the dominant fluctuation axes for the backbone 15N and 13C′ spins are nearly parallel to the Cαi−1-Cαi axes.
In contrast, the presence of slow motions for backbone and side-chains with a time-scale of millisecond to microsecond is more biologically relevant than the fast motions detectable by relaxation parameters for a variety of globular proteins in relation to their specific activity including transient formation of ligand-binding-competent states and transitions coupled to enzyme catalysis [328–330]. In such cases, contribution of the last term Rex in Eq. (44) should be taken into account. Indeed, the excess transverse relaxation rate (Rex) is expressed as a rate of the standard two site (A and B) exchange of nuclei between different conformations/states with different chemical shifts, which can be measured either by careful evaluation of R2 (see Eq. (44)) or by applying a train of 180° radio-frequency pulses separated by a delay of length τcp in the CPMG (Carr-Purcell-Meiboom-Gill) experiment. The value of Rex is given by [331]
| (63) |
where kex is the rate constant of the exchange process, Δδ is the chemical shift difference between the two conformations, A and B, while pa and pb are the fractional populations of A and B, respectively.
The internal mobility in 15N-enriched protein eglin c was analyzed as a frequency spectrum of NH bonds from the spectral density mapping at multiple fields [332]. Here, dynamic heterogeneity along the protein backbone is manifested most clearly in spectral density values at low frequencies (<100 MHz), indicating slow exchange processes manifested as an increase of Jeff(0) with the spectrometer field strength.
The temperature dependence of backbone motions in Escherichia coli ribonuclease HI was studied on a multi-time-scale by 15N spin relaxation [333,334]. Conformational exchange on a microsecond time-scale was observed for a large number of residues forming a continuous region of the protein that includes the coiled-coil formed by helices αA and αD. The temperature dependence of motion of the backbone N-H bond vectors on picoseconds to nanosecond time scales was characterized by the changes of the order parameter (S2), internal correlation time (τe), and phenomenological CPMG exchange rate constants (Rex) plotted versus residue number as shown in Fig. 30 [334].
Fig. 30.

Dynamical parameters obtained for RNase H from E. coli. Order parameters, S2, of 15N-H bond vectors are plotted versus residue number at (a) 285K, (b) 300 K and (c) 310K; internal correlation times, τe, are plotted at (d) 285K, (e) 300K, and (f) 310K; and phenomenological CPMG chemical exchange rate constants, Rex, are plotted versus residue number at (g) 285K, (h) 300 K and (i) 310K. At 285K, the value of Rex for Lys 60 is 23 ±4. At 300K, the resonance for Lys 60 is overlapped with the resonance for Ile 7 and cannot be quantified. Error bars are not shown for (a)–(c) for clarity; average uncertainities in S2 are 0.024, 0.011, and 0.010 for 285, 300 and 310K, respectively. Dark rectangles represent β-sheet regions and hatched rectangles represent α-helical region of RNase H. Reproduced with permission from [334]. Copyright 1996 American Chemical Society.
Analysis of spin relaxation parameters of 15N in a homodimeric protein of HIV-protease showed that the flaps that cover the active sites of the protein have terminal loops undergoing large amplitude motions on the ps to ns time scale, while the tips of the flaps undergo a conformational exchange on the μs time scale [335]. This enforces the idea that the flaps of the proteinase are flexible structures that facilitate function by permitting substrate access to and product release from the active site of the enzyme.
Measurements of 15N relaxation parameters have been used to characterize the backbone dynamics of the folded and denatured states of the N-terminal SH3 domain from the adapter protein drk, in high salt or guanidium chloride, respectively [336]. The levels of backbone dynamics in the folded protein show little variation across the molecule and are of similar magnitude to those determined previously. The denatured state of the domain, however, exhibits both more extensive and more heterogeneous dynamics than the folded state.
Relaxation properties of the backbone 15N nuclei were measured to study the rotational correlations of the two domains and properties of the linker region for phosphotransfer and Che Y-binding domains of the histidine autokinase CheA [337] and cell binding region of fibronectin [338]. In the former, flexible domain linkers and extended and flexible terminal polypeptide chains can have significant effects on the motional properties of adjacent structured regions. In the latter, non-specific protein-protein interactions provide the bulk of the thermodynamic stabilization and the motional constraints of the two modules.
The structure of the C-terminal RNA recognition domain of ribosomal protein L11 has been solved by 3D NMR [339]. Although the structure can be considered to be high-resolution in the core, 15-residues between helix α1 and strand β1 form an extended, unstructured loop. The loop is moving on a picosecond to nanosecond time scale in the free protein but not in the protein bound to RNA.
A strong correlation between phosphorylation-driven activation of the signaling protein NtrC, with two highly conserved components of histidine kinases and response regulators, and microsecond time-scale backbone dynamics as studied by 15N relaxation measurements has been reported [340]. The motions of NtrC in three functional states were characterized: unphosphorylated (inactive), phosphorylated (active), and a partially active mutant. These dynamics are indicative of exchange between inactive and active conformations.
Internal protein dynamics are intimately connected to enzyme catalysis. During catalytic action of the enzyme cyclophilin A, conformational fluctuations of the active site that occur on a time scale of hundreds of microseconds were detected by mapping the characteristic displacement of 15N chemical shifts and R2 relaxation rates [341]. The rates of conformational dynamics of the enzyme strongly correlate with the microscopic rates of substrate turnover.
The analysis of the exchange term in the R2 relaxation rates showed that the observed μs-ms dynamics in plastocyanin from the cyanobacteria Anabaena variabilis (A. v. PCu) are caused primarily by the protonation/deprotonation process of two histidine residues, His92 and His61, with His92 being ligated to the Cu (I) ion [342].
Dynamic requirements for a functional protein hinge in triosephosphate isomerase (TIM) were analyzed for the wild-type and a mutant at loop 6, PGG/GGG, by means of 1H, 15N, and 13CO chemical-shift differences, 15N R2 measurements [343]. These experiments elucidate an important principle of catalytic hinge design in proteins.
The backbone dynamics of domain III of the envelope proteins (E-D3) of Langat virus (LGT-E-D3) was investigated using 15N relaxation measurements [344]. Solution structure and dynamics of LGT-E-D3 suggested potential residues that could form a surface for molecular recognition, and thereby represent a target site for antiviral therapeutics design.
Millisecond time scale dynamics plays an important role and relaxation dispersion NMR spectroscopy has been particularly informative [345,346]. The integral membrane enzyme PagP reconstituted in detergent exists in equilibrium between two states, relaxed (R) and tense (T). A comparison of 15N chemical shifts between the two states indicates that major structural changes occur in the large extracellular L1 loop and adjacent regions of the β barrel. In addition to the R,T interconversion, other conformational exchange processes are observed in the R state, showing it to be quite flexible. Thus a picture emerges in which substrate entry is facilitated by the mobility of the R state, whereas the relatively rigid T state adopts a radically different conformation in a region of the protein known to be essential for catalysis. It has also been demonstrated that relaxation dispersion experiments make available kinetic, thermodynamic and structural information on “excited” states that often comprise only a few percent of the total population of molecules in solution and that cannot be observed directly in even the most sensitive NMR experiments [345,347,348]. The relaxation dispersion curve, probing the backbone amide 15N linewidth for SH3 domain from Fyn tyrosine kinase, was fitted to a three state model including F, folded, U, unfolded, and I, intermediate states, at temperatures, ranging from 15 to 35°C, at spectrometer fields of 500, 600 and 800 MHz and for all residues in the protein with sizable dispersions. It is thus possible to characterize in some detail the kinetics and thermodynamics of this folding/unfolding reaction.
As a complementary means to the widely used 15N T2 CPMG experiments, it was shown that slow motion in a protein can be detected by multiple refocusing of heteronuclear nitrogen/proton multiple quantum coherence, as demonstrated for I23 and T55 which are quite close in space although in different loops of ubiquitin [349].
4.2.2 Solid-state NMR
Peptides
It is expected that the backbones of small peptides in the solid-state are considered static compared with side chains. Nevertheless, it was shown that backbone dynamics of small peptides containing Gly-Gly residues can be detected by analyzing the 15N NMR line shapes powder pattern and the 13C T2 obtained under proton decoupling [197]. It was found that by lowering the temperature from 40°C to −120°C, the δ11 and δ22 values of Gly[15N]Gly shift to low and high field by 2.5 ppm, respectively, while the δ33 value is unchanged. The observed displacement of the principal values of the 15N chemical shift tensor was interpreted by taking account of librational motion with small amplitudes. This librational motion was interpreted in terms of a two-site jump model about the δ33 axis that is very close to the CαCα′ carbons from the connecting two peptide units with a jump angle of 17° and a jump frequency higher than 1 kHz, as required by the simulated spectra. The correlation times of the librational motions of the peptide plane was estimated as 2.3 × 10⁻⁴ s at ambient temperature by analyzing 13C T2 values in the presence of a 1H decoupling field of 50 kHz [350]. Here, it is noticed that the CSA for 15N amide and 13C carbonyl nuclei are of the order of 103 and 104 Hz, respectively, in view of the breadth of the respective tensors. This means that protein dynamics reflected in changes in CSA values are sensitive to the time scales of 10−3 to 10−4 s, respectively.
The dynamics of bee venom melittin, bound to magnetically oriented DMPC bilayers, can be visualized from the 13C NMR lineshapes of [1-13C]Gly3, Val5, Gly12, Leu16, and Ile20 labeled preparations recorded at various temperatures [351]. The 13C CSA values (δ// - δ⊥) of the carbonyl carbons obtained from a slow MAS experiment indicate that melitin undergoes rotation or reorientation of the whole α-helical rod about the average helical axis, parallel to the bilayer normal, rather than the helical axis.
The 13C and 31P NMR spectra of a transmembrane α-helical peptide, [1-13C]Ala14-labeled A(6-34) of bacteriorhodopsin (bR), incorporated in DMPC bilayers or in a magnetically aligned system containing dynorphin [A(6-34):dynorphin:DMPC = 4:10:100] were examined to clarify its dynamics and orientation in the lipid bilayer [106]. This peptide undergoes rapid rigid-body rotation about the helical axis at ambient temperature to produce an axially symmetric 13C CSA, whereas this symmetric anisotropy changes to an asymmetric pattern at temperatures below 10°C. 13C NMR spectra of [3-13C]-, [1-13C]- or [1-13C]Val-labeled transmembrane peptides of bR were also recorded in a lipid bilayer [273]. The 13C chemical shifts of the [3-13C]Ala-labeled peptides in the bilayer were displaced downfield by 0.3–1.1 ppm, depending upon the amino-acid sequence, with respect to those in the solid-state, which were explained in terms of local conformational fluctuations (>102 Hz) deviated from the torsion angles (αII-helix) from those of a standard α-helix, in an anisotropic environment. The carbonyl 13C peaks, on the other hand, are not signigicantly displaced by such local anisotropy fluctuations. Instead, they are more sensitive to the manner of hydrogen bonding interactions than the local anisotropy fluctuations.
A variable temperature solid-state 15N NMR study on lipid vesicles containing magainin 2 revealed its backbone dynamics [352]. The backbone dynamics of a channel-forming second-transmembrane segment of GABA receptor in lipid bilayers has been determined using PISEMA experiments [353]. The effect of whole-body motion on the peptide orientations obtained from calculated PISEMA spectra was analyzed [354]. It was shown that wheel-like patterns are still preserved, and it is possible to determine the average peptide tilt and azimuthal rotation angles using simple static models for the spectral fitting, as demonstrated for the model peptide, WLP23, in a lipid membrane.
The effects of cholesterol on the dynamics of pardaxin and its ability to form ion-channels and disrupt bacterial cell membranes have been investigated using PISEMA experiments [355].
The dynamic structure of disulfide-removed linear analogs of tachyplesin-I (TP-I), where four Cys residues were replaced by aromatic and aliphatic residues, in bacteria-mimetic POPE/POPG bilayer have been studied by solid-state NMR [356]. The active TP-I and TPF4 are both highly mobile in the liquid crystalline phase of the membrane while the inactive TPA4 is completely immobilized. The different mobilities are revealed by the temperature-dependent 13C and 15N spectra, 13C-H and 15N-H dipolar couplings and 1H rotating frame spin-lattice relaxation times.
Fibrous proteins
The data obtained from proton decoupled 13C NMR spectra of reconstituted fibrils of chick calvaria collagen enriched at the glycine Cα and C′ positions are consistent with a model in which collagen molecules reorient about the long axis of the helix with a rotational diffusion constant (R1) of ~107 s−1 [357]. The full-width of the glylcyl carbonyl powder pattern is 103 ppm which is substantially smaller than the rigid lattice value 144 ppm, which provides further evidence for motion in the fibril [358]. The powder line width of [1-13C]Gly-labeled collagen, Δ = δzz - δxx at 22°C for the uncross-linked reconstituted collagen fibril is 108 ppm, whereas the maximum value of delta (140 ppm) is observed for the cross-linked and mineralized collagen fibrils in rat calvaria [359]. The line shapes were analyzed using a model in which azimuthal orientation of the collagen backbone is assumed to fluctuate as a consequence of reorientation about the helix axis. Fluctuations in azimuthal orientation are smaller in cross-linked tendon and demineralized calvaria collagen fibers than in reconstituted collagen fibers. It was shown that slow motions having large amplitudes will be sensed by the line shape but not the relaxation times [360].
Characterization of slow segmental dynamics in solids has been developed by the centerband-only detection of exchange (CODEX) NMR experiment which employs recoupling of the CSA under MAS before and after a long mixing time during which molecular reorientations may occur [361,362]. By an analysis in terms of the difference tensor of the chemical shifts before and after the mixing time, the dependence on the reorientation angle is obtained analytically for uniaxial interactions, and a relation to 2D exchange NMR patterns has been established. This technique was applied to a triblock hydrogel protein ACA [363]. Its CODEX mixing time dependence revealed a detectable decaying component with a correlation time of about 80 ms.
Fast and slow dynamics of collagen fibrils at various hydration levels were examined by13C CPMAS experiments [270,364]. Fast motions with correlation times much shorter than 40 μs were detected by dipolar couplings measured by the DIPSHIFT experiment [365], and by the CSA values of the carbon sites in collagen. These motionally averaged anisotropic interactions provide a measure of the amplitudes of the segmental motions as described by a segmental order parameter. The data reveal that increasing hydration has a much stronger effect on the amplitude of the molecular processes than increasing temperature. In particular, the CODEX experiment showed that the Hyp residues in the hydrated state have an appreciable level of mobility in the millisecond range.
2H, 13C, and 15N NMR spectra of the fd bacteriophage coat protein were used to analyze the motions of their aromatic amino acids [366]. The presence of background signals from natural abundant nuclei in the 13C-labeled sample, however, represents a serious obstacle to line shape analysis, as illustrated in the 13C NMR spectra of [13Cε]Tyr-labeled fd. The slow MAS spectrum (0.38 kHz) arising from the narrow sidebands from Tyr residues was recorded to distinguish the powder pattern from the natural abundance background. The calculated powder pattern from the sideband intensities is consistent with the difference spectrum between the labeled and unlabeled static samples and indicates that the Phe and Tyr rings undergo 180° flips about the Cβ-Cγ bond axis at a rate greater than 106 Hz, as well as small-amplitude rapid motions in other directions. The dynamics of the coat protein in fd bacteriophage has also been studied by 15N and 2H NMR experiments [367,368], which showed that the virus particles and the coat protein subunits are immobile on the time scales of the 15N CSA (103 Hz) and 2H quadrupole (106 Hz) interactions. PISEMA spectra of the Pf1 bacteriophage indicate that at 30°C, some of the coat protein subunits assume a single, fully structured conformation, and some have a few mobile residues that provide a break between two helical segments, in agreement with structural models from X-ray fiber and neutron diffraction [369]. The structural basis of the temperature-dependent transition of Pf1 was also examined [370]. The dynamics in this protein as revealed by studies of order parameters characterizing bond vector dynamics [371] show that the subunit backbone is static. In contrast to the backbone, several side-chains reveal large-amplitude angular motions. Side-chains on the virion exterior that interact with solvent are highly mobile, but the side chains of residues arginine 44 and lysine 45 near the DNA deep in the interior of the virion are also highly mobile.
Membrane proteins
The presence of fast motions with a ps to ns time-scale can readily be identified in the solid-state by observing that certain NMR peaks in spectra recorded by CPMAS are appreciably suppressed as compared with those in spectra recorded by DDMAS (direct detection or dipolar decoupled magic angle spinning). For instance, fully-hydrated membrane proteins which are arranged on a 2D lattice in bilayers (2D crystals) are far from being rigid bodies at ambient temperature, in spite of 3D pictures currently available from x-ray diffraction studies at very low temperature [372–374], as demonstrated by extensive studies on [3-13C]Ala- or [1-13C]Val-labeled bacteriorhodopsin (bR) as a typical membrane protein from the purple membrane (PM) of Halobacterium salinarum [107,279,375–379]. Indeed, 13C NMR studies on specifically 13C amino-acid labeled bR showed that bR undergoes several types of motion even in a 2D crystal at ambient temperature, depending upon the site of interest, revealing fast (> 108 Hz), slow (μs-ms) (104 to 105 Hz) or very slow (102 Hz) motions, as described below [24,107,281, 376, 377]. Well-separated 15N NMR spectra of green variant of [15N-z-Lys]proteorhodopsin (GPR), a photoactive retinylidene protein in marine bacterioplanktons, were recorded from 2D crystals formed with a hexagonal packing in DOPC bilayer, due to efficient cross-polarization in the non-freezing state (280K) [380]. In contrast, it is noted that additional conformational fluctuations with frequencies of the order of 104 to 105 Hz are induced when monomeric bR is reconstitututed in a lipid bilayer in the absence of 2D crystalline lattice, leading to strongly modified spectral features [381].
The presence of the fast motion is ascribed to the N- and C-terminal portions of [3-13C]Ala-bR even in 2D crystal, undergoing isotropic motion which leads to suppression of cross-polarization from the protons, as demonstrated by the gray peaks in Fig. 26 [107, 382]. This portion of the spectrum includes the peaks from the C-terminal α-helix protruding from the membrane surface [383–385] with reference to the peak-positions of the conformation-dependent 13C chemical shifts [23,24]. In a similar manner, 13C signals from the surface area turned out to be visible only in DDMAS spectra for a variety of fully-hydrated membrane proteins, including pharaonis phoborohodopsin (ppR) (or sensory rhodpsin SRII) [285,386], its truncated transducer pHtrII (1–159) [387], and E. coli diacylglycerol kinase (DGK) [388].
In contrast, it is expected that CPMAS NMR signals from 13C labeled sites in portions of hydrophobic [1-13C]Val or Ile residues are free from such suppression of peaks caused by fast motion, because they are not always located at such flexible positions in the surface area of lipid bilayers [281]. However, there may be additional reasons for suppressed NMR signals, such as the failure of peak-narrowing caused by interference of a slow motional frequency with either proton decoupling [350] or MAS [389]. Such slow motions on the μs-ms time scale, if encountered in proteins in solution can be readily identified also in the solid, by observations of suppressed or recovered peak-intensities (SRI) by both CPMAS or DDMAS experiments [350,389]. Indeed, a 13C NMR line width 1/πT2C of the residue under consideration could be considerably broadened, when a motional frequency of an incoherent random fluctuation motion interferes with either the coherent frequency of the proton decoupling or MAS. In such cases, the overall transverse relaxation rate 1/T2C given by [197]
| (63) |
can be dominated by the second or third terms, where (1/T2C)S which is the transverse component due to static C-H dipolar interactions, and (1/T2C)MDD and (1/T2C)MCS are the transverse components due to the fluctuation of dipolar coupling and chemical shift interactions in the presence of internal fluctuation motions, respectively. The latter two terms are given as a function of the correlation time τc by
| (64) |
| (65) |
Here, γI and γS are the gyromagnetic ratios of I (proton) and S (carbon) nuclei, respectively, and r is the internuclear distance between spins I and S, and the summation is over pairs of I-S nuclei. The angular frequencies ω0 and ωI are the carbon resonance frequency and the amplitude of the proton decoupling RF field, respectively. ωr is the rate of spinner rotation. δ is the CSA and η is the asymmetric parameter of the chemical shift tensor. It is expected that a decoupling field of 50 kHz is sufficient to reduce the static component and the (1/T2C)MCS term will be dominant in the overall 1/T2C, as far as the carbonyl signals with larger chemical shift anisotropies are concerned. Consequently, the maximum of the line-broadening occurs when the frequency of the incoherent motion is near ωr, and thus effect is called interference of motional frequency with the MAS frequency. Of course, it is possible to avoid this interference from frequency in the order of typically 104 Hz by increasing the spinning rate up to as fast as 20 kHz. In such case, however, one should take special precaution to prevent unnecessary heating of samples as well as dehydration due to a centrifuging effect on fully hydrated membrane proteins. In this connection, it was demonstrated, on the basis of 15N chemical shifts of [ζ-15N]Lys of a Schiff’s base, that pressure-induced isomerization of retinal on bR occurs at an increased MAS frequency of 12 kHz, corresponding to the sample pressure of 63 bar, resulting in the decreased equilibrium constant of [all trans-bR]/[13-cis bR] leading to structural change in the vicinity of retinal [390]. This finding was explained in terms of a disrupted or distorted hydrogen bond network by means of a constantly applied pressure. The presence of the two backbone conformations at Tyr185 caused by such a retinal configuration in the dark, light and pressure adapted bR has been extensively studied by REDOR filtered experiments [391].
It is more practical to observe the expected intensity change as a function of temperature or pH which might indirectly vary with the frequency dispersion as expressed in Eqs (64) or (65). A typical example for such suppressed or recovered peak- intensities (SRI) is shown in the 13C CPMAS NMR spectra of the [13C]Val-labeled D85N mutant of bR recorded at various pH [392–394]. As shown in Fig. 31, raising the pH of this mutant from 7 to 10 (leading to the M-like state, mimicking the M photo-intermediate without photo-illumination) resulted in additional spectral changes in which several peaks were suppressed together when raising pH to 10, while the others were recovered. In particular, the intensities of the five peaks in D85N, 177.31 ppm (V213), 175.69 ppm (unassigned), 174.98 ppm (V217), 173.2 ppm (unassigned), and 172.3 ppm (V49), decreased with the raised pH, while the intensities of the two peaks, 171.8 ppm (V69,130) and 172.8 ppm (V34), increased, as demonstrated in Fig. 32, by taking into account that raising pH is related to accelerate fluctuation as a result of conformational change from the L to M-like state of bR. This situation occurs in the M-like state of D85N at higher pH or bacterio-opsin (bO) [383] in which specific retinal-protein interaction is partly or completely removed by neutralization of the negative charge at Asp 85 or its absence, respectively.
Fig. 31.

100.6 MHz 13C CPMAS NMR spectra of [1-13C]Val-labeled D85N mutant at various pH values: (a) pH 6, (b) 8, (c) 9, (d) 10, and (e)11. The assignment of peaks is based on newly performed experiments [377], and also corrected ones from older spectra [401]. Reproduced f with permission from [395]. Copyright 2010 Elsevier.
Fig. 32.

Suppressed or recovered intensities (SRI) plots for D85N mutant against pH. The peak intensities are either increased or decreased with increased pH, depending upon the respective peaks, except for the peak V151, 167, 180 whose intensity is unchanged. Reproduced with permission from [395]. Copyright 2010 Elsevier.
A similar SRI change was more clearly visualized for synthetic hydrophilic polymers, poly(acrylate)s, by plotting their DDMAS peak-intensities as a function of temperature [395]. Several intensity minima were noted at different temperatures for the different individual sites in the polymer side-chains, indicating the presence of fluctuation motions with correlation times of the order of 10−5 s at particular temperatures.
Bacteriorhodopsin (bR) from purple membrane (PM) is packed to form a trimeric unit which is further assembled into a hexagonal lattice as a native 2D (liquid) crystal [396]. As demonstrated already, 13C NMR signals of [3-13C]Ala- (Fig. 26) or [1-13C]Val-labeled bR preparation adopting such 2D crystal are well resolved in DDMAS NMR spectra or CPMAS spectra at ambient temperature. Nevertheless, it was found that several 13C NMR signals from the surface areas are suppressed for [1-13C]Gly-, Ala-, Leu-, Phe- and Trp-labeled bR from PM, owing to the presence of conformational fluctuations with a correlation time of the order of 10−4 s interfering with frequency of magic angle spinning (4 kHz) [377,384]. This is related to a possible conformational fluctuation, in 2D crystal, around the Cα-Cβ bond in the side-chains of amino-acid residues as expressed by Cα-CβH2X system. The conformational space allowed for fluctuation is limited to a very narrow area for Val or Ile residues with a bulky side-chain at Cβ, leading to a limited range for χ1, the rotation angle around the Cα-Cβ bond, as demonstrated by Cα-CβHYZ where Y and Z are CH3 and CH3 or CH2CH3, respectively [228]. This is the reason why the 13C NMR signals are observed from [1-13C]Val- or Ile-labeled bR preparations in 2D crystal, but partially suppressed for other types of [1-13C]amino-acid labeled preparations. This surface dynamics was also examined by measurements of site-specific 13C-H dipolar coupling of [3-13C]Ala-bR by 2D dipolar and chemical shift (DIPSHIFT) correlation techniques [397]. Dynamic feature of [1-13C]Pro-labeled bR together with the kinked structure has been investigated by 13C NMR [398]. The contribution of Glu residues at the extracellular site to the conformation and dynamics was extensively investigated by examination of a variety of [3-13C]Ala- or [1-13C]Val- mutants, E9Q, E74Q, E194Q/E204Q (2Glu), E9Q/E194Q/E204Q (3Glu), E9Q/E74Q/E194Q/E204Q (4Glu) [399]. Significant dynamic changes were induced for the triple- or quadruple mutants by acquisition of global fluctuation motions with correlation times 10−4 or 10−5 s in the disorganized trimeric form. The dynamic aspects of the extracellular loop region as a proton release pathway of bR were studied by measuring a variety of relaxation times [400]. The 13C and 15N T1 values of V199/P200 indicate that the long FG loop has a fast fluctuation motion with a frequency of 108 Hz. However, the 13C and 15N T2 values of V69/P70 indicate that the BC loop (connecting the B and C transmembrane α-helices) of bR is involved in a rigid β-sheet structure in spite of possessing large amplitude motions.
In contrast, it is noteworthy that several Ala Cβ 13C NMR signals arising from the surface areas (8.7 Ǻ depth), including the most downfield peaks in the loops (Ala 196,160 and 103) and the low-field region of the transmembrane α helices (16–17 ppm) are almost completely or partially suppressed, respectively, when 2D crystals were disrupted or disorganized as in W80L and W12L mutants, caused by the absence of Trp 80 or 12 located at the key positions for specific lipid-helix interaction, leading to modified lipid-helix and helix-helix interactions) [401], or monomer in regenerated lipid bilayers [402,403]. At the same time, the carbonyl 13C NMR signals from the transmembrane α-helices and loops of monomeric bR were also almost completely suppressed in preparations including [1-13C] Gly-, Ala-, Val-labeled bR because of fluctuation motions with correlation times in the order of 10−4 s [377, 381,402].
15N spectral peaks of fully-hydrated [15N]Gly-bR obtained via cross-polarization are suppressed at 293K due to interference with proton decoupling frequency, and also because of short values of T2 in the loops [403]. The motion of the transmembrane α-helices in bR is strongly affected by the freezing of excess water at low temperatures. It was shown that motions in the 10 μs correlation regime may be functionally important for the photocycle of bR, and protein-lipid interactions are motionally coupled in this dynamic regime.
Pharaonis phoborhodopsin ppR (or sensory rhodopsin II) is also a heptahelical transmembrane retinylidene protein, and active as a sensor for negative phototaxis on binding with the cognate transducer pHtrII. It was demonstrated that the surface structure of ppR near the E-F loop plays a dominant role to regulate membrane surface dynamics when pPR is complexed with truncated pHtrII (1–159) through direct interaction of the C-terminal α-helix in the former with the cytoplasmic α-helical region of the latter [404]. Assuming that the break of the hydrogen bonding between C and G helices is a trigger of phototaxis signal, the D75N mutant of ppR was used as a “quasi”-activated receptor [405]. Clear dynamical changes of the C-terminal tip portion of the receptor (104–105 Hz) were observed when the receptor bound to the transducer and the complex changed to the “quasi”-signaling state. This can be named as a “switch model” as shown in Fig. 33: the cytoplasmic α-helix in the transducer interacts with the C-terminal helices of the receptor, leading to the activation of the receptor. The interaction site at the linker switches to the linker region of the paired transducer. This formation of a paired transducer may further relay the signals to phosphorylation cascade.
Fig. 33.

Schematic representation of the manner of interaction of the C-terminal α-helical tip region in ppR (a) and D75N (b) with the transmembrane and cytoplasmic α-helices of pHtrII (1-159). The helix-helix interactions between the cytoplasmic α-helices is also presented. Elliptical dark gray areas and open areas show the enhanced and weakened interaction parts, respectively. Reproduced with permission from [461]. Copyright 1981 Elsevier.
Interestingly, a preparation of non-crystalline green-absorbing proteorhodopsin (GP) with higher lipid to protein ratio of 0.5: 1 (w/w) gave well-resolved multi-dimensional solid-state NMR spectra in samples with different patterns of reverse labeling [406,407], even though 2D (liquid) crystalline preparation at a very low lipid to protein ratio of ~0.25 (w/w) was shown to be more favorable for its solid-state NMR studies [380,408]. The assigned peaks of 13C and 15N nuclei for 153 residues, with a particularly high density in the transmembrane regions (~75% of residues), based on 3D and 4D sequential chemical shift assignments permitted a detailed examination of the secondary structure and dynamics of GPR [407]. Experimental evidence of mobility was shown for proteorhodopsin in the lipid environment at the protein’s termini and of the A-B, C-D, and F-G loops, the latter being possibly coupled to the GPR ion-transporting function. Further, it appears that use of high-field NMR (at 800 MHz for 1H) together with fast-MAS might be a favorable procedure to minimize the number of 13C or 15N suppressed peaks caused by interference between the frequency of fluctuation motions and MAS frequency occurring at intermediate magnetic field (400 MHz for 1H) as observed for reconstituted non-crystalline bR [381], leading to strong protein-protein interactions [408].
Globular proteins
The signal intensities and linewidths of 13C and 15N nuclei in 56 residues in β1 immunoglobulin binding domain of protein G (GB1) vary as a function of amino acid position and temperature [409]. High-resolution spectra have been observed near room temperature (280K) and at <180K, whereas resolution and sensitivity greatly degrade near 210K; the magnitude of this effect is greatest among the side chains of residues at the intermolecular interface of the microcrystal lattice, which can be attributed to intermediate-rate translational diffusion of solvent molecules near the glass transition.
Multidimensional SLF experiments have been used to study the backbone and side chain conformational dynamics of ubiquitin, a globular microcrystalline protein [410]. Molecular conformational order parameters were obtained from heteronuclear dipolar couplings, and they were correlated to assigned chemical shifts, to obtain a global perspective on the sub-microsecond dynamics in microcrystalline ubiquitin. A total of 38 Cα, 35 Cβ and multiple side chain unique order parameters were collected, and the high mobility of ubiquitin in the microcrystalline state is revealed. In general the side chains show elevated motion in comparison with the backbone sites. Two review articles on the structure and dynamics of membrane-associated peptides [411] and protein dynamics [412] have appeared.
The averaging of 15NHα/β multiplet components by 1H decoupling induces effective relaxation of the 15N coherence when the N–H spin pair undergoes significant motion. High resolution 15N solid-state NMR spectra can then only be recorded by application of TROSY type techniques which select the narrow component of the multiplet pattern, as demonstrated for solid-state 15N spectra of chicken α-spectrin SH3 domain [413]. It was speculated that this averaging effect has been the major obstacle to successful NMR spectroscopic characterization of many membrane proteins and fibrillar aggregates examined so far.
4.3 31P CSA of phospholipids in biomembranes
The 100% natural abundance, high gyromagnetic ratio, and the presence of phosphorus-31 in the phosphate group of phospholipids present in the biological cell membrane make this nucleous as an excellent probe for NMR investigation of the structure and dynamics of lipid bilayer model membranes, as well as for studies of ligand-membrane interactions. As discussed below, the 31P CSA is highly sensitive to hydration, temperature, the presence of ions, and ligand-lipid interactions.
4.3.1 Unoriented lipid bilayers
Phospholipids in biomembranes of living cells are predominantly organized as a bilayer structure which provides a barrier between the cell interior and its environment. Membrane proteins embedded therein mediate various functions such as transport of appropriate molecules into or out of the cell, catalysis of chemical reactions, receiving and transducing chemical signals from the cell environment, etc. Proton-decoupled 31P NMR spectra of 1,2-dipalmitoyl-sn-glycero-3- phosphocholine (DPPC), for instance, exhibit quite different spectral patterns depending upon its water content [414]. At 0 wt% H2O, a static phosphodiester moiety of this phospholipid yields the 31P NMR powder pattern typical of axial asymmetry, with the three principal components, δ11, δ22 and δ33, which span some 190 ppm, and which have almost identical values for various phospholipids [415]. This spectrum collapses from the axial asymmetric to an axial symmetric pattern, due to the onset of molecular motion at a water content over 10 wt % H2O, when the sample enters a micellar liquid crystalline state[414]. The molecules move within the micelles, which have a bilayer structure, such that a symmetry axis is created perpendicular to the bilayer surface, yielding an axially symmetric 31P NMR powder pattern, consisting of a peak at the high field (δ⊥) with a low field shoulder (δ11) with Δδ = |δ11 - δ⊥| ~ 47 ppm [416]. Here, δ11 and δ⊥are the peak-positions corresponding to the components of the shift tensor parallel and perpendicular to the symmetry axis, respectively. The values of Δδ for both saturated and unsaturated phosphatidylcholines in the liquid crystalline state are very similar (in the range of 43–47 ppm) and do not vary appreciably (≤ 5%) over the temperature range investigated. The largest change in Δδ arises on the addition of an equimolecular concentration of cholesterol to 16:0/16:0-phosphatidylcholine, for which Δδ is decreased from about 45 ppm to 36 ppm [416]. Thus, the 31P NMR powder patterns of all phospholipids can be used as a characteristic feature of liquid crystalline lipid bilayers in addition to measure the orientation and average fluctuation of the phosphate segment [417–419].
It is also noted that with the possible exception of phosphatic acid [420], all glycerol-based phospholipids, as well as the most abundant mammalian phosphoshingolipid and sphigomyelin, have similar values of Δδ, resulting in almost equivalent lineshapes for these different species when in the liquid crystalline bilayer phase [417]. At low temperature, however, the rotation is expected to slow or cease (gel phase lipids) resulting in the axially asymmetric pattern again, as seen in the temperature-dependent 31P NMR spectra of DPPC, together with the simulated spectra described by two diffusion coefficients R11 (fast motion) and R⊥ (net slow motion) [421]. It is obvious that the spectral feature varies strongly with the value of fast diffusion coefficient. For relatively small membrane fragments (<10, 000Å), however, the rate of overall isotropic diffusion is also important, leading to further averaging of spectral components [422].
Biomembranes are thought to contain functional domains (lipid rafts) made up in particular of sphingomyelin and chol esterol, glycolipids and certain proteins, as detergent-resistant membranes in Triton X-100. They are discussed in terms of liquid-ordered (lo) and -disordered (ld) bilayer and micellar phases [423]. Distinguishing individual lipid headgroup mobility and phase transitions in raft-forming lipid mixtures has been examined by using 31P CSA measurements [423,424].
4.3.2 Oriented lipid bilayers
Revealing the secondary structure of 13C- or 15N-labeled peptides or proteins embedded in lipid bilayers is feasible by careful analysis of the orientational constraints of the dipolar interaction or chemical shift anisotropies with respect to the applied magnetic field via bilayer normal [425–428]. Three types of oriented lipid bilayers have been increasingly utilized: (1) mechanically oriented lipid bilayers obtained by shear between glass plates [429,430]; (2) magnetically oriented bicelles consisting of lipid-detergent aggregates [431–433]; (3) magnetically oriented large unilamellar vesicles [434,435]. Aluminum oxide nanotubes have also been used for oriented samples in solid-state NMR studies. The unique advantage of this approach was recently utilized to identify the islet amyloid polypeptide (IAPP or amylin) induced membrane fragmentation by solid-state NMR spectroscopy [436].
The sample preparation protocol for mechanically oriented bilayers was improved to achieve a minimal dispersion of the bilayer normal and minimal amounts of unoriented sample, as viewed from both the 31P CSA, which is very sensitive to such orientation, and optical microscopy [437]. It was demonstrated that adding sublimable solid such as naphthalene or para-dichloro benzene to a lipid-peptide solution in CHCl3/CH2OH (1:1 molar ratio) and its removal yielded significantly enhanced alignment of all sorts of lipids, including palmitoyloleoylphosphatidylethanolamine (POPE) [438]. Optimizing the alignment of oriented lipid samples has been achieved for bilayer and hexagonal phases on a mica surface [439].
Bicelles are lipid-detergent aggregates of DMPC with certain detergents [440,441], either short-chain phosphatidylcholine, dihexanoyl- phosphatidylcholine (DHPC), or a zwitter ion bile salt derivative, CHAPSO. The function of the short-chain molecules is to coat the edges of the bilayered sections to protect the longer phospholipid chains from exposure to water. Bicellar size varies as a function of the molar ratio [DMPC]/[DHPC] (with a diameter ≈ 10–100 nm). The anisotropy of he magnetic susceptibility Δχ of the bicelles when 2 < [DMPC]/[DHPC] < 6 leads to their alignment in the spectrometer magnetic field with the bilayer normal orthogonal to the field [440,442]. The phospholipid bicelles posess great potential as membrane mimetics for structural studies. The addition of small amounts of paramagnetic ions change the sign of Δχ and has the effect of flipping the alignment of the phospholipids bicelles, making NMR measurements possible for the two types of orientations, parallel and perpendicular, to the magnetic field. The presence of bulk water enables proper folding of membrane proteins especially for the loops and C- or N-terminal regions exposed to aqueous phase, even though major transmembrane helical regions are embedded within the lipid bilayers. Therefore these model membranes are considered to be highly valuable for NMR studies. In addition, the variation of the lipid:detergent ratio can be utilized to prepare near-isotropic to rigid bicelles for solution-like to solid-state-like NMR experiments [306].
A DMPC bilayer containing a moderately high concentration of melittin (DMPC: melittin = 10:1 molar ratio) is subject to lysis and fusion at temperatures lower and higher than the gel to liquid crystalline phase transition temperature, Tc, respectively [434]. The magnetically aligned, elongated vesicles are formed at a temperature above Tc as shown from 31P NMR and microscopic observation. Opioid peptide dynorphin A (1–17) is also shown to strongly interact with DMPC bilayer to cause fusion and lysis across the phase transition temperature between the gel and liqid crystalline temperature and results in subsequent magnetic ordering at a temperature above Tc [435].
4.3.3 Polymorphism: non-bilayer lipids
Besides the bilayer, lamellar phase lipids can form other phases, such as hexagonal H11 and cubic phases, depending upon the lipid type and molecular shape, the presence of other lipid molecules, water content, temperature, etc. [417,443–446]. If the lipid phase changes from lamellar to hexagonal, the 31P CSA, Δδ, changes its sign and is reduced by exactly a factor of two [414,417,419]. The cylinders in a hexagonal phase have a very small radius, and therefore lateral diffusion about the cylinder axis can cause further averaging of tensor components.
Lipids assuming the hexagonal (H11) phase may be considered to exhibit a “cone” shape, where the polar headgroup region is at the smaller end of the cone [417]. Lysophospholipids to display an “inverted cone” shape where the cross sectional area of the polar group is larger than that subtended toward the end of the acyl chain. This shape has been suggested as the reason why the 31P signal is that typical of an isotropic environment in these micellar phases. Indeed, the smaller headgroup of phosphatidylethanolamines as compared to phosphatidylcholine would be expected to result in a reduced area per molecule at the lipid-water interface, thus producing a cone shaped molecule compatible with the H11 phase [417]. Alternatively, increased unsaturation in the acyl chain region leads to a more pronounced cone shape, fully compatible with the requirement for a minimal degree of unsaturation for H11 phase phosphatidylethanolamine [447]. Further, increased amplitude of the thermal motion of the acyl chains at elevated temperature leads to a cone shape compatible with that H11 structure, as seen in both pure phosphatidylethanolamines [447] and mixed lipid systems [448,449]. The ability of cholesterol to induce H11 phase formation in certain mixed lipid systems [448,449] is also consistent with a cone shape for cholesterol [450,451].
The integrity of membranes as bilayers is maintained by a balance of intermolecular forces in the acyl and headgroup regions of lipids. The geometric packing properties of different lipids may be conveniently expressed in terms of the dimensionless critical packing parameter [452,453],
| (66) |
where v and l0 are their hydrocarbon volume and critical (or maximum) length that the chains can assume, respectively, and a0 is their optimal surface area of the headgroup (minimum at a certain head-group area). If f < 0.5 such lipids normally form micelles and are entropically and energetically unlikely to form bilayers. If f > 1 such lipids cannot even pack into bilayers since their headgroup area is too small; instead, they form inverted micellar structures. If 0.5 < f <1 these lipids are packed into bilayers. Support for this shape concept of lipid structure was shown to depend on the effects of lipid packing [454], additivity of the packing parameter [455], and headgroup volume [456,457].
The phase behavior is largely the result of a delicate balance of forces in the headgroup and acyl-chain regions. Mismatches in packing in either region induce a tendency toward membrane curvature which is offset by similar changes in the apposed leaflet in lipids; consequently, the curvature is not expressed (frustrated curvature stress), but is stored as potential energy with a latent ability to destabilize the bilayer structure [458]. The frustration of lipid layer curvature is measured calorimetrically [459] or shown to reflect in the acyl chain order measured by 2H NMR in the Lα phase [460]. In the latter, for a given temperature, increased order is observed when the curling tendencies of the lipid plane are more pronounced. The effects of membrane constituents, such as drugs, detergent, or hydrocarbons on the La →H11 transition temperature, TH, were examined to provide a quantitative, widely applicable, index of the ability of membrane constituents to induce curvature stress in model bilayers [458,461–463]. The phase transition can be conveniently monitored by recording 31P chemical shift spectra as illustrated in Fig. 34 [461]. It was shown that n-dodecane induces the formation of the reversed hexagonal (H11) phase of dioleylphosphatidylcholine (DOPC)-n-dodecane-H2O system at low and high water concentrations, and a cubic phase (giving rise to an isotropic 31P NMR peak) at low water content [464]. The translational diffusion coefficient of DOPC in the cubic phase is more than an order of magnitude smaller than the lateral diffusion coefficient of DOPC in an oriented lipid bilayer which can be attributed to restricted lipid translational motion caused by closed lipid aggregates [465]. A membrane-mimicking system consisting of a lipid cubic phase containing a membrane protein which allowed the formation of three-dimensional protein crystals amenable to X-ray crystallography has been reported [466, 467].
Fig. 34.

31P NMR spectra recorded at 81.0 MHz of egg phosphatidylcholethanolamine at the indicated temperatures. (a) in the absence of alcohol, (b) in the presence of ethanol (ethanol to phospholipid molar ratio = 4.5), (c) in the presence of decanol (decanol to phospholipid molar ratio = 0.45) Reproduced with permission from [461]. Copyright 1981 Elsevier.
Membrane fusion, in which two separate membranes merge into a single bilayer is mediated by certain lipids or proteins, and is involved in various biological processes such as fertilization, endo- or exocytosis, viral infection, etc. Fusion of erythrocyte ghosts was shown to proceed through formation of H11 phase, in the presence of oleic acid as “fusogenic” agent, by changes in the 31P NMR spectra change [454]. The fact that many lipid species can adopt or induce such bilayer destabilization suggested that this may be a general mechanism of fusion in in vivo [417]. Segments of viral fusion proteins play an important role in viral fusion where viral infection proceeds with aid of fusion proteins [468]. A common property of a number of fusion peptides is that they lower the bilayer to hexagonal phase transition temperature (TH) of phosphatidylethanolamine, indicating that they promote negative curvature [469]. This property is well correlated with conditions that lead to membrane fusion. For example, the fusion peptide from influenza virus lowers TH at acidic pH where the virus is fusogenic, but not at neutral pH where the rate of fusion is slow [470]. There is also a correlation between the fusion activity of viral mutants and the ability to lower TH of the influenza virus [471]. The promotion of negative curvature by fusion peptides is in accord with the requirement to increase the negative curvature of the contacting monolayers to form the hemifusion intermediate [472,473].
4.3.4 Lipid-protein or peptide interactions
Even though biomembranes are predominantly arranged as bilayers, some lipid components of biomembranes spontaneously form non-lamellar phase of inverted hexagonal as well as cubic phases [469,474,475]. In addition, proteins and peptides can influence the tendency of lipids to form bilayer or non-lamellar forms. Indeed, a possible role of rhodopsin in maintaining bilayer structure has been demonstrated: the 31P NMR spectra of extracted lipids from rhodopsin are characteristic of the hexagonal H11 phase and an isotropic phase, although the lipids in the photo-receptor membrane are almost exclusively organized in a bilayer [476]. The integral membrane protein, cytochrome c oxidase, has a stabilization effect on the bilayer organization of cardiolipin, in that it inhibits the formation of the Ca2+-induced, H11 phase of this lipid for Ca2+/cardiolipin molar ratios of 1–10 [477]. Further, it is interesting to note that hydrophobic mismatch in length between the hydrophobic part of membrane spanning proteins and the hydrophobic bilayer thickness affects both lipid and protein sides, either phase transition temperature or formation of non-lamellar phases for the former, or protein activity and stability, protein aggregation, tilt, localization at membrane surface, protein/peptide backbone conformation, etc for the latter [474,475]. For instance, gramicidin A is able to convert the stable bilayer form of dioleoylphosphatidylcholine (DOPC) into an H11 phase at high concentration [478]. The localization of the α-helical peptides in the H11 phase was proposed to be similar to that for gramicidin [479]. When a 17 amino acid residue long peptide (WALP17) was incorporated in a 1/10 molar ratio of peptide to diacylphosphatidylcholine, a bilayer was maintained in saturated phospholipids containing acyl chains of 12 and 14 C atoms, an isotropic phase was formed at 16 C atoms, and an inverted hexagonal phase at 18 and 20 C atoms. Further, it is proposed that this ability of the peptides to induce non-bilayer structures in phosphatidylcholine model membranes is due to the presence of tryptophans at both sides of the membrane/water interface, which prevent the peptide from aggregation when the mismatch is increased.
Lipid modulation of protein activity is also a very interesting issue: the activity of protein kinase C (PKC), when bound to membranes in a cubic phase prepared from monoolein with 1-palmitoyl-2-oleoyl-3-phosphatidylserine (MO/PS) or dielaidoylphosphatidylethanolamine/almethicin (EEPE/alamethicin), has a higher specific activity than that bound to vesicle bilayers [480]. It was proposed that there being little or no curvature strain in the cubic phase might be responsible for the activation of PKC, in addition to its physiological relevance due to the apparent presence of the cubic phase in certain biological structures. The photochemical process of rhodopsin in membrane is coupled with a conformational change associated with the conversion of metarhodopsin I (MI) to metharhodopsin II (MII). This transition is favored in membrane by relatively small headgroup of the lipid which produce a condensed bilayer surface of a comparatively small interfacial areas as in the case of phosphatidylethanolamine (PE), giving rise to a curvature stress of the lipid/water interface of the reverse hexagonal H11 phase at slightly higher temperature [481].
Any peptide that greatly changes the spontaneous monolayer curvature of a stable bilayer will promote vesicle leakage: peptides which promote either positive or negative curvature can be hemolytic [469]. In particular, the antimicrobial peptide, magainin, can induce the formation of pores in phospholipid bilayers with a high curvature [482]. 31P NMR spectra of mechanically aligned bilayers containing the amphipathic, helical peptide MSI-78, an analogue of magainin, in 1-palmitoyl-2-oleoyl-phosphtidylcholine (POPC), have been recorded to reveal its cell membrane permeation mechanism [483]. In POPC bilayer, unusual 31P NMR spectra were obtained from mechanically aligned samples containing 1–5% peptide, consistent with the formation of toroidal pores similar to the pores formed by magainin2. The toroidal pore geometry was characterized using 31P NMR experiments. Similar studies have recently been extended to other bilayers containing antimicrobial peptides [484]. At a higher concentration (> 10 mole % peptide), the formation of a peptide-induced H1 phase (27%) was observed besides toroidal pore (73%) in POPC bilayer, from the experimental and simulated spectra as seen in Fig. 35(A) and (B), corresponding to the parallel and perpendicular orientations, respectively.
Fig. 35.

Experimental and simulated 161.979 MHz 31P-chemical shift spectra of POPC bilayers containing 10% MSI-78. (a) Parallel orientation, (b) perpendicular orientation. The best-fitting simulations combined lipids in toroidal pores (73%) in an HI phase (27%). The spectral parameters for the simulation of the toroidal pore component: σ|| = 26 ppm, σ⊥ = −15 ppm, 2 ppm linebroadening; for the H I phase component, σ|| = −15 ppm, σ⊥ = 5.3 ppm, and 1.5 ppm line broadening. The experiments were performed at 30°C. Reproduced with permission from [483]. Copyright 2003 Biophysical Society.
Secondary structure and alignment of lysine-anchored hydrophobic model peptides in phosphatidylcholine have been examined as a function of hydrophobic mismatch [485]. When the helix is much longer than the width of the membrane, both the lipid and the peptide order are perturbed, while sequences that are much shorter show little effect on the phospholipid headgroup order, but the peptides exhibit a wide range of orientational distributions but which are predominantly close to being parallel to the membrane surface. The influence of an antimicrobial peptide, protegrin-1 (PG-1), on the curvature and lateral diffusion coefficient of phosphocholine bilayers has been investigated using 1D and 2D 31P exchange NMR [486]. PG-1 maintains the structural integrity of the dilaurylphosphatidylcholine (DLPC) bilayer and only reduces the lateral diffusion coefficient due to its binding. In contrast, PG-1 fragments the POPC vesicles, reducing the vesicle radius by about a factor of 3. Simulations of the 2D exchange spectra yielded quantitative reorientation-angle distributions that are consistent with the bimodal distributions of the vesicle curvature and the effects of the peptide on the two types of lipid bilayers. The membrane lysing mechanism of the carboxy-amide of pardaxin (Pla), of a 33-amino-acid residues, on bilayers of various composition was also studied by 31P NMR [487]. It was shown that Pla significantly disrupts bilayers composed of only zwitterionic lipids, particularly bilayers composed of POPC. P1a also reduces the lamellar to hexagonal phase-transition temperature TH at very low concentrationat very low concentrations (1:50,000), which is interpreted as the formation of a cubic phase and not micellization of the membrane.
RTD-1 from rhesus macaque leukocytes is an 18-residue cyclic peptide taking a β-hairpin structure, and exhibiting broad-spectrum antimicrobial activity. It was shown to cause moderate orientational disorder when incorporated into PC bilayers, independent of the bilayer thickness, suggesting that this peptide binds to the surface of PC bilayers without perturbing the hydrophobic core [488].
Amyloid β-peptide (Aβ) is a major component of plaques in Alzheimer’s disease, and formation of senile plaques has been suggested to originate from regions of neuronal membrane rich in gangliosides. In this connection, it was demonstrated that Aβ (1–40) strongly perturbs the bilayer structure of mechanically oriented dimyristoylphosphatidylcholine (DMPC), leading to three lipid phases, namely a lamellar phase, a hexagonal phase and non-oriented lipids in the DMPC/Aβ and DMPC/GM1/Aβ systems [489]. The latter two phases are induced by the presence of the Aβ peptide, and facilitated by GM1.
5 Concluding Remarks
In the present article, we have covered experimental and theoretical aspects of the complete set of chemical shifts for peptides and proteins. They include isotropic (δiso) and anisotropic (δ11, δ22 and δ33) shifts and the asymmetric factor (η), which are undoubtedly some of the most important NMR parameters for characterization of a given molecular system, including structural and dynamical characterization. The isotropic shifts alone occur in solution NMR, leaving the others as hidden parameters. Currently, however, a knowledge of the CSA parameters is becoming increasingly important for solution NMR studies of larger proteins at higher magnetic field strength, where such parameters allow one for optimized experimental conditions. In the present article, we have covered a wide range of topics both in the solid-state and solution NMR, reported over a rather a long time-span from 1960 to present, and dealing with problems associated with measuring and interpreting the isotropic and chemical shifts. We feel that the interpretation of the CSA data is still undeveloped as compared to the data of isotropic chemical shifts, which has achieved greater success for application to various problems. NMR studies involving the measurement and utilization of CSA parameters are increasingly being used to tackle greater challenging biological problems related to protein-protein complexes and other biopolymers like DNA and RNA. We believe that the development such as use of higher magnetic field spectrometers and ultrafast spinning MAS probes will continue to broaden the scope of application of chemical shift parameters.
Acknowledgments
The authors are grateful to their current and former colleagues and students for their excellent contributions and stimulating discussions during their research studies cited herein. A.R acknowledges the funding support from NIH.
Abbreviations
- CODEX
centerband-only detection of exchange
- CPMAS
cross polarization magic angle spinning
- CPMG
Carr-Purcell-Meiboom-Gill
- CRAMPS
combined rotational and multipulse spectroscopy
- CRINEPT
polarization transfer by cross-correlated relaxation approach
- CSI
chemical shift index
- CSA
chemical shift anisotropy
- DDMAS
dipolar-decoupled or direct-detection magic angle spinning
- DIPSHIFT
dipolar and shift correlation
- DFT
density functional theory
- DSS
2,2-dimethylsilapentane-5-sulfonic acid
- DUMBO
decoupling using mind boggling optimization
- FFLG
Flip-flop Lee-Goldburg
- FPT-INDO
finite perturbation theory-intermediate neglect of differential overlap
- HETCOR
heteronuclear correlation spectroscopy
- HIMSELF
heteronuclear isotropic mixing leading to spin exchange via the local field
- HERSELF
heteronuclear rotating-frame spin exchange via the local field
- HSQC
heteronuclear single quantum coherence
- MADMAT
magic angle decoupling and magic angle turning
- MAS
magic angle spinning
- MAT
magic angle turning
- MQMAS
multiple quantum MAS
- PAS
principal axis system
- PASS
phase adjusted spinning sideband
- PHORMAT
phase corrected MAT
- PISA
polarity index slant angle
- PISEMA
polarization inversion spin exchange at magic angle
- REDOR
rotational echo double resonance
- ROCSA
recoupling of chemical shift anisotropy
- SASS
switching angle spinning
- SLF
separated-local-field
- SUPER
separation of undistorted powder patterns by effortless recoupling
- TALOS
torsion angle likelihood obtained from shifts and sequence similarity
- TROSY
transverse relaxation-optimized spectroscopy
Footnotes
Publisher's Disclaimer: This is a PDF file of an unedited manuscript that has been accepted for publication. As a service to our customers we are providing this early version of the manuscript. The manuscript will undergo copyediting, typesetting, and review of the resulting proof before it is published in its final citable form. Please note that during the production process errors may be discovered which could affect the content, and all legal disclaimers that apply to the journal pertain.
Contributor Information
Hazime Saitô, Email: hsaito@siren.ocn.ne.jp.
Isao Ando, Email: solidnmr@aol.com.
Ayyalusamy Ramamoorthy, Email: ramamoor@umich.edu.
References
- 1.Pople JA, Schneider WG, Bernstein HJ. High-resolution Nuclear Magnetic Resonance. McGraw-Hill; 1959. [Google Scholar]
- 2.Slichter CP. In: Principles of Magnetic Resonance, 1963. Harper, Row, editors. Springer; 1989. [Google Scholar]
- 3.Harris RK. Nuclear Magnetic Resonance Spectroscopy, Longman Scientific and Technical. 1983, 1986. [Google Scholar]
- 4.Becker ED. Theory and Chemical Applications. Academic Press; 1969, 1980, 2000. High Resolution NMR. [Google Scholar]
- 5.Ernst RR, Bodenhausen G, Wokaun A. Principles of Nuclear Magnetic Resonance in One and Two Dimensions. Oxford: 1987. [Google Scholar]
- 6.Levitt MH. Spin Dynamics, Basics of Nuclear Magnetic Resonance. Wiley; 2002. [Google Scholar]
- 7.Harris RK, Becker ED, de Menezes SMC, Granger P, Hoffman RE, Zilm KW. Pure and Appl Chem. 2008;80:59–84. [Google Scholar]
- 8.Haeberlen U. High Resolution NMR in Solids, Selective Averaging. Academic Press; 1976. [Google Scholar]
- 9.Mehring M. High Resolution NMR in Solids. Springer; 1983. [Google Scholar]
- 10.Mason J. Solid State NMR. 1993;2:285–288. doi: 10.1016/0926-2040(93)90010-k. [DOI] [PubMed] [Google Scholar]
- 11.Abragam A. Principles of Nuclear Magnetism. Clarendon Press; 1962. [Google Scholar]
- 12.Fyfe CA. Solid State NMR for Chemists. CFC Press; 1983. [Google Scholar]
- 13.Gerstein BC, Dybowski CR. Transient Techniques in NMR of Solids, An Introduction to Theory and Practice. Academic Press; 1985. [Google Scholar]
- 14.Engelhardt G, Michel D. High-Resolution Solid-State NMR of Silicates and Zeolites. John Wiley & Sons; 1987. [Google Scholar]
- 15.Schmidt-Rohr K, Spiess HW. Multidimensional Solid-State NMR and Polymers. Academic Press; 1994. [Google Scholar]
- 16.Pervushin K, Riek R, Wider G, Wüthrich K. Proc Natl Acad Sci USA. 1997;94:12366–12371. doi: 10.1073/pnas.94.23.12366. [DOI] [PMC free article] [PubMed] [Google Scholar]
- 17.Salzmann M, Pervushin K, Wider G, Senn H, Wüthrich K. Proc Natl Acad Sci USA. 1998;95:13585–13590. doi: 10.1073/pnas.95.23.13585. [DOI] [PMC free article] [PubMed] [Google Scholar]
- 18.Riek R, Wider G, Pervushin K, Wüthrich K. Proc Natl Acad Sci USA. 1999;96:4918–4923. doi: 10.1073/pnas.96.9.4918. [DOI] [PMC free article] [PubMed] [Google Scholar]
- 19.Pervushin K. Q Rev Biophys. 2000;33:161–197. doi: 10.1017/s0033583500003619. [DOI] [PubMed] [Google Scholar]
- 20.Fernandez C, Wider G. Curr Opinion Struct Biol. 2003;13:570–580. doi: 10.1016/j.sbi.2003.09.009. [DOI] [PubMed] [Google Scholar]
- 21.Fushman D, Cowburn D. Meth Enzymol. 2001;339:109–126. doi: 10.1016/s0076-6879(01)39312-6. [DOI] [PubMed] [Google Scholar]
- 22.Saitô H. Magn Reson Chem. 1986;24:835–852. [Google Scholar]
- 23.Saitô H, Ando I. Ann Rept NMR Spectrosc. 1989;21:210–290. [Google Scholar]
- 24.Saitô H, Ando I, Naito A. Solid State NMR Spectroscopy for Biopolymers, Principles and Applications. Springer; 2006. [Google Scholar]
- 25.Spera S, Bax A. J Am Chem Soc. 1991;113:5490–5492. [Google Scholar]
- 26.Wishart DS, Sykes BD, Richards FM. J Mol Biol. 1991;222:311–333. doi: 10.1016/0022-2836(91)90214-q. [DOI] [PubMed] [Google Scholar]
- 27.Szilágyi L. Prog NMR Spectrosc. 1995;27:325–443. [Google Scholar]
- 28.Wishart DS, Sykes BD. Meth Enzymol. 1994;239:363–392. doi: 10.1016/s0076-6879(94)39014-2. [DOI] [PubMed] [Google Scholar]
- 29.Wylie BJ, Rienstra CM. J Chem Phys. 2008;128:052077. doi: 10.1063/1.2834735. [DOI] [PubMed] [Google Scholar]
- 30.Shoji A, Ando S, Kuroki S, Ando I, Webb GA. Annu Rep NMR Spectrosc. 1993;26:55–98. [Google Scholar]
- 31.Veeman WS. Prog NMR Spectrosc. 1984;16:193–235. [Google Scholar]
- 32.Shao L, Titman JJ. Prog NMR Spectrosc. 2007;51:103–137. [Google Scholar]
- 33.Wu G. Prog NMR Spectrosc. 2008;52:118–169. [Google Scholar]
- 34.Ando I, Asakura T, editors. Solid State NMR of Polymers. Elsevier Science; Amsterdam: 1998. [Google Scholar]
- 35.Antzutkin ON. In: Solid-state NMR Spectroscopy: Principles and Applications. Duer MJ, editor. Vol. 280. Blackwell Sciences; Oxford: 2002. [Google Scholar]
- 36.Ramamoorthy A. NMR Spectroscopy of Biological Solids. CRC Press; Cleveland: 2005. [Google Scholar]
- 37.Gerstein BC, Dybowski CR. Transient Techniques in NMR of Solids, An Introduction to Theory and Practice. Academic Press; Orlando: 1985. [Google Scholar]
- 38.Antzutkin ON. Prog NMR Spectrosc. 1999;35:203–266. [Google Scholar]
- 39.Duncan TM. A Compilation of Chemical Shift Anisotropies. The Farragut Press; Chicago: 1990. [Google Scholar]
- 40.Ando I, Webb GA. Theory of NMR Parameters. Academic Press; London: 1983. [Google Scholar]
- 41.Ando I, Saitô H, Tabeta R, Shoji A, Ozaki T. Macromolecules. 1984;17:457–461. [Google Scholar]
- 42.Asakawa N, Kuroki S, Kurosu H, Ando I, Shoji A, Ozaki T. J Am Chem Soc. 1992;114:3261–3265. [Google Scholar]
- 43.de Dios AC, Pearson JG, Oldfield E. Science. 1993;260:1491–1495. doi: 10.1126/science.8502992. [DOI] [PubMed] [Google Scholar]
- 44.Jiao D, Barfield M, Hruby VJ. J Am Chem Soc. 1993;115:10883–10887. [Google Scholar]
- 45.de Dios AC, Oldfield E. J Am Chem Soc. 1994;116:11485–11488. [Google Scholar]
- 46.de Dios AC. Prog NMR Spectrsoc. 1996;29:229–278. [Google Scholar]
- 47.Fukui H. Prog NMR Spectrosc. 1997;31:317–342. [Google Scholar]
- 48.Shoji A, Ozaki T, Fujito T, Deguchi K, Ando I, Magoshi J. J Mol Struct. 1998;441:251–266. [Google Scholar]
- 49.Asakawa N, Kameda T, Kuroki S, Kurosu H, Ando S, Ando I, Shoji A. Annu Rep NMR Spectrosc. 1998;35:55–135. [Google Scholar]
- 50.Ando I, Asakura T. In: NMR Chemical Shift Map, in Modern Magnetic Resonance. Webb GA, editor. Vol. 1. Springer; Dordrecht: 2006. pp. 33–38. [Google Scholar]
- 51.Sitkoff D, Case DA. Prog NMR Spectrosc. 1998;32:165–190. [Google Scholar]
- 52.Ando I, Kuroki S, Kurosu H, Yamanobe T. Prog NMR Spectrosc. 2001;39:79–133. [Google Scholar]
- 53.Kuroki S, Yamauchi K, Ando I, Shoji A, Ozaki T. Curr Org Chem. 2001;5:1001–1016. [Google Scholar]
- 54.Xu X-P, Case DA. Biopolymers. 2002;65:408–423. doi: 10.1002/bip.10276. [DOI] [PubMed] [Google Scholar]
- 55.Naito A, Ganapathy S, Akasaka K, McDowell CA. J Chem Phys. 1981;74:3190–3197. [Google Scholar]
- 56.Nicholson LK, Asakura T, Demura M, Cross TA. Biopolymers. 1993;33:847–861. doi: 10.1002/bip.360330513. [DOI] [PubMed] [Google Scholar]
- 57.Demura M, Minami M, Asakura T, Cross TA. J Am Chem Soc. 1998;120:1300–1308. [Google Scholar]
- 58.Lee DK, Witterbort RJ, Ramamoorthy A. J Am Chem Soc. 1998;120:8868–8874. [Google Scholar]
- 59.Shekar SC, Ramamoorthy A, Wittebort RJ. J Magn Reson. 2002;155:257–262. doi: 10.1006/jmre.2002.2518. [DOI] [PubMed] [Google Scholar]
- 60.Bloembergen N, Rowland JA. Acta Metall. 1953;1:731–746. [Google Scholar]
- 61.Wu CH, Ramamoorthy A, Opella SJ. J Magn Reson A. 1994;109:270–272. [Google Scholar]
- 62.Ramamoorthy A, Gierasch LM, Opella SJ. J Magn Reson B. 1996;110:102–106. doi: 10.1006/jmrb.1996.0016. [DOI] [PubMed] [Google Scholar]
- 63.Lee DK, Ramamoorthy A. J Magn Reson. 1998;133:204–206. doi: 10.1006/jmre.1998.1442. [DOI] [PubMed] [Google Scholar]
- 64.Wei YF, Lee D-K, Ramamoorthy A. Chem Phys Lett. 2000;324:20–24. [Google Scholar]
- 65.Hartzell CJ, Pratum TK, Drobny GP. J Chem Phys. 1987;87:4324–4331. [Google Scholar]
- 66.Maricq MM, Waugh JS. J Chem Phys. 1979;70:3300–3316. [Google Scholar]
- 67.Van Vleck JH. Phys Rev. 1948;74:1168–1183. [Google Scholar]
- 68.Herzfeld J, Berger AE. J Chem Phys. 1980;73:6021–6030. [Google Scholar]
- 69.Fenzke J, Maess B, Pfeifer H. J Magn Reson. 1990;88:172–176. [Google Scholar]
- 70.de Groot HJM, Smith SO, Kolbert AC, Courtin JML, Winkel C, Lugtenburg J, Herzfeld J, Griffin RG. J Magn Reson. 1991;91:30–38. [Google Scholar]
- 71.Hodgkinson P, Emsley L. J Chem Phys. 1997;107:4808–4816. [Google Scholar]
- 72.Bax A, Szeverenyi NM, Maciel GE. J Magn Reson. 1983;52:147–152. [Google Scholar]
- 73.Gan Z. J Am Chem Soc. 1992;114:8307–8309. [Google Scholar]
- 74.Terao T, Fujito T, Onodera T, Saika A. Chem Phys Lett. 1984;107:145–148. [Google Scholar]
- 75.Hu JZ, Wang W, Liu F, Solum MS, Alderman DW, Pugmire RJ, Grant DM. J Magn Reson. 1995;113:21–222. [Google Scholar]
- 76.Dixon WT. J Chem Phys. 1982;77:1800–1809. [Google Scholar]
- 77.Kolbert AC, Griffin RG. Chem Phys Lett. 1990;166:87–91. [Google Scholar]
- 78.Antzutkin ON, Shekar SC, Levitt MH. J Magn Reson. 1995;A115:7–19. [Google Scholar]
- 79.Antzutkin ON, Lee YK, Levitt MH. J Magn Reson. 1998;135:144–155. doi: 10.1006/jmre.1998.1576. [DOI] [PubMed] [Google Scholar]
- 80.Tycko R, Dabbagh G, Mirau PA. J Magn Reson. 1989;85:265–274. [Google Scholar]
- 81.Witter R, Hesse S, Sternberg U. J Magn Reson. 2003;161:35–42. doi: 10.1016/s1090-7807(02)00188-x. [DOI] [PubMed] [Google Scholar]
- 82.Witter R, Sternberg U, Ulrich AS. J Am Chem Soc. 2006;128:2236–2243. doi: 10.1021/ja051730f. [DOI] [PubMed] [Google Scholar]
- 83.Orr RM, Duer MJ. J Magn Reson. 2006;181:1–8. doi: 10.1016/j.jmr.2006.03.010. [DOI] [PubMed] [Google Scholar]
- 84.Liu SF, Mao JD, Schmidt-Rohr K. J Magn Reson. 2002;155:15–28. doi: 10.1006/jmre.2002.2503. [DOI] [PubMed] [Google Scholar]
- 85.Hong M, Yao XL. J Magn Reson. 2003;160:114–119. doi: 10.1016/s1090-7807(02)00140-4. [DOI] [PubMed] [Google Scholar]
- 86.Chan JCC, Tycko R. J Chem Phys. 2004;118:8378–8389. [Google Scholar]
- 87.Facelli JC, de Dios AC. ACS Symp Ser. Vol. 732. 1999. Modeling NMR Chemical Shifts, Gaining Insights into Structure and Environment. [Google Scholar]
- 88.Karadakov P. Ab Initio Calculation of NMR Shielding Constants. In: Webb GA, editor. Modern Magnetic Resonance. Vol. 1. Springer; Dordrecht: 2006. pp. 59–66. [Google Scholar]
- 89.Harris RK, Becker ED, de Menezes SMC, Goodfellow R, Granger P. Pure Appl Chem. 2001;73:1795–1818. [Google Scholar]
- 90.Saitô H, Naito A. Biochim Biophys Acta. 2007;1768:3145–3161. doi: 10.1016/j.bbamem.2007.08.026. [DOI] [PubMed] [Google Scholar]
- 91.Morcombe CR, Zilm KW. J Magn Reson. 2003;162:479–486. doi: 10.1016/s1090-7807(03)00082-x. [DOI] [PubMed] [Google Scholar]
- 92.Taki T, Yamashita S, Satoh M, Shibata A, Yamashita T, Tabeta R, Saitô H. Chem Lett. 1981:1803–1806. [Google Scholar]
- 93.Müller D, Kricheldorf HR. Polym Bull. 1981;6:101–108. [Google Scholar]
- 94.Kricheldorf HR, Müller D. Macromolecules. 1983;16:615–623. [Google Scholar]
- 95.Saitô H, Tabeta R, Shoji A, Ozaki T, Ando I. Macromolecules. 1983;16:1050–1057. [Google Scholar]
- 96.Kricheldorf HR, Mutter M, Müller D, Forster D. Biopolymers. 1983;22:1357–1382. [Google Scholar]
- 97.Saitô H, Iwanaga Y, Tabeta R, Narita M, Asakura T. Chem Lett. 1983:427–430. [Google Scholar]
- 98.Shoji A, Ozaki T, Saitô H, Tabeta R, Ando I. Macromolecules. 1984;17:1472–1479. [Google Scholar]
- 99.Lee DK, Ramamoorthy A. J Phys Chem B. 1999;103:271–275. [Google Scholar]
- 100.Wildman KAH, Lee DK, Ramamoorthy A. Biopolymers. 2002;64:246–254. doi: 10.1002/bip.10180. [DOI] [PubMed] [Google Scholar]
- 101.Wildman KAH, Wilson EE, Lee D-K, Ramamoorthy A. Solid State NMR. 2003;24:94–109. doi: 10.1016/s0926-2040(03)00048-1. [DOI] [PubMed] [Google Scholar]
- 102.Saitô H, Tabeta R, Asakura T, Iwanaga Y, Shoji A, Ozaki T, Ando I. Macromolecules. 1984;17:1405–1412. [Google Scholar]
- 103.Ishida M, Asakura T, Yokoi M, Saitô H. Macromolecules. 1990;23:88–94. [Google Scholar]
- 104.Saitô H, Tabeta R, Shoji A, Ozaki T, Ando I, Miyata T. Biopolymers. 1984;23:2279–2297. doi: 10.1002/bip.360231111. [DOI] [PubMed] [Google Scholar]
- 105.Saitô H, Yokoi M. J Biochem (Tokyo) 1992;111:376–382. doi: 10.1093/oxfordjournals.jbchem.a123765. [DOI] [PubMed] [Google Scholar]
- 106.Huster D, Schiller J, Arnold K. Magn Reson Med. 2002;48:624–632. doi: 10.1002/mrm.10272. [DOI] [PubMed] [Google Scholar]
- 107.Kimura S, Naito A, Tuzi S, Saitô H. Biopolymers. 2002;63:122–131. doi: 10.1002/bip.10021. [DOI] [PubMed] [Google Scholar]
- 108.Saitô H, Tuzi S, Yamaguchi S, Tanio M, Naito A. Biochim Biophys Acta. 2000;1460:39–48. doi: 10.1016/s0005-2728(00)00128-6. [DOI] [PubMed] [Google Scholar]
- 109.Pauling L, Corey RB. Proc Natl Acad Sci USA. 1951;37:729–740. doi: 10.1073/pnas.37.11.729. [DOI] [PMC free article] [PubMed] [Google Scholar]
- 110.Hempel A, Camerman N, Camerman A. Biopolymers. 1991;31:187–192. doi: 10.1002/bip.360310207. [DOI] [PubMed] [Google Scholar]
- 111.Tycko R. Methods Enzymol. 2006;413:103–122. doi: 10.1016/S0076-6879(06)13006-2. [DOI] [PMC free article] [PubMed] [Google Scholar]
- 112.Asakura T, Okonogi M, Nakazawa Y, Yamauchi K. J Am Chem Soc. 2006;128:6231–6238. doi: 10.1021/ja060251t. [DOI] [PubMed] [Google Scholar]
- 113.Ando S, Ando I, Shoji A, Ozaki T. J Am Chem Soc. 1988;110:3380–3386. [Google Scholar]
- 114.Kameda T, Takeda N, Kuroki S, Kurosu H, Ando S, Ando I, Shoji A, Ozaki T. J Mol Struct. 1996;384:17–23. [Google Scholar]
- 115.Tsuchiya K, Takahashi A, Takeda N, Asakawa N, Kuroki S, Ando I, Shoji A, Ozaki T. J Mol Struct. 1995;350:233–240. [Google Scholar]
- 116.Yamanobe T, Ando I, Saitô H, Tabeta R, Shoji A, Ozaki T. Bull Chem Soc Jpn. 1985;58:23–29. [Google Scholar]
- 117.Yamanobe T, Ando I, Saito H, Tabeta R, Shoji A, Ozaki T. Chem Phys. 1985;99:259–264. [Google Scholar]
- 118.Asakawa N, Kurosu H, Ando I. J Mol Struct. 1994;323:279–285. [Google Scholar]
- 119.Asakawa N, Kurosu H, Ando I, Shoji S, Ozaki T. J Mol Struct. 1994;317:119–129. [Google Scholar]
- 120.Wishart DS, Sykes BD, Richards FM. J Mol Biol. 1991;222:211–333. doi: 10.1016/0022-2836(91)90214-q. [DOI] [PubMed] [Google Scholar]
- 121.Wishart DS, Richards FM, Sykes BD. Biochemistry. 1992;31:1647–1651. doi: 10.1021/bi00121a010. [DOI] [PubMed] [Google Scholar]
- 122.Wishart DS, Sykes BD. J Biomol NMR. 1994;4:171–180. doi: 10.1007/BF00175245. [DOI] [PubMed] [Google Scholar]
- 123.Powers R, Garrett DS, March CJ, Frieden EA, Gronenborn AM, Clore GM. Biochemistry. 1992;31:4334–4346. doi: 10.1021/bi00132a026. [DOI] [PubMed] [Google Scholar]
- 124.Iwadate M, Asakura T, Williamson MP. J Biomol NMR. 1999;13:199–211. doi: 10.1023/a:1008376710086. [DOI] [PubMed] [Google Scholar]
- 125.Shoji A, Ozaki T, Fujito T, Deguchi K, Ando I. Macromolecules. 1987;20:2441–2445. [Google Scholar]
- 126.Shoji A, Ozaki T, Fujito T, Deguchi K, Ando S, Ando I. Macromolecules. 1989;22:2860–2863. [Google Scholar]
- 127.Shoji A, Ozaki T, Fujito T, Deguchi K, Ando S, Ando I. J Am Chem Soc. 1990;112:4693–4697. [Google Scholar]
- 128.Ashikawa M, Shoji A, Ozaki T, Ando I. Macromolecules. 1999;32:2288–2292. [Google Scholar]
- 129.Glushka J, Lee M, Coffin S, Cowburn D. J Am Chem Soc. 1989;111:7716–7722. [Google Scholar]
- 130.Le H, Oldfield E. J Biomol NMR. 1994;4:341–348. doi: 10.1007/BF00179345. [DOI] [PubMed] [Google Scholar]
- 131.Le H, Oldfield E. J Phys Chem. 1996;100:16423–16428. [Google Scholar]
- 132.Saitô H, Nukada K, Kato H, Yonezawa T, Fukui K. Tetrahedron Lett. 1965:111–117. [Google Scholar]
- 133.Saitô H, Nukada K. J Am Chem Soc. 1971;93:1072–1076. [Google Scholar]
- 134.Saitô H, Tanaka Y, Nukada K. J Am Chem Soc. 1971;93:1077–1081. [Google Scholar]
- 135.Witanowski M, Webb GA. Nitrogen NMR. Plenum; London and New York: 1973. [Google Scholar]
- 136.Levy GC, Lichter RL. Nitrogen-15 Nuclear Magnetic Resonance Spectroscopy. John Wiley and Sons; New York: 1979. [Google Scholar]
- 137.Kuroki S, Ando S, Ando I, Shoji A, Ozaki T, Webb GA. J Mol Struct. 1990;240:19–29. [Google Scholar]
- 138.Kuroki S, Ando S, Ando I, Shoji A, Ozaki T, Webb GA. J Mol Struct. 1991;245:69–81. [Google Scholar]
- 139.Naito A, Tuzi S, Saitô H. Eur J Biochem. 1994;224:729–734. doi: 10.1111/j.1432-1033.1994.00729.x. [DOI] [PubMed] [Google Scholar]
- 140.Fukutani A, Naito A, Tuzi S, Saitô H. J Mol Struct. 2002;602–603:491–503. [Google Scholar]
- 141.Harbison GS, Herzfeld J, Griffin RG. Biochemistry. 1983;22:1–5. doi: 10.1021/bi00270a600. [DOI] [PubMed] [Google Scholar]
- 142.de Groot HJM, Smith SO, Courtin J, van den Berg E, Winkel C, Lugtenburg J, Griffin RG, Herzfeld J. Biochemistry. 1990;29:6873–6883. doi: 10.1021/bi00481a017. [DOI] [PubMed] [Google Scholar]
- 143.Hu JG, Sun BQ, Petkova AT, Griffin RG, Herzfeld J. Biochemistry. 1997;36:9316–9322. doi: 10.1021/bi970416y. [DOI] [PubMed] [Google Scholar]
- 144.Hu JG, Griffin RG, Herzfeld J. J Am Chem Soc. 1997;119:9495–9498. [Google Scholar]
- 145.Mark-Jurkauskas ML, Bajaj VS, Hornstein MK, Belenky M, Griffin RG, Herzfeld J. Proc Natl Acad Sci USA. 2008;105:883–888. doi: 10.1073/pnas.0706156105. [DOI] [PMC free article] [PubMed] [Google Scholar]
- 146.Eilers M, Reeves PJ, Ying W, Khorana HG, Smith SO. Proc Natl Acad Sci USA. 1999;96:487–492. doi: 10.1073/pnas.96.2.487. [DOI] [PMC free article] [PubMed] [Google Scholar]
- 147.Clayden NJ, Williams RJP. J Magn Reson. 1982;49:383–396. [Google Scholar]
- 148.Dalgarno DC, Levine BA, Williams RJP. Biosci Rept. 1983;3:443–452. doi: 10.1007/BF01121955. [DOI] [PubMed] [Google Scholar]
- 149.Pardi A, Wagner G, Wüthrich K. Eur J Biochem. 1983;137:445–454. doi: 10.1111/j.1432-1033.1983.tb07848.x. [DOI] [PubMed] [Google Scholar]
- 150.Asakura T, Ando I, Nishioka A. Makromol Chem. 1977;178:1111–1132. [Google Scholar]
- 151.Asakura T, Nakamura E, Asakawa H, Demura M. J Magn Reson. 1991;93:355–360. [Google Scholar]
- 152.Ösapay K, Case DA. J Am Chem Soc. 1991;113:9436–9444. [Google Scholar]
- 153.Williamson MP, Asakura T, Nakamura E, Demura M. J Biomol NMR. 1992;2:83–98. doi: 10.1007/BF02192802. [DOI] [PubMed] [Google Scholar]
- 154.Ösapay K, Case DA. J Biomol NMR. 1994;4:213–230. doi: 10.1007/BF00175249. [DOI] [PubMed] [Google Scholar]
- 155.Wishart DS, Bigam CG, Holm A, Hodges RS, Sykes BD. J Biomol NMR. 1995;5:67–81. doi: 10.1007/BF00227471. [DOI] [PubMed] [Google Scholar]
- 156.Haigh CW, Mallion RB. Prog NMR Spectrosc. 1980;13:303–344. [Google Scholar]
- 157.McConnell HM. J Chem Phys. 1957;27:226–229. [Google Scholar]
- 158.Tigelaar HL, Flygare WH. J Am Chem Soc. 1972;94:343–346. doi: 10.1021/ja00757a005. [DOI] [PubMed] [Google Scholar]
- 159.Williamson MP, Asakura T. J Magn Reson B. 1993;101:63–71. [Google Scholar]
- 160.Shoji A, Kimura H, Ozaki T, Sugisawa H, Deguchi K. J Am Chem Soc. 1996;118:7604–7607. [Google Scholar]
- 161.Shoji A, Kimura H, Sugisawa H. Annu Rep NMR Spectrosc. 2002;45:69–150. [Google Scholar]
- 162.Kimura H, Ozaki T, Sugisawa H, Deguchi K, Shoji A. Macromolecules. 1998;31:7398–7408. [Google Scholar]
- 163.Yamauchi K, Kuroki S, Fujii K, Ando I. Chem Phys Lett. 2000;324:435–439. [Google Scholar]
- 164.Yamauchi K, Kuroki S, Ando I. J Mol Struct. 2002;602–603:9–16. [Google Scholar]
- 165.Suzuki Y, Okonogi M, Yamauchi K, Kurosu H, Tansho M, Shimizu T, Saitô H, Asakura T. J Phys Chem B. 2007;111:9172–9178. doi: 10.1021/jp072755z. [DOI] [PubMed] [Google Scholar]
- 166.Naito A, Ganapathy SG, McDowell CA. J Magn Reson. 1982;48:367–381. [Google Scholar]
- 167.Hori S, Yamauchi K, Kuroki S, Ando I. Int J Mol Sci. 2002;3:907–913. [Google Scholar]
- 168.Kuszewski J, Gronenborn AM, Clore GM. J Magn Reson. 1995;B102:293–297. doi: 10.1006/jmrb.1995.1093. [DOI] [PubMed] [Google Scholar]
- 169.Pearson JG, Wang JF, Markley JL, Le H, Oldfield E. J Am Chem Soc. 1995;117:8823–8829. [Google Scholar]
- 170.Beger RD, Bolton PH. J Biomol NMR. 1997;10:129–142. doi: 10.1023/a:1018302105638. [DOI] [PubMed] [Google Scholar]
- 171.Wishart DW, Case DA. Meth Enzymol. 2001;338:3–34. doi: 10.1016/s0076-6879(02)38214-4. [DOI] [PubMed] [Google Scholar]
- 172.Wishart DS, Watson MS, Boyko RF, Sykes BD. J Biomol NMR. 1997;10:319–336. doi: 10.1023/a:1018373822088. [DOI] [PubMed] [Google Scholar]
- 173.Cornilescu G, Delagrio F, Bax A. J Biomol NMR. 1999;13:289–302. doi: 10.1023/a:1008392405740. [DOI] [PubMed] [Google Scholar]
- 174.Neal S, Nip AM, Zhang H, Wishart DS. J Biomol NMR. 2003;26:215–240. doi: 10.1023/a:1023812930288. [DOI] [PubMed] [Google Scholar]
- 175.Shen Y, Bax A. J Biomol NMR. 2007;38:289–302. doi: 10.1007/s10858-007-9166-6. [DOI] [PubMed] [Google Scholar]
- 176.Cavalli A, Salvatella X, Dobson CM, Vendruscolo M. Proc Natl Acad Sci USA. 2007;104:9615–9620. doi: 10.1073/pnas.0610313104. [DOI] [PMC free article] [PubMed] [Google Scholar]
- 177.Shen Y, Lange O, Delaglio F, Rossi P, Aramini JM, Liu G, Eletsky A, Wu Y, Singarapu KK, Lemak A, Ignatchenko A, Arrowsmith CH, Szyperski T, Montelione GT, Baker D, Bax A. Proc Natl Acad Sci USA. 2008;105:4685–4690. doi: 10.1073/pnas.0800256105. [DOI] [PMC free article] [PubMed] [Google Scholar]
- 178.Wishart DS, Arndt D, Berjanski B, Tang P, Zhou J, Lin G. Nucleic Acid Res. 2008;36:W496–W502. doi: 10.1093/nar/gkn305. [DOI] [PMC free article] [PubMed] [Google Scholar]
- 179.Stark RE, Jelinski LW, Ruben DL, Torchia DA, Griffin RG. J Magn Reson. 1983;55:266–273. [Google Scholar]
- 180.Takeda N, Kuroki S, Kurosu H, Ando I. Biopolymers. 1999;50:61–69. [Google Scholar]
- 181.Oas TG, Hartzell CJ, McMahon TJ, Drobny GP, Dahlquist FW. J Am Chem Soc. 1987;109:5956–5962. [Google Scholar]
- 182.Hartzell CJ, Whitfield M, Oas TG, Drobny GP. J Am Chem Soc. 1987;109:5966–5969. [Google Scholar]
- 183.Ando S, Yamanobe T, Ando I, Shoji A, Ozaki T, Tabeta R, Saitô H. J Am Chem Soc. 1985;107:7648–7652. [Google Scholar]
- 184.Ando S, Ando I, Shoji A, Ozaki T. J Mol Struct. 1989;192:153–161. [Google Scholar]
- 185.Wei YF, Lee DK, Ramamoorthy A. J Am Chem Soc. 2001;123:6118–6126. doi: 10.1021/ja010145l. [DOI] [PubMed] [Google Scholar]
- 186.Asakawa N, Takenori M, Sato D, Sakurai M, Inoue Y. Mag Reson Chem. 1999;37:303–311. [Google Scholar]
- 187.Havlin RH, Laws DD, Bitter HML, Sanders LK, Sun H, Grimley JS, Wemmer DE, Pines A, Oldfield E. J Am Chem Soc. 2001;123:10362–10369. doi: 10.1021/ja0115060. [DOI] [PubMed] [Google Scholar]
- 188.Harbison GS, Jellinski LW, Stark RE, Torchia DA, Herzfeld J, Griffin RG. J Magn Reson. 1984;60:79–82. [Google Scholar]
- 189.Waddell KW, Chekmenev EY, Wittebort RJ. J Am Chem Soc. 2005;127:9030–9035. doi: 10.1021/ja044204h. [DOI] [PubMed] [Google Scholar]
- 190.Oas TG, Hartzell CJ, Dahlquist FW, Drobny GP. J Am Chem Soc. 1987;109:5962–5966. [Google Scholar]
- 191.Hiyama Y, Niu CH, Silverton JV, Bavoso A, Torchia DA. J Am Chem Soc. 1988;110:2378–2383. [Google Scholar]
- 192.Roberts JE, Harbison GS, Munowitz MG, Herzfeld J, Griffin RG. J Am Chem Soc. 1987;109:4163–4169. [Google Scholar]
- 193.Kuroki S, Asakawa N, Ando S, Ando I, Shoji A, Ozaki T. J Mol Struct. 1991;245:69–80. [Google Scholar]
- 194.Wu CH, Ramamoorthy A, Gierasch LM, Opella SJ. J Am Chem Soc. 1995;117:6148–6149. [Google Scholar]
- 195.Lee DK, Santos JS, Ramamoorthy A. Chem Phys Lett. 1999;309:209–214. [Google Scholar]
- 196.Lumsden MD, Wasylishen RE, Eichele K, Schindler M, Penner GH, Power WP, Curtis RD. J Am Chem Soc. 1994;116:1403–1413. [Google Scholar]
- 197.Naito A, Fukutani A, Uitdehaag M, Tuzi S, Saitô H. J Mol Struc. 1998;441:231–241. [Google Scholar]
- 198.Teng Q, Cross TA. J Magn Reson. 1989;85:439–447. [Google Scholar]
- 199.Mai W, Hu W, Wang C, Cross TA. Protein Sci. 1993;2:532–542. doi: 10.1002/pro.5560020405. [DOI] [PMC free article] [PubMed] [Google Scholar]
- 200.Tian F, Cross TA. J Magn Reson. 1998;135:535–540. doi: 10.1006/jmre.1998.1596. [DOI] [PubMed] [Google Scholar]
- 201.Heise B, Leppert J, Ramachandran R. Solid State N M R. 2000;16:177–187. doi: 10.1016/s0926-2040(00)00073-4. [DOI] [PubMed] [Google Scholar]
- 202.Lee DK, Wei YF, Ramamoorthy A. J Phys Chem B. 2001;105:4752–4762. [Google Scholar]
- 203.Wei YF, Lee DK, McDermott AE, Ramamoorthy A. J Magn Reson. 2002;158:23–35. doi: 10.1016/s1090-7807(02)00056-3. [DOI] [PubMed] [Google Scholar]
- 204.Poon A, Birn J, Ramamoorthy A. J Phys Chem B. 2004;108:16577–16584. doi: 10.1021/jp0471913. [DOI] [PMC free article] [PubMed] [Google Scholar]
- 205.Walling AE, Pargas RE, de Dios AC. J Phys Chem A. 1997;101:7299–7303. [Google Scholar]
- 206.Kuroki S, Ando I, Shoji A, Ozaki T. J Chem Soc, Chem Commun. 1992:433–434. [Google Scholar]
- 207.Kuroki S, Takahashi A, Ando I, Shoji A, Ozaki T. J Mol Struct. 1994;323:197–208. [Google Scholar]
- 208.Kuroki S, Ando S, Ando I. Chem Phys. 1995;195:107–116. [Google Scholar]
- 209.Takahashi A, Kuroki S, Ando I, Ozaki T, Shoji A. J Mol Struct. 1998;442:195–199. [Google Scholar]
- 210.Yamauchi K, Kuroki S, Ando I. J Mol Struct. 2002;602–603:171–175. [Google Scholar]
- 211.Wu G, Dong S. J Am Chem Soc. 2001;123:9119–9125. doi: 10.1021/ja0102181. [DOI] [PubMed] [Google Scholar]
- 212.Lemaître V, de Planque MRR, Howes AP, Smith ME, Dupree R, Watts A. J Am Chem Soc. 2004;126:15320–15321. doi: 10.1021/ja0473283. [DOI] [PubMed] [Google Scholar]
- 213.Lemaître V, Smith ME, Watts A. Solid State NMR. 2004;26:215–235. doi: 10.1016/j.ssnmr.2004.04.004. [DOI] [PubMed] [Google Scholar]
- 214.Pike KJ, Lemaître V, Kukol A, Anupõld T, Samoson A, Howes AP, Watts A, Smith ME, Dupree R. J Phys Chem B. 2004;108:9256–9263. [Google Scholar]
- 215.Fu R, Brey WW, Shetty K, Gor’kov P, Saha S, Long JR, Grant SC, Chekmenev EY, Ha J, Gan Z, Sharma M, Zhang F, Logan TM, Brüschweller R, Edison A, Blue A, Dixon IR, Markiewicz WD, Cross TA. J Magn Reson. 2005;177:1–8. doi: 10.1016/j.jmr.2005.07.013. [DOI] [PubMed] [Google Scholar]
- 216.Chekmenev EY, Waddell KW, Hu J, Gan Z, Wittebort RJ, Cross TA. J Am Chem Soc. 2006;128:9849–9855. doi: 10.1021/ja060191r. [DOI] [PubMed] [Google Scholar]
- 217.Lemaitre V, Pike KJ, Watts A, Anupold T, Samoson A, Smith ME, Dupree R. Chem Phys Lett. 2003;371:91–97. [Google Scholar]
- 218.Waddell KW, Chekmenev EY, Wittebort RJ. J Phys Chem B. 2006;110:22935–22941. doi: 10.1021/jp060617o. [DOI] [PubMed] [Google Scholar]
- 219.Gan Z, Gor’kov P, Cross TA, Samoson A, Massiot D. J Am Chem Soc. 2002;124:5634–5635. doi: 10.1021/ja025849p. [DOI] [PubMed] [Google Scholar]
- 220.Hu J, Chekmenev EY, Gan Z, Gor’kov PL, Saha S, Brey WW, Cross TA. J Am Chem Soc. 2005;127:11922–11923. doi: 10.1021/ja0535413. [DOI] [PubMed] [Google Scholar]
- 221.Amoureux J-P, Fernanderz C, Steuernagel S. J Magn Reson A. 1996;123:116–118. doi: 10.1006/jmra.1996.0221. [DOI] [PubMed] [Google Scholar]
- 222.Howes AP, Anuspold T, Lamaitre V, Kukol A, Watts A, Samoson A, Smith ME, Dupree R. Chem Phys Lett. 2006;421:42–46. [Google Scholar]
- 223.Prasad S, Clark TM, Sharma R, Kwak H-T, Grandinetti PJ, Zimmermann H. Solid State NMR. 2006;29:119–124. doi: 10.1016/j.ssnmr.2005.10.007. [DOI] [PubMed] [Google Scholar]
- 224.Yamada K, Nemoto T, Asanuma M, Honda H, Yamazaki T, Hirota H. Solid State NMR. 2006;30:182–191. doi: 10.1016/j.ssnmr.2006.09.003. [DOI] [PubMed] [Google Scholar]
- 225.Yamada K, Shimizu T, Yamazaki T, Ohki S. Solid State NMR. 2008;33:88–94. doi: 10.1016/j.ssnmr.2008.04.001. [DOI] [PubMed] [Google Scholar]
- 226.Yamauchi K, Okonogi M, Kurosu H, Tansho M, Shimizu T, Gullion T, Asakura T. J Magn Reson. 2008;190:327–333. doi: 10.1016/j.jmr.2007.11.006. [DOI] [PubMed] [Google Scholar]
- 227.Gerald R, II, Bernhard T, Haeberlen U, Rendell J, Opella S. J Am Chem Soc. 1993;115:777–782. [Google Scholar]
- 228.Yamauchi K, Kuroki S, Ando I. Polymer. 2002;43:3331–3333. [Google Scholar]
- 229.Lesage A, Sakellariou D, Hediger S, Elena B, Charmont P, Steuernagel S, Emsley L. J Magn Reson. 2003;163:105–113. doi: 10.1016/s1090-7807(03)00104-6. [DOI] [PubMed] [Google Scholar]
- 230.Saitô H, Tabeta R, Ando I, Ozaki T, Shoji A. Chem Lett. 1983:1437–1440. [Google Scholar]
- 231.Akieda T, Mimura H, Kuroki S, Kurosu H, Ando I. Macromolecules. 1992;25:5794–5797. [Google Scholar]
- 232.Murata K, Katoh E, Kuroki S, Ando I. J Mol Struct. 2004;689:223–235. [Google Scholar]
- 233.Tuzi S, Komoto T, Ando I, Saitô H, Shoji A, Ozaki T. Biopolymers. 1987;26:1983–1992. [Google Scholar]
- 234.Birn J, Poon A, Mao Y, Ramamoorthy A. J Am Chem Soc. 2004;126:8529–8534. doi: 10.1021/ja049879z. [DOI] [PMC free article] [PubMed] [Google Scholar]
- 235.Gu Z, Zambrano R, McDermott A. J Am Chem Soc. 1994;116:6368–6372. [Google Scholar]
- 236.Kimura H, Shoji A, Sugisawa H, Deguchi K, Naito A, Saitô H. Macromolecules. 2000;33:6627–6629. [Google Scholar]
- 237.Hong M. J Am Chem Soc. 2000;122:3762–3770. [Google Scholar]
- 238.Tjandra N, Bax A. J Am Chem Soc. 1997;119:9576–9577. [Google Scholar]
- 239.Yao X, Hong M. J Am Chem Soc. 2002;124:2730–2738. doi: 10.1021/ja017137p. [DOI] [PubMed] [Google Scholar]
- 240.Ishii Y, Terao T, Kainosho M. Chem Phys Lett. 1996;256:133–140. [Google Scholar]
- 241.Yao X, Yamaguchi S, Hong M. J Biomol NMR. 2002;24:51–62. doi: 10.1023/a:1020626802472. [DOI] [PubMed] [Google Scholar]
- 242.Wylie BJ, Franks WT, Graesser DT, Rienstra CM. J Am Chem Soc. 2005;127:11946–11947. doi: 10.1021/ja053862e. [DOI] [PubMed] [Google Scholar]
- 243.Wylie BJ, Franks WT, Rienstra CM. J Phys Chem. 2006;B110:10926–10936. doi: 10.1021/jp060507h. [DOI] [PubMed] [Google Scholar]
- 244.Wylie BJ, Sperling LJ, Frericks HL, Shah GJ, Franks WT, Rienstra CM. J Am Chem Soc. 2007;129:5318–5319. doi: 10.1021/ja0701199. [DOI] [PubMed] [Google Scholar]
- 245.Fushman D, Cowburn D. J Am Chem Soc. 1998;120:7109–7110. [Google Scholar]
- 246.Fushman D, Tjandra N, Cowburn D. J Am Chem Soc. 1998;120:10947–10952. [Google Scholar]
- 247.Hall JB, Fushman D. J Am Chem Soc. 2006;128:7855–7870. doi: 10.1021/ja060406x. [DOI] [PMC free article] [PubMed] [Google Scholar]
- 248.Lipari G, Szabo A. J Am Chem Soc. 1982;104:4546–4559. [Google Scholar]
- 249.Kroenke CD, Rance M, Palmer AG., III J Am Chem Soc. 1999;121:10119–10125. [Google Scholar]
- 250.Tjandra N, Szabo A, Bax A. J Am Chem Soc. 1996;118:6986–6991. [Google Scholar]
- 251.Lienin SF, Bremi T, Brutscher B, Brüschweiler R, Ernst RR. J Am Chem Soc. 1998;120:9870–9879. [Google Scholar]
- 252.Tjandra N, Wingfield P, Stahl S, Bax A. J Biomol NMR. 1996;8:273–284. doi: 10.1007/BF00410326. [DOI] [PubMed] [Google Scholar]
- 253.Cornilescu G, Bax A. J Am Chem Soc. 2000;122:10143–10154. [Google Scholar]
- 254.Bryce DL, Grishaev A, Bax A. J Am Chem Soc. 2005;127:7387–7396. doi: 10.1021/ja051039c. [DOI] [PubMed] [Google Scholar]
- 255.Kurita J, Shimahara H, Utsunomiya-Tate N, Tate S. J Magn Reson. 2003;163:163–173. doi: 10.1016/s1090-7807(03)00080-6. [DOI] [PubMed] [Google Scholar]
- 256.Reimer JA, Vaughan RW. J Magn Reson. 1980;41:483–491. [Google Scholar]
- 257.Tjandra N, Bax A. J Am Chem Soc. 1997;119:8076–8082. [Google Scholar]
- 258.Tessari M, Vis H, Boelens R, Kaptein R, Vuister GW. J Am Chem Soc. 1997;119:8985–8990. [Google Scholar]
- 259.Goldman M. J Magn Reson. 1984;60:437–452. [Google Scholar]
- 260.Shimizu H. J Chem Phys. 1964;40:3357–3364. [Google Scholar]
- 261.Wüthrich K. Nature Struct Biol. 1998;5:492–495. doi: 10.1038/728. [DOI] [PubMed] [Google Scholar]
- 262.Pervushin K, Wider G, Riek R, Wüthrich K. Proc Natl Acad Sci USA. 1999;96:9607–9612. doi: 10.1073/pnas.96.17.9607. [DOI] [PMC free article] [PubMed] [Google Scholar]
- 263.Fernández C, Adeishvili K, Wüthrich K. Proc Natl Acad Sci USA. 2001;98:2358–2363. doi: 10.1073/pnas.051629298. [DOI] [PMC free article] [PubMed] [Google Scholar]
- 264.Salzmann M, Pervushin K, Wider G, Senn H, Wüthrich K. J Am Chem Soc. 2000;122:7543–7548. [Google Scholar]
- 265.Fiaux J, Bertelsen EB, Horwich AL, Wüthrich K. Nature. 2002;418:207–211. doi: 10.1038/nature00860. [DOI] [PubMed] [Google Scholar]
- 266.Asakura T, Kuzuhara A, Tabeta R, Saitô H. Macromolecules. 1985;18:1841–1845. [Google Scholar]
- 267.Saitô H, Ishida M, Yokoi M, Asakura T. Macromolecules. 1990;23:83–88. [Google Scholar]
- 268.Huster D, Schiller J, Arnold K. Magn Reson Med. 2002;48:624–632. doi: 10.1002/mrm.10272. [DOI] [PubMed] [Google Scholar]
- 269.Sackerwitz M, Scheidt HA, Lodderstedt G, Schierhorn A, Schwarz E, Huster D. J Am Chem Soc. 2008;130:7172–7173. doi: 10.1021/ja800120s. [DOI] [PubMed] [Google Scholar]
- 270.Huster D. Annu Rep NMR Spectrosc. 2008;64:127–159. [Google Scholar]
- 271.Naito A, Nagao T, Norisada K, Mizuno T, Tuzi S, Saitô H. Biophys J. 2000;78:2405–2417. doi: 10.1016/S0006-3495(00)76784-1. [DOI] [PMC free article] [PubMed] [Google Scholar]
- 272.Kamihira M, Naito A, Tuzi S, Nosaka AY, Saitô H. Protein Sci. 2000;9:5867–5877. doi: 10.1110/ps.9.5.867. [DOI] [PMC free article] [PubMed] [Google Scholar]
- 273.Kimura S, Naito A, Tuzi S, Saitô H. Biopolymers. 2001;58:78–88. doi: 10.1002/1097-0282(200101)58:1<78::AID-BIP80>3.0.CO;2-C. [DOI] [PubMed] [Google Scholar]
- 274.Kimura S, Naito A, Saitô H, Ogawa K, Shoji A. J Mol Struct. 2001;562:197–203. [Google Scholar]
- 275.Kamihira M, Oshiro Y, Tuzi S, Nosaka AY, Saitô H, Naito A. J Biol Chem. 2003;278:2859–2865. doi: 10.1074/jbc.M205285200. [DOI] [PubMed] [Google Scholar]
- 276.Tuzi S, Yamaguchi S, Tanio M, Konishi H, Inoue S, Naito A, Needleman R, Lanyi JK, Saitô H. Biophys J. 1999;76:1523–1531. doi: 10.1016/S0006-3495(99)77311-X. [DOI] [PMC free article] [PubMed] [Google Scholar]
- 277.Tuzi S, Naito A, Saitô H. Biochemistry. 1994;33:15046–15052. doi: 10.1021/bi00254a013. [DOI] [PubMed] [Google Scholar]
- 278.Saitô H, Mikami J, Yamaguchi S, Tanio M, Kira A, Arakawa T, Yamamoto K, Tuzi S. Magn Reson Chem. 2004;204:218–230. doi: 10.1002/mrc.1325. [DOI] [PubMed] [Google Scholar]
- 279.Saitô H, Tuzi S, Tanio M, Naito A. Annu Rep NMR Spectrosc. 2002;47:39–108. [Google Scholar]
- 280.Tuzi S, Naito A, Saitô H. J Mol Struct. 2003;654:205–214. [Google Scholar]
- 281.Saitô H. Annu Rep NMR Spectrosc. 2006;57:99–175. [Google Scholar]
- 282.Kawamura I, Ikeda Y, Sudo Y, Iwamoto M, Shimono K, Yamaguchi S, Tuzi S, Saitô H, Kamo N, Naito A. Photochem Photobiol. 2007;83:339–345. doi: 10.1562/2006-06-20-RA-940. [DOI] [PubMed] [Google Scholar]
- 283.Kawamura I, Yoshida H, Ikeda Y, Yamaguchi S, Tuzi S, Saitô H, Kamo N, Naito A. Photochem Photobiol. 2008;84:921–930. doi: 10.1111/j.1751-1097.2008.00326.x. [DOI] [PubMed] [Google Scholar]
- 284.Frericks HL, Zhou DH, Yap LL, Gennis RB, Rienstra CM. J Biomol NMR. 2006;36:55–71. doi: 10.1007/s10858-006-9070-5. [DOI] [PubMed] [Google Scholar]
- 285.Etzkorn M, Martell S, Andronesi OC, Seidel K, Engelhard M, Baldus M. Angew Chem Int Ed. 2006;46:459–462. doi: 10.1002/anie.200602139. [DOI] [PubMed] [Google Scholar]
- 286.Xu J, Dürr UH, Im SC, Gan Z, Waskell L, Ramamoorthy A. Angew Chem Int Ed Engl. 2008;47:7864–7867. doi: 10.1002/anie.200801338. [DOI] [PMC free article] [PubMed] [Google Scholar]
- 287.Zhu P, Xu J, Sahar N, Morris MD, Kohn DH, Ramamoorthy A. J Am Chem Soc. 2009;131:17064–17065. doi: 10.1021/ja9081028. [DOI] [PMC free article] [PubMed] [Google Scholar]
- 288.Kloepper KD, Zhou DH, Li Y, Winter KA, George JM, Rienstra CM. J Biomol NMR. 2007;39:197–211. doi: 10.1007/s10858-007-9189-z. [DOI] [PubMed] [Google Scholar]
- 289.Tycko R. Prog NMR Spectrosc. 2003;42:53–68. [Google Scholar]
- 290.Baldus M. Prog NMR Spectrosc. 2002;41:1–47. [Google Scholar]
- 291.Nicholson LK, Moll F, Mizon TE, LoGrasso PV, Lay JC, Cross TA. Biochemistry. 1987;26:6621–6626. doi: 10.1021/bi00395a009. [DOI] [PubMed] [Google Scholar]
- 292.Fields GB, Fields CG, Petefish J, van Wart HE, Cross TA. Proc Natl Acad Sci USA. 1988;85:1384–1388. doi: 10.1073/pnas.85.5.1384. [DOI] [PMC free article] [PubMed] [Google Scholar]
- 293.Wang C, Teng Q, Cross TA. Biophys J. 1992;61:1550–1556. doi: 10.1016/S0006-3495(92)81959-8. [DOI] [PMC free article] [PubMed] [Google Scholar]
- 294.Hu W, Lee KC, Cross TA. Biochemistry. 1993;32:7035–7047. doi: 10.1021/bi00078a032. [DOI] [PubMed] [Google Scholar]
- 295.Ketchem RR, Hu W, Cross TA. Science. 1993;261:1457–1460. doi: 10.1126/science.7690158. [DOI] [PubMed] [Google Scholar]
- 296.Ramamoorthy A, Wu CH, Opella SJ. J Magn Reson. 1999;140:131–140. doi: 10.1006/jmre.1999.1827. [DOI] [PubMed] [Google Scholar]
- 297.Ramamoorthy A, Wei Y, Lee DK. Annu Rept NMR Spectrosc. 2004;52:1–52. [Google Scholar]
- 298.Marassi FM, Opella SJ. J Magn Reson. 2000;144:159–155. doi: 10.1006/jmre.2000.2035. [DOI] [PMC free article] [PubMed] [Google Scholar]
- 299.Wang J, Denny J, Tian C, Kim S, Mo Y, Kovacs F, Song Z, Nishimura K, Gan Z, Fu R, Quine JR, Cross TA. J Magn Reson. 2000;144:162–167. doi: 10.1006/jmre.2000.2037. [DOI] [PubMed] [Google Scholar]
- 300.Marassi F, Opella SJ. J Magn Reson. 2000;144:150–155. doi: 10.1006/jmre.2000.2035. [DOI] [PMC free article] [PubMed] [Google Scholar]
- 301.Nevzorov AA, Opella SJ. J Magn Reson. 2003;160:33–39. doi: 10.1016/s1090-7807(02)00138-6. [DOI] [PubMed] [Google Scholar]
- 302.Marassi FM. Biophys J. 2001;80:994–1003. doi: 10.1016/S0006-3495(01)76078-X. [DOI] [PMC free article] [PubMed] [Google Scholar]
- 303.Marassi FM, Opella SJ. Protein Sci. 2003;12:403–411. doi: 10.1110/ps.0211503. [DOI] [PMC free article] [PubMed] [Google Scholar]
- 304.Zeri AC, Mesleh MF, Nevzorov AA, Opella SJ. Proc Natl Acad Sci USA. 2003;100:6458–6463. doi: 10.1073/pnas.1132059100. [DOI] [PMC free article] [PubMed] [Google Scholar]
- 305.Yamamoto K, Dvinskikh SV, Ramamoorthy A. Chem Phys Lett. 2006;419:533–536. [Google Scholar]
- 306.Yamamoto K, Soong R, Ramamoorthy A. Langmuir. 2009;25:7010–7018. doi: 10.1021/la900200s. [DOI] [PMC free article] [PubMed] [Google Scholar]
- 307.Dürr UH, Yamamoto K, Im SC, Waskell L, Ramamoorthy A. J Am Chem Soc. 2007;129:6670–6671. doi: 10.1021/ja069028m. [DOI] [PMC free article] [PubMed] [Google Scholar]
- 308.Ramamoorthy A. Solid State Nucl Magn Reson. 2009;35:201–207. doi: 10.1016/j.ssnmr.2009.03.003. [DOI] [PMC free article] [PubMed] [Google Scholar]
- 309.Ramamoorthy A, Thennarasu S, Lee DK, Tan A, Maloy L. Biophys J. 2006;91:206–216. doi: 10.1529/biophysj.105.073890. [DOI] [PMC free article] [PubMed] [Google Scholar]
- 310.Song Z, Kovacs FA, Wang J, Denny JK, Shekar SC, Quine JR, Cross TA. Biophys J. 2000;79:767–775. doi: 10.1016/S0006-3495(00)76334-X. [DOI] [PMC free article] [PubMed] [Google Scholar]
- 311.Tiburu EK, Karp ES, Dave PC, Damodran K, Lorigan GA. Biochemistry. 2004;43:13899–13909. doi: 10.1021/bi0490993. [DOI] [PubMed] [Google Scholar]
- 312.Traaseth NJ, Buffy JJ, Zamoon J, Veglia G. Biochemistry. 2006;45:13827–13834. doi: 10.1021/bi0607610. [DOI] [PubMed] [Google Scholar]
- 313.Abu-Baker S, Lu JX, Chu S, Shetty KN, Gor’kov PL, Lorigan GA. Protein Sci. 2007;16:2345–2349. doi: 10.1110/ps.072977707. [DOI] [PMC free article] [PubMed] [Google Scholar]
- 314.Bleile DW, Scott WR, Straus SK. J Biomol NMR. 2005;32:101–111. doi: 10.1007/s10858-005-5094-5. [DOI] [PubMed] [Google Scholar]
- 315.Müller SD, De Angelis AA, Walther TH, Grage SsL, Lange C, Opella SJ, Ulrich AS. Biochim Biophys Acta. 2007;1786:3071–3079. doi: 10.1016/j.bbamem.2007.09.008. [DOI] [PubMed] [Google Scholar]
- 316.Vosegaard T, Kamihira-Ishijima M, Watts A, Nielsen NC. Biophys J. 2008;94:242–250. doi: 10.1529/biophysj.107.116004. [DOI] [PMC free article] [PubMed] [Google Scholar]
- 317.Salnikov ES, Friedrich H, Li X, Bertani P, Reissmann S, Hertweck C, O’Neil JDJ, Raap J, Bechinger B. Biophys J. 2009;96:86–100. doi: 10.1529/biophysj.108.136242. [DOI] [PMC free article] [PubMed] [Google Scholar]
- 318.Park SH, Prytulla S, De Angelis AA, Brown JM, Kiefer H, Opella SJ. J Am Chem Soc. 2006;128:7402–7403. doi: 10.1021/ja0606632. [DOI] [PMC free article] [PubMed] [Google Scholar]
- 319.Li C, Gao P, Qin H, Chase R, Gor’kov PL, Brey WW, Cross TA. J Am Chem Soc. 2007;129:5304–5305. doi: 10.1021/ja068402f. [DOI] [PMC free article] [PubMed] [Google Scholar]
- 320.Marsh RE, Corey RB, Pauling L. Biochim Biophys Acta. 1955;16:1–34. doi: 10.1016/0006-3002(55)90178-5. [DOI] [PubMed] [Google Scholar]
- 321.Takahashi Y, Gehoh M, Yuzuriha K. J Polym Sci, Polym Phys. 1991;29:889–891. [Google Scholar]
- 322.Zhao C, Zhang H, Yamanobe T, Kuroki S, Ando I. Macromolecules. 1999;32:3389–3394. [Google Scholar]
- 323.Lipari G, Szabo A. J Am Chem Soc. 1982;104:4559–4570. [Google Scholar]
- 324.Tjandra N, Feller SE, Pastor RW, Bax A. J Am Chem Soc. 1995;117:12562–12566. [Google Scholar]
- 325.Engelke J, Rüterjans H. J Biomol NMR. 1997;9:63–78. doi: 10.1023/A:1018675618785. [DOI] [PubMed] [Google Scholar]
- 326.Dayie KT, Wagner G. J Am Chem Soc. 1997;119:7797–7806. [Google Scholar]
- 327.Lienin SF, Bremi T, Brutscher B, Brüschweiler R, Ernst RR. J Am Chem Soc. 1998;120:9870–9879. [Google Scholar]
- 328.Palmer AG., III Curr Opin Struct Biol. 1997;7:732–737. doi: 10.1016/s0959-440x(97)80085-1. [DOI] [PubMed] [Google Scholar]
- 329.Palmer AG, III, Kroenke CD, Loria JP. Meth Enzymol. 2001;339:204–238. doi: 10.1016/s0076-6879(01)39315-1. [DOI] [PubMed] [Google Scholar]
- 330.Akke M. Curr Opin Struct Biol. 2002;12:642–647. doi: 10.1016/s0959-440x(02)00369-x. [DOI] [PubMed] [Google Scholar]
- 331.Luz Z, Meiboom S. J Chem Phys. 1963;39:366–370. [Google Scholar]
- 332.Peng JW, Wagner G. Biochemistry. 1995;34:16773–16752. doi: 10.1021/bi00051a023. [DOI] [PubMed] [Google Scholar]
- 333.Mandel AM, Akke M, Palmer AG., III J Mol Biol. 1995;246:14–163. doi: 10.1006/jmbi.1994.0073. [DOI] [PubMed] [Google Scholar]
- 334.Mandel AM, Akke M, Palmer AG., III Biochemistry. 1996;35:16009–16023. doi: 10.1021/bi962089k. [DOI] [PubMed] [Google Scholar]
- 335.Nicholson LK, Yamazaki T, Torchia DA, Grzesiek S, Bax A, Stahl SJ, Kaufman JD, Wingfield PT, Lam PYS, Jadhav PK, Hodge CN, Domaille PJ, Chang CH. Nature Struct Biol. 1995;2:274–80. doi: 10.1038/nsb0495-274. [DOI] [PubMed] [Google Scholar]
- 336.Farrow NA, Zhang O, Forman-Kay JD, Kay LE. Biochemistry. 1997;36:2390–2402. doi: 10.1021/bi962548h. [DOI] [PubMed] [Google Scholar]
- 337.Zhou H, McEvoy MM, Lowry DF, Swanson RV, Simon MI, Dahlquist FW. Biochemistry. 1996;35:433–443. doi: 10.1021/bi951960e. [DOI] [PubMed] [Google Scholar]
- 338.Spitzfagen C, Grant RP, Mardon HJ, Campbell ID. J Mol Biol. 1997;265:565–579. doi: 10.1006/jmbi.1996.0736. [DOI] [PubMed] [Google Scholar]
- 339.Markus MA, Hinck AP, Huang S, Draper DE, Torchia DA. Nature Struct Biol. 1997;4:70–77. doi: 10.1038/nsb0197-70. [DOI] [PubMed] [Google Scholar]
- 340.Volkman BF, Lipson D, Wemmer DE, Kern D. Science. 2001;291:2429–2433. doi: 10.1126/science.291.5512.2429. [DOI] [PubMed] [Google Scholar]
- 341.Eisenmesser EZ, Bosco DA, Akke M, Kern D. Science. 2002;295:1520–1523. doi: 10.1126/science.1066176. [DOI] [PubMed] [Google Scholar]
- 342.Haas MAS, Thuesen MH, Christensen HEM, Led JJ. J Am Chem Soc. 2004;126:753–765. doi: 10.1021/ja030366m. [DOI] [PubMed] [Google Scholar]
- 343.Kempf JG, Jung J, Ragain C, Sampson NS, Loria JP. J Mol Biol. 2007;368:131–149. doi: 10.1016/j.jmb.2007.01.074. [DOI] [PMC free article] [PubMed] [Google Scholar]
- 344.Mukherjee M, Dutta K, White MA, Cowburn D, Fox RO. Protein Sci. 2006;15:1342–1355. doi: 10.1110/ps.051844006. [DOI] [PMC free article] [PubMed] [Google Scholar]
- 345.Kay LE. J Magn Reson. 2005;173:193–207. doi: 10.1016/j.jmr.2004.11.021. [DOI] [PubMed] [Google Scholar]
- 346.Hwang PM, Bishop RE, Kay Lewis E. Proc Natl Acad Sci USA. 2004;101:9618–9623. doi: 10.1073/pnas.0402324101. [DOI] [PMC free article] [PubMed] [Google Scholar]
- 347.Di Nardo AA, Korzhnev DM, Stogios PJ, Zarrine-Afsar A, Kay LE, Davidson AR. Proc Natl Acad Sci USA. 2004;101:7954–7959. doi: 10.1073/pnas.0400550101. [DOI] [PMC free article] [PubMed] [Google Scholar]
- 348.Korzhnev DM, Salvatella X, Vendruscolo M, Di Nardo AA, Davidson AR, Dobson CM, Kay LE. Nature. 2004;430:586–590. doi: 10.1038/nature02655. [DOI] [PubMed] [Google Scholar]
- 349.Dittmer J, Bodenhausen G. J Am Chem Soc. 2004;126:1314–1315. doi: 10.1021/ja0386243. [DOI] [PubMed] [Google Scholar]
- 350.Rothwell WP, Waugh JS. J Chem Phys. 1981;75:2721–2732. [Google Scholar]
- 351.Naito A, Nagao T, Norisada K, Mizuno T, Tuzi S, Saitô H. Biophys J. 2000;78:2405–2417. doi: 10.1016/S0006-3495(00)76784-1. [DOI] [PMC free article] [PubMed] [Google Scholar]
- 352.Lee DK, Santos JS, Ramamoorthy A. J Phys Chem. 1999;B103:8383–8390. [Google Scholar]
- 353.Kandasamy SK, Lee DK, Nanga RP, Xu J, Santos JS, Larson RG, Ramamoorthy A. Biochim Biophys Acta. 2009;1788:686–695. doi: 10.1016/j.bbamem.2008.11.009. [DOI] [PubMed] [Google Scholar]
- 354.Esteban-Martín S, Strandberg E, Fuertes G, Ulrich AS, Salgado J. Biophys J. 2009;96:3233–3241. doi: 10.1016/j.bpj.2008.12.3950. [DOI] [PMC free article] [PubMed] [Google Scholar]
- 355.Ramamoorthy A, Lee DK, Narasimhaswamy T, Nanga RP. Biochim Biophys Acta. 2010;1798:223–227. doi: 10.1016/j.bbamem.2009.08.012. [DOI] [PMC free article] [PubMed] [Google Scholar]
- 356.Doherty T, Waring AJ, Hong M. Biochemistry. 2008;47:1105–1116. doi: 10.1021/bi701390t. [DOI] [PubMed] [Google Scholar]
- 357.Torchia DA, VanderHart DL. J Mol Biol. 1976;104:315–321. doi: 10.1016/0022-2836(76)90018-8. [DOI] [PubMed] [Google Scholar]
- 358.Jelinski LW, Torchia DA. J Mol Biol. 1979;133:45–63. doi: 10.1016/0022-2836(79)90250-x. [DOI] [PubMed] [Google Scholar]
- 359.Sarkar SK, Sullivan CE, Torchia DA. J Biol Chem. 1983;258:9762–9767. [PubMed] [Google Scholar]
- 360.Sarkar SK, Sullivan CE, Torchia DA. Biochemistry. 1985;24:2348–2354. doi: 10.1021/bi00330a033. [DOI] [PubMed] [Google Scholar]
- 361.deAzevedo ER, Hu W-G, Bonagamba TJ, Schmidt-Rohr K. J Am Chem Soc. 1999;121:8411–8412. [Google Scholar]
- 362.deAzevedo ER, Hu W-G, Bonagamba TJ, Schmidt-Rohr K. J Chem Phys. 2000;112:8988–9001. [Google Scholar]
- 363.deAzevedo ER, Kennedy SB, Hong M. Chem Phys Lett. 2000;321:43–48. [Google Scholar]
- 364.Reichert D, Pascui O, deAzevedo ER, Bonagamba TJ, Arnold K, Huster D. Magn Reson Chem. 2004;42:276–284. doi: 10.1002/mrc.1334. [DOI] [PubMed] [Google Scholar]
- 365.Hong M, Gross JD, Griffin RG. J Phys Chem. 1997;101:5869–5874. [Google Scholar]
- 366.Gall CM, Cross TA, DiVerdi JA, Opella SJ. Proc Natl Acad Soc USA. 1982;79:101–105. doi: 10.1073/pnas.79.1.101. [DOI] [PMC free article] [PubMed] [Google Scholar]
- 367.Cross TA, Opella SJ. J Mol Biol. 1982;159:543–549. doi: 10.1016/0022-2836(82)90301-1. [DOI] [PubMed] [Google Scholar]
- 368.Colnago LA, Valentine KG, Opella SJ. Biochemistry. 1987;26:847–854. doi: 10.1021/bi00377a028. [DOI] [PubMed] [Google Scholar]
- 369.Thiriot DS, Nevzorov AA, Zagyanskiy L, Wu CH, Opella SJ. J Mol Biol. 2004;341:869–879. doi: 10.1016/j.jmb.2004.06.038. [DOI] [PubMed] [Google Scholar]
- 370.Thiriot DS, Nevzorov AA, Opella SJ. Protein Sci. 2005;14:1064–1070. doi: 10.1110/ps.041220305. [DOI] [PMC free article] [PubMed] [Google Scholar]
- 371.Lorieau JL, Day LA, McDermott AE. Proc Natl Acad Sci. 2008;105:10366–10371. doi: 10.1073/pnas.0800405105. [DOI] [PMC free article] [PubMed] [Google Scholar]
- 372.Grigorieff N, Ceska TA, Downing KH, Baldwin JM, Henderson R. J Mol Biol. 1996;259:393–421. doi: 10.1006/jmbi.1996.0328. [DOI] [PubMed] [Google Scholar]
- 373.Pebay-Peyroula E, Rummel G, Rosenbusch JP, Landau EM. Science. 1997;277:1676–1681. doi: 10.1126/science.277.5332.1676. [DOI] [PubMed] [Google Scholar]
- 374.Luecke H, Richter HT, Lanyi JK. Science. 1998;280:1934–1937. doi: 10.1126/science.280.5371.1934. [DOI] [PubMed] [Google Scholar]
- 375.Saitô H, Tuzi S, Naito A. Annu Rep NMR Spectrosc. 1998;36:79–121. [Google Scholar]
- 376.Saitô H. Chem Phys Lipids. 2004;132:101–112. doi: 10.1016/j.chemphyslip.2004.09.009. [DOI] [PubMed] [Google Scholar]
- 377.Saitô H. In: Modern Magnetic Resonance. Webb GA, editor. Springer; 2006. pp. 287–293. [Google Scholar]
- 378.Saitô H, Naito A. Biochim Biophys Acta. 2007;1768:3090–3097. doi: 10.1016/j.bbamem.2007.11.001. [DOI] [PubMed] [Google Scholar]
- 379.Saitô H, Kawase Y, Kira A, Yamamoto K, Tanio M, Yamaguchi S, Tuzi S, Naito A. Photochem Photobiol. 2007;83:253–262. doi: 10.1562/2006.06-12-IR-917. [DOI] [PubMed] [Google Scholar]
- 380.Shastri S, Vonck J, Pfeger N, Haase W, Kuehlbrandt W, Glaubitz C. Biochim Biophys Acta. 2007;1768:3012–3019. doi: 10.1016/j.bbamem.2007.10.001. [DOI] [PubMed] [Google Scholar]
- 381.Saitô H, Yamamoto K, Tuzi S, Yamaguchi S. Biochim Biophys Acta. 2003;1616:127–136. doi: 10.1016/j.bbamem.2003.08.002. [DOI] [PubMed] [Google Scholar]
- 382.Tuzi S, Yamaguchi S, Tanio M, Konishi H, Inoue S, Naito A, Needleman R, Lanyi JK. Biophys J. 1999;76:1523–1531. doi: 10.1016/S0006-3495(99)77311-X. [DOI] [PMC free article] [PubMed] [Google Scholar]
- 383.Yamaguchi S, Tuzi S, Tanio M, Naito A, Lanyis JK, Needleman R, Saitô H. J Biochem(Tokyo) 2000;127:861–869. doi: 10.1093/oxfordjournals.jbchem.a022680. [DOI] [PubMed] [Google Scholar]
- 384.Yamaguchi S, Tuzi S, Yonebayashi K, Naito A, Needleman R, Lanyi JK, Saitô H. J Biochem(Tokyo) 2001;129:373–382. doi: 10.1093/oxfordjournals.jbchem.a002867. [DOI] [PubMed] [Google Scholar]
- 385.Yamaguchi S, Yonebayashi K, Konishi H, Tuzi S, Naito A, Lanyi JK, Needleman R, Saitô H. Eur J Biochem. 2001;268:2218–2228. doi: 10.1046/j.1432-1327.2001.02088.x. [DOI] [PubMed] [Google Scholar]
- 386.Arakawa T, Shimono K, Yamaguchi S, Tuzi S, Sudo Y, Kamo N, Saitô H. FEBS Lett. 2003;536:237–240. doi: 10.1016/s0014-5793(03)00065-6. [DOI] [PubMed] [Google Scholar]
- 387.Yamaguchi S, Shimono K, Sudo Y, Tuzi S, Naito A, Kamo N, Saitô H. Biophys J. 2004;86:3131–3140. doi: 10.1016/S0006-3495(04)74361-1. [DOI] [PMC free article] [PubMed] [Google Scholar]
- 388.Yamaguchi S, Tuzi S, Bowe JU, Saitô H. Biochim Biophys Acta. 2004;1698:97–105. doi: 10.1016/j.bbapap.2003.10.013. [DOI] [PubMed] [Google Scholar]
- 389.Suwelack D, Rothwell WP, Waugh JS. J Chem Phys. 1980;73:2559–2569. [Google Scholar]
- 390.Kawamura I, Degawa Y, Yamaguchi S, Nishimura K, Tuzi S, Saitô H, Naito A. Photochem Photobiol. 2007;83:346–350. doi: 10.1562/2006-06-20-RC-941. [DOI] [PubMed] [Google Scholar]
- 391.Kawamura I, Kihara N, Ohmine M, Nishimura K, Tuzi S, Saitô H, Naito A. J Am Chem Soc. 2007;129:1016–1017. doi: 10.1021/ja0664887. [DOI] [PubMed] [Google Scholar]
- 392.Kawase Y, Tanio M, Kira A, Yamaguchi S, Tuzi S, Naito A, Kataoka M, Lanyi JK, Needleman R, Saitô H. Biochemistry. 2000;39:14472–14480. doi: 10.1021/bi0015820. [DOI] [PubMed] [Google Scholar]
- 393.Kira A, Tanio M, Tuzi S, Saitô H. Eur Biophys J. 2004;33:580–588. doi: 10.1007/s00249-004-0406-3. [DOI] [PubMed] [Google Scholar]
- 394.Saitô H, Kira A, Arakawa T, Tanio M, Tuzi S, Naito A. Biochim Biophys Acta. 2010;1798:167–176. doi: 10.1016/j.bbamem.2009.06.027. [DOI] [PubMed] [Google Scholar]
- 395.Miwa Y, Ishida H, Saitô H, Tanaka M, Mochizuki A. Polymer. 2009;50:6091–6099. [Google Scholar]
- 396.Sternberg C, L’Hostis C, Whiteway CA, Watts A. Biochim Biophys Acta. 1992;1108:21–30. doi: 10.1016/0005-2736(92)90110-8. [DOI] [PubMed] [Google Scholar]
- 397.Barré P, Yamaguchi S, Tuzi S, Saitô H. Eur Biophys J. 2003;32:578–584. doi: 10.1007/s00249-003-0305-z. [DOI] [PubMed] [Google Scholar]
- 398.Tuzi S, Naito A, Saitô H. J Mol Struct. 2003;654:205–214. [Google Scholar]
- 399.Saitô H, Yamaguchi S, Ogawa K, Tuzi S, Márquez M, Sanz C, Padrós E. Biophys J. 2004;86:1673–1681. doi: 10.1016/S0006-3495(04)74236-8. [DOI] [PMC free article] [PubMed] [Google Scholar]
- 400.Kawamura I, Ohmine M, Tanabe J, Tuzi S, Saitô H, Naito A. Biochim Biophys Acta. 2007;1768:3090–3097. doi: 10.1016/j.bbamem.2007.11.001. [DOI] [PubMed] [Google Scholar]
- 401.Saitô H, Tsuchida T, Ogawa K, Arakawa T, Yamaguchi S, Tuzi S. Biochim Biophys Acta. 2002;1565:97–106. doi: 10.1016/s0005-2736(02)00513-8. [DOI] [PubMed] [Google Scholar]
- 402.Yamamoto K, Tuzi S, Saitô H, Kawamura I, Naito A. Biochim Biophys Acta. 2006;1758:181–189. doi: 10.1016/j.bbamem.2006.01.021. [DOI] [PubMed] [Google Scholar]
- 403.Kamihira M, Watts A. Biochemistry. 2006;45:4304–4313. doi: 10.1021/bi051756j. [DOI] [PubMed] [Google Scholar]
- 404.Kawamura I, Ikeda Y, Sudo Y, Iwamoto M, Shimono K, Yamaguchi S, Tuzi S, Saitô H, Kamo N, Naito A. Photochem Photobiol. 2007;83:339–345. doi: 10.1562/2006-06-20-RA-940. [DOI] [PubMed] [Google Scholar]
- 405.Kawamura I, Yoshida H, Ikeda Y, Yamaguchi S, Tuzi S, Saitô H, Kamo N, Naito A. Photochem Photobiol. 2008;84:921–930. doi: 10.1111/j.1751-1097.2008.00326.x. [DOI] [PubMed] [Google Scholar]
- 406.Shi L, Ahmed MAM, Zhang W, Whited G, Brown LS, Ladizhansky V. J Mol Biol. 2009;386:1078–1093. doi: 10.1016/j.jmb.2009.01.011. [DOI] [PubMed] [Google Scholar]
- 407.Shi L, Lake EMR, Ahmed MAM, Brown LS, Ladizhansky V. Biochim Biophys Acta. 2009;1788:2563–2574. doi: 10.1016/j.bbamem.2009.09.011. [DOI] [PubMed] [Google Scholar]
- 408.Pfleger N, Wőrner AC, Yang J, Shastri S, Helllmich UA, Aslimovska L, Marier MSM, Glaubitz C. Biochim Biophys Acta. 2009;1787:697–705. doi: 10.1016/j.bbabio.2009.02.022. [DOI] [PubMed] [Google Scholar]
- 409.Franks WT, Zhou DH, Wylie BJ, Money BG, Graesser DT, Frericks HL, Sahota G, Rienstra CM. J Am Chem Soc. 2005;127:12291–12305. doi: 10.1021/ja044497e. [DOI] [PubMed] [Google Scholar]
- 410.Lorieau JL, McDermott AE. J Am Chem Soc. 2006;128:11505–11512. doi: 10.1021/ja062443u. [DOI] [PubMed] [Google Scholar]
- 411.Huster D. Prog NMR Spectrosc. 2005;46:79–107. [Google Scholar]
- 412.Krushelnitsky A, Reichert D. Prog NMR Spectrosc. 2005;47:1–25. [Google Scholar]
- 413.Chevelkov V, Faelber K, Schrey A, Rehbein K, Diehl A, Reif B. J Am Chem Soc. 2007;129:10195–10200. doi: 10.1021/ja072024c. [DOI] [PubMed] [Google Scholar]
- 414.Griffin RG. J Am Chem Soc. 1976;98:851–853. doi: 10.1021/ja00419a044. [DOI] [PubMed] [Google Scholar]
- 415.Seelig J. Biochim Biophys Acta. 1978;515:105–140. doi: 10.1016/0304-4157(78)90001-1. [DOI] [PubMed] [Google Scholar]
- 416.Cullis PR, de Kruyff B, Richards RE. Biochim Biophys Acta. 1976;426:433–446. doi: 10.1016/0005-2736(76)90388-6. [DOI] [PubMed] [Google Scholar]
- 417.Seelig J, Seelig A. Quart Rev Biophys. 1980;13:19–61. doi: 10.1017/s0033583500000305. [DOI] [PubMed] [Google Scholar]
- 418.Cullis PR, de Kruijff B. Biochim Biophys Acta. 1979;559:399–420. doi: 10.1016/0304-4157(79)90012-1. [DOI] [PubMed] [Google Scholar]
- 419.Smith ICP, Ekiel IH. In: Phosphorous-31 NMR. Principles and Applications. Gorenstein DG, editor. Academic Press; 1984. pp. 447–475. [Google Scholar]
- 420.Cullis PR, de Kruijff B. Biochim Biophys Acta. 1976;436:523–540. doi: 10.1016/0005-2736(76)90438-7. [DOI] [PubMed] [Google Scholar]
- 421.Campbell RF, Meirovitch E, Freed JH. J Phys Chem. 1979;83:525–533. [Google Scholar]
- 422.Burnell EE, Cullis PR, de Kruijff B. Biochim Biophys Acta. 1980;603:63–69. doi: 10.1016/0005-2736(80)90391-0. [DOI] [PubMed] [Google Scholar]
- 423.Heerklotz H. Biophys J. 2002;83:2693–2701. doi: 10.1016/S0006-3495(02)75278-8. [DOI] [PMC free article] [PubMed] [Google Scholar]
- 424.Holland GP, McIntyre SK, Alam TM. Biophys J. 2006;90:4248–4260. doi: 10.1529/biophysj.105.077289. [DOI] [PMC free article] [PubMed] [Google Scholar]
- 425.Opella SJ, Stewart PL. Methods Enzymol. 1989;176:242–275. doi: 10.1016/0076-6879(89)76015-8. [DOI] [PubMed] [Google Scholar]
- 426.Cross T. Methods Enzymol. 1997;289:672–697. doi: 10.1016/s0076-6879(97)89070-2. [DOI] [PubMed] [Google Scholar]
- 427.Opella SJ, Ma C, Marassi FM. Methods Enzymol. 2001;339:285–313. doi: 10.1016/s0076-6879(01)39319-9. [DOI] [PMC free article] [PubMed] [Google Scholar]
- 428.Opella SJ, Marassi FM. Chem Rev. 2004;104:3587–3606. doi: 10.1021/cr0304121. [DOI] [PMC free article] [PubMed] [Google Scholar]
- 429.Seelig J, Gally H. Biochemistry. 1976;15:5199–5204. doi: 10.1021/bi00669a001. [DOI] [PubMed] [Google Scholar]
- 430.Clark NA, Rothchild KJ, Luippold D, Simon BA. Biophys J. 1980;31:65–96. doi: 10.1016/S0006-3495(80)85041-7. [DOI] [PMC free article] [PubMed] [Google Scholar]
- 431.Sanders CR, Landis GC. Biochemistry. 1995;34:4030–4040. doi: 10.1021/bi00012a022. [DOI] [PubMed] [Google Scholar]
- 432.Sanders CR, Hare BJ, Howard KP, Prestegard JH. Prog Nucl Magn Reson Spectrosc. 1994;26:421–432. [Google Scholar]
- 433.Sanders CR. In: Modern Magnetic Resonance. Webb GA, editor. Springer; 2006. pp. 229–235. [Google Scholar]
- 434.Naito A, Nagao T, Norisada K, Mizuno T, Tuzi S, Saitô H. Biophys J. 2000;78:2405–2417. doi: 10.1016/S0006-3495(00)76784-1. [DOI] [PMC free article] [PubMed] [Google Scholar]
- 435.Kimura S, Naito A, Tuzi S, Saitô H. Biopolymers. 2002;63:122–131. doi: 10.1002/bip.10021. [DOI] [PubMed] [Google Scholar]
- 436.Brender JR, Lee EL, Cavitt MA, Gafni A, Steel DG, Ramamoorthy A. J Am Chem Soc. 2008;130:6424–6429. doi: 10.1021/ja710484d. [DOI] [PMC free article] [PubMed] [Google Scholar]
- 437.Moll F, III, Cross TA. Biophys J. 1990;57:351–362. doi: 10.1016/S0006-3495(90)82536-4. [DOI] [PMC free article] [PubMed] [Google Scholar]
- 438.Hallock KJ, Wildman KH, Lee D-K, Ramamoorthy A. Biophys J. 2002;82:2499–2503. doi: 10.1016/S0006-3495(02)75592-6. [DOI] [PMC free article] [PubMed] [Google Scholar]
- 439.Rainey JK, Sykes BD. Biophys J. 2005;89:2792–2805. doi: 10.1529/biophysj.105.063800. [DOI] [PMC free article] [PubMed] [Google Scholar]
- 440.Sanders CR, Schwonek JP. Biochemistry. 1992;31:8898–8905. doi: 10.1021/bi00152a029. [DOI] [PubMed] [Google Scholar]
- 441.Sanders CR, Prestegard JH. Biophys J. 1990;58:447–460. doi: 10.1016/S0006-3495(90)82390-0. [DOI] [PMC free article] [PubMed] [Google Scholar]
- 442.Vold RR, Prosser RS. J Magn Reson Ser B. 1996;113:267–271. [Google Scholar]
- 443.Luzzatti V, Gulik-Krzywicki T, Tardieu A. Nature. 1968;218:1031–1034. doi: 10.1038/2181031a0. [DOI] [PubMed] [Google Scholar]
- 444.Luzzatti V, Tardieu A. Ann Rev Phys Chem. 1974;25:79–94. [Google Scholar]
- 445.Cullis PR, Hope MJ. Nature. 1978;271:672–674. doi: 10.1038/271672a0. [DOI] [PubMed] [Google Scholar]
- 446.Janes N. Chem Phys Lipids. 1996;81:133–150. [Google Scholar]
- 447.Cullis PR, de Kruijff B. Biochim Biophys Acta. 1978;513:31–42. doi: 10.1016/0005-2736(78)90109-8. [DOI] [PubMed] [Google Scholar]
- 448.Cullis PR, de Kruijff B. Biochim Biophys Acta. 1978;507:207–218. doi: 10.1016/0005-2736(78)90417-0. [DOI] [PubMed] [Google Scholar]
- 449.Cullis PR, van Dijck PWM, de Kruijff B, de Gier J. Biochim Biophys Acta. 1978;513:21–20. doi: 10.1016/0005-2736(78)90108-6. [DOI] [PubMed] [Google Scholar]
- 450.Israelachvili JN, Mitchell DJ. Biochim Biophys Acta. 1975;389:13–19. doi: 10.1016/0005-2736(75)90381-8. [DOI] [PubMed] [Google Scholar]
- 451.de Kruijff B, Cullis PR, Radda GK. Biochim Biophys Acta. 1976;436:729–740. doi: 10.1016/0005-2736(76)90402-8. [DOI] [PubMed] [Google Scholar]
- 452.Israelachvili JN, Mitchell DJ, Ninham BW. J Chem Soc Faraday Trans II. 1976;72:1525–1568. [Google Scholar]
- 453.Israelachvili JN, Marčelja S, Horn RG. Quart Rev Biophys. 1980;13:121–200. doi: 10.1017/s0033583500001645. [DOI] [PubMed] [Google Scholar]
- 454.Hui SW, Sen A. Proc Natl Acad Sci USA. 1989;86:5825–5829. doi: 10.1073/pnas.86.15.5825. [DOI] [PMC free article] [PubMed] [Google Scholar]
- 455.Kumar VV. Proc Natl Acad Sci USA. 1991;88:444–448. doi: 10.1073/pnas.88.2.444. [DOI] [PMC free article] [PubMed] [Google Scholar]
- 456.Lee YC, Taraschi TF, Janes N. Biophys J. 1993;65:1429–1432. doi: 10.1016/S0006-3495(93)81206-2. [DOI] [PMC free article] [PubMed] [Google Scholar]
- 457.Lee YC, Zheng YO, Taraschi TF, Janes N. Biochemistry. 1996;35:2677–3684. doi: 10.1021/bi9517502. [DOI] [PubMed] [Google Scholar]
- 458.Janes N. Chem Phys Lipids. 1996;81:133–150. [Google Scholar]
- 459.Epand RM, Epand RF. Biophys J. 1994;66:1450–1456. doi: 10.1016/S0006-3495(94)80935-X. [DOI] [PMC free article] [PubMed] [Google Scholar]
- 460.Lafleur M, Bloom M, Eikenberry EF, Gruner SM, Han Y, Cullis PR. Biophys J. 1996;70:2747–2757. doi: 10.1016/S0006-3495(96)79844-2. [DOI] [PMC free article] [PubMed] [Google Scholar]
- 461.Hornby AP, Cullils PR. Biochim Biophys Acta. 1981;647:285–292. doi: 10.1016/0005-2736(81)90256-x. [DOI] [PubMed] [Google Scholar]
- 462.Madden TD, Culllis PR. Biochim Biophys Acta. 1982;684:149–53. doi: 10.1016/0005-2736(82)90061-x. [DOI] [PubMed] [Google Scholar]
- 463.Epand RM. Biochemistry. 1985;24:7092–7095. doi: 10.1021/bi00346a011. [DOI] [PubMed] [Google Scholar]
- 464.Sjölund M, Lindblom G, Rilfors L, Arvidson G. Biophys J. 1987;52:145–153. doi: 10.1016/S0006-3495(87)83202-2. [DOI] [PMC free article] [PubMed] [Google Scholar]
- 465.Orädd S, Lindblom G, Fontell K, Ljusberg-Wahren H. Biophys J. 1995;68:1856–1863. doi: 10.1016/S0006-3495(95)80362-0. [DOI] [PMC free article] [PubMed] [Google Scholar]
- 466.Landau EM, Rosenbush JP. Proc Natl Acad Sci USA. 1996;93:14532–14535. doi: 10.1073/pnas.93.25.14532. [DOI] [PMC free article] [PubMed] [Google Scholar]
- 467.de Kruijff B. Nature. 1997;386:129–130. doi: 10.1038/386129a0. [DOI] [PubMed] [Google Scholar]
- 468.Epand RM. Biochim Biophys Acta. 2003;1614:116–121. doi: 10.1016/s0005-2736(03)00169-x. [DOI] [PubMed] [Google Scholar]
- 469.Epand RM. Biochim Biophys Acta. 1998;1376:353–368. doi: 10.1016/s0304-4157(98)00015-x. [DOI] [PubMed] [Google Scholar]
- 470.Epand RM, Epand RF. Biochem Biophys Res Commun. 1994;202:1420–1425. doi: 10.1006/bbrc.1994.2089. [DOI] [PubMed] [Google Scholar]
- 471.Epand RM, Epand RF, Martin I, Ruysschaert JM. Biochemistry. 2001;40:8800–8807. doi: 10.1021/bi0107187. [DOI] [PubMed] [Google Scholar]
- 472.Siegel DP. Biophys J. 1999;76:291–313. doi: 10.1016/S0006-3495(99)77197-3. [DOI] [PMC free article] [PubMed] [Google Scholar]
- 473.Chernomordik L. Chem Phys Lipids. 1996;81:203–213. doi: 10.1016/0009-3084(96)02583-2. [DOI] [PubMed] [Google Scholar]
- 474.de Kruijff B. Nature. 1987;329:587–588. doi: 10.1038/329587a0. [DOI] [PubMed] [Google Scholar]
- 475.de Kruijff B. Curr Opinion Chem Biol. 1997;1:564–569. doi: 10.1016/s1367-5931(97)80053-1. [DOI] [PubMed] [Google Scholar]
- 476.de Grip WJ, Drenthe EH, van Echteld CJ, de Kruijff B, Verkleij AJ. Biochim Biophys Acta. 1979;558:330–337. doi: 10.1016/0005-2736(79)90269-4. [DOI] [PubMed] [Google Scholar]
- 477.Rietveld A, van Kemenade TJJM, Hak T, Verkleij AJ, de Kruijiff B. Eur J Biochem. 1987;164:137–140. doi: 10.1111/j.1432-1033.1987.tb11004.x. [DOI] [PubMed] [Google Scholar]
- 478.Killian JA, de Kruijiff B. Biochemistry. 1985;24:7890–7898. doi: 10.1021/bi00348a007. [DOI] [PubMed] [Google Scholar]
- 479.Killian JA, Salemink I, de Planque MRR, Lindblom G, Koeppe RE, II, Greathouse DV. Biochemisry. 1996;35:1037–1045. doi: 10.1021/bi9519258. [DOI] [PubMed] [Google Scholar]
- 480.Giorgione JR, Huang Z, Epand RM. Biochemistry. 1998;37:2384–2392. doi: 10.1021/bi970873e. [DOI] [PubMed] [Google Scholar]
- 481.Brown MF. Chem Phys Lipids. 1994;73:159–180. doi: 10.1016/0009-3084(94)90180-5. [DOI] [PubMed] [Google Scholar]
- 482.Matsuzaki K, Murase O, Tokuda T, Funakoshi S, Fujii N, Miyajima K. Biochemistry. 1994;33:3342–3349. doi: 10.1021/bi00177a027. [DOI] [PubMed] [Google Scholar]
- 483.Hallock KJ, Lee D-K, Ramamoorthy A. Biophys J. 2003;84:3052–3060. doi: 10.1016/S0006-3495(03)70031-9. [DOI] [PMC free article] [PubMed] [Google Scholar]
- 484.Wi S, Kim C. J Phys Chem B. 2008;112:11402–11414. doi: 10.1021/jp801825k. [DOI] [PubMed] [Google Scholar]
- 485.Harzer U, Bechinger B. Biochemistry. 2000;39:13106–13114. doi: 10.1021/bi000770n. [DOI] [PubMed] [Google Scholar]
- 486.Marasinghe PAB, Buffy JJ, Schmidt-Rohr K, Hong M. J Phys Chem. 2005;109:22036–22044. doi: 10.1021/jp054396i. [DOI] [PubMed] [Google Scholar]
- 487.Hallock KJ, Lee DK, Omnaas J, Mosberg HI, Ramamoothy A. Biophys J. 2002;83:1004–1013. doi: 10.1016/S0006-3495(02)75226-0. [DOI] [PMC free article] [PubMed] [Google Scholar]
- 488.Buffy JJ, McCormick MJ, Wi S, Waring A, Lehrer RI, Hong M. Biochemistry. 2004;43:9800–9812. doi: 10.1021/bi036243w. [DOI] [PubMed] [Google Scholar]
- 489.Nakazawa Y, Suzuki Y, Williamson MP, Saitô H, Asakura T. Chem Phys Lipids. 2009;158:54–60. doi: 10.1016/j.chemphyslip.2008.12.001. [DOI] [PubMed] [Google Scholar]