

Abstract
There are many more strategies for early detection of cancer than can be evaluated with randomized trials. Consequently, model-projected outcomes under different strategies can be useful for developing cancer control policy provided that the projections are representative of the population. To project population-representative disease progression outcomes and to demonstrate their value in assessing competing early detection strategies, we implement a model linking prostate-specific antigen (PSA) levels and prostate cancer progression and calibrate it to disease incidence in the US population. PSA growth is linear on the logarithmic scale with a higher slope after disease onset and with random effects on intercepts and slopes; parameters are estimated using data from the Prostate Cancer Prevention Trial. Disease onset, metastatic spread, and clinical detection are governed by hazard functions that depend on age or PSA levels; parameters are estimated by comparing projected incidence under observed screening and biopsy patterns with incidence observed in the Surveillance, Epidemiology, and End Results registries. We demonstrate implications of the model for policy development by projecting early detections, overdiagnoses, and mean lead times for PSA cutoffs 4.0 and 2.5 ng/mL and for screening ages 50–74 or 50–84. The calibrated model validates well, quantifies the tradeoffs involved across policies, and indicates that PSA screening with cutoff 4.0 ng/mL and screening ages 50–74 performs best in terms of overdiagnoses per early detection. The model produces representative outcomes for selected PSA screening policies and is shown to be useful for informing the development of sound cancer control policy.
Keywords: Decision analysis, Population health, Prostatic neoplasm, Screening
1. INTRODUCTION
The development of sound cancer control policies requires weighing the costs and benefits of many competing alternatives for disease management. In the case of early detection, decisions must be made about ages at which to start and stop screening, the frequency of screening tests, and test-positive criteria. In addition, the subset of newly diagnosed cases requiring treatment must be determined and appropriate therapies, dose levels, and durations must be selected.
While controlled clinical trials are the preferred basis for policy decisions, there are many more candidate strategies than can be evaluated in a clinical trial setting. This is particularly true when a continuous biomarker is available—such as the prostate-specific antigen (PSA) in prostate cancer screening—since this generates a large number of potential test-positive rules for recommending biopsy, rules that may or may not depend on previous tests. The prohibitively expensive nature of cancer screening trials means that the majority of early detection strategies will never be compared in a controlled experimental setting.
When the needed clinical trial has not been done, inferences that will ultimately form the basis for policy development must be pieced together from observational data. One approach for doing this is decision analysis or cost-effectiveness modeling.
Modeling integrates relevant information about the disease and interventions of interest and, ideally, produces a preference ordering over the candidate policies based on projected costs and benefits. There are as many types of models as there are modelers; no standard blueprint exists for model development. Feuer and others (2004) propose a broad taxonomy over the universe of disease models, classifying them as either “epidemiological” or “biological.” Epidemiological models tend to be tailored toward a set of specific policies and typically do not depend on latent events in disease progression; biological models explicitly model the onset and spread of disease and, as a consequence, are often useful in exploring a potentially wider range of strategies than the set originally specified.
In this article, we focus on early detection in the presence of a continuous, biomarker-based screening test. This is exactly the problem we face in the PSA setting, where there is continuing controversy over the threshold for declaring a test result abnormal and how best to incorporate measures such as PSA change over time. Our central premise is that “policy development in this setting requires a model of disease progression that projects representative disease outcomes under a wide range of candidate early detection policies.” More specifically, if the test-positive criteria vary in terms of the biomarker threshold and/or prior biomarker measurements, then we believe that a biological model of biomarker growth and disease progression events is needed.
In recent work, we developed a joint model of PSA growth and disease progression in prostate cancer and fit it to data on PSA growth and stage of disease at detection in a cohort of cancer cases from a stored-serum study (Inoue and others, 2008). However, this relatively small cohort does not represent the population of cancer cases, not least because the cases in the cohort were all detected in the absence of routine PSA screening. It is well known that the majority of prostate cancer cases are latent and remain undiagnosed without screening (Etzioni and others, 1998). Restricting attention to pre-PSA-era cases would yield biased results if our goal is to devise a population-representative model.
The present study therefore has 2 main objectives. The first is to calibrate our model of PSA growth and disease progression so it generates disease incidence trends before and after the dissemination of PSA screening that match those observed in the US population. The second is to illustrate how such a model may be useful in projecting the likely outcomes of PSA screening policies that are currently being considered by guidelines groups in prostate cancer.
2. METHODS
2.1. Overview
Our approach is predicated on the premise that underlying disease progression together with screening practices in the population yield observed disease incidence. Therefore, given disease incidence trends and data on population screening, we should be able to make inferences about the underlying disease progression. A similar method was used by Luebeck and Moolgavkar (2002) to develop a model of colon cancer carcinogenesis using incidence data from the Surveillance, Epidemiology, and End Results (SEER) program of the National Cancer Institute. Similarly, Tsodikov and others (2006) used SEER incidence trends to learn about rates of prostate cancer onset and progression to clinical diagnosis.
Our concept of natural history is multidimensional in that it encapsulates both the biological progression of the disease from a localized tumor to a metastatic cancer and the growth of a disease-related biomarker, in this case PSA. However, tumor registries, the primary source of information on disease incidence, do not provide data on biomarker levels. Therefore, we first estimate biomarker growth and then, conditional on the estimated biomarker growth curves, we estimate the disease progression parameters. The joint model, called the PSA–prostate cancer (PSAPC) model, accounts for the dependence between PSA growth, disease progression, and clinical detection. A simulated likelihood algorithm is used to estimate model parameters and then competing screening policies are evaluated conditional on the resulting parameter estimates. A detailed description of the model and the estimation approach are available at http://cisnet.cancer.gov/prostate/profiles.html.
2.2. PSA growth model
The PSA growth model specifies that
where yi(t) is the PSA level for individual i at age t, toi denotes his age at onset of a preclinical tumor, and I(·) is an indicator function. Time t = 0 is set to correspond to age 35. Here, log PSA levels grow linearly over time with subject-specific intercepts and slopes given by βki∼N(μk,σk2) for k = 0,1,2, and log PSA noise ε∼N(0,τ2). In practice, we use truncated normal distributions for the slopes to force the expected annual percent change in PSA to be positive; this condition is necessary for coherence of the joint model. According to this model, mean log PSA growth accelerates from μ1 to μ1 + μ2 at disease onset. This linear changepoint formulation for log PSA has been used in a number of prior studies (Whittemore and others, 1995, Slate and Cronin, 1997, Inoue and others, 2004).
We estimated preliminary values for the PSA growth model using data from the control arm of the Prostate Cancer Prevention Trial (PCPT) (Thompson and others, 2003), (Etzioni and others, 2005), a randomized trial of finasteride for the prevention of prostate cancer, which screened 18 882 men for up to 7 years. We estimated pre- and postonset PSA slopes using linear random effects models fit to serial log PSA measurements separately for men diagnosed with cancer (based on either symptomatic presentation or end-of-study biopsy) and for men without cancer. For noncancer cases, we used all PSA measurements but for cancer cases, we used the most recent 3 or 4 PSA measurements before diagnosis to capture, as best possible, the interval after disease onset. Models were fit using WinBUGS (Medical Research Council Biostatistics Unit, Cambridge, UK, http://www.mrc-bsu.cam.ac.uk/bugs). Additional details about this data set and the estimation method are provided in section 2 of the supplementary material available at Biostatistics online. PSA growth was externally validated using test-positive and cancer detection rates from the Prostate, Lung, Colorectal, and Ovarian (PLCO) Cancer Screening Trial (Andriole and others, 2005).
2.3. Disease progression model
Disease progression is driven by age or PSA growth. Specifically, a hazard of disease onset, λ0(t), is proportional to age, while hazards of metastatic spread and clinical (i.e. nonscreen) detection, λm(t) and λc(t), are proportional to subject-specific mean PSA at age t:
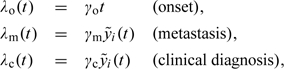 |
where 
Under this specification, it can be shown that the expected increase in a man's PSA from disease onset to metastasis is (β1i + β2i)/γm. Thus, a higher rate of PSA growth or a lower hazard of progression to metastasis yields a greater increase in PSA over this interval. A similar result holds for the expected increase in a man's PSA from disease onset to clinical detection.
We also consider a variant of the model in which the hazard of clinical detection may differ for localized and metastatic tumors:
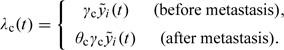 |
Another variant specifies a hazard of onset that is exponential in age, that is, λo(t) = γ0exp(γ1t).
2.4. PSAPC model
The PSAPC model combines the biomarker growth and disease progression models in a microsimulation framework. We simulate a population that matches observed age- and year-specific male population counts in the 9 primary SEER registries from 1975 to 2000. Age at death is generated using birth cohort–specific life tables. Deficits in the population total in any given year are remedied by generating new individuals entering the SEER areas in that year (immigration) and surpluses are mitigated by dropping the newest additions (emigration). PSA trajectories are randomly generated for each individual given the PSA growth model specified earlier. Given an individual's PSA growth curve, his ages at disease onset, metastasis (i.e. transition to SEER distant stage), and clinical diagnosis are generated via the probability integral transform (e.g. Devroye, 1986) corresponding to each hazard function.
For each individual in the population, we also simulate a schedule of PSA screening tests and prostate biopsies. Screening schedules are generated using a simulation routine developed by Mariotto and others (2007), who combined data on first screens from the 2000 National Health Interview Survey with information on between-screen intervals from the SEER-Medicare database. We note, however, that since SEER-Medicare does not provide a reason for PSA testing, it is likely that these screening schedules also include diagnostic tests.
Biopsy compliance frequencies following a positive PSA test are based on data from the PLCO trial, which referred to biopsy when PSA exceeded 4.0 ng/mL (Pinsky and others, 2005). These data reflect compliance rates among men participating in a prospective screening study and do not capture the higher biopsy frequencies among men with symptomatic or metastatic disease. To reflect this phenomenon in the model, we assume 100% biopsy compliance and accuracy for individuals who are within 2 years of transitioning to metastatic disease.
Even if an individual has experienced disease onset, it is not a foregone conclusion that he will have a positive biopsy. Since prostate biopsies have become more extensive (from 4 cores in the 1980s to 6 cores in the 1990s to 10 or more cores currently), biopsy “sensitivity” has been increasing. A number of studies (Babaian and others, 2000), (Presti and others, 2000) have estimated the sensitivity of the 6-core biopsy to be between 70% and 80%. Our biopsy sensitivity increases from 53% (two-thirds of 80%) in 1985, reflecting quadrant biopsy sensitivity, to 80% in 1990 and then linearly from 80% in 1993 to 96% in 2000 based on the advent of more extensive biopsy protocols in the late 1990s (Eichler and others, 2006).
2.5. Disease progression estimation
Given the PSA growth parameters, we estimate disease progression parameters and in the process calibrate the PSAPC model to the US population using a log Poisson likelihood. The likelihood compares observed and expected counts of cases by age, year, and stage at diagnosis:
where Oijk denotes the observed (SEER) number of cases, Eijk = f(γo,γm,γc) denotes the expected (PSAPC) number of cases as a function of the disease progression parameters, i indexes ages 50, …, 84, j indexes years 1975, …, 2000, and k indexes SEER stages local-regional and distant.
The expected counts for a given age, year, and stage are the sum of the screen and clinical detections produced by the model. The observed counts are corresponding values in SEER; we assume that cases with missing stage in SEER have data missing completely at random and impute stage based on the observed stage distribution for each age and year. Since the expected counts are simulation based, this is a simulated likelihood. Chia and others (2004) used simulated maximum likelihood to estimate natural history in breast cancer. Draisma and others (2003) used it in a prostate cancer application, and Luebeck and Moolgavkar (2002) used this approach in colorectal cancer.
We use a modified Nelder–Mead simplex algorithm (Nelder and Mead, 1965, Spall, 2003) to estimate the disease progression parameters. We account for uncertainty in the disease progression parameters due to the simulation framework by reestimating parameters for each of 20 random seeds. Additional details about estimating the disease progression parameters are given in section 3 of the supplementary material available at Biostatistics online.
2.6. Model validation and recalibration
Although the PCPT data represent the most extensive, population-based information on PSA growth in men with and without prostate cancer, 2 of the population-level growth parameters—the mean preonset intercept (μ0) and slope (μ1)—are still subject to considerable uncertainty. This is because the PCPT only included men over the age of 55, whereas the preonset intercept pertains to men aged 35. Moreover, the preonset slope, which represents the PSA growth rate in men without prostate cancer, is likely to be highly age dependent because this is related to the presence of benign prostatic hyperplasia, the incidence of which increases substantially as men age. It is likely that the parameters μ0 and μ1 as estimated from the PCPT do not capture the characteristics of PSA growth for younger men. Therefore, we further tuned these parameters so that a version of the model developed to emulate the PLCO trial produced test-positive and cancer detection rates comparable to those reported for the first round of screening (Andriole and others, 2005). We then reestimated the disease progression parameters based on the recalibrated PSA growth parameters. Additional details about recalibrating the mean preonset PSA growth parameters are given in section 4 of the supplementary material available at Biostatistics online.
2.7. Projecting outcomes for screening policies: proof-of-principle analysis
The ultimate goal of any screening and/or treatment policy is to detect as many progressive cases as early as possible while identifying as few nonprogressive cases as possible. By “progressive,” we mean disease that would advance in the absence of treatment, becoming metastatic or fatal within the lifetime of the patient. By “nonprogressive,” we mean disease that would not present clinically within the lifetime of the patient in the absence of screening. The problem of identifying nonprogressive cases is well known in PSA screening, where it is also termed overdiagnosis. The conflict between the competing goals of maximizing early detection of progressive cases and minimizing detection of nonprogressive cases is a major cause of the ongoing controversies about prostate cancer screening.
The value of a natural history model that links biomarker growth and disease progression is that it can be used to project outcomes of screening policies that vary not only screening ages and intervals but also PSA-based test-positive rules. Naturally, there are many potential outcomes—both positive and negative—of interest. In this article, we focus on 2 main outcomes: detections of progressive cases in a local-regional stage (early detections) and detections of nonprogressive cases (overdiagnoses). As an additional measure of benefit, we also examine mean lead times among nonoverdiagnosed cases, which enable us to capture the benefits of within-stage early detections.
We emphasize that comparison of selected PSA screening strategies based on only these outcomes is a simplification and would be insufficient for informed policy making in practice. A complete picture of the benefits and harms associated with screening strategies would include PSA tests performed, PSA test false positives, biopsies performed, biopsy false positives, types and durations of treatments received, economic costs, quality of life measures, and survival outcomes. We concentrate on these outcomes because they follow directly from our incidence model and because they satisfactorily illustrate our proof of principle.
For purposes of this illustration, we consider 2 PSA cutoffs discussed in the literature: 2.5 and 4.0 ng/mL. The 4.0 ng/mL cutoff is the default policy imposed on our simulated population since we believe that to be most representative of population practice during the time interval considered. We also consider the same population under a policy that uses a 2.5 ng/mL cutoff and project outcomes assuming that this lower cutoff was used between 1990 and 2000. In practice, we assume that the biopsy frequency for men with PSA between 2.5 and 4.0 ng/mL is the same as that for men with a PSA between 4.0 and 7.0 ng/mL—approximately 40% (Pinsky and others, 2005). Consequently, if the true compliance rate is lower, our results may overstate early detections, overdiagnoses, and mean lead times under the lower cutoff. Nevertheless, this example clearly demonstrates how the model enables comparison of competing PSA-based criteria for biopsy referral. In addition, in light of recent changes to guidelines issued by the US Preventive Service Task Force (2008), we examine these cutoffs with or without PSA screening after age 75.
3. RESULTS
To estimate preliminary PSA growth parameters, we analyzed PCPT data from 1022 cancer cases (414 interim cases and 608 diagnosed by end-of-study biopsy) and 7058 subjects who did not have prostate cancer by the end of the follow-up period. When the resulting PSA growth estimates were combined with preliminary disease progression estimates, we found that model-projected age-adjusted test-positive and cancer detection rates (25% and 31%) did not validate well with corresponding values reported in the initial screening round of the PLCO (8% and 44%) (Andriole and others, 2005). Investigating this lack-of-fit, we found that several combinations of μ0 and μ1 led to equally good incidence projections but that some more closely approximated reported PLCO results. Our final selected values of these parameters yield model-projected test-positive and cancer detection rates of 11% and 57%. Note that we expect projected values to be at least modestly higher than corresponding trial values because we are simulating de novo screening, while many trial participants had in fact undergone previous screens (Andriole and others, 2005).
Table 1 presents preliminary and final PSA growth estimates. The estimated mean intercept (i.e. PSA at age 35) across subjects is 0.2 ng/mL, smaller than prior median estimates of 0.6 for men aged 40–49 (Anderson and others, 1995), (Lein and others, 1998), and the estimated mean preonset slope corresponds to an average increase in PSA of approximately 2% per year, which is consistent with several studies (Oesterling and others, 1993), (Whittemore and others, 1995), (Ellis and others, 2001), (Inoue and others, 2004). After disease onset, mean PSA growth accelerates to an annual percent change of approximately 14%. This is considerably lower than the PSA growth rates among cases in previously published stored-serum studies (Whittemore and others, 1995), (Inoue and others, 2004), but the cohorts of cases in these studies included many pre-PSA-era patients; in contrast, the PCPT case cohort was identified under a screening and end-of-study biopsy program. Indeed, the majority of the PCPT cases were diagnosed in the absence of elevated PSA levels. The between-subject variability is considerably lower than the within-subject variability, which is similar for cancer cases and noncancer cases.
Table 1.
Log PSA growth parameter estimates (upper panel) obtained via separate linear fits to PCPT cancer and noncancer cases. Preliminary preonset intercept and slope means were fine-tuned based on test-positive and cancer detection rates in the initial round of the Prostate, Lung, Colorectal, and Ovarian Cancer Screening Trial. Disease progression parameter estimates (lower panel) obtained via Nelder–Mead simplex calibration to incidence data from the SEER program across random seeds
| Log PSA growth parameters | |||
| Parameter | Description | Posterior mean | Posterior 95% CI |
| μ0 | Preonset intercept mean (preliminary) | − 1.2720 | (− 0.8047)–(− 1.7393) |
| μ1 | Preonset slope mean (preliminary) | 0.0443 | 0.0431–0.0455 |
| μ0 | Preonset intercept mean (final) | − 1.6094 | (− 1.1421)–(− 2.0767) |
| μ1 | Preonset slope mean (final) | 0.0200 | 0.0188–0.0212 |
| μ2 | Postonset slope increment mean | 0.1094 | 0.0919–0.1269 |
| σ02 | Preonset intercept variance | 0.0568 | 0.0480–0.0656 |
| σ12 | Preonset slope variance | 0.0019 | 0.0018–0.0020 |
| σ22 | Postonset slope increment variance | 0.0237 | 0.0202–0.0272 |
|
τ2 |
Within-individual variance |
0.0829 |
0.0817–0.0841 |
| Disease progression parameters | |||
| Parameter |
Description |
Simplex mean |
Simplex 95% CI |
| γ0 | Hazard of disease onset | 0.0005 | 0.0004–0.0005 |
| γm | Hazard of transition to metastatic disease | 0.0004 | 0.0004–0.0005 |
| γc | Hazard of clinical diagnosis | 0.0015 | 0.0013–0.0017 |
| θc | Multiplier for hazard of clinical diagnosis | 19.1334 | 4.2105–24.0563 |
We assessed incidence projections of model variants based on how well they captured broad patterns in observed incidence. We paid particularly close attention to the peak in local-regional stage incidence and the decline in distant stage incidence. This assessment indicated that a clinical detection hazard that depends on stage outperforms the baseline specification, a linear onset hazard outperforms an exponential onset hazard, and a diagnostic testing interval of 2 years is reasonably consistent with observed incidence. We integrated these findings into a final model and reestimated the disease progression parameters across 20 random seeds. Parameter estimates are reported in the lower panel of Table 1, where we see that the greatest uncertainty is associated with the multiplier for the clinical detection hazard for distant stage cancers (θc). This parameter is difficult to estimate precisely since a small increase when θc is already large advances clinical diagnosis of a distant stage cancer a matter of days and so corresponds to only a small impact on the likelihood.
Figure 1 illustrates observed and model-projected age-adjusted incidence curves averaged across random seeds by disease stage in the presence of PSA screening. Confidence interval (CI) estimates are shown in each year based on uncertainty due to the random seed. The figure also shows model-projected age-adjusted incidence had there been no PSA screening, that is, the model's best estimate of the secular trend in stage-specific disease incidence in the absence of PSA screening. Projected incidence in the absence of PSA is more or less constant at about the level observed in 1985 for both local-regional and distant stage disease. In the presence of PSA screening, model projections match the general shape of observed stage-specific incidence trends fairly closely, though the model overprojects in the late 1970s for both stages and underprojects (overprojects) in the late 1990s for local-regional (distant) stage. The difficulty with capturing the distant stage incidence decline observed since 1990 was observed by Etzioni and others (2008) under a completely different model, leading them to suggest that alternative explanations (e.g. changes in public awareness of prostate cancer during the PSA era or use of PSA as a diagnostic test in symptomatic patients) likely contributed to producing a decline beyond that due solely to PSA screening.
Fig. 1.

Observed and mean model-projected age-adjusted local-regional (a) and distant (b) stage prostate cancer incidence in the presence and in the absence of PSA screening. Superimposed are 95% CIs reflecting uncertainty due to the random seed.
Table 2 reports mean times between natural history and clinical or screen detection events based on the parameter estimates in Table 1. The measures are generally consistent with previously published studies. For example, the model indicates that the age-adjusted mean sojourn time is approximately 13.5 years, which is similar to the estimate in Etzioni and others (1998). Mean lead times are longer for younger men than for older men; this is a consequence of our definition of lead time, which applies to the subset of cases with clinical diagnosis in their lifetimes. Naturally, as men age and their remaining life expectancy declines, the range of plausible intervals until any event such as clinical diagnosis narrows. The mean lead times are slightly higher than some previously published studies (Gann and others, 1995), (Telesca and others, 2008) but are lower than others (Draisma and others, 2003), (Tornblom and others, 2004). Note, however, that estimates based on data from the European screening trial differ in important ways from the US population setting, and these cannot, strictly speaking, be compared (Draisma and others, 2009).
Table 2.
Mean years from screen detection to clinical detection by age at screen detection among men who would have been clinically diagnosed in their lifetimes (lead), mean years from onset to clinical detection by age at onset among men who would have been clinically diagnosed in their lifetimes (sojourn), and mean years from onset to metastasis by age at onset among men who would have developed metastatic disease in their lifetimes (local)
| Age group | Lead | Sojourn | Local |
| 50–54 | 7.8 | 18.5 | 21.7 |
| 55–59 | 8.0 | 16.4 | 19.4 |
| 60–64 | 7.7 | 14.2 | 17.0 |
| 65–69 | 7.0 | 12.0 | 14.5 |
| 70–74 | 6.2 | 9.7 | 11.8 |
| 75–79 | 5.4 | 7.4 | 9.0 |
| 80–84 |
3.2 |
5.2 |
6.2 |
| Age-adjusted mean | 7.0 | 13.5 | 16.1 |
| Age-adjusted 95% CI | 6.7–7.2 | 13.2–13.7 | 15.9–16.2 |
Figure 2 presents comparisons of outcomes for the 4 candidate PSA screening policies. It can be clearly seen in Panel (a) that, irrespective of the screening age cap, lowering the PSA test-positive threshold from 4.0 to 2.5 ng/mL incurs a large number of additional overdiagnoses while moving only a handful of potentially fatal cases to a presumably more curable stage. Specifically, on average, lowering the test cutoff when screening men aged 50–84 generates 150 (95% CI due to the random seed [95–199]) additional overdiagnoses for each additional early detection and when screening men aged 50–74 generates 101 (95% CI:68–154) additional overdiagnoses for each additional early detection.
Fig. 2.

Comparisons of model-projected benefits and harms across random seeds corresponding to PSA test-positive cutoffs 2.5 or 4.0 ng/mL for screening ages 50–74 or 50–84 and for years 1990–2000 in the SEER 9 population. In both panels, line segments, shaded for screening ages, connect projections for the 2 cutoffs from corresponding random seeds. Panel (a) presents counts of overdiagnoses (in thousands) and early detections (in thousands) and Panel (b) presents overdiagnosis rates (as percentages of PSA detections) versus mean lead times (in years). Note that due to relative insensitivity to the random seed when quantifying the tradeoff in Panel (b), the line segments and projected points overlap considerably.
Complementing this tradeoff, Panel (b) presents overdiagnosis rates (as percentages of PSA detections) versus mean lead times (in years) projected for the 4 PSA screening policies. From this perspective, we see that, irrespective of the screening age cap, lowering the PSA test-positive threshold from 4.0 to 2.5 ng/mL increases both the overdiagnosis rate and the mean lead time. Specifically, on average, lowering the test cutoff when screening men aged 50–84 increases the overdiagnosis rate by 5.0% (95% CI [4.7–5.3]) while extending the mean lead time 0.75 (95% CI [0.72–0.77]) years and when screening men aged 50–74 increases the overdiagnosis rate by 6.8% (95% CI [6.4–7.4]) while extending the mean lead time 0.93 (95% CI [0.90–0.96]) years. The value of this tradeoff will depend on the benefit associated with early detection of disease within the same broad SEER stage. To quantify this would require modeling of disease-specific survival under population treatment patterns, which is beyond the scope of the present study.
Finally, to demonstrate model rankings, we consider total overdiagnoses per total early detections. The model ranks the 4 policies as follows: screening ages 50–74 with cutoff 4.0 ng/mL (4.3, 95% CI [3.9–4.7]), screening ages 50–84 with cutoff 4.0 ng/mL (5.0, 95% CI [4.5–5.4]), screening ages 50–74 with cutoff 2.5 ng/mL (5.8, 95% CI [5.4–6.3]), and screening ages 50–84 with cutoff 2.5 ng/mL (6.8, 95% CI [6.3–7.4]). Interestingly, while the interpretation is less straightforward, considering overdiagnosis percentages per year of expected lead time yields the same ranking. While these metrics represent a small number of the great many possible systems for developing policy rankings, it is worth noting that these rankings for these policies are consistent with updated recommendations by the US Preventive Service Task Force (2008).
4. CONCLUSIONS
This manuscript is the first step in the development of what we believe will ultimately be a vitally important tool in the development of PSA-based screening policies. The future usefulness of the model rests on 3 critical features: (1) it is calibrated to the population and therefore likely to be representative of expected population outcomes, (2) it explicitly links key disease progression events with biomarker growth, and (3) it is designed to quantify both the positive and the negative outcomes that are most clinically relevant in making informed policy decisions.
All models have limitations and the present example is no exception. Perhaps the main limitation of the model is that the disease progression estimates are conditional on a number of inputs that are themselves estimated from a variety of sources. First, the PSA growth curve and its variance components are derived from studies of the PSA distribution in younger men and the PCPT. Each of these data sources is population representative and fairly extensive, so that the statistical error in the resulting parameter estimates appears to be relatively low. In addition, the inputs relating to the practice of PSA screening in the population have all been estimated or retrospectively inferred based on observational data or published studies. The disease progression estimates in Table 1 are all conditional on the frequency of PSA use, the likelihood of a biopsy, and the biopsy sensitivity, which is closely tied to the number of biopsy cores. Since these quantities are almost certainly estimated with some error, we are understating the noise in the model results. While we do not believe that this will have a material effect on the relative ranking of candidate policies, it will affect how certain we are about the size of the differences between policies, and this must be borne in mind, particularly when deciding between competing polices that yield similar outcomes.
There are structural decisions that must be taken into account when developing a model, and these are also subject to uncertainty. For example, we have specified that the risks of metastasis and clinical diagnosis depend on PSA (instead of, say, log PSA), that subject-specific PSA slopes have truncated normal distributions (instead of, say, gamma distributions), and that random draws determining compliance at consecutive PSA screens are independent (instead of, say, correlated with a specific correlation structure); while we considered many more model variants than we have reported here, there is no guarantee that our final model structure is the best of a class.
We recognize that there are still a number of important steps that must be taken before the model is ready for use in practice. Future work will explicitly account for disease grade, which is associated with PSA growth, disease progression, and survival. In addition, we plan to decompose the local-regional stage into locally advanced and nonadvanced disease. Further outcomes, including PSA tests performed, PSA test false positives, biopsies performed, biopsy false positive, types and durations of treatments received, economic costs, and, perhaps most importantly, mortality, will be added so that the full range of outcomes that must be considered by policy makers can be evaluated.
The incorporation of mortality as an endpoint will require extending the model to project disease-specific survival times given disease characteristics at diagnosis. Data on disease-specific survival are available from numerous sources in addition to SEER, but outcomes generally depend on the initial treatment received. The question of whether and how best to treat newly diagnosed prostate cancer is critically important and continues to generate a great deal of controversy even as active surveillance approaches are gaining traction in some practices. The extended model will enable us to consider treatment policies jointly with screening policies, which should advance our progress toward our goal of comprehensive policy development via modeling.
Our vision is to produce a comprehensive model of prostate cancer natural history and response to interventions, calibrated to the general population, to inform cancer control policy by projecting realistic multidimensional outcomes. In the absence of definitive population-based randomized controlled trials, these projections will be critical to assessing the comparative effectiveness of competing screening and treatment policies. The work described in this paper represents the first step toward developing this structured framework for policy development and should ultimately be useful for informing biomarker-based screening and treatment policies for any progressive disease.
SUPPLEMENTARY MATERIALS
Supplementary material is available at http://biostatistics.oxfordjournals.org.
FUNDING
National Cancer Institute (U01CA88160, R01CA131874).
Supplementary Material
Acknowledgments
We thank the members of the CISNET prostate group and Eric Feuer and Angela Mariotto from the National Cancer Institute for support and helpful feedback. We thank Dr Georg Luebeck for providing the source code for Bhat, a collection of Fortran routines used for likelihood exploration. We also thank Paul Pinksy, who provided extended PLCO biopsy compliance data, and Catherine Tangen and Phyllis Goodman of the PCPT data and statistics coordinating center, who provided the PCPT data used to estimate the PSA growth parameters. The content is solely the responsibility of the authors and does not necessarily represent the official views of the National Cancer Institute or the National Institutes of Health. Conflict of Interest: None declared.
References
- Anderson JR, Strickland D, Corbin D, Byrnes JA, Zweiback E. Age-specific reference ranges for serum prostate-specific antigen. Urology. 1995;46:54–57. doi: 10.1016/s0090-4295(99)80158-7. [DOI] [PubMed] [Google Scholar]
- Andriole GL, Levin DL, Crawford ED, Gelmann EP, Pinsky PF, Chia D, Kramer BS, Reding D, Church TR, Grubb RL and others. Prostate cancer screening in the Prostate, Lung, Colorectal and Ovarian (PLCO) Cancer Screening Trial: findings from the initial screening round of a randomized trial. Journal of the National Cancer Institute. 2005;97:433–438. doi: 10.1093/jnci/dji065. [DOI] [PubMed] [Google Scholar]
- Babaian RJ, Toi A, Kamoi K, Troncoso P, Sweet J, Evans R, Johnston DA, Chen M. A comparative analysis of sextant and an extended 11-core multisite directed biopsy strategy. Journal of Urology. 2000;163:152–157. [PubMed] [Google Scholar]
- Chia YL, Salzmann P, Plevritis SK, Glynn PW. Simulation-based parameter estimation for complex models: a breast cancer natural history modelling illustration. Statistical Methods in Medical Research. 2004;13:507–524. doi: 10.1191/0962280204sm380ra. [DOI] [PubMed] [Google Scholar]
- Devroye L. Non-Uniform Random Variate Generation. New York: Springer-Verlag; 1986. [Google Scholar]
- Draisma G, Boer R, Otto SJ, van der Cruijsen IW, Damhuis RA, Schröder FH, de Koning HJ. Lead times and overdetection due to prostate-specific antigen screening: estimates from the European randomized study of screening for prostate cancer. Journal of the National Cancer Institute. 2003;95:868–878. doi: 10.1093/jnci/95.12.868. [DOI] [PubMed] [Google Scholar]
- Draisma G, Etzioni R, Tsodikov A, Mariotto A, Wever E, Gulati R, Feuer E, de Koning H. Lead time and overdiagnosis in prostate-specific antigen screening: Importance of methods and context. Journal of the National Cancer Institute. 2009;101:374–383. doi: 10.1093/jnci/djp001. [DOI] [PMC free article] [PubMed] [Google Scholar]
- Eichler K, Hempel S, Wilby J, Myers L, Bachmann LM, Kleijnen J. Diagnostic value of systematic biopsy methods in the investigation of prostate cancer: a systematic review. Journal of Urology. 2006;175:1605–1612. doi: 10.1016/S0022-5347(05)00957-2. [DOI] [PubMed] [Google Scholar]
- Ellis WJ, Etzioni R, Vessella RL, Hu C, Goodman GE. Serial prostate specific antigen, free-to-total prostate specific antigen ratio and complexed prostate specific antigen for the diagnosis of prostate cancer. Journal of Urology. 2001;166:93–98. [PubMed] [Google Scholar]
- Etzioni R, Cha R, Feuer EJ, Davidov O. Asymptomatic incidence and duration of prostate cancer. American Journal of Epidemiology. 1998;148:775–785. doi: 10.1093/oxfordjournals.aje.a009698. [DOI] [PubMed] [Google Scholar]
- Etzioni R, Gulati R, Falcon S, Penson D. Impact of PSA screening on the incidence of advanced stage prostate cancer in the US: a surveillance modeling approach. Medical Decision Making. 2008;28:323–331. doi: 10.1177/0272989X07312719. [DOI] [PubMed] [Google Scholar]
- Etzioni RD, Howlader N, Shaw PA, Ankerst DP, Penson DF, Goodman PJ, Thompson IM. Long-term effects of finasteride on prostate specific antigen levels: results from the prostate cancer prevention trial. Journal of Urology. 2005;174:877–881. doi: 10.1097/01.ju.0000169255.64518.fb. [DOI] [PubMed] [Google Scholar]
- Feuer EJ, Etzioni R, Cronin KA, Mariotto A. The use of modeling to understand the impact of screening on US mortality: examples from mammography and PSA testing. Statistical Methods in Medical Research. 2004;13:421–442. doi: 10.1191/0962280204sm376ra. [DOI] [PubMed] [Google Scholar]
- Gann PH, Hennekens CH, Stampfer MJ. A prospective evaluation of plasma prostate-specific antigen for detection of prostatic cancer. Journal of the American Medical Association. 1995;73:289–294. [PubMed] [Google Scholar]
- Inoue L, Etzioni R, Morrell C, Muller P. Modeling disease progression with longitudinal markers. Journal of the American Statistical Association. 2008;103:259–270. doi: 10.1198/016214507000000356. [DOI] [PMC free article] [PubMed] [Google Scholar]
- Inoue L, Etzioni R, Slate E, Morrell C. Combining longitudinal studies of PSA. Biostatistics. 2004;5:484–500. doi: 10.1093/biostatistics/5.3.483. [DOI] [PubMed] [Google Scholar]
- Lein M, Koenig F, Jung K, McGovern FJ, Skates SJ, Schnorr D, Loening SA. The percentage of free prostate specific antigen is an age-independent tumour marker for prostate cancer: Establishment of reference ranges in a large population of healthy men. British Journal of Urology. 1998;82:231–236. doi: 10.1046/j.1464-410x.1998.00723.x. [DOI] [PubMed] [Google Scholar]
- Luebeck EG, Moolgavkar SH. Multistage carcinogenesis and the incidence of colorectal cancer. Proceedings of the National Academy of Sciences of the United States of America. 2002;99:15095–15100. doi: 10.1073/pnas.222118199. [DOI] [PMC free article] [PubMed] [Google Scholar]
- Mariotto A, Etzioni R, Krapcho M, Feuer EJ. Reconstructing prostate-specific antigen (PSA) testing patterns among black and white men in the US from Medicare claims and the National Health Interview Survey. Cancer. 2007;109:1877–1886. doi: 10.1002/cncr.22607. [DOI] [PubMed] [Google Scholar]
- Nelder J, Mead R. A simplex method for function minimization. Computer Journal. 1965;7:308–313. [Google Scholar]
- Oesterling JE, Jacobsen SJ, Chute CG, Guess HA, Girman CJ, Panser LA, Lieber MM. Serum prostate-specific antigen in a community-based population of healthy men: establishment of age-specific reference ranges. Journal of the American Medical Association. 1993;270:860–864. [PubMed] [Google Scholar]
- Pinsky PF, Andriole GL, Kramer BS, Hayes RB, Prorok PC, Gohagan JK. Prostate biopsy following a positive screen in the Prostate, Lung, Colorectal and Ovarian Cancer Screening Trial. Journal of Urology. 2005;173:746–750. doi: 10.1097/01.ju.0000152697.25708.71. discussion 750–751. [DOI] [PubMed] [Google Scholar]
- Presti JCJ, Chang JJ, Bhargava V, Shinohara K. The optimal systematic prostate biopsy scheme should include 8 rather than 6 biopsies: results of a prospective clinical trial. Journal of Urology. 2000;163:163–166. discussion 166–167. [PubMed] [Google Scholar]
- Slate E, Cronin KA. Changepoint modeling of longitudinal PSA as a biomarker for prostate cancer. In: Gatsonis C, Hodges JS, Kass RE, McCulloch RE, Rossi P, Singpurwalla ND, editors. Case Studies in Bayesian Statistics. Volume III. New York: Springer; 1997. pp. 435–456. [Google Scholar]
- Spall J. Introduction to Stochastic Search and Optimization: Estimation, Simulation, and Control. Hoboken, NJ: Wiley; 2003. [Google Scholar]
- Telesca D, Etzioni R, Gulati R. Estimating lead time and overdiagnosis associated with PSA screening from prostate cancer incidence trends. Biometrics. 2008;64:10–19. doi: 10.1111/j.1541-0420.2007.00825.x. [DOI] [PubMed] [Google Scholar]
- Thompson IM, Goodman PJ, Tangen CM, Lucia MS, Miller GJ, Ford LG, Lieber MM, Cespedes RD, Atkins JN, Lippman SM AND OTHERS and others. The influence of finasteride on the development of prostate cancer. New England Journal of Medicine. 2003;349:215–224. doi: 10.1056/NEJMoa030660. [DOI] [PubMed] [Google Scholar]
- Tornblom M, Eriksson H, Franzen S, Gustafsson O, Lilja H, Norming U, Hugosson J. Lead time associated with screening for prostate cancer. International Journal of Cancer. 2004;108:122–129. doi: 10.1002/ijc.11554. [DOI] [PubMed] [Google Scholar]
- Tsodikov A, Szabo A, Wegelin J. A population model of prostate cancer incidence. Statistics in Medicine. 2006;25:2846–2866. doi: 10.1002/sim.2257. [DOI] [PubMed] [Google Scholar]
- US Preventive Service Task Force. Screening for prostate cancer: U.S. Preventive Services Task Force recommendation statement. Annals of Internal Medicine. 2008;149:185–191. doi: 10.7326/0003-4819-149-3-200808050-00008. [DOI] [PubMed] [Google Scholar]
- Whittemore AS, Lele C, Friedman GD, Stamey T, Vogelman JH, Orentreich N. Prostate-specific antigen as predictor of prostate cancer in black men and white men. Journal of the National Cancer Institute. 1995;87:354–360. doi: 10.1093/jnci/87.5.354. [DOI] [PubMed] [Google Scholar]
Associated Data
This section collects any data citations, data availability statements, or supplementary materials included in this article.