

Abstract
We present a novel application of active voltage control of DNA captured in a nanopore to regulate the amount of time the DNA is available to molecules in the bulk phase that bind to the DNA. In this work, the control method is used to measure hybridization between a single molecule of DNA captured in a nanopore and complementary oligonucleotides in the bulk phase. We examine the effect of oligonucleotide length on hybridization, and the effect of DNA length heterogeneity on the measurements. Using a mathematical model, we are able to deduce the binding rate of complementary oligonucleotides, even when DNA samples in experiments are affected by heterogeneity in length. We analyze the lifetime distribution of DNA duplexes that are formed in the bulk phase and then pulled against the pore by reversing the voltage. The lifetime distribution reveals several dissociation modes. It remains to be resolved whether these dissociation modes are due to DNA heterogeneity or correspond to different states of duplex DNA. The control method is unique in its ability to detect single-molecule complex assembly in the bulk phase, free from external force and with a broad (millisecond-to-second) temporal range.
Introduction
Biological and solid-state nanopores are established methods for analyzing the structure and composition of single DNA or RNA molecules (1–3) and offer great promise for genomic sequencing (4). The heptameric protein α-hemolysin (α-HL) is the most commonly used biological nanopore. Structurally, this asymmetric membrane-spanning pore is characterized by an expanded vestibule at one end (the cis-chamber side) that tapers to a limiting aperture with a ∼1.5-nm diameter, just wide enough to accommodate single-stranded DNA (ssDNA) (5). Beyond the limiting aperture, the cylindrically shaped stem extends to the trans-chamber side. Classical α-HL experiments capture independent copies of DNA molecules from the bulk phase and measure the lifetime and impeded current amplitude of each molecule in the pore (6). Modeling the distribution of duplex DNA lifetimes in the pore, researchers have shown sensitivity to nucleotide identity and duplex length at up to one-basepair resolution (7–10).
Bayley and co-workers have varied and improved the discrimination of the biological pore through targeted mutations and modifications with covalently attached molecular adaptors (11–13). For example, a modified pore containing an eight-nucleotide DNA strand covalently attached to the pore interior was used to study hybridization and dissociation kinetics between translocating oligonucleotides and the attached DNA (12). In this method, hybridization occurs in the confined space of the vestibule and in the presence of a trans-channel voltage high enough to promote DNA capture (e.g., 100 mV). More recently, a modified pore permitted identification of 5′-deoxynucleotides translocating through the pore as a candidate sequencing method (13).
Active control of DNA in the pore provides an alternative method of varying and improving the capabilities of the nanopore. In essence, active control refers to automated changes in the voltage across the pore, triggered by time and/or detected shifts in the measured current through the pore (14,15). Meller and co-workers were the first to make use of active control methods with biological nanopores, initially to explore DNA-pore interactions (14) and later to enable dynamic forcing of DNA hairpins (16) and DNA-protein molecules (17) for the purpose of measuring and modeling their dissociation kinetics. Marziali and co-workers have also made use of active control to measure and model the dissociation kinetics of duplex DNA assembled in the trans chamber (10). Specifically, control triggered automated capture and holding of DNA from the cis chamber in the α-HL pore, exposing the captured ssDNA end to partially or fully complementary oligodeoxynucleotide (ODN) strands in solution in the trans chamber. Modeling the lifetime distribution of trans-side assembled duplexes revealed sensitivity to single-nucleotide substitutions in the ODNs, and a novel multiple-pore application of the method dramatically increased throughput (15). The control approach is, in principle, universally applicable to biological and solid-state pores. Gershow and Golovchenko used active control to repeatedly recapture and translocate a double-stranded DNA molecule through a solid-state nanopore, showing that the observed recapture rates agree with solutions of a drift-diffusion model (18).
In this work, we implement active control to regulate and vary the exposure time of the captured ssDNA end to complementary ODNs in solution in the trans chamber. Varying the exposure time from 1 to 500 ms permits direct measurement of the hybridization kinetics between captured DNA and complementary ODNs. By contrast, a related work (10) implemented only a single exposure time, focusing on the lifetime distribution of trans-side assembled duplexes and not their assembly. In contrast to measuring hybridization in the pore vestibule (12), our method permits measurement of hybridization kinetics for duplexes of (in principle) arbitrary length, with assembly occurring in the bulk phase, free from any external force. The active control method we employ is in essence the same as the method of Bates et al. (14). By varying the off time of the voltage from 0.065 to 10.065 ms, those authors measured and modeled the probability of DNA escape from the nanopore. We are therefore applying a previously-implemented active control method but in a novel way, to measure and model association kinetics between a single DNA and molecular species that bind DNA.
This work builds on our recent work in which active control was used to regulate the exposure time of a single DNA in the pore, noncovalently tethered by duplex regions, to binding DNA polymerase molecules in solution (19). In this article, we combine the association measurements afforded by the control method with mathematical modeling in the venue of measuring single-molecule DNA hybridization in the bulk phase and free from external force. We examine the effects of DNA purity, in the form of length heterogeneity, on the measurements and model parameters. DNA length heterogeneity is intrinsic to phosphoramidite synthesis and occurs due to the nature of chemistry and physics even without machine or human error (20,21). Lower purity is also more likely with longer oligonucleotides and can remain present to some extent after purification. We compare two syntheses of DNA, one with lower relative purity, and demonstrate that the control method deduces the binding rate of ODNs even with the DNA samples having greater length heterogeneity.
The measured hybridization kinetics are shown to closely match the theory developed for bulk-phase hybridization (22,23). We analyze the lifetime distribution of DNA duplexes when they are pulled against the pore by reversing the voltage. The lifetime distribution reveals several dissociation modes. There are two possible explanations for the multiple dissociation modes: 1), different dissociation modes are caused by DNA length heterogeneity, consistent with the observation in Nakane et al. (10) that the average DNA duplex lifetime is affected by a single nucleotide mismatch; and 2), these dissociation modes actually represent different interaction states between the correct DNA and complementary ODN. Identifying how to exclude or confirm the second possibility remains an experimental challenge, since it is difficult to fully eliminate DNA length heterogeneity in experimental samples.
Materials and Methods
Polynucleotide preparation
DNA oligonucleotides were synthesized by the Stanford University Protein and Nucleic Acid Facility and purified by denaturing polyacrylamide gel electrophoresis. The sequences of the 59-mer target and the 10- and 20-mer binding ODNs are shown below. The sequence of the 26-mer that was preannealed to the target is also given, with the annealing method described previously (24).
-
20-mer binding oligomer:
5′-TGAGTGGAAGGATAGGTGAG-3′
-
10-mer binding oligomer:
5′-GATAGGTGAG-3′
-
26-mer:
5′-GGCTACGACCTGCATGAGAATGCGAT-3′
-
59-mer target:
5′-CTCACCTATCCTTCCACTCATTCCAATTACACTATCGCATTCTCATGCAGGTCGTAGCC-3′
The experiments (pH 8, 1 M KCl) are conducted at 23°C, well below the salt-adjusted melting temperatures of the 10-mer (47.8°C) and 20-mer (79.6°C) ODNs, computed using OligoCalc (25) based on the nearest-neighbor method (26).
General nanopore methods
Experiments were conducted at 23°C in 10 mM HEPES/KOH, pH 8.00 ± 0.05, and 1.0 M KCl. In all experiments, 1–3 μM DNA substrate was present in the cis chamber, and 500 μL of buffer for the trans chamber was made before an experiment at the desired binding oligomer concentration. Single α-HL channels were formed as described (2). A patch-clamp amplifier (AxoPatch 200B, Molecular Devices, Sunnyvale, CA) was used to apply transmembrane voltage and measure ionic current, with the four-pole Bessel filter set at a 5 kHz bandwidth. A digitizer (Digidata 1440A, Molecular Devices) stored data sampled at 200 kHz.
Active-voltage-control experiments
Active-voltage-control logic was implemented as a finite-state machine (FSM), a logic construct where program execution is broken into a series of individual states, as described previously (24). Measurements determine which state the logic is in, and therefore the sequence of executed commands over time. The FSM was programmed with LabVIEW software (Version 8, National Instruments, Austin, TX) and implemented on a field-programmable gate array (FPGA) system (PCI-7831R, National Instruments). The FPGA was connected to the Axopatch 200B. This permitted transmembrane voltage control and ionic current measurements at 5.3-μs updates. To improve the signal/noise ratio, the ionic current signal was filtered on the FPGA using a single-pole low-pass filter with 1.58 kHz cutoff frequency and a 10–90% rise time of ∼0.2 ms.
The FSM initialized by first detecting capture of a DNA molecule at 120 mV, by testing whether the low-pass-filtered current remained within amplitude thresholds (18 ± 5 pA) for 0.2 ms, and then reduced the voltage to 50 mV for the time periods, tf, specified in the figures and tables. The FSM then triggered the probing voltage (−20 mV unless stated otherwise in figures or tables) for 100 ms and tested for an open-channel current of −15 pA. If an open channel was detected, the voltage was returned to the capturing voltage of 120 mV; otherwise, duplex formation occurred (current sustained at −3 pA) and probing was maintained for up to 300 ms. If the transition to open channel was detected before 300 ms, the 120-mV capture voltage was resumed; otherwise, −120 mV voltage was applied for 100 ms to force dissociation of the duplex and clear the channel, after which 120 mV for capture was resumed.
In nanopore systems using patch-clamp technology, a step change in voltage induces a capacitive transient superimposed on the ionic current measurement. The transient masks information in the measured current for a time proportional to the magnitude of the net voltage change. Transient compensation circuitry is built into the Axopatch 200B. This circuitry will inject a current into the system at the moment of a voltage change to neutralize the capacitive transient current. This circuitry is changed by adjusting knobs that control a fast and slow capacitive compensation. For the experiments described, only the fast compensation was needed and it usually required close to the maximum magnitude of the compensation. The change from the 50-mV holding voltage to the −20-mV probing voltage excited a capacitive transient lasting ∼5 ms without compensation, but at most ∼0.5 ms with compensation, in all experimental results presented here. The compensated settling was therefore universally within our 0.7-ms duplex dissociation detection resolution.
Data processing
All numerical analysis and data processing was done using our own code written in MATLAB (2007a, The MathWorks, Natick, MA). Briefly, each event was extracted from the raw data. Due to the thermodynamics of DNA captures, DNA molecules can escape the nanopore even under a small applied voltage (15), requiring logic to test whether or not the DNA was still in the pore at the onset of probing. If a DNA escape occurred at 50 mV before probing, it was ignored in the analysis. To detect for dissociation of binding oligomers at the probing voltage (−20 mV unless stated otherwise) a current threshold (−10 pA) was used to check for the change of the current from a blockade current (−3 pA) to an open-channel current (−15 pA). Due to the capacitive transient, as described in the previous section, the code ignores the first 0.5 ms of current after the onset of probing. To determine duplex lifetime measurements, the start time was set to the time when the probing voltage was initiated. Controls with DNA targets in the cis chamber but no binding oligomer present in the trans chamber showed short blockades of the current after the probing voltage was applied (a brief current level of −3 pA before returning to the open-channel level of −15 pA). The median blockade was 0.3 ms, with ≥99% blockades lasting <0.7 ms.
Results and Discussion
The α-HL nanopore is inserted into a lipid bilayer that separates two compartments, cis and trans, containing target DNA and binding ODNs, respectively, in 1 M KCl solution (Fig. 1 A). Hybridization is therefore possible only in the trans chamber, between each DNA strand captured in the nanopore (the target DNA) and the ODNs in solution in the trans chamber (the binding ODNs). We used a 59-mer/26-mer duplex DNA with a 5′ overhang 33 nucleotides in length for the target, and 10- or 20-mer ODNs in the trans chamber complementary to the 5′ end of the target DNA. Upon capture of the 5′ end of a target, the control logic promptly lowers the voltage to 50 mV for a chosen exposure period, tf (Fig. 1 B). The 50-mV level was sufficient to hold the 26-basepair duplex in the nanopore vestibule for up to 0.5 s with low probability of unzipping. From the known structure of the channel (5) and internucleotide distance of ssDNA, the hold resulted in exposure of ∼22 nucleotides to the trans chamber. After exposure period tf, the control logic used a voltage reversal (−20 mV) to probe the captured DNA for duplex formation. The −20-mV probing voltage was large enough to provide a sufficient signal/noise ratio for detection of hybridization (Fig. 1 C). If an assembled duplex survived −20-mV probing for 300 ms, the logic switched to −120 mV to clear the channel for another capture.
Figure 1.
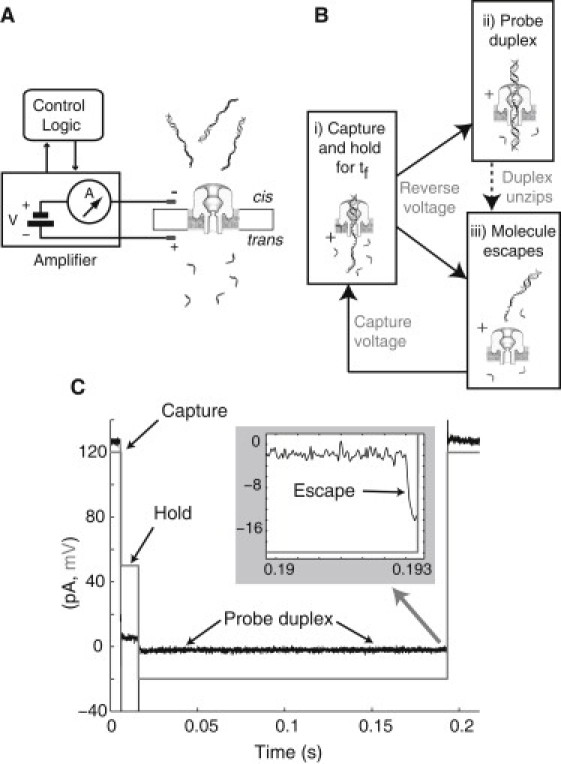
(A–C) Schematics of the nanopore device, control logic to measure hybridization, and a sample recorded hybridization event. (A) A patch-clamp amplifier supplies voltage and measures ionic current through a single α-hemolysin channel inserted in a lipid bilayer. Control logic connected to the amplifier monitors current levels and executes voltage changes for capture of cis-side target DNA and timed exposure to trans-side ODNs. (B i) Upon capture, the logic holds the DNA at +50 mV for time period tf,, then reverses the voltage to −20 mV to detect hybridization. If hybridization occurs and the duplex survives for 0.7 ms or longer, the duplex is observable. (B ii) An observable duplex is probed at −20 mV for up to 0.3 s until it unzips. (B iii) The molecule escapes (if the duplex survives for 0.3 s, the logic clears the channel at −120 mV). If hybridization does not occur or the duplex is not observable, the molecule escapes directly. After detection of the escape, capture voltage (+120 mV) is resumed. (C) Time history of measured current (black, pA) and voltage (red, mV) in a sample event. Capture is signaled by 120 pA to 20 pA shift at +120 mV, followed by a hold voltage of +50 mV for ms. The formed duplex is then probed at −20 mV until dissociation and molecule escape is detected, as signaled by a −3 pA to −15 pA shift at −20 mV shown in the zoomed shaded inset.
Modeling single-molecule hybridization with bulk-phase equations
With binding ODNs in excess, the measured hybridization probability, , was expected to follow pseudo-first-order reaction kinetics (22) where the modeled hybridization probability, , as a function of exposure time t satisfies
| (1) |
Here, r is the association rate (s−1) and q is the observable fraction (0 ≤ q ≤ 1) of duplexes that survive −20 mV probing for at least 0.7 ms. The 0.7-ms detection limit was established as follows. In a controlled experiment with no binding ODNs present in the trans chamber, there is no duplex formation for the target DNA captured in the pore and exposed to the trans chamber. Upon reversal of the voltage to −20 mV, the target DNA escapes directly without having to unzip a duplex. The 0.7-ms detection limit is in the 99th or higher percentile of the escape time of unhybridized DNA. Achieving the 0.7-ms detection limit required the use of compensation circuitry on the amplifier (see Methods for details).
The model parameters {r,q} of pmod(t) in Eq. 1 are fit to the measured probability data points phyb(tf) by a nonlinear least-squares method (see Supporting Material). The association rate is assumed to satisfy , where is the ODN concentration (M) and is the association rate constant (M−1 s−1). To determine , we set equal to the binding ODN concentration added to the trans chamber. For sufficiently long exposure times, tf, the measured hybridization probability reaches the saturation level . With binding ODNs in excess, hybridization is expected to reach 100% at long exposure times. Therefore, implies that (100 × q)% of formed duplexes are observable in experiments. If , then 100% of formed duplexes are not observable, i.e., they have unzipped before the 0.7-ms detection limit was reached.
The modeled hybridization probability matched the measured probability closely in separate experiments with the target DNA and 10-mer or 20-mer complementary ODNs in the trans chamber (Fig. 2 A). This plot also demonstrates the sensitivity of our method to duplex length (M−1 s−1 for 10-mer ODNs; M−1 s−1 for 20-mer ODNs). In part, sensitivity to duplex length can be attributed to the shorter, 10-mer ODNs diffusing at a faster rate in the trans chamber and reaching the target DNA more frequently. The fitted data parameters (r,q) and computed are reported in Table 1, i and ii.
Figure 2.
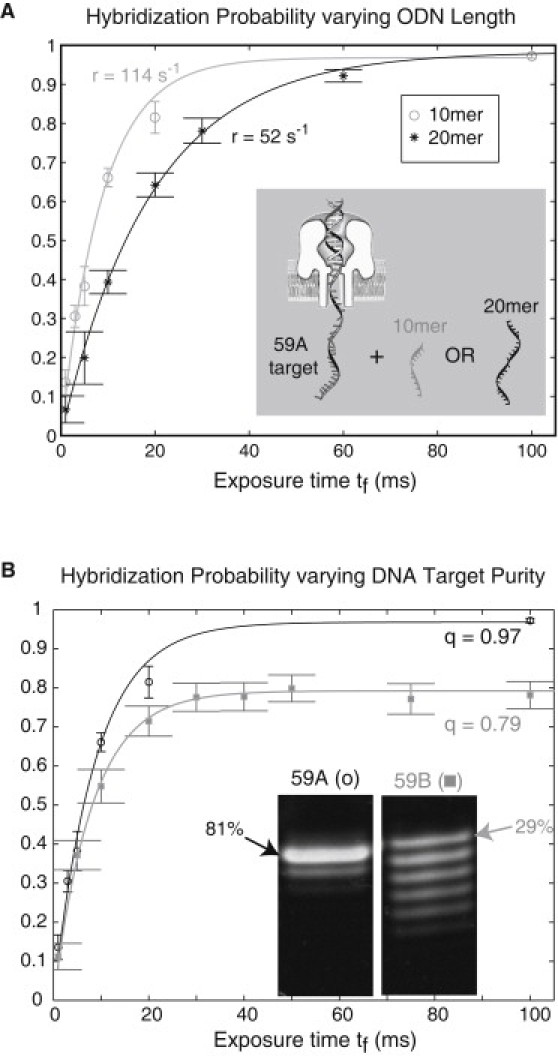
Measured and modeled hybridization probability are well matched, with association rate r sensitive to binding ODN length (A), and fraction of observed duplexes, q, sensitive to the purity of the DNA target (B). The measured probability data points are where and M is the number of detected hybridization events out of N total probing events at each fishing time, tf. Here is the standard error of the measured fraction of hybridization events. In the figure, the data points are plotted with error bars showing 2× standard errors (the 95% confidence intervals). The model curves fitted to the data sets have parameter values reported in Table 1, i–iii. (A) In separate experiments, 10-mer (○) and 20-mer (∗) ODNs complementary to the captured 59-mer target DNA (synthesis 59A) were in solution in the trans chamber at 5.5 μM. Formation of the longer 20-bp duplex resulted in a slower association rate to the target DNA than formation of the 10-bp duplex (r = 46 s−1 vs. r = 114 s−1, respectively) (Table 1, i and ii). (B) In separate experiments with 10-mer complementary ODNs in the trans chamber (5.5 μM), 79% of formed duplexes were observable with the less pure 59-mer target DNA (59B), whereas 97% of duplexes were observable with the more pure target (59A) (Table 1, i and iii). (Inset) Lanes from a common gel, and relative intensity reported for the full-length product in each lane (full gel sample with lane intensities provided in Fig. S1). Association rates of the 10-mer ODN remain comparable for the two targets (122 s−1 for 59B).
Table 1.
Values for parameters that fit the hybridization model (Eq. 1) to duplex association measurements
| Target-ODN∗ synthesis | ODN concentration [O] (μM) | Total number of events | r ± SD† (s−1) | kon‡± SD × 106 (M−1 s−1) | q ± SD† |
|---|---|---|---|---|---|
| (i) 59A-10A | 5.5 | 7098§ | 114.1 ± 3.2 | 20.7 ± 0.6 | 0.97 ± 0.003 |
| (ii) 59A-20 | 5.5 | 5002§ | 51.7 ± 1.6 | 9.4 ± 0.3 | 0.98 ± 0.01 |
| (iii) 59B-10B | 5.5 | 5576§ | 122.1 ± 6.4 | 22.2 ± 1.2 | 0.79 ± 0.01 |
| (iv) 59B-10B | 11.0 | 2852 | 277.8 ± 12.7 | 25.3 ± 1.1 | 0.83 ± 0.01 |
| (v) 59A-10B¶ | 5.5 | 239 | — | — | 0.98 ± 0.01 |
| (vi) 59B-10A¶ | 5.5 | 1109 | — | — | 0.82 ± 0.01 |
SD, standard deviation.
Each experiment had 59-mer target DNA in the cis chamber, and in separate experiments, 10-mer or 20-mer complementary ODNs in the trans chamber. Two syntheses of 59-mer target DNA (59A and 59B) and 10-mer binding ODNs (10A and 10B) were used separately in repeated experiments. A single synthesis of 20-mer ODN was used. For two-synthesis cases, relative band intensities using a common gel are reported in Fig. S1.
Method of estimating and their uncertainty is described in detail in the Supporting Material.
Rate constant ± SD computed using , given the value and SD for r.
Total number of probing events from experiments repeated twice under common conditions. Measured data and modeled parameters for each experiment, and observed consistency across experiments, are reported in Supporting Material.
Experiments performed at tf = 100 ms exposure time only, and , where pd is the fraction of hybridization events, and N the number of probing events.
Effect of DNA purity on measured hybridization
DNA purity here refers to heterogeneity in the length of the target DNA. We examined the effect of DNA purity on our results by testing two syntheses of the 59-mer target DNA, labeling 59A as the target with higher purity and 59B as the target with lower purity (Fig. 2 B). Two syntheses of 10-mer ODN were also used, labeled 10A and 10B, respectively. Gel imaging revealed comparable and high relative purity (≥99%) between 10A and 10B and provided estimates for the relative intensities of 59A and 59B (Fig. S1 in the Supporting Material). The 10A and 10B are differentiated in Table 1, but not in Fig. 2 due to their high purity.
We observe first that the association rate of the 10-mer binding ODN remained consistent (r = 114 s−1 with 59A-10A; r = 122 s−1 with 59B-10B) for both the higher and lower target purities (Table 1, i and iii). Since the binding ODN has high purity and can be presumed to be full length (10-mer), consistency in the measured and modeled association rates matches the reasoning that association rate should be dependent on ODN length, but not on target length, when the target is immobilized (22). Next, although the association rate of the 10-mer binding ODN remained consistent, the fraction of observed duplexes was reduced from 97% with the more pure target, 59A, to 79% with the less pure target, 59B (Table 1, i and iii). We reason that if target DNAs are shorter than full length, an appreciable number of duplexes <10 bp in length can form, and sufficiently short duplex DNAs are not observable, because they unzip faster than our detection-time limit of 0.7 ms. This logic assumes that the binding ODN concentration added to the trans chamber is at saturation, so that hybridization (observable + unobservable) goes to ∼100%, an assumption that we tested as follows.
To confirm that the reduced fraction of observed duplexes, q, shown in Fig. 2 B was due to target DNA purity, separate experiments with 59A-10B and 59B-10A were performed at ms exposure time. In the experiments with 59A, the two 10-mer ODN syntheses yielded consistent values for the fraction of observed duplexes, q. In the experiments with 59B, the two 10-mer ODN syntheses also yielded consistent values for q and the values are lower than those in the experiments with 59A. Thus, the lower values for q are attributed to the impurity of 59B (Table 1, v and vi). To test our assumptions that the added ODN concentration ([O]) is at saturation, and that the observed rate, r, is proportional to [O], we repeated the 59B-10B experiment at double the ODN concentration ([O] = 11 μM). The results (Table 1, iv) confirmed that [O] is at saturation at 5.5 μM; if that were not the case, q would have increased closer to 1.0 with increasing [O]. Instead, q remained at a value (0.83) comparable to that observed at half the ODN concentration (Table 1, iii and vi). The results also showed that r approximately doubled with [O], yielding a comparable association rate constant, , at the two ODN concentrations.
Computed on rates match values in the literature
Consistent with our estimated values for 10- and 20-bp DNA hybridization, Howorka et al. (12) estimated values in the range 10–20 × 106 M−1 s−1, computed from an exponential fit to the capture rate of 7- and 8-mer DNAs that detectably bind to the target in the channel. It is important to note the difference in experimental setup between these two experiments. In Howorka et al. (12), the DNA duplex formation occurs in the confined space of the vestibule in the presence of ion flow and a trans-channel voltage, whereas in our experiments, the duplex formation occurs in the bulk phase, free from any external force. The comparable values estimated from these two different experiments for the association rate constant indicate that for short oligonucleotides, the dominant factor affecting the association rate is still the diffusion to the target rather than the details of molecular interaction near the duplex formation.
In the comprehensive review by Wetmur (22), hybridization between DNA and excess short oligonucleotides follows the probability model , , with reaction rate , L the oligomer length, C the concentration of oligomers in solution, and k2 the per-nucleotide association rate constant (). From an estimated rate constant, k2, a nucleation rate constant, , can be estimated from the equation (Eq. 3 of Wetmur (22)), where Nr is the complexity or total number of basepairs in nonrepeating sequences. In experiments with ODNs, , and in terms of the per-oligo rate constant, , the equation becomes . From our estimated values, this corresponds to in the range 2–6 M−1 s−1. At the low end, this range is still sixfold higher than the salt-dependent empirical value, M−1 s−1 (Eq. 6 in Wetmur (22)). However, Wetmur states that “… dependence of k2 (and thus inversely on ) has not strictly been verified for short oligonucleotides.” Using the rate constant for a self-complementary 8-mer (d(GGAATTCC)), Wetmur also computed a nucleation rate constant that is fourfold higher than its salt-dependent empirical value.
Modeling duplex lifetime measurements
Modeling the duplex DNA lifetimes in the pore vestibule (7–9,12) and at the trans entry to the stem of the pore (10,15) has been achieved, demonstrating sensitivity of the average duplex lifetime to nucleotide identity and duplex length. Comparable to the latter works (10,15), our measurements provide information about the lifetime and stability of the duplexes that assemble on the trans side of the pore. At the onset of probing for each captured DNA target, there are three possible outcomes (Fig. 1 B): 1), the molecule escapes with no detection of duplex formation after 0.7 ms; 2), duplex formation is detected and duplex dissociation occurs within the 0.7–300 ms probing period (example in Fig. 1 C); or 3), duplex formation is detected and the duplex does not dissociate after 300 ms of probing. Note that duplex formation may occur yet go undetected (case 1) if the duplex lifetime is faster than our detection limit of 0.7 ms. We refer to the duplex state as weak if outcome 2 occurred, and strong if outcome 3 occurred. We denote the weak- and strong-state probabilities at a given exposure time, tf, as and , respectively, and note that the probability of observed duplexes is . By definition, weak duplexes unzip with a lifetime between 0.7 and 300 ms. We can model the distribution of weak duplex lifetimes, provided we take care to respect the effect of truncation on the distribution. The importance of respecting such constraints in estimating parameters from single-molecule experimental data has been reported (27).
We model the distribution of weak duplex lifetime measurements using a single or two exponential modes. With random variable τ representing the lifetime of the dissociation events for a particular experiment, the probability density of two exponential modes is
| (2) |
with parameter vector . Here, λ1 and λ2 are the dissociation rates of the two modes, and α and (1 − α) are the fraction of events exhibiting rates λ1 and λ2, respectively. The constant ms is present to reflect our inability to detect lifetimes <0.7 ms. Setting α = 1 and v = λ1, we have a single-exponential density function. In both cases, maximum likelihood estimation is used to fit the model parameters to the data (see Supporting Material for details). There are two considerations when determining whether a single- or two-exponential-mode model is more suitable for modeling the data. First, we can compute a distance between the data and each model, giving preference to the model with the smaller distance value. Second, we can examine the uncertainty of the fitted model parameters. If the uncertainty of from a two-exponential fit is substantially larger than that of λ1 from a single-exponential fit, then a single-exponential fit is preferred. These two considerations, model distance to the data and fitted parameter uncertainty, provided consistent recommendations in choosing the better model to represent each data set in our analysis.
We first compared the influence of DNA template purity (i.e., length heterogeneity) on duplex state and lifetime probabilities, examining data at long exposure times to maximize . From experiments with 59A and 59B target DNA and 10-mer ODN (Fig. 2 B ; Table 1, i and iii), the weak-state probability is preserved (), whereas the strong-state probability is reduced by 17 percentage points for the less-pure target ( for 59A; for 59B) (Fig. 3 A). Both weak-state lifetime probabilities for 59A and 59B are well fit by the two-exponential model, with comparable fast and slow rates (Fig. 3 B). In addition, the less-pure target 59B showed a larger percentage (%) of duplexes that unzip at the faster rate than did the purer target 59A (%). The presence of shorter duplexes resulting from the less-pure target are likely the cause of the observed reduction in the observed strong-state and increase in the relative fraction of duplexes that unzip more rapidly.
Figure 3.
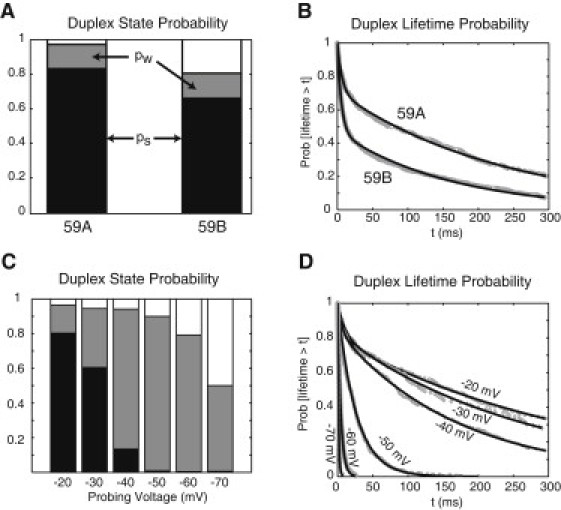
State and conditional lifetime probabilities of assembled duplex DNA exhibit dependence on target DNA purity (A and B) and probing voltage (C and D). Experiments are with 10-mer ODNs in the trans chamber at 5.5 μM. (A) At saturation of exposure times (tf = 100 ms for 59A, N = 3223 events; tf = 500 ms for 59B, N = 159 events), the weak-state probability is preserved (for 59A; for 59B), whereas the strong-state probability is reduced for the less pure template (for 59A; for 59B). (B) The lifetimes of weak duplexes (which unzip between 0.7 ms and 300 ms) are well modeled by the two-exponential mode distribution for both experiments in A. For 59A, 71 ± 4% of 223 lifetime measurements exhibited a slower rate (s−1), with the remainder at a faster rate (s−1). By comparison, for 59B, a smaller percentage (%) of 795 lifetime measurements exhibited a slower rate (s−1), with the rest majority of duplexes unzipping at a faster rate (s−1). In both cases, lifetime measurements between 0.7 ms and 300 ms from all fishing times were used in fitting to the conditional probability distribution. (C) With increasing probing voltage, the strong-state probability (black) strictly decreases, whereas weak-state probability (red) increases up to −50 mV, and decreases thereafter (Table 2). (D) The more suitable model for fitting the weak duplex lifetimes is the two-exponential distribution for lower probing voltages (−20, −30, and −40 mV), and the single-exponential distribution for higher probing voltages (−50, −60, and −70 mV), with fitted model parameters reported in Table 2.
The overall lifetime distribution of the observed duplexes exhibits multiple dissociation modes: two dissociation modes for the duplexes in the weak state (which unzip between 0.7 and 300 ms) and at least one dissociation mode for the duplexes in the strong state (which survive for >300 ms). These dissociation modes may be attributed to DNA impurity. An alternative scenario is that different dissociation modes may indicate different interaction states between the correct DNA and complementary ODN. The exact cause of these different dissociation modes remains unresolved, since it is difficult to obtain 100% full-length synthetic DNA samples.
In another experiment, we examined the influence of increasing probing voltage on the unzipping lifetime distributions for 59A-10A hybrids. Of the observed duplexes, increasing probing from −20 mV to −70 mV caused an increase in the likelihood of unzipping, and also in the rate(s) of unzipping (Fig. 3, C and D and Table 2). For −20- to −40-mV probing, the increase in duplex forcing causes a moderate increase in the slower rate, λ1, of unzipping. It is interesting that at −50 mV and larger probing voltages, the duplex lifetime measurements appear to reveal only a single unzipping rate, i.e., fitting a single-exponential distribution model better than a two-exponential-mode model, with the λ1 rate increasing dramatically with voltage. As expected, increasing probing voltage also increased the population of duplexes that are not observable, i.e., that unzip in <0.7 ms (Fig. 3 C, unshaded area).
Table 2.
Values for parameters that fit the exponential distribution model (Eq. 2) to duplex dissociation measurements
| Probe voltage∗ | No. of events, N | ps ± SD† | pw ± SD† | λ1‡ ± SD§ (s−1) | SD§ (s−1) | α ± SD§ 100× (%) |
|---|---|---|---|---|---|---|
| −20 mV | 787 | 0.80 ± 0.01 | 0.16 ± 0.01 | 3.0 ± 1.5 | 115 ± 41 | 80 ± 5% |
| −30 mV | 291 | 0.60 ± 0.03 | 0.34 ± 0.03 | 3.7 ± 1.7 | 104 ± 90 | 82 ± 6% |
| −40 mV | 275 | 0.13 ± 0.02 | 0.81 ± 0.02 | 5.8 ± 1.2 | 162 ± 69 | 84 ± 4% |
| −50 mV | 467 | 0.008 ± 0.004 | 0.89 ± 0.01 | 38.2 ± 1.9 | — | 100% |
| −60 mV | 245 | 0.004 ± 0.004 | 0.79 ± 0.03 | 222 ± 15 | — | 100% |
| −70 mV | 164 | 0.006 ± 0.006 | 0.49 ± 0.04 | 768 ± 89 | — | 100% |
Each unzipping data set from a single experiment with 59A target DNA in the cis chamber and 5.5μM 10A oligomer in the trans chamber, at ms exposure time only.
ps and pw are defined in the text. SD = , with N the total number of probing events.
Reporting values when the two-exponential distribution is the more suitable model, and λ1 values (setting α = 1) when the single-exponential distribution is the more suitable model.
Method of computing SD is detailed in the Supporting Material. The number of unzipping events is N × pw for each row.
Conclusions
We present a control method that permits direct detection of single-molecule unforced complex assembly between two complementary DNA strands in the bulk phase, one complex at a time, with broad (1–500 ms) temporal range. Both the measured hybridization and duplex dissociation kinetics match the models and trends reported in the literature, from bulk phase studies (22) and from single molecule studies using nanopores (10,15). In addition, the measurements of duplex lifetimes reveal several dissociation modes. It remains to be determined whether the different dissociation modes are attributed to DNA impurity or represent different interaction states of full-length DNA duplexes. Resolving the heterogeneity issue, the measurements of duplex lifetimes could be used to weed out the effects of DNA impurity or to detect different interaction states of DNA duplexes in future nanopore experiments. More broadly, the DNA capture and temporal exposure control method can be applied to examine association kinetics of shorter or longer duplexes, or of DNA-protein complexes (19).
Acknowledgments
The authors thank the Protein and Nucleic Acid (PAN) Biotechnology Facility at Stanford University for its consistent high quality service and oligonucleotides. We note that the less pure DNA target used in our experiments was not representative of the quality of synthesized DNA we routinely receive from PAN, and we therefore suspect that the source for heterogeneity most likely occurred during handling of the oligo at the University of California at Santa Cruz.
This work was supported by National Institutes of Health grant HG004035-03 (to W.B.D.) and by National Science Foundation grant DMS-0719361 (to H.W.).
Footnotes
Brett Gyarfas's present address is The Biodesign Institute, Arizona State University, Tempe, AZ.
Supporting Material
References
- 1.Deamer D.W., Branton D. Characterization of nucleic acids by nanopore analysis. Acc. Chem. Res. 2002;35:817–825. doi: 10.1021/ar000138m. [DOI] [PubMed] [Google Scholar]
- 2.Vercoutere W., Winters-Hilt S., Akeson M. Rapid discrimination among individual DNA hairpin molecules at single-nucleotide resolution using an ion channel. Nat. Biotechnol. 2001;19:248–252. doi: 10.1038/85696. [DOI] [PubMed] [Google Scholar]
- 3.Dekker C. Solid-state nanopores. Nat. Nanotechnol. 2007;2:209–215. doi: 10.1038/nnano.2007.27. [DOI] [PubMed] [Google Scholar]
- 4.Branton D., Deamer D.W., Schloss J.A. The potential and challenges of nanopore sequencing. Nat. Biotechnol. 2008;26:1146–1153. doi: 10.1038/nbt.1495. [DOI] [PMC free article] [PubMed] [Google Scholar]
- 5.Song L., Hobaugh M.R., Gouaux J.E. Structure of staphylococcal α-hemolysin, a heptameric transmembrane pore. Science. 1996;274:1859–1866. doi: 10.1126/science.274.5294.1859. [DOI] [PubMed] [Google Scholar]
- 6.Akeson M., Branton D., Deamer D.W. Microsecond time-scale discrimination among polycytidylic acid, polyadenylic acid, and polyuridylic acid as homopolymers or as segments within single RNA molecules. Biophys. J. 1999;77:3227–3233. doi: 10.1016/S0006-3495(99)77153-5. [DOI] [PMC free article] [PubMed] [Google Scholar]
- 7.Howorka S., Cheley S., Bayley H. Sequence-specific detection of individual DNA strands using engineered nanopores. Nat. Biotechnol. 2001;19:636–639. doi: 10.1038/90236. [DOI] [PubMed] [Google Scholar]
- 8.Winters-Hilt S., Vercoutere W., Haussler D. Highly accurate classification of Watson-Crick basepairs on termini of single DNA molecules. Biophys. J. 2003;84:967–976. doi: 10.1016/S0006-3495(03)74913-3. [DOI] [PMC free article] [PubMed] [Google Scholar]
- 9.Dudko O.K., Mathé J., Hummer G. Extracting kinetics from single-molecule force spectroscopy: nanopore unzipping of DNA hairpins. Biophys. J. 2007;92:4188–4195. doi: 10.1529/biophysj.106.102855. [DOI] [PMC free article] [PubMed] [Google Scholar]
- 10.Nakane J., Wiggin M., Marziali A. A nanosensor for transmembrane capture and identification of single nucleic Acid molecules. Biophys. J. 2004;87:615–621. doi: 10.1529/biophysj.104.040212. [DOI] [PMC free article] [PubMed] [Google Scholar]
- 11.Banerjee A., Mikhailova E., Bayley H. Molecular bases of cyclodextrin adapter interactions with engineered protein nanopores. Proc. Natl. Acad. Sci. USA. 2010;107:8165–8170. doi: 10.1073/pnas.0914229107. [DOI] [PMC free article] [PubMed] [Google Scholar]
- 12.Howorka S., Movileanu L., Bayley H. Kinetics of duplex formation for individual DNA strands within a single protein nanopore. Proc. Natl. Acad. Sci. USA. 2001;98:12996–13001. doi: 10.1073/pnas.231434698. [DOI] [PMC free article] [PubMed] [Google Scholar]
- 13.Clarke J., Wu H.C., Bayley H. Continuous base identification for single-molecule nanopore DNA sequencing. Nat. Nanotechnol. 2009;4:265–270. doi: 10.1038/nnano.2009.12. [DOI] [PubMed] [Google Scholar]
- 14.Bates M., Burns M., Meller A. Dynamics of DNA molecules in a membrane channel probed by active control techniques. Biophys. J. 2003;84:2366–2372. doi: 10.1016/S0006-3495(03)75042-5. [DOI] [PMC free article] [PubMed] [Google Scholar]
- 15.Tropini C., Marziali A. Multi-nanopore force spectroscopy for DNA analysis. Biophys. J. 2007;92:1632–1637. doi: 10.1529/biophysj.106.094060. [DOI] [PMC free article] [PubMed] [Google Scholar]
- 16.Mathé J., Visram H., Meller A. Nanopore unzipping of individual DNA hairpin molecules. Biophys. J. 2004;87:3205–3212. doi: 10.1529/biophysj.104.047274. [DOI] [PMC free article] [PubMed] [Google Scholar]
- 17.Hornblower B., Coombs A., Akeson M. Single-molecule analysis of DNA-protein complexes using nanopores. Nat. Methods. 2007;4:315–317. doi: 10.1038/nmeth1021. [DOI] [PubMed] [Google Scholar]
- 18.Gershow M., Golovchenko J.A. Recapturing and trapping single molecules with a solid-state nanopore. Nat. Nanotechnol. 2007;2:775–779. doi: 10.1038/nnano.2007.381. [DOI] [PMC free article] [PubMed] [Google Scholar]
- 19.Wilson N.A., Abu-Shumays R., Dunbar W.B. Electronic control of DNA polymerase binding and unbinding to single DNA molecules. ACS Nano. 2009;3:995–1003. doi: 10.1021/nn9000897. [DOI] [PMC free article] [PubMed] [Google Scholar]
- 20.Behlke, M. A., and E. J. Devor. 2005. Chemical synthesis of oligonucleotides. Integrated DNA Technologies, http://cdn.idtdna.com/Support/Technical/TechnicalBulletinPDF/Chemical_Synthesis_of_Oligonucleotides.pdf. Accessed February 7, 2011.
- 21.Jensen M. Stanford University; Stanford, CA: 2008. Chemical DNA Synthesis Cycle Chart (public resource) [Google Scholar]
- 22.Wetmur J.G. DNA probes: applications of the principles of nucleic acid hybridization. Crit. Rev. Biochem. Mol. Biol. 1991;26:227–259. doi: 10.3109/10409239109114069. [DOI] [PubMed] [Google Scholar]
- 23.Wetmur J.G., Davidson N. Kinetics of renaturation of DNA. J. Mol. Biol. 1968;31:349–370. doi: 10.1016/0022-2836(68)90414-2. [DOI] [PubMed] [Google Scholar]
- 24.Benner S., Chen R.J.A., Akeson M. Sequence-specific detection of individual DNA polymerase complexes in real time using a nanopore. Nat. Nanotechnol. 2007;2:718–724. doi: 10.1038/nnano.2007.344. [DOI] [PMC free article] [PubMed] [Google Scholar]
- 25.Kibbe W.A. OligoCalc: an online oligonucleotide properties calculator. Nucleic Acids Res. 2007;35(Web Server issue):W43–W46. doi: 10.1093/nar/gkm234. [DOI] [PMC free article] [PubMed] [Google Scholar]
- 26.Breslauer K., Frank R., Marky L. Predicting DNA duplex stability from the base sequence. Proc. Natl. Acad. Sci. U.S.A. 1986;83:3746–3750. doi: 10.1073/pnas.83.11.3746. [DOI] [PMC free article] [PubMed] [Google Scholar]
- 27.Koster D.A., Wiggins C.H., Dekker N.H. Multiple events on single molecules: unbiased estimation in single-molecule biophysics. Proc. Natl. Acad. Sci. USA. 2006;103:1750–1755. doi: 10.1073/pnas.0510509103. [DOI] [PMC free article] [PubMed] [Google Scholar]
Associated Data
This section collects any data citations, data availability statements, or supplementary materials included in this article.