Abstract
Terminal differentiation of odontoblasts from dental papilla is a long process involving several intermediate steps and changes in the transcriptional profile and expression of proteins secreted by cells in the odontoblast lineage. Transgenic mouse lines in which GFP expression is under the control of tissue-and stage specific promoters have provided powerful experimental tools for identification and isolation of cells at specific stages of differentiation along a lineage. Our previous studies showed utilization of pOBCol3.6GFP and pOBCol2.3GFP animals for identification of odontoblasts at early and late stages of polarization respectively. In the present study we used the DMP1-GFP transgenic animal as an experimental model to examine its expression during the differentiation of odontoblasts from progenitor cells in vivo and in vitro. Our observations showed that DMP1-GFP transgene is first activated in secretory/functional odontoblasts engaged in secretion of predentin and then transiently expressed at high levels in newly differentiated odontoblasts. Expression of DMP1-GFP was down-regulated in highly differentiated odontoblasts. The temporal and spatial pattern of expression of DMP1-GFP transgene closely mimics the expression of endogenous DMP1. This transgenic animal will facilitate studies of gene expression and biological functions in secretory/functional odontoblasts.
Keywords: Odontoblast differentiation, dental pulp, progenitors, DMP1, green fluorescent protein
Introduction
Dentinogenesis is regulated by odontoblasts, highly specialized cells originating from the neural crest derived cells of the dental papilla. The differentiation of odontoblasts from the neural crest cells is a long process involving several intermediate steps that are dependent on and regulated by epithelial signals [1–4]. During this process dental papilla differentiates first into pre-odontoblasts then polarized odontoblasts, secretory/functional odontoblasts and finally highly differentiated/terminally-differentiated odontoblasts. In mice the steps between the formation of pre-odontoblasts and highly differentiated odontoblasts are completed within 6–10 hours [5, 6].
Dentin secreted by odontoblasts consists of inorganic and organic components [7]. The inorganic components consist mostly of hydroxyapatite and water [7] and the organic components consist primarily of collagen fibers and non-collagenous proteins (NCPs) including Dentin Matrix Protein-1 (DMP1).
DMP1, an acidic non-collagenous phospho-protein, is a member of the SIBLING (small integrin binding ligand N-linked glycoprotein) family with essential roles in mineralization [8, 9]. The essential roles of DMP1 in mineralization have been demonstrated by various in vitro and in vivo studies. In vitro studies showed that MC3T3-E1 cells over expressing DMP1 display accelerated and early onset of mineralization [10]. DMP1 null mutants developed abnormalities in teeth bones and teeth during postnatal development that became more severe with age [11–13]. The abnormlities in bone were linked to osteocyte function and included hypomineralized bone, defects in cartilage formation and hypophosphatemia rickets with elevated levels of FGF23 during postnatal development [11–13]. The abnormalities in teeth included a partial failure of maturation of predentin into dentin, increased width of the unmineralized predentin, reduced expression of osterix in odontoblast, and abnormalities in the dentinal tubules [12, 14–16]. The re-expression of DMP1 by the 6 kb fragment of DSPP promoter in mature odontoblasts resulted in only a partial rescue of the defects in dentin, whereas re-expression of DMP1 by the 3.6 kb fragment of Col1a1 promoter in early odontoblasts resulted in complete rescue of dentin defects indicating that DMP1 is a key regulator of odontoblast differentiation and mineralization of dentin [15].
Analysis of bones in transgenic animals in which GFPtpz is under the control of 8 kb upstream regulatory sequences of the DMP-1 (−7892 to +4439) [17–19] showed that DMP1-GFP similar to the DMP1 protein and mRNA [20, 21], is expressed by early and mature osteocytes. The 8 kb regulatory region of DMP1 also contains mechanical response elements and DMP1-GFP has provided a useful tool for studying the effects of mechanical loading on osteocytes [18] and analysis of mineralization kinetics in primary cultures from calvaria [19].
Given the important roles of DMP1 in dentinogenesis, in the present study we have used DMP1-GFP transgenic animal as an experimental model to examine the differentiation of odontoblasts from progenitor cells in dental pulp. Therefore, the goal of our studies was not to gain insight into function of DMP1 during dentinogenesis but to determine if the 8 kb fragment can be used to study dentinogenesis.
We analyzed the temporal and spatial expression of this transgene in the developing teeth in vivo and during in vitro mineralization in primary pulp cultures. Our observations show that the expression of DMP1-GFP transgene mimicked the expression of endogenous DMP1 in that it was first expressed in secretory/functional odontoblasts engaged in secretion of predentin, prior to the expression of DSPP. DMP1-GFP transgene was transiently expressed at high levels in newly differentiated odontoblasts and down-regulated in highly differentiated odontoblasts. The activation of this transgene in secretory/functional odontoblasts will facilitate identification and purification of these cells for further analysis.
Materials and Methods
Expression of DMP1-GFP transgene in developing teeth
Mandibular arches and developing teeth at different stages of embryonic development (E16–19) and postnatal growth (P1 and P16) were isolated from DMP1-GFP hemizygous transgenic mice [17]. In this transgenic animal GFPtpz is under the control of 8 kb upstream regulatory sequences of the DMP-1 (-7892 to +4439) containing approximately 7.9-kb long promoter region, the first exon, the entire first intron and a small part of second exon (approximately 4.4-kb region of the DMP1 gene) [17]. Tissue fragments were fixed in 4% paraformaldehyde, and decalcified in 15% EDTA, 0.5% paraformaldehyde for various times (depending on the age), and processed for paraffin embedding. Seven μm sections were processed for Mallory staining using standard protocols. Adjacent sections were mounted with glycerol/phosphate-buffered saline (PBS), and visualized using a Nikon E600 microscope equipped with FITC and Texas Red dual fluorescent filter cube and photographed using a Spot RT TM digital camera (Diagnostic instruments Inc, Sterling Heights, MI). The digitized images from epifluorescence and dark-field microscopy were assembled with Adobe PhotoShop 6.0 software (Adobe Systems, San Jose, CA, USA).
In Situ Hybridization Analysis
The patterns of expression of DSPP and DMP1 in the developing arches were examined by in situ hybridization on tissue sections using 33P-labeled RNA probes for DSPP and DMP1 as previously described [22]. Serial sections were used so that expression patterns for DSPP, DMP1, and DMP1-GFP could be compared within the same animal.
Primary dental pulp cultures, digital imaging and epifluorescence analysis in cell culture
The coronal portions of the pulps from first molars were isolated from 5–7-day-old hemizygous DMP1-GFP and non-transgenic mice and prepared for primary cultures as previously described [23–25]. GFP expression in cell culture was visualized using an Olympus IX50 inverted microscope equipped with an IX-FLA inverted reflected light fluorescence (Olympus America, Inc., Melville, NY, USA). A specific excitation wavelength was obtained using filters for GFPtpz (exciter: D500/20; dichroic: 525DCLP; emitter: D550/40). Images were captured using a SPOTcamera (Diagnostic Instruments, Inc., Sterling Heights, MI).
Detection and Quantification of mineralization in cultures
Mineralized nodules in live cultures were visualized by Xylenol Orange (XO) staining as described previously [24, 26]. Mineralization in fixed cultures was also analyzed by von Kossa staining and quantified using Alizarin Red-S staining [24, 27]. Values represent mean ± SE of at least three independent experiments.
RNA extraction and analyses
Total RNA was prepared using TRI Reagent according to the manufacturer's instructions. After DNase treatment, RNA samples were processed for RT-PCR analysis using specific primers as described before [24]. The expression of Sost in cultures was also examined by quantitative polymerase chain reaction using 2 ng of cDNA and 2X TaqMan universal PCR master mix (Applied Biosystems, USA) using a one-step program (50°C for 2 min and 95°C for 10 min) followed by 95°C for 30 s, and 59°C for 1 min for 40 cycles. TaqMan gene expression assays for Sost (00470479_m1), and GAPDH (99999915_g1) were purchased from Applied Biosystems. Gene specific assays were run in quadruplicate in an iCycler thermocycler (BioRad, iCycler, USA) and analyzed using iQv3.1 post-run analysis software. The relative expression level for each target gene, normalized to GAPDH, was calculated using the comparative CT method; amplification efficiency for each TaqMan assay was determined using internal standard curves derived from purified amplicon, diluted 2-fold (2 ng – 0.125 ng) assayed performed in duplicate.
Flow cytometric analysis and Sorting (FACS)
Cultures were prepared for flow cytometric analysis and sorting as previously described [23, 25]. Dental pulp cells obtained from non-transgenic mice were used as controls.
Immunocytochemistry and correlation of expression of DMP1-GFP and DSP in mineralized nodules
Cultured cells were first examined and photographed using Zeiss Axiovert 200 microscope for expression of DMP1-GFP. After imaging, live cultures were incubated overnight at 37°C with 30mM of Calcein Blue (Sigma, USA) and then fixed and processed for immunocytochemistry using 1:200 dilution of Anti-DSP [LF-153 (kind gift from Dr. Larry Fisher)] as previously described [24]. Stained cultures were re-examined under Zeiss Axiovert 200 microscope under TRITC red (DSP), TOPAZ (DMP1-GFP) and Sapphire (Calcein Blue) filters. Using AxioVision Rel 4.7 software the expression f DMP1-GFP, Calcein Blue and DSP in the same areas of cultures was compared.
Immunohistochemistry was also performed on paraffin embedded sections of heads and limbs obtained from P1 and P21 mice. Sections were quenched in 1% H2O2 and incubated with Target Retrieval Solution (DakoCytomation) for 20 min at 95 °C. Slides were incubated with blocking solution and then with primary antibody (goat Anti-SOST, dilution 1:100) overnight at 4 °C. Labelled Streptavidin-Biotin System, Horseradish Peroxidase (LSAB2 System- HRP, DakoCytomation) kit was used to qualitatively analyze antigen expression, according to manufacturer’s protocol. Incubation with DAB Substrate-Chromogen resulted in a brown-colored precipitate at the antigen site.
Cell cycle analysis
The cell cycle and rate of proliferation in DMP1 GFP+ and DMP1-GFP- populations were examined in three days old cultures as previously described [25]. The viability and proliferation of sorted cells was examined by MTS assay (Cell Titer 96 Aqueous One Solution Cell Proliferation Assay, Promega, Madison, WI) as previously described [25].
Statistical analysis
Unpaired, two-tailed t-tests were performed to determine statistically significant differences and p<0.05 was considered statistically significant.
RESULTS
Localization of DMP1-GFP in the developing teeth
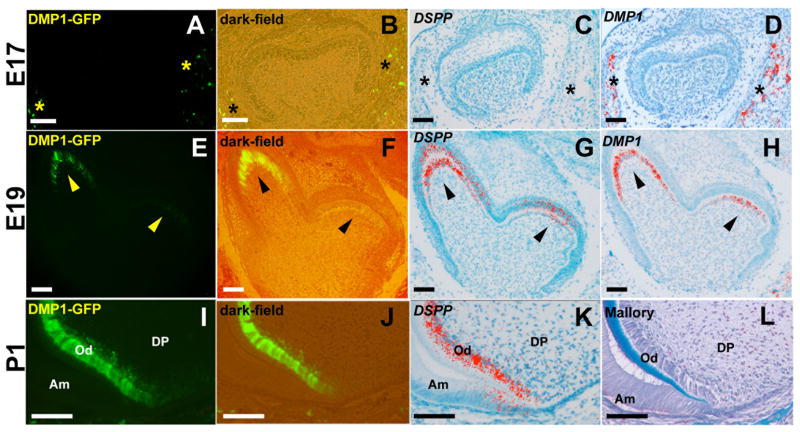
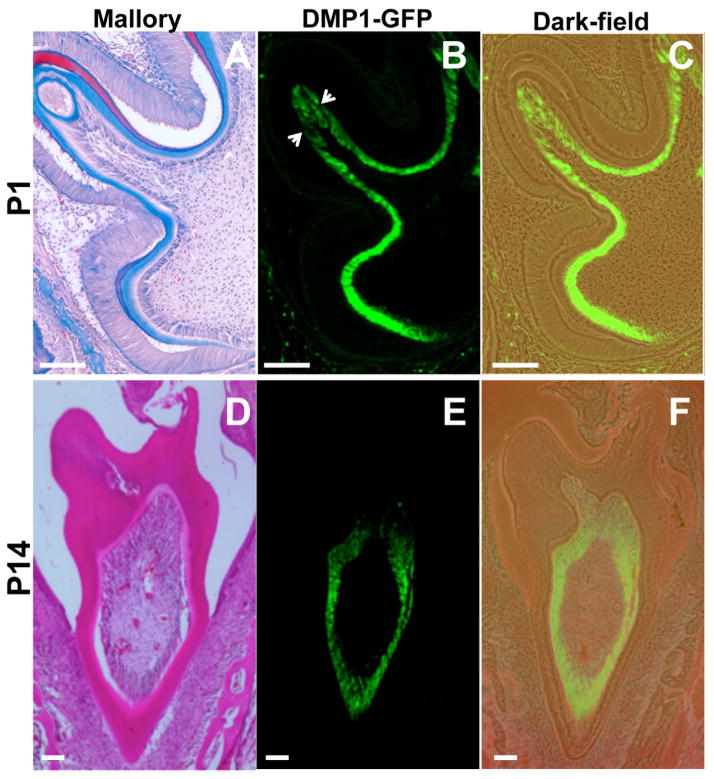
The DMP1-GFP transgene was not detected in the dental tissues during the initiation, bud, cap and early bell stages of molar tooth development (E10–18) (Figure 1A and 1B and data not shown). At the late bell stage (E19) DMP1-GFP was expressed at low intensity in odontoblasts at the tip of the cusp of the first mandibular molar (arrowheads in Figure 1E and F). At the secretory stage of crown formation (P1 and P5), DMP1-GFP transgene was expressed at high intensity in the entire layer of odontoblasts covering the dental pulp (Figure 1I and 1J and 2A-C and data not shown). In the cervical loops (Figure 1I and 1J), there was a gradient of expression of DMP1-GFP transgene in that the transgene was expressed at slightly lower intensity in the secretory/functional odontoblasts and at higher intensity in differentiated odontoblasts and odontoblast processes (Figure 1I and J, data not shown). During postnatal growth, DMP1-GFP expression in odontoblasts in the tip of the cusps was lower than in odontoblasts in the remainder of the crown and in the roots and the remainder of the crown ((Figure 2A-C & 2D-F). Low levels of DMP1-GFP were also detected in some of the cells in the dental pulp in close vicinity to the cervical loops of the developing molars (Figure 1I and J).
Figure 1. Expression of DMP1-GFP transgene in developing molars.
Epifluorescence (A, E, I), dark-field (B, F, J) and pseudo-colored bright field (C, D, G, H, K) images of sections through developing molar teeth at E17 (A–D), E19 (E–H), and P1 (I–L). In each stage of development, adjacent sections have been processed for different analyses. (A–D) At E17, DMP1-GFP is not expressed in either the epithelial or mesenchymal components of the tooth germ. DMP1-GFP is expressed in the osteocytes and osteoblasts (indicated by asterisks) of the developing alveolar bone that also express endogenous DMP1. (E–H) At E19, DMP1-GFP is expressed in the odontoblasts (indicated by arrowheads) located at the tip of the mesio-lingual cusp of the first mandibular molar. These cells also express DSPP and DMP1. (I–L) At P1, DMP1-GFP is expressed at high levels in terminally differentiated odontoblasts (Od) expressing DSPP (K) and producing mineralized dentin matrix (L). L represents an image of a section stained with Mallory. Low levels of DMP1-GFP expression were observed in the dental pulp cells in the close proximity to the cervical loops. Abbreviations: Am, ameloblast; DP, dental pulp; Od, odontoblasts. Scale bar in all pictures=100 μm.
Figure 2. Expression of DMP1-GFP transgene in developing molars at P1 and P14.
Stained (A,D), epifluorescence (B,E) and dark-field (C,F), images of sections through postnatal molar teeth at P1 (A–C) and P14 (D–F). In each stage of development, adjacent sections were processed for different analyses. (A–C) At P1 DMP1-GFP is expressed in the entire layer of fully differentiated odontoblasts. At the tip of the each cusp highly differentiated odontoblasts show slight reduction of GFP signal (indicated by arrows). A represents an image of a section stained with Mallory. (D–F) At P14, highly differentiated odontoblasts at the tip of the cusp show DMP1-GFP expression at very low intensity. (D) represents an image of a section stained with H&E. Scale bar in all pictures=100 μm.
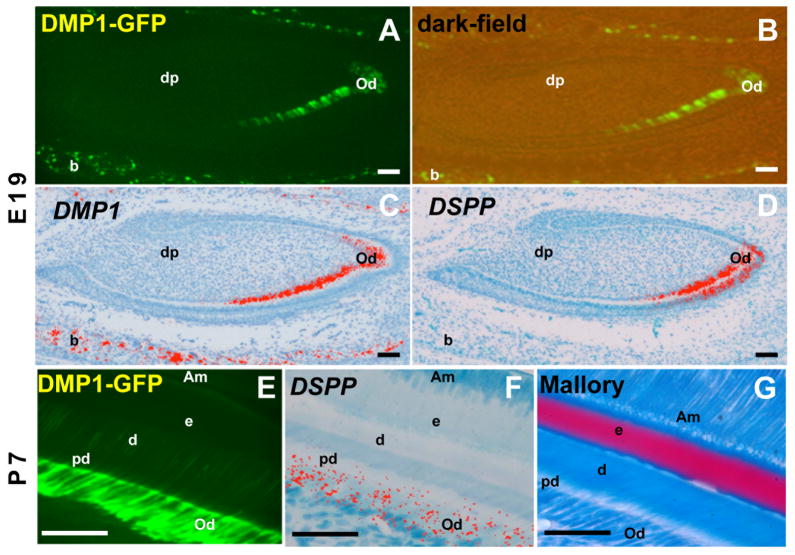
Developing incisors showed an apical to incisal gradient of expression of DMP1-GFP transgene. (Figure 3A and B). DMP1-GFP expression was not detected in the apical end and was detected in the incisal end in the secretory/functional odontoblasts and at higher levels in fully differentiated odontoblasts (Figure 3A and B) and odontoblast processes (Figure 3E-G). Between E17 and P7, DMP1-GFP was also expressed at high levels in osteocytes within the developing alveolar bone (Figure 1A, 2B and 3A).
Figure 3. Expression of DMP1-GFP transgene in developing mandibular incisors.
Epifluorescence (A, E), dark-field (B) and pseudo-colored bright-field (C, D, F) images of sections through developing incisor teeth at E19 (A–D) and P7 (E–G). In each stage of development, adjacent sections were processed for different analyses. (A–D) At E19 DMP1-GFP is not expressed in apical regions containing pre-odontoblasts and is detected in the incisal region containing secretory/functional and fully differentiated odontoblasts expressing DSPP (C) and DMP1 (D). DMP1-GFP is expressed at higher intensity in fully differentiated as compared to secretory odontoblasts. DMP1-GFP is expressed in the osteoblasts and osteocytes of the developing alveolar bone (indicated as b) that were expressing DMP1, but not DSP.
(E–G) are images through incisors at P7. Intensity of DMP1-GFP expression increased with further odontoblast differentiation during postnatal life and extended into the odontoblast processes (E–F). G represents an image of a section stained with Mallory. Abbreviations: Am, ameloblast; B, bone; d, dentin; dp, dental pulp; E, enamel; Od, odontoblast; pd, predentin. Scale bar in all images=100mm.
Comparison of the patterns of expression of DMP1-GFP transgene with those of DSPP and DMP1 in adjacent sections showed the expression of DMP1-GFP transgene in odontoblasts was well correlated with the expression of DMP1 and DSPP (Figures 1 and 3) indicating its expression in secretory/functional and fully differentiated odontoblasts. In the developing bones DMP1-GFP expression was closely correlated with the expression of DMP1 (Figures 1D and 3C).
DMP1-GFP expression during mineralization and odontoblasts differentiation in vitro
Odontoblast differentiation involves several intermediate steps that occur rapidly (within 6–10 hours) in vivo. This rapid transition, and the close proximity of cells in the different stages of differentiation in the developing teeth in vivo make it difficult to fully appreciate the stage of activation of DMP1-GFP in odontoblasts. Therefore, the temporal and spatial expression of the DMP1-GFP transgene was examined during in vivo mineralization in primary pulp cultures. In these experiments, DMP1-GFP expression was also correlated with the onset and subsequent growth of the mineralized nodules at various time points in real time by Xylenol Orange (XO) staining in the same cultures.
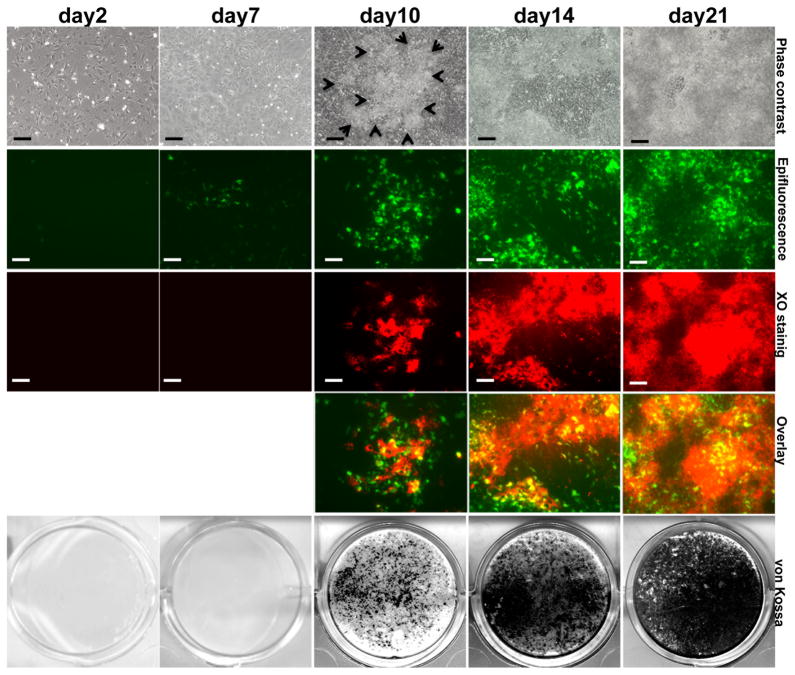
DMP1-GFP expression was detected in a few scattered cells at day 2 and 7 prior to mineralization (Figure 4). After addition of mineralization media at around day 10, DMP1-GFP expression was detected in multilayered areas containing unmineralized and mineralized matrices (detected by XO staining) (Figure 4). At days 14 and 21, after extensive mineralization, expression of DMP1-GFP at high and low intensities was detected in areas of mineralization (stained with XO).
Figure 4. Expression of DMP1-GFP transgene in primary dental pulp cultures during in vitro mineralization and dentinogenesis.
Images of the same areas in cultures at different time points analyzed under phase contrast, epifluorescent light using filters for GFPtpz for detection of GFP and TRITC Red filter for detection of XO staining and overlay of the two images generated in Photoshop. The bottom row shows representative cultures stained with von Kossa for each time point. In overlay images yellow color represents the areas stained with both XO and DMP1-GFP. Scale bar represents =100mm.
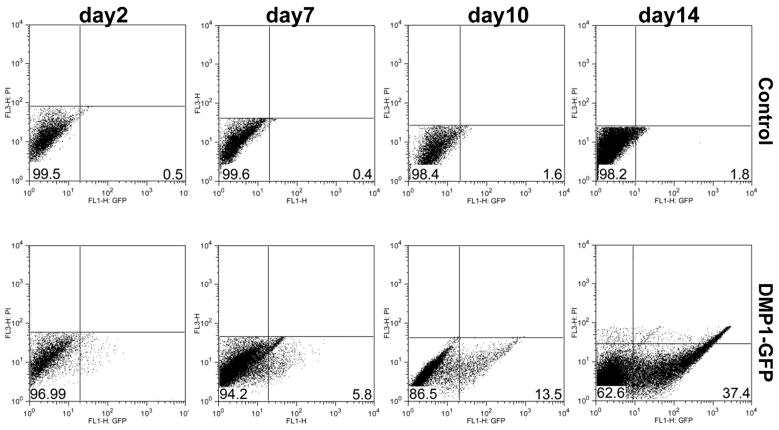
Changes in the percentage of cells expressing DMP1-GFP and the distribution of signal strength within DMP1-GFP+ cells in primary pulp cultures were also examined by flow cytometry. A few cells expressing DMP1-GFP at low intensity were detected at early time points (days 2 and 7). With the onset and subsequent growth of mineralized matrix there was an approximately 18 fold increase in the percent of DMP1-GFP+ cells and a decrease in the percent of DMP1-GFP- cells (Figure 5 and Table 1). There were also continuous increases in the mean intensity of DMP1-GFP between days 2 (75) and day 14 (216).
Figure 5. FACS analysis of primary cultures.
The X-axis represents the GFP intensity and the y-axis represents the PI staining used to gate only on viable cells. Numbers on the histograms represent the percentage for this representative experiment.
Table 1.
Expression of GFP in primary pulp cultures obtained from DMP1-GFP animals. FACS analysis of dental pulp cultures at different time points. Values represent means ± S.E. from at least three individual experiments.
| %DMP1-GFP- cells | %DMP1-GFP+ cells | |
|---|---|---|
| day2 | 98 ± 0.6 | 1.9 ± 0.6 |
| day7 | 94.6 ± 0.4 | 5.4 ± 0.4 |
| day10 | 86.8 ± 0.3 | 13.2 ± 0.3 |
| day14 | 62.8 ± 0.9 | 37.2 ± 0.9 |
To determine if the increase in the DMP1-GFP+ population was due to activation of DMP1-GFP in a new population (did not express these transgenes before) and/or proliferation of existing GFP+ population, DNA content/cell cycle analysis was performed. The rate of proliferation in DMP1-GFP- cells was significantly higher (45.7%) than DMP1-GFP+ cells (25.3%) (Table 2) indicating that increases in the number of DMP1-GFP+ cells in cultures were primarily due to activation of DMP1-GFP in new cells.
Table 2. Analysis of cell proliferation using Hoecsht 33342 dye.
Three day old primary pulp cultures derived from DMP1-GFP animals were prepared for FACS analysis and results were obtained using ModFit Software. Results represent mean ± S.E. from at least three experiments. Values represent mean ± SD of percentage of cells in G0+G1, G2+M and S phases in GFP+ and GFP- populations in at least three independent experiments.
| Period in the cell cycle | % DMP1- GFP- cells | % DMP1- GFP+ cells |
|---|---|---|
| G0G1 | 54.3 ± 0.7 | 77.7 ± 2.7 |
| S | 20.5 ± 1.1 | 15.3 ± 5.0 |
| G2M | 25.2 ± 0.7 | 10.0 ± 0.3 |
| S+G2M | ~45.7 | ~25.3 |
Comparison of the expression of DMP1-GFP and markers of mineralization
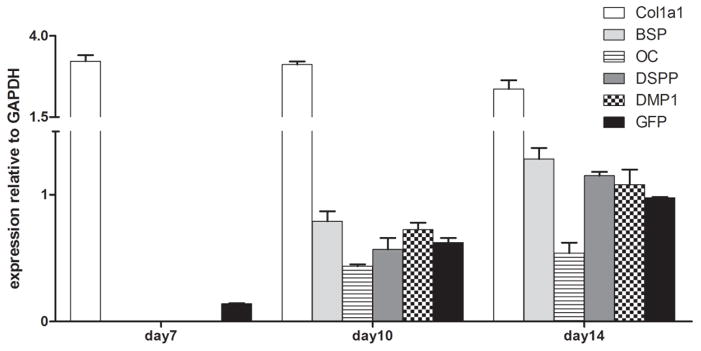
The pattern of expression of DMP1-GFP was also compared to the expression of selected markers for early and late stages of odontoblast differentiation (Col1a1, OC, DMP1 and DSPP) by RT-PCR analysis (Figure 6). In these cultures a low but detectable level of GFP was expressed at day 7 (prior to the expression of early and late markers of mineralization) and increased thereafter. The expression of BSP, OC, DSPP and endogenous DMP1 was not detected at day 7, appeared at day 10 and increased at day 14. It should be noted that the pattern of expression of DMP1 during mineralization of primary pulp cultures was different from its patterns of expression in primary osteogenic cultures (neonatal calvaria and BMSC) [17]. In osteogenic cultures, DMP1 was first detected after mineralization and expression of osteocalcin [17]. We showed in primary pulp cultures the expression of DMP1 and OC are detected at the same time, just prior to or at the onset of mineralization.
Figure 6. Expression of early and late markers of mineralization in primary pulp cultures and their correlation with DMP1-GFP expression.
Low levels of GFP expression were detected at day 7, with early marker of mineralization Col1a1 also expressed. The levels of GFP expression increased at days 14 and 21. Markers of mineralization (BSP, OC and DMP1) and dentinogenesis (DSPP) were detected at day 14 and increased at day 21. Values represent mean ± S.E. determined from at least four independent experiments.
Stage of activation of DMP1-GFP in pulp cultures, mineralization and dentinogenic potentials of DMP1-GFP+ and DMP1-GFP- populations
The presence of a mixture of cells (GFP+ and GFP−) in pulp cultures at day 2 and the expression of DMP1-GFP in pulps of intact teeth made it difficult to study the stage of activation of this transgene during mineralization and dentinogenesis. Therefore, we studied the expression of this transgene in DMP1-GFP- populations.
Primary pulp cultures were prepared from DMP1-GFP transgenic mice and grown in culture conditions supporting their proliferation. At day 7, FACS sorting and re-analysis were used for separation of DMP1-GFP+ and DMP1-GFP- populations with >98% purity (Supplemental Figure 1A). Both populations were re-plated at the same density as unsorted cells (5×10⁵ cells/well in 35-mm culture plates) and grown for an additional 7 days in media supporting their proliferation and then in mineralization inducing media. Controls in these experiments included cultures from unsorted cells (primary cultures) and cultures from unsorted cells that were re-plated after 7 days (secondary culture).
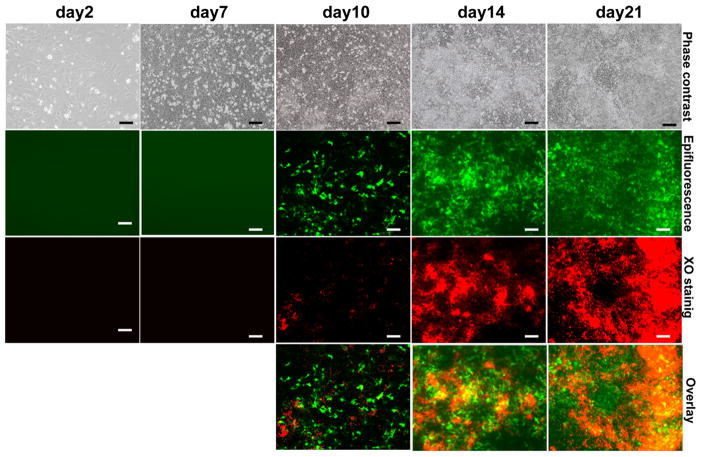
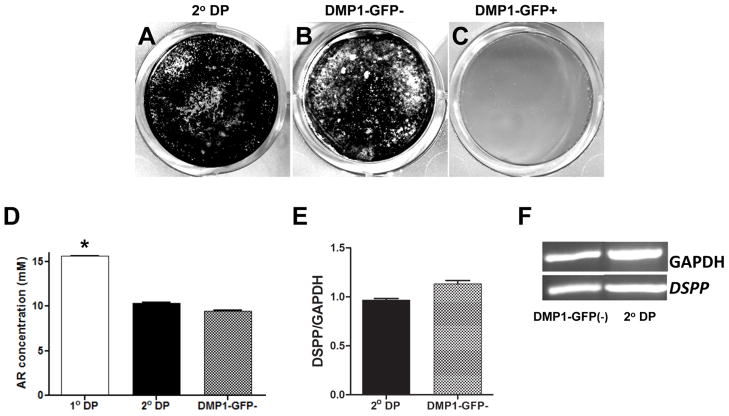
Cultures from DMP1-GFP- population remained healthy, proliferated and reached confluence at day 7 (Figure 7). The number of viable cells in these cultures was high and similar to that in secondary cultures (Supplemental Figure 1B). In these cultures, GFP was not detected at day 2 and was detected at low intensity in a very few scattered cells at day 7 (Figure 7). At day 10, three days after the addition of mineralization inducing media, individual and small clusters of cells expressing DMP1-GFP were detected throughout the culture. XO staining showed that mineralization occurred in small spotty areas and were associated with cells expressing DMP1-GFP (Figure 7). At days 14 and 21, these cultures contained an extensive number of multi-layered nodules that stained with XO, and cells expressing DMP1-GFP at low and high intensity. The extent of mineralization in DMP1-GFP- population (Figure 8D) were comparable to those in secondary cultures (Figure 8A and 8D) but lower than that in primary cultures (Figure 8D). DMP1-GFP- population also differentiated into odontoblasts as indicated by the expression of DSPP (Figure 8E and 8F). The relative level of DSPP in DMP1-GFP- cultures was not significantly different from that in secondary cultures (Figure 8E and 8F).
Figure 7. In vitro differentiation of DMP1-GFP- population.
Images of the same areas in live cultures established from DMP1-GFP- population were analyzed at different time points under phase contrast, epifluorescent light. Overlay of the two epifluorescent images generated in Photoshop shows correlation of GFP expression and XO staining. Note that DMP1-GFP is detected in few scattered cells at day 7 and that the number and intensity of GFP increased with time in culture. XO staining was detected at day 10 and increased at day 14 and 21. Note the expression of DMP1-GFP in unmineralized regions at day 10. Also note cells expressing GFP are detected in unmineralized and mineralized nodules. In overlay images yellow color represents the areas stained with both XO and DMP1-GFP. Scale bar=100mm.
Figure 8. Mineralization and dentinogenic potential of DMP1-GFP- and DMP1-GFP+ populations.
(A–C) represent images of von Kossa staining of cultures established from unsorted cells (secondary culture) (A), DMP1-GFP- (B) and DMP1-GFP+ (C) cells after 21 days. (D) Histogram showing the amounts of extracted Alizarin Red staining in cultures after 21 days. Values represent the concentration of the extracted Alizarin Red calculated from the mean absorbance ± S.E. for at least three independent experiments with multiple samples in each experiment (*p<0.05). (E) Histogram showing the relative levels of DSPP after 21 days in these cultures The levels of DSPP were normalized to GAPDH. (F) RT-PCR analysis of expression of DSPP in these cultures.
In cultures from DMP1-GFP+ population only a few cells attached to the culture dish and survived (Supplemental Figure 1C). The attached cells exhibited poor viability and never reached confluence (data not shown). Plating at higher density did not improve their attachment, viability or proliferation (data not shown). Furthermore, the majority of attached cells lost the expression of DMP1-GFP after 2 days of re-plating (Supplemental Figure 1C). Due to poor viability and proliferation, the extent of mineralization and relative levels of DSPP expression in DMP1-GFP+ cultures were at background levels. The behavior of the DMP1-GFP+ population suggested that this population might contain cells at a relatively advanced stage of differentiation (i.e., differentiated odontoblasts/late osteoblast/osteocytes). The lack of DSPP expression in DMP1-GFP+ cells (data not shown) suggested that this population contains cells in either the osteogenic lineage (late osteoblasts/osteocyte) or odontoblasts that have not initiated DSPP expression.
The DMP1-GFP-transgene is expressed by odontoblasts and osteocytes in primary pulp cultures
Our recent immunocytochemical analysis of primary pulp cultures from unerupted molars with anti-DSP antibody showed that in dental pulp cultures approximately half (50%–55%) of the mineralized tissue was dentin-like matrix secreted by odontoblasts [24]. The lack of DSP expression in the remaining mineralized matrix in these cultures suggested that these cultures contained bone-like matrix deposited by osteoblasts/osteocytes. Previous studies in primary BMSC cultures showed expression of DMP1-GFP at high intensity in late osteoblasts/osteocytes [17]. Therefore, to gain further insight into osteogenic and dentinogenic potentials of the pulp cultures, the expression of DSP in 14 and 21 day-old dental pulp cultures from DMP1-GFP transgenic animals was examined by immunocytochemistry using anti-DSP antibody. Mineralization in these cultures was examined by Calcein Blue staining.
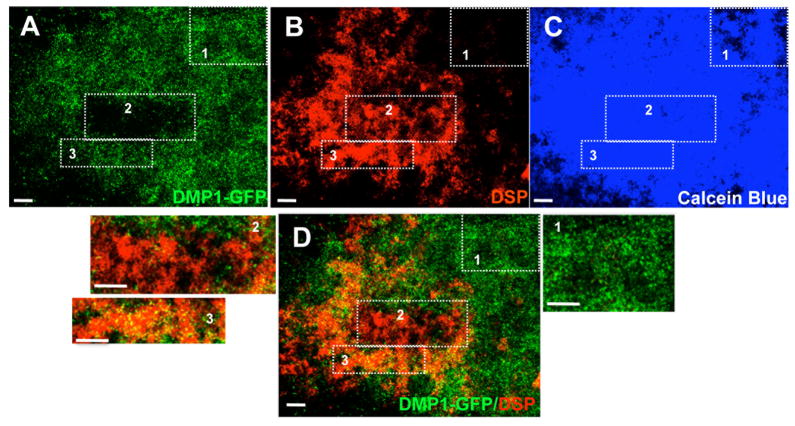
At days 14 and 21, there was a good correlation between the expression of DMP1-GFP and mineralization (Figure 9A and 9C and Supplemental Figure 2). On the other hand, DSP expression was detected only in a fraction of area stained with and DMP1-GFP and Calcein blue (Figure 9B and 9C and Supplemental Figure 2 and data not shown). Cultures stained with Calcein Blue, DMP1-GFP and Anti-DSP showed two distinct areas identified by differential expression of these markers (Figure 9D and Supplemental Figure 2). The first area contained Calcein Blue+/DMP1-GFP+/DSP- matrices (region 1 in Figure 9 and Supplemental Figure 2) representing areas containing osteoblasts/osteocytes secreting bone-like matrix. The osteogenic potential and the formation of osteocytes in pulp cultures was further studied by examining the expression of sclerostin (SOST), an osteocyte specific protein [28]. At P1, SOST was expressed by osteocytes in the calvaria and in the cortical bones but not in the odontoblasts (Supplemental Figure 3). Analysis of pulp cultures showed the expression of low levels of Sost only in the 21 day-old pulp cultures. The levels of Sost expression in the primary pulp cultures were comparable to those in primary cultures from calvaria and showed the formation of osteocyte-like cells in both cultures, confirming the osteogenic potential of the primary pulp cultures.
Figure 9. Expression of DMP1-GFP, DSP in mineralized matrix in vitro at day 21.
Images representing expression of DMP1-GFP (A), DSP (B) and Calcein Blue (C) in the same culture at day 21. D represents the Overlay of the two images generated in Photoshop showing the correlation of DMP1-GFP expression and DSP staining. Rectangles indicated by 1, 2, 3 in all images are shown at higher magnifications. Area 1 contains cells expressing DMP1-GFP at high intensity, that is also stained with Calcein Blue but not DSP representing the osteogenic differentiation in this culture. Area 2 contains cells expressing DMP1-GFP at very low intensity, is stained with anti-DSP antibody and Calcein Blue representing the dentinogenic differentiation and the formation of fully highly differentiated odontoblasts. Area 3 contains cells expressing DMP1-GFP at both high and low intensity, is stained with anti-DSP antibody and Calcein Blue characteristic of the dentinogenic differentiation and the formation of secretory/functional odontoblasts and young odontoblasts. Scale bars in all images = 1mm
The second area contained Calcein Blue+/DMP1-GFP+/DSP+ staining (regions 2 and 3 in Figure 9 and Supplemental Figure 2) representing areas containing odontoblasts secreting dentin-like matrix. More interesting were the patterns of DMP1-GFP expression in areas of cultures containing dentin-like matrices (DSP+ regions) (regions 2 and 3 in Figure 9 and Supplemental Figure 2). Some of the DSP+ regions contained cells expressing DMP1-GFP at both high and low intensities (region 3 in Figure 9 and Supplemental Figure 2) and some of the DSP+ regions contained cells expressing DMP1-GFP at very low intensity (region 2 in Figure 9). There were significant increases in the extent of the DSP+ regions that contained cells expressing DMP1-GFP at very low intensity between days 14 and 21 (Figure 9 and Supplemental Figure 2). The expression of DMP1-GFP at low intensity in DSP+ regions in 21 days old culture is similar to the patterns of expression of DMP1-GFP in vivo and represent highly differentiated odontoblasts.
DISCUSSION
In this study, we have examined the expression of DMP1-GFP in developing teeth and during mineralization and odontoblast differentiation in primary pulp cultures. The in vivo studies showed that DMP1-GFP was first expressed at E19 in the secretory/functional odontoblasts. The expression of DMP1-GFP intensified in odontoblasts synthesizing primary dentin and was decreased in highly differentiated odontoblasts synthesizing secondary dentin. The patterns of expression of DMP1-GFP in the odontoblasts during embryonic and postnatal stages of development are similar to the patterns of expression of endogenous DMP1 mRNA and protein in mice and rats [29–31] that showed during dentinogenesis DMP1 mRNA and protein are first detected in secretory/functional odontoblasts secreting unmineralized predentin [29–31]. Advancing stages of dentinogenesis are accompanied by gradual decreases in the levels of DMP1 in highly differentiated odontoblasts [29–31]. These similarities indicated that 8 kb regulatory element of DMP1 driving the expression of GFP have sufficient strength and specificity to monitor the stage-specific changes in DMP1 expression during odontoblast differentiation in vivo.
Our in vitro studies showed that during minerlization of primary pulp cultures, DMP1-GFP is expressed in cells in odontogenic and osteogenic lineage. The expression of DMP1-GFP and Sost in primary pulp cultures provide a strong evidence of osteogenesis and the formation of osteocytes in pulp cultures. In the osteogenic areas of cultures (identified by the lack of DSP expression), DMP1-GFP was expressed at high intensity. On the other hand, in the dentinogenic areas (identified by the expression of DSP), DMP1-GFP was expressed at two different intensities. The expression of DMP1-GFP at high intensity was associated with secretory/functional and newly differentiated odontoblasts whereas the expression at very low intensity was associated with highly differentiated odontoblasts. These results showed the heterogeneity of the pulp cultures with respect to odontoblast differentiation, their capacity to differentiate into odontoblasts at several stages of differentiation and the ability of the 8 kb region of the DMP1 to drive the expression of GFP to odontoblasts in a stage-specific manner in vitro. Our observations showed that, unlike during osteogenesis where high levels of DMP1-GFP are maintained in highly differentiated osteocytes, the expression of DMP1-GFP is decreased in the highly differentiated odontoblasts indicating that 8 kb fragment of the DMP1 contains elements that regulate its differential expression in highly differentiated odontoblasts and osteocytes.
Our in vitro studies also showed that DMP1-GFP+ population exhibited poor proliferation and survival, suggesting that this population contains post-mitotic cells in advanced stages of differentiation (either the osteogenic and/or dentinogenic lineage). Previous studies in BMSC cultures [17], osteoblasts 2T3 cell line [18] and primary calvarial osteoblasts showed that the expression of DMP1-GFP was not detected at early stages and was detected during later stages of minerlization [17]. The late expression of the DMP1-GFP in these osteogenic cultures [17–19] as compared to its early appearance in dental pulp cultures (in a few cells at day 7 and then at day 10) suggests that the early expression of this transgene in the dental pulp cultures represents its activation in cells in the dentinogenic lineage.
The lack of detectable levels of DSPP in DMP1-GFP+ population isolated at day 7 (early time point) from pulp cultures suggested that DMP1-GFP is activated in secretory odontoblasts prior to the expression of DSPP. This is consistent with results that suggested roles for DMP1 in regulation of DSPP expression [12, 14, 20, 32–34]. Despite the similarities in the abnormalities in the teeth of DMP1 and DSPP null mice [32, 33], DMP1 null mutants showed significant decreases in the levels of DSPP in odontoblasts [12, 14, 20]. These observations, and the identification of DMP1-response elements in the DSPP gene [34], suggested roles for DMP1 in regulation of DSPP expression. Further experiments are in progress to examine and compare the expression of DSPP and DMP1 during odontoblast differentiation in vivo and in vitro in dual transgenic mice carrying cyan fluorescent protein under the control of DSPP regulatory elements and mCherry fluorescent protein under the control of DMP1 regulatory sequences.
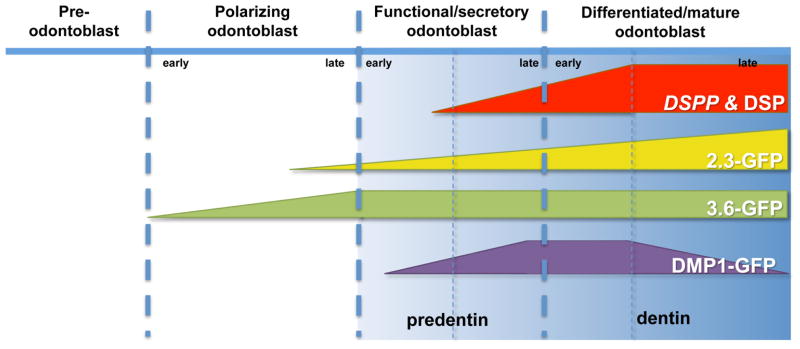
This study complements our recent study [25] using pOBCol3.6GFP and pOBCol2.3GFP transgenic mice that showed that the 3.6-GFP transgene was activated in cells in early stages of polarization whereas the 2.3-GFP transgene was activated at a later stage of polarization just before or at the time of formation of secretory/functional odontoblast [25] (Figure 10). The behaviour of DMP1-GFP+ population is different from 2.3-GFP+ population. Unlike the 2.3-GFP+ population that showed proliferation and mineralization [25], DMP1-GFP+ cells exhibited poor proliferation. Furthermore, the percentage of 2.3-GFP+ population in pulp cultures at all time points was significantly higher than that of DMP1-GFP+ population. In addition, in pulp cultures, DMP1-GFP transgene is activated at later time point than 2.3-GFP transgene [25]. Unlike the 2.3-GFP, DMP1-GFP expression was closely associated with early and late mineralizing nodules. These together provide evidence that during odontoblast differentiation, DMP1-GFP transgene is activated in more advanced stage of differentiation (seceretory/functional odontoblasts) than 2.3-GFP transgene that is activated in late stage of polarization [25].
Figure 10.
Schematic representation of proposed stages of activation of DMP1-GFP during odontoblast differentiation. DSPP was used as a marker of early and later stages of mineralization. The expression of 3.6-GFP and 2.3-GFP transgenes during odontoblast differentiation are based on the results reported by Balic et al [25].
The transition from preodontoblasts to highly differentiated odontoblasts involves many important changes. A recent study showed that changes in the secretory activity of odontoblasts are accompanied by changes in the profile of expression of six genes (PTPRR, NTRK2, MAP2K6, CD14, MAPK13 and FGF1) involved in p38 signaling pathway [35, 36]. An earlier report suggested involvement of C-jun and Jun-B in the transcriptional regulation of terminally differentiated odontoblasts [37]. c-Jun and JunB are members of Jun family of proteins and components of AP1 transcriptional complex [38]. These proteins form either homodimers or heterodimers that bind to the consensus sequence TGACTCA in numerous promoters [38] including DMP1 [39] and DSPP [40] promoters.
In summary, our results showed the heterogeneity of pulp cultures and the necessity for development of markers for identification and isolation of more homogenous population for careful lineage analysis. Our data indicated that DMP1-GFP expression is activated in secretory/functional odontoblasts producing predentin (Figure 10). Progression down the odontoblast lineage is followed by a transient increase in the intensity of DMP1-GFP in the young differentiated odontoblasts and then a decrease in highly differentiated odontoblasts (Figure 10). Our analysis of DMP1-GFP transgene during odontoblast differentiation indicates that this transgene can be used for identification and isolation of secretory/functional odontoblasts from the heterogeneous population of dental pulp cells and will allow further characterization of gene expression profiles in this population during normal and abnormal dentinogenesis in mice with various genetic mutations.
Supplementary Material
(A )Histogram showing that FACS sorting resulted in clear separation of DMP1-GFP- (approximately 93%) and DMP1-GFP+ (approximately 7%) sub-populations. Histogram of FACS re-analysis on isolated cell sub-populations showed that the purity of both was higher than 98%. Histogram showing the results of the MTS assay. Values represent mean ± SD of three independent experiments and are expressed as the light absorbance at 490 nm. represents images of the same areas in live cultures at different time points analyzed under phase contrast (upper row) and epifluorescent light.
Images representing expression of DMP1-GFP (A), DSP (B) and Calcein Blue (C) in the same culture at day 14. D represents the Overlay of the two images generated in Photoshop showing the correlation of DMP1-GFP expression and DSP staining. Area indicated by 1 in all images represents area of osteogenic differentiation characterized by cells expressing DMP1-GFP with at high intensity, stained with Calcein Blue but not DSP. Areas indicated by 3 in all images represent the dentinogenic differentiation and the formation of secretory/functional and young odontoblasts characterized by cells expressing DMP1-GFP at both high and low intensity and staining with both anti-DSP antibody and Calcein Blue. Scale bars in all images = 1mm
(A–D) represent images of sections through the first molar (A), incisor (B), calvaria (C) and long bone (D) from P1 and P21 animals processed for immunohistochemistry using Anti-SOST antibody. SOST expression was detected in a osteocytes in the calvaria (C) and the cortical bone (D). SOST expression was not detected in the odontoblasts in the developing teeth at the same stage (A, B). Scale bars in all images = 100 μm.
TaqMan real-time qPCR was performed on cDNA synthesized from RNA obtained from dental pulp, and calvarial at days 7, 14 and 21. Data was imported into Microsoft Excel and were analyzed using the ΔΔCT method to demonstrate the change in the expression of the target genes relative to the internal control (GAPDH). Values represent mean ± S.E of four independent experiments relative to the values in the intact bone.
Acknowledgments
Grant sponsor: National Institute of Health
Grant numbers: DE016689
We thank all the individuals who provided reagents, valuable input and technical assistance in various aspects of these studies including Drs. David Rowe, Ivo Kalajzic, H. Leonardo Aguila, Sun-Kyeong Lee, Mrs. Katie Lamothe, Miss. Diane Gran, and Mrs. Barbara Rodgers. This work was supported by a grant from National Institute of Health (NIDCR) to MM (DE016689).
Footnotes
Publisher's Disclaimer: This is a PDF file of an unedited manuscript that has been accepted for publication. As a service to our customers we are providing this early version of the manuscript. The manuscript will undergo copyediting, typesetting, and review of the resulting proof before it is published in its final citable form. Please note that during the production process errors may be discovered which could affect the content, and all legal disclaimers that apply to the journal pertain.
References
- 1.Sloan AJ, Smith AJ. Stem cells and the dental pulp: potential roles in dentine regeneration and repair. Oral Dis. 2007;13:151–7. doi: 10.1111/j.1601-0825.2006.01346.x. [DOI] [PubMed] [Google Scholar]
- 2.Sloan AJ, Waddington RJ. Dental pulp stem cells: what, where, how? Int J Paediatr Dent. 2009;19:61–70. doi: 10.1111/j.1365-263X.2008.00964.x. [DOI] [PubMed] [Google Scholar]
- 3.Arana-Chavez VE, Massa LF. Odontoblasts: the cells forming and maintaining dentine. Int J Biochem Cell Biol. 2004;36:1367–73. doi: 10.1016/j.biocel.2004.01.006. [DOI] [PubMed] [Google Scholar]
- 4.Thesleff I, Keranen S, Jernvall J. Enamel knots as signaling centers linking tooth morphogenesis and odontoblast differentiation. Adv Dent Res. 2001;15:14–8. doi: 10.1177/08959374010150010401. [DOI] [PubMed] [Google Scholar]
- 5.Ruch JV, Lesot H, Begue-Kirn C. Odontoblast differentiation. Int J Dev Biol. 1995;39:51–68. [PubMed] [Google Scholar]
- 6.Lesot H, Lisi S, Peterkova R, Peterka M, Mitolo V, Ruch JV. Epigenetic signals during odontoblast differentiation. Adv Dent Res. 2001;15:8–13. doi: 10.1177/08959374010150012001. [DOI] [PubMed] [Google Scholar]
- 7.Nanci A. Ten Cate's Oral Histology: Development, Structure and Function. 7. 2008. [Google Scholar]
- 8.Fisher LW, Torchia DA, Fohr B, Young MF, Fedarko NS. Flexible structures of SIBLING proteins, bone sialoprotein, and osteopontin. Biochem Biophys Res Commun. 2001;280:460–5. doi: 10.1006/bbrc.2000.4146. [DOI] [PubMed] [Google Scholar]
- 9.Fisher LW, Fedarko NS. Six genes expressed in bones and teeth encode the current members of the SIBLING family of proteins. Connect Tissue Res. 2003;44 (Suppl 1):33–40. [PubMed] [Google Scholar]
- 10.Narayanan K, Srinivas R, Ramachandran A, Hao J, Quinn B, George A. Differentiation of embryonic mesenchymal cells to odontoblast-like cells by overexpression of dentin matrix protein 1. Proc Natl Acad Sci U S A. 2001;98:4516–21. doi: 10.1073/pnas.081075198. [DOI] [PMC free article] [PubMed] [Google Scholar]
- 11.Ling Y, Rios HF, Myers ER, Lu Y, Feng JQ, Boskey AL. DMP1 depletion decreases bone mineralization in vivo: an FTIR imaging analysis. J Bone Miner Res. 2005;20:2169–77. doi: 10.1359/JBMR.050815. [DOI] [PMC free article] [PubMed] [Google Scholar]
- 12.Ye L, MacDougall M, Zhang S, Xie Y, Zhang J, Li Z, Lu Y, Mishina Y, Feng JQ. Deletion of dentin matrix protein-1 leads to a partial failure of maturation of predentin into dentin, hypomineralization, and expanded cavities of pulp and root canal during postnatal tooth development. J Biol Chem. 2004;279:19141–8. doi: 10.1074/jbc.M400490200. [DOI] [PubMed] [Google Scholar]
- 13.Feng JQ, Ward LM, Liu S, Lu Y, Xie Y, Yuan B, Yu X, Rauch F, Davis SI, Zhang S, Rios H, Drezner MK, Quarles LD, Bonewald LF, White KE. Loss of DMP1 causes rickets and osteomalacia and identifies a role for osteocytes in mineral metabolism. Nat Genet. 2006;38:1310–5. doi: 10.1038/ng1905. [DOI] [PMC free article] [PubMed] [Google Scholar]
- 14.Ye L, Mishina Y, Chen D, Huang H, Dallas SL, Dallas MR, Sivakumar P, Kunieda T, Tsutsui TW, Boskey A, Bonewald LF, Feng JQ. Dmp1-deficient mice display severe defects in cartilage formation responsible for a chondrodysplasia-like phenotype. J Biol Chem. 2005;280:6197–203. doi: 10.1074/jbc.M412911200. [DOI] [PMC free article] [PubMed] [Google Scholar]
- 15.Lu Y, Ye L, Yu S, Zhang S, Xie Y, McKee MD, Li YC, Kong J, Eick JD, Dallas SL, Feng JQ. Rescue of odontogenesis in Dmp1-deficient mice by targeted re-expression of DMP1 reveals roles for DMP1 in early odontogenesis and dentin apposition in vivo. Dev Biol. 2007;303:191–201. doi: 10.1016/j.ydbio.2006.11.001. [DOI] [PMC free article] [PubMed] [Google Scholar]
- 16.Lu Y, Zhang S, Xie Y, Pi Y, Feng JQ. Differential regulation of dentin matrix protein 1 expression during odontogenesis. Cells Tissues Organs. 2005;181:241–7. doi: 10.1159/000091385. [DOI] [PubMed] [Google Scholar]
- 17.Kalajzic I, Braut A, Guo D, Jiang X, Kronenberg MS, Mina M, Harris MA, Harris SE, Rowe DW. Dentin matrix protein 1 expression during osteoblastic differentiation, generation of an osteocyte GFP-transgene. Bone. 2004;35:74–82. doi: 10.1016/j.bone.2004.03.006. [DOI] [PubMed] [Google Scholar]
- 18.Yang W, Lu Y, Kalajzic I, Guo D, Harris MA, Gluhak-Heinrich J, Kotha S, Bonewald LF, Feng JQ, Rowe DW, Turner CH, Robling AG, Harris SE. Dentin matrix protein 1 gene cis-regulation: use in osteocytes to characterize local responses to mechanical loading in vitro and in vivo. J Biol Chem. 2005;280:20680–90. doi: 10.1074/jbc.M500104200. [DOI] [PubMed] [Google Scholar]
- 19.Dallas SL, Veno PA, Rosser JL, Barragan-Adjemian C, Rowe DW, Kalajzic I, Bonewald LF. Time lapse imaging techniques for comparison of mineralization dynamics in primary murine osteoblasts and the late osteoblast/early osteocyte-like cell line MLO-A5. Cells Tissues Organs. 2009;189:6–11. doi: 10.1159/000151745. [DOI] [PMC free article] [PubMed] [Google Scholar]
- 20.Feng JQ, Huang H, Lu Y, Ye L, Xie Y, Tsutsui TW, Kunieda T, Castranio T, Scott G, Bonewald LB, Mishina Y. The Dentin matrix protein 1 (Dmp1) is specifically expressed in mineralized, but not soft, tissues during development. J Dent Res. 2003;82:776–80. doi: 10.1177/154405910308201003. [DOI] [PubMed] [Google Scholar]
- 21.Toyosawa S, Shintani S, Fujiwara T, Ooshima T, Sato A, Ijuhin N, Komori T. Dentin matrix protein 1 is predominantly expressed in chicken and rat osteocytes but not in osteoblasts. J Bone Miner Res. 2001;16:2017–26. doi: 10.1359/jbmr.2001.16.11.2017. [DOI] [PubMed] [Google Scholar]
- 22.Braut A, Kollar EJ, Mina M. Analysis of the odontogenic and osteogenic potentials of dental pulp in vivo using a Col1a1-2.3-GFP transgene. Int J Dev Biol. 2003;47:281–92. [PubMed] [Google Scholar]
- 23.Balic A, Aguila HL, Caimano MJ, Francone VP, Mina M. Characterization of stem and progenitor cells in the dental pulp of erupted and unerupted murine molars. Bone. 2010;6:1639–51. doi: 10.1016/j.bone.2010.02.019. [DOI] [PMC free article] [PubMed] [Google Scholar]
- 24.Balic A, Mina M. Characterization of Progenitor Cells in Pulps of Murine Incisors. JDR. 2010;89:1287–92. doi: 10.1177/0022034510375828. [DOI] [PMC free article] [PubMed] [Google Scholar]
- 25.Balic A, Aguila HL, Mina M. Identification of Cells at Early and Late Stages of Polarization During Odontoblast Differentiation Using pOBCol3.6GFP and pOBCol2.3GFP Transgenic Mice. Bone. 2010;47:948–58. doi: 10.1016/j.bone.2010.08.009. [DOI] [PMC free article] [PubMed] [Google Scholar]
- 26.Wang YH, Liu Y, Maye P, Rowe DW. Examination of mineralized nodule formation in living osteoblastic cultures using fluorescent dyes. Biotechnol Prog. 2006;22:1697–701. doi: 10.1021/bp060274b. [DOI] [PMC free article] [PubMed] [Google Scholar]
- 27.Balic A, Rodgers B, Mina M. Mineralization and expression of Col1a1-3.6GFP transgene in primary dental pulp culture. Cells Tissues Organs. 2009;189:163–8. doi: 10.1159/000154813. [DOI] [PMC free article] [PubMed] [Google Scholar]
- 28.Kramer I, Keller H, Leupin O, Kneissel M. Does osteocytic SOST suppression mediate PTH bone anabolism? Trends Endocrinol Metab. 21:237–44. doi: 10.1016/j.tem.2009.12.002. [DOI] [PubMed] [Google Scholar]
- 29.D'Souza RN, Cavender A, Sunavala G, Alvarez J, Ohshima T, Kulkarni AB, MacDougall M. Gene expression patterns of murine dentin matrix protein 1 (Dmp1) and dentin sialophosphoprotein (DSPP) suggest distinct developmental functions in vivo. J Bone Miner Res. 1997;12:2040–9. doi: 10.1359/jbmr.1997.12.12.2040. [DOI] [PubMed] [Google Scholar]
- 30.Hao J, Ramachandran A, George A. Temporal and spatial localization of the dentin matrix proteins during dentin biomineralization. J Histochem Cytochem. 2009;57:227–37. doi: 10.1369/jhc.2008.952119. [DOI] [PMC free article] [PubMed] [Google Scholar]
- 31.Hao J, Zou B, Narayanan K, George A. Differential expression patterns of the dentin matrix proteins during mineralized tissue formation. Bone. 2004;34:921–32. doi: 10.1016/j.bone.2004.01.020. [DOI] [PubMed] [Google Scholar]
- 32.Sreenath T, Thyagarajan T, Hall B, Longenecker G, D'Souza R, Hong S, Wright JT, MacDougall M, Sauk J, Kulkarni AB. Dentin sialophosphoprotein knockout mouse teeth display widened predentin zone and develop defective dentin mineralization similar to human dentinogenesis imperfecta type III. J Biol Chem. 2003;278:24874–80. doi: 10.1074/jbc.M303908200. [DOI] [PubMed] [Google Scholar]
- 33.Sreenath TL, Cho A, Thyagarajan T, Kulkarni AB. Odontoblast-specific expression of cre recombinase successfully deletes gene segments flanked by loxP sites in mouse teeth. Genesis. 2003;35:94–9. doi: 10.1002/gene.10170. [DOI] [PubMed] [Google Scholar]
- 34.Narayanan K, Gajjeraman S, Ramachandran A, Hao J, George A. Dentin matrix protein 1 regulates dentin sialophosphoprotein gene transcription during early odontoblast differentiation. J Biol Chem. 2006;281:19064–71. doi: 10.1074/jbc.M600714200. [DOI] [PubMed] [Google Scholar]
- 35.Simon S, Smith AJ, Berdal A, Lumley PJ, Cooper PR. The MAP kinase pathway is involved in odontoblast stimulation via p38 phosphorylation. J Endod. 36:256–9. doi: 10.1016/j.joen.2009.09.019. [DOI] [PubMed] [Google Scholar]
- 36.Simon S, Smith AJ, Lumley PJ, Berdal A, Smith G, Finney S, Cooper PR. Molecular characterization of young and mature odontoblasts. Bone. 2009;45:693–703. doi: 10.1016/j.bone.2009.06.018. [DOI] [PubMed] [Google Scholar]
- 37.Kitamura C, Terashita M. Expressions of c-jun and jun-B proto-oncogenes in odontoblasts during development of bovine tooth germs. J Dent Res. 1997;76:822–30. doi: 10.1177/00220345970760040201. [DOI] [PubMed] [Google Scholar]
- 38.Marie PJ. Transcription factors controlling osteoblastogenesis. Arch Biochem Biophys. 2008;473:98–105. doi: 10.1016/j.abb.2008.02.030. [DOI] [PubMed] [Google Scholar]
- 39.Narayanan K, Ramachandran A, Hao J, George A. Transcriptional regulation of dentin matrix protein 1 (DMP1) by AP-1 (c-fos/c-jun) factors. Connect Tissue Res. 2002;43:365–71. doi: 10.1080/03008200290000592. [DOI] [PubMed] [Google Scholar]
- 40.Feng JQ, Luan X, Wallace J, Jing D, Ohshima T, Kulkarni AB, D'Souza RN, Kozak CA, MacDougall M. Genomic organization, chromosomal mapping, and promoter analysis of the mouse dentin sialophosphoprotein (Dspp) gene, which codes for both dentin sialoprotein and dentin phosphoprotein. J Biol Chem. 1998;273:9457–64. doi: 10.1074/jbc.273.16.9457. [DOI] [PubMed] [Google Scholar]
Associated Data
This section collects any data citations, data availability statements, or supplementary materials included in this article.
Supplementary Materials
(A )Histogram showing that FACS sorting resulted in clear separation of DMP1-GFP- (approximately 93%) and DMP1-GFP+ (approximately 7%) sub-populations. Histogram of FACS re-analysis on isolated cell sub-populations showed that the purity of both was higher than 98%. Histogram showing the results of the MTS assay. Values represent mean ± SD of three independent experiments and are expressed as the light absorbance at 490 nm. represents images of the same areas in live cultures at different time points analyzed under phase contrast (upper row) and epifluorescent light.
Images representing expression of DMP1-GFP (A), DSP (B) and Calcein Blue (C) in the same culture at day 14. D represents the Overlay of the two images generated in Photoshop showing the correlation of DMP1-GFP expression and DSP staining. Area indicated by 1 in all images represents area of osteogenic differentiation characterized by cells expressing DMP1-GFP with at high intensity, stained with Calcein Blue but not DSP. Areas indicated by 3 in all images represent the dentinogenic differentiation and the formation of secretory/functional and young odontoblasts characterized by cells expressing DMP1-GFP at both high and low intensity and staining with both anti-DSP antibody and Calcein Blue. Scale bars in all images = 1mm
(A–D) represent images of sections through the first molar (A), incisor (B), calvaria (C) and long bone (D) from P1 and P21 animals processed for immunohistochemistry using Anti-SOST antibody. SOST expression was detected in a osteocytes in the calvaria (C) and the cortical bone (D). SOST expression was not detected in the odontoblasts in the developing teeth at the same stage (A, B). Scale bars in all images = 100 μm.
TaqMan real-time qPCR was performed on cDNA synthesized from RNA obtained from dental pulp, and calvarial at days 7, 14 and 21. Data was imported into Microsoft Excel and were analyzed using the ΔΔCT method to demonstrate the change in the expression of the target genes relative to the internal control (GAPDH). Values represent mean ± S.E of four independent experiments relative to the values in the intact bone.


