Abstract
Insulin release by pancreatic β-cells is regulated by diverse intracellular signals, including changes in Ca2+ concentration resulting from Ca2+ entry through voltage-gated (CaV) channels. It has been reported that the Rab3 effector RIM1 acts as a functional link between neuronal CaV channels and the machinery for exocytosis. Here, we investigated whether RIM1 regulates recombinant and native L-type CaV channels (that play a key role in hormone secretion) and whether this regulation affects insulin release. Whole-cell patch clamp currents were recorded from HEK-293 and insulinoma RIN-m5F cells. RIM1 and CaV channel expression was identified by RT-PCR and Western blot. RIM1-CaV channel interaction was determined by co-immunoprecipitation. Knockdown of RIM1 and CaV channel subunit expression were performed using small interference RNAs. Insulin release was assessed by ELISA. Co-expression of CaV1.2 and CaV1.3 L-type channels with RIM1 in HEK-293 cells revealed that RIM1 may not determine the availability of L-type CaV channels but decreases the rate of inactivation of the whole cell currents. Co-immunoprecipitation experiments showed association of the CaVβ auxiliary subunit with RIM1. The lack of CaVβ expression suppressed channel regulation by RIM1. Similar to the heterologous system, an increase of current inactivation was observed upon knockdown of endogenous RIM1. Co-immunoprecipitation showed association of CaVβ and RIM1 in insulin-secreting RIN-m5F cells. Knockdown of RIM1 notably impaired high K+-stimulated insulin secretion in the RIN-m5F cells. These data unveil a novel functional coupling between RIM1 and the L-type CaV channels via the CaVβ auxiliary subunit that contribute to determine insulin secretion.
Keywords: Calcium Channels, Calcium Transport, Exocytosis, Insulin Secretion, Ion Channels, RIM1, RIN-m5F Cells
Introduction
Release of insulin-containing vesicles by pancreatic β-cells is regulated by various intracellular signals, including Ca2+. Physiologically, glucose stimulation increases the [ATP]/[ADP] intracellular ratio that closes ATP-sensitive potassium (KATP) channels, thereby depolarizing β-cell plasma membrane. This process in turn activates plasma membrane voltage-gated (CaV) channels, allowing Ca2+ to enter the cell and trigger insulin exocytosis (1, 2).
CaV channels are classified according to their activation threshold as low voltage-activated or high voltage-activated. Based on pharmacological profiles, high voltage-activated channels can be divided into L-type and non-L-type channels, the latter including the N, P/Q, and R subtypes (3, 4). Neurotransmitter release is attributed to Ca2+ influx through P/Q-type (CaV2.1) and N-type (CaV2.2) channels, whereas L-type (CaV1.2 and CaV1.3) channels are considered to be responsible for hormone secretion (3). At the molecular level, CaV channels are oligomeric complexes of at least three proteins or subunits, the pore-forming (CaVα1) subunit and the auxiliary CaVα2δ and CaVβ subunits (3, 4).
Electrophysiological and molecular studies indicate that pancreatic β-cells express several subtypes of CaV channels. In particular, dihydropyridine-sensitive, L-type CaV channels are responsible for a significant portion of the high voltage-activated current (5, 6), and given that dihydropyridines potently suppress insulin secretion, L-channels are considered crucial for β-cell function (7). Of the four genes that encode CaVα1 subunits of L-channels, either CaV1.2 (formerly known as α1C), CaV1.3 (α1D), or both have been identified in rodent and human islets as well as in various β-cell lines, including the rat insulinoma RIN-m5F cells (6, 8). Although the relative expression levels of the two genes and their importance for insulin secretion remain uncertain, immunoprecipitation experiments suggests that CaV1.2 may represent ∼50% of the L-type channels in this cell line (8).
In vivo and in vitro studies have shown that pancreatic islets respond to increases in extracellular glucose with a biphasic pattern of insulin release. The first phase lasts a few minutes and reflects the release of a pool of granules in close proximity to L-type channels (9, 10). Two mechanisms possibly contribute to the second phase of insulin secretion: the replenishment of the immediately releasable pool from the reserve pool and exocytosis of granules located far from CaV channels due to widespread increases in cytosolic Ca2+ during depolarization. The latter mechanism also involves non-L-type channels. Last, studies in mice lacking CaV1.2 and CaV1.3 channels have corroborated that L-type channels are crucial for β-cell physiology (11, 12).
Interestingly, it has been found that different members of the RIM family (13–16), putative effectors of Rab3, and some associated proteins (17) may functionally link CaV channels to the machinery for exocytosis. Moreover, it has been reported that RIM1 modulates neuronal CaV2.1 channels through its interaction with the CaVβ subunit, modifying the inactivation rate for a sustained Ca2+ influx and anchoring neurotransmitter-containing vesicles in the vicinity of the channels (16). In contrast to these findings, no evidence has been reported for an N-type (CaV2.2) channel/RIM interaction at the presynaptic terminals using a chick calyx synapse preparation as well as in the heterologously expressed proteins in HEK293T cells (18, 19). These results argue against the hypothesis that RIM proteins may be critical for neuronal channel localization at the active zone. On the other hand, recent studies have shown also that RIM1 or RIM2 and RIM3 could indeed interact with native and recombinant mammalian N-type channels (20). Although the reason for this discrepancy is presently unknown, a model has emerged that could reconcile the conflicting results regarding the N- and P/Q-type channel/RIM interaction. In this model, RIM is part of a complex that tethers the synaptic vesicle to the channel, acting as a switch for a link between the channel and the synaptic vesicles that changes from high to low affinity states (19, 21).
In the present report, by using a strategy that combines patch clamp recordings with biochemical and molecular biology techniques, we provide evidence that RIM1 regulates recombinant L-type CaV channels (of the CaV1.2 and CaV1.3 class) heterologously expressed in HEK-293 cells as well as native L-channels expressed in rat insulinoma RIN-m5F cells and also show that this regulation results in a facilitation of insulin secretion. These data stress the importance of RIM1 as a regulatory constituent of the insulin secretory machinery.
EXPERIMENTAL PROCEDURES
Cell Culture
HEK-293 cells (ATCC) were grown in DMEM-high glucose medium supplemented with 10% horse serum, 2 mm l-glutamine, 110 mg/liter sodium pyruvate, 100 units/liter penicillin, and 100 μg/liter streptomycin. The rat insulin-producing RIN-m5F cells (ATCC) were grown in RPMI 1640 medium supplemented with 10% fetal bovine serum (FBS), 2 mm l-glutamine, 110 mg/liter sodium pyruvate, 100 units/liter penicillin, and 100 μg/liter streptomycin. Cell cultures were maintained at 37 °C in 5% CO2, 95% air humidified atmosphere.
Recombinant CaV Channel Expression and Electrophysiology
After splitting HEK-293 cells on the previous day and seeding at 60% confluence, cells were transfected using the Lipofectamine Plus reagent (Invitrogen) with 1.6 μg of each plasmid cDNA encoding L-type channel pore-forming subunit CaV1.2 (GenBankTM accession number X15539) or CaV1.3 (AF370009) with CaVβ2 (M80545) or CaVβ3 (M88751), and CaVα2δ-1 (M86621) in the presence or absence of RIM1 (NM_053270). For electrophysiology, 0.6 μg of a plasmid cDNA encoding the green fluorescent protein (Green-Lantern; Invitrogen) was added to the transfection mixture to identify and select transfected cells.
Electrophysiological recordings were performed according to the whole cell configuration of the patch clamp technique (22) at room temperature (22–24 °C) in a bathing solution containing 10 and 5 mm BaCl2 (for CaV1.2 and CaV1.3, respectively), 125 mm TEA-Cl, 10 mm HEPES, and 10 mm glucose (pH 7.3). Patch pipettes were filled with a solution containing 120 mm CsCl, 10 mm HEPES, 10 mm EGTA, 5 mm MgCl2, 4 mm ATP, and 0.1 mm GTP (pH 7.3). Ba2+ was used as the charge carrier instead of Ca2+ for the following reasons: (i) conductance for Ba2+ versus Ca2+ ions through high voltage-activated CaV channels is larger, thereby increasing the signal/noise ratio; (ii) it reinforces blockade of K+ currents; and (iii) rundown of the current is sometimes prominent, and the use of Ba2+ attenuates this problem. More importantly, when experiments were performed with external solutions containing Ca2+, cells exhibited a prominent Ca2+-activated component, which difficult a clear evaluation of the action of RIM1 on L-type CaV currents. This component was suppressed in external Ba2+ conditions. It is worth noting, however, that the effect of RIM1 on L-type currents is qualitatively similar in external Ba2+ and Ca2+ conditions (supplemental Fig. 1).
Recordings were made using an Axopatch 200B amplifier (Molecular Devices). Data acquisition and analysis were performed using pClamp10 software (Axon CNS) and Sigma Plot 11.0 (Systat Software Inc.) as described elsewhere (23, 24). Linear leak and parasitic capacitance components were subtracted on-line using a P/4 protocol. Membrane capacitance (Cm) was determined as described previously (25) and used to normalize currents.
Western Blots
Cells were detached from culture dishes, washed with phosphate-buffered saline (PBS; pH 7.4), and lysed in single-detergent lysis buffer (50 mm Tris-Cl, 150 mm NaCl, 1% Triton X-100, 0.5 mm phenylmethylsulfonyl fluoride (PMSF), and Complete 1×; Roche Applied Science). Protein concentration was determined using the bicinchoninic acid assay. Samples with 50 μg of protein were boiled for 5 min within protein loading buffer (1.7% SDS, 0.1 m 2-mercaptoethanol, 5% glycerol, 58 mm Tris-Cl, 0.002% bromphenol blue, pH 6.8). Proteins were resolved in 8–10% SDS-polyacrylamide gels and transferred to nitrocellulose membranes. After blocking with 5% nonfat dry milk in Tris-buffered saline Tween 20 (TBST; 100 mm Tris-Cl, 0.9% w/v NaCl, 0.2% Tween 20, pH 7.5), membranes were incubated overnight with primary antibodies anti-CaV1.2α1 and anti-CaV1.3α1 (Alomone Laboratories) used at a 1:200 dilution in blocking solution: anti-CaVβ2 (1:1000) (26), anti-CaVβ2 (1:500; Santa Cruz Biotechnology), or anti-CaVβ3 (1:1000) (27), anti-RIM (1:1000; BD Bioscience). Membranes were then washed and incubated with horseradish peroxidase-conjugated secondary antibodies diluted in TBST with 5% nonfat dry milk and developed with Western Lightning PLUS ECL (PerkinElmer Life Sciences). For semiquantitative analysis, membranes were stripped and incubated with a mouse monoclonal anti-actin antibody (1:200 in TBST). Densitometry analysis was carried out using the ImageJ version 1.43 program (National Institutes of Health).
Co-immunoprecipitation
Aliquots of protein (1–1.5 mg) from RIN-m5F or HEK-293 cells (transfected with the CaV channels and RIM1) were incubated for 4 h at 4 °C with 5 μg of anti-CaVβ2, anti-CaVβ3, or an irrelevant IgG0 (anti-Sp1 antibody, Santa Cruz Biotechnology, Inc.). Next, the complexes were incubated overnight with 20 μl of rProtein G-agarose (Invitrogen) at 4 °C. The immunoadsorbents were recovered by centrifugation (5 min at 13,000 rpm) and washed three times by resuspension and centrifugation (5 min at 13,000 rpm) with wash buffer (50 mm Tris-Cl, pH 8.0, 150 mm NaCl, 1 mm EDTA, 1% Triton X-100, 0.1% SDS 0.5 mm PMSF) and two times with PBS. Samples were eluted into 30 μl of protein loading buffer. Immunoprecipitated proteins were subjected to Western blotting using the anti-RIM antibody. The specificity of the antibodies was assessed by Western blot (supplemental Fig. 2).
RT-PCR
Total RNA was extracted from RIN-m5F cells by TRIzol reagent (Invitrogen). Reverse transcription was done with 5 μg of total RNA using the SuperScript III first strand system for RT-PCR (Invitrogen). The sequences of forward and reverse primers used for RIM1 amplification were 5′-GTTCAGTGATTTCCTTGATGGG-3′ and 5′-TTACTATGACCGGATGCAGGG-3′ (sense and antisense, respectively) (28). As a PCR control, β-actin was amplified using as a sense primer 5′-AAGATGACCCAGATCATGTT-3′ and antisense primer 5′-GAGTACTTGCGCTCAGGAGG-3′. The PCR was carried out in a total volume of 50 μl containing 5 μl of cDNA solution, 1× PCR buffer, 0.2 mm each deoxynucleotide triphosphate, 1.5 mm MgCl2, 0.5 μm each primer, and 2.5 units of Taq DNA polymerase on a Thermal Cycler (Thermo Scientific) for 25 cycles. Denaturation was carried out at 94 °C for 45 s, annealing at 55 °C for 30 s, and elongation at 75 °C for 1 min. PCRs were performed using Taq DNA polymerase (Invitrogen) with a 0.5 μm concentration of each primer.
RNA Interference in RIN-m5F Cells
The siRNA sequences 5′-CUCAGAUUAUGAGGUUGAU (dT) and 5′-AUCAACCUCAUAAUCUGAG (dT) for RIM1 were transfected in RIN-m5F cells using the N-TER nanoparticle transfection system (Sigma-Aldrich). A scramble sequence was used as a control. Cells transfected with a 40 or 50 nm concentration of each siRNA were subjected to electrophysiological recording and insulin secretion assays 48 h after transfection. Protein extracts of transfected cells were obtained to confirm RIM1 silencing by Western blotting.
Insulin Secretion Assays
RIN-m5F cells were washed twice with PBS and preincubated with Krebs-Ringer buffer (KRB; 25 mm HEPES, 115 mm NaCl, 24 mm NaHCO3, 5 mm KCl, 1 mm MgCl2, 2.5 mm CaCl2, 0.1% BSA) for 20 min at 37 °C in 5% CO2, 95% air humidified atmosphere. The preincubation buffer was removed and replaced with KRB buffer containing 40 mm KCl for 30 min at 37 °C. Insulin secretion was assayed by the enzyme-linked immunosorbent assay (ELISA) using the rat insulin high range ELISA kit (Alpco) according to the manufacturer's instructions.
Data Analyses
Statistical analyses were carried out using the SigmaPlot 11 software (Systat Software Inc.). The significance of observed differences was evaluated by Student's unpaired t test. A probability less that 5% was considered to be significant. All experimental values are given as means ± S.E. Curve fitting was performed as reported previously (29).
RESULTS
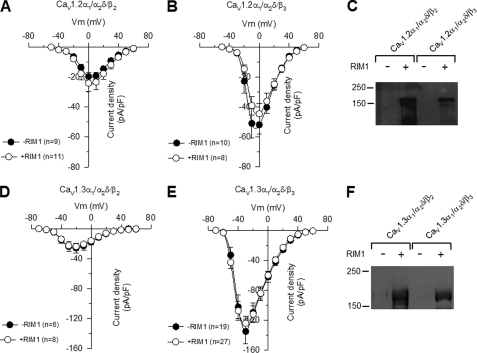
First, to investigate the coupling of the Rab3-interacting molecule 1 (RIM1) to L-type CaV channels and the functional consequences of this interaction, we examined the effects of RIM1 on whole cell currents through recombinant L-channels using the HEK-293 cell line, a heterologous expression system that does not express endogenous CaV channels (25, 30) (supplemental Fig. 3). Hence, CaV1.2α1 or CaV1.3α1 channels together with the CaVβ (β2 or β3) and the CaVα2δ-1 auxiliary subunits were co-transfected in HEK-293 cells in the absence or presence of RIM1 48 h before electrophysiological recordings. Fig. 1 shows the average current density-voltage relationships (peak current amplitude normalized by Cm) in response to 2-s membrane depolarizations from a holding potential (Vh) of −80 mV and with 10-mV incremental steps from −50 to +60 mV. As observed, no apparent differences in current densities were detected in the absence or presence of RIM1 (Table 1). It is worth noting that RIM1 expression in HEK-293 cells was confirmed after cDNA transfection by Western blot analyses (Fig. 1, C and F). Although RIM1 had no effect on the density and voltage dependence of the expressed currents, its co-expression profoundly affected current inactivation kinetics, as we shall discuss below.
FIGURE 1.
RIM1 does not modify current density through recombinant L-type CaV channels. Average current density-voltage relationships for IBa recorded from HEK-293 cells expressing CaV1.2α1/CaVα2δ-1/CaVβ (A and B) and CaV1.3α1/CaVα2δ-1/CaVβ (D and E) channels in the absence and presence of RIM1 as indicated. The number of recorded cells is shown in parenthesis. C and F, Western blotting with a RIM antibody on membranes from HEK-293 cells transfected with CaV1.2α1/CaVα2δ-1/CaVβ and CaV1.3α1/CaVα2δ-1/CaVβ, respectively. The examples shown are representative of three separate experiments. pF, picofarads; Error bars, S.E.
TABLE 1.
Effects of RIM1 on Cav1.2 and Cav1.3-mediated macroscopic currents
The indicated Cav channel subunits were co-expressed with RIM1 in HEK-293 cells, and the biophysical properties were determined using Ba2+ (5 or 10 mm) as charge carrier. τinact and V½ were obtained by fitting the data as described previously (29). Q was calculated by integration of the whole cell Cav channel-mediated currents. pF, picofarads; pC, picocoulombs.
| Channel composition | Imax | τinact | Irem | Q | V½ inact |
|---|---|---|---|---|---|
| pA/pF | ms | % | pC | mV | |
| Cav1.2α1/α2δ | −6.4 ± 1.2 | 698.6 ± 96.0 | 46.2 ± 6.5 | ||
| Cav1.2α1/α2δ + RIM1 | −5.1 ± 0.9 | 582.3 ± 54.4 | 41.5 ± 3.8 | ||
| Cav1.3α1/α2δ | −6.0 ± 1.4 | 1085.2 ± 269.9 | 46.2 ± 6.5 | ||
| Cav1.3α1/α2δ + RIM1 | −8.0 ± 2.5 | 1093.8 ± 376.1 | 41.5 ± 3.8 | ||
| Cav1.2α1/α2δ/β2 | −18.7 ± 1.5 | 800.5 ± 58.9 | 45.7 ± 2.5 | 354.2 ± 41.7 | −25.7 ± 2.4 (n = 6) |
| Cav1.2α1/α2δ/β2 + RIM1 | −21.6 ± 2.9 | 1143.1 ± 131.8a | 57.6 ± 4.1a | 602.7 ± 100.8a | −26.3 ± 1.7 (n = 6) |
| Cav1.3α1/α2δ/β2 | −27.4 ± 4.7 | 788.4 ± 185.0 | 50.7 ± 3.7 | 458.8 ± 107.0 | −53.8 ± 3.7 (n = 5) |
| Cav1.3α1/α2δ/β2 + RIM1 | −25.3 ± 3.1 | 2351.2 ± 614.7a | 70.8 ± 3.9a | 791.9 ± 95.1a | −40.1 ± 1.8a (n = 6) |
| Cav1.2α1/α2δ/β3 | −56.1 ± 8.4 | 240.2 ± 20.0 | 5.2 ± 0.8 | 302.0 ± 36.6 | −34.6 ± 1.6 (n = 4) |
| Cav1.2α1/α2δ/β3 + RIM1 | −49.4 ± 5.2 | 425.6 ± 59.3a | 22.9 ± 5.7a | 515.7 ± 92.7a | −35.6 ± 1.8 (n = 5) |
| Cav1.3α1/α2δ/β3 | −158.7 ± 16.5 | 475.3 ± 43.1 | 12.8 ± 2.0 | 1276.8 ± 136.0 | −54.4 ± 0.4 (n = 4) |
| Cav1.3α1/α2δ/β3 + RIM1 | −129.3 ± 11.4 | 643.9 ± 57.4a | 19.5 ± 1.7a | 1785.3 ± 167.3a | −56.6 ± 1.5 (n = 6) |
a p < 0.05.
RIM1 Alters L-type CaV Channel Inactivation and Increases Charge Transfer into Cells
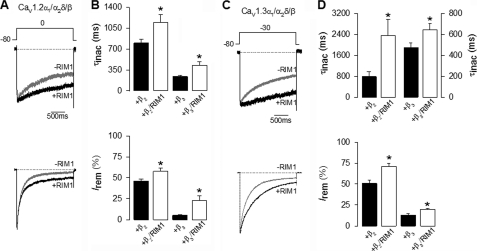
Fig. 2A compares representative whole cell current traces obtained in control conditions and in the presence of RIM1. As shown, HEK-293 cells co-transfected with CaV1.2α1, CaVα2δ-1, and CaVβ2 produced robust macroscopic Ba2+ current (IBa) through recombinant CaV channels. Likewise, as expected from previous results, peak current amplitude was increased, and inactivation kinetics fastened by expression of the CaVβ3 auxiliary subunit (Fig. 2A, bottom). Notably, IBa through CaV1.2 channels decayed with a significantly slower time course in RIM1-expressing cells than in the controls. The L-channel inactivation rate was quantitatively compared between RIM1-expressing cells and control cells by fitting L-current traces with single exponential functions. The time constant for CaV1.2 currents was ∼1.5–2-fold slower in the presence of RIM1 (Fig. 2B, top). The parameters from the best fits are given in Table 1. As a consequence, the percentage of current inactivated at the end of the pulse with respect to the peak current amplitude (I remaining) was significantly larger in the RIM1-transfected cells when compared with cells not expressing RIM1 (Fig. 2B, bottom). These effects of RIM1 were also observed in cells expressing CaV1.3 channels (Fig. 2, C and D, and Table 1).
FIGURE 2.
RIM1 changes the inactivation kinetics of recombinant L-type CaV channels. A, representative whole cell currents recorded in HEK-293 cells expressing CaV1.2α1/CaVα2δ-1 channels, with CaVβ2 (upper traces) or CaVβ3 (lower traces) in the absence and presence (black and gray traces, respectively) of RIM1. Peak amplitude of the currents before and after RIM1 co-expression was normalized for comparison. Currents were elicited by 2-s depolarizing pulses from a Vh of −80 to 0 mV. B, comparison of time constant of inactivation (top) and percentage of current remaining at the end of the 2-s voltage step (Irem) in cells expressing CaV1.2α1/CaVα2δ-1/CaVβ channels in the absence (solid bars) or presence (open bars) of RIM1. C, representative current traces recorded in HEK-293 cells expressing CaV1.3α1/CaVα2δ-1 channels together with CaVβ2 or CaVβ3 in the absence and presence of RIM1 (as in A). Currents were evoked by 2-s depolarizing pulses from a Vh of −80 to −30 mV. D, comparison of time constant of inactivation (top) and percentage of current remaining at the end of the voltage step in cells expressing CaV1.3α1/CaVα2δ-1/CaVβ channels in the absence or presence of RIM1 (as in B). *, significant differences (p < 0.05) compared with control without RIM1. Error bars, S.E.
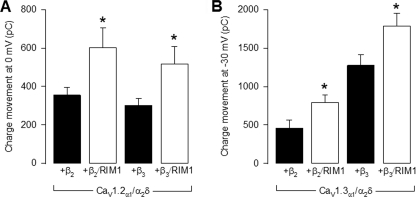
To investigate the functional significance of the L-type CaV channels-RIM1 coupling in more detail, we next calculated the amount of charge mobilized (i.e. the number of ions that passed through the channels) during depolarization (Fig. 3). By integrating the whole cell current transients elicited by depolarizing commands to 0 from a Vh of −80 mV, a net entry of ∼354 ± 42 picocoulombs of charge was estimated in control cells expressing CaV1.2 channels. In the RIM1-expressing cells, digital integration of the currents through CaV1.2α1/CaVα2δ-1/CaVβ2 channels during the imposed depolarization yielded a value of ∼603 ± 101 picocoulombs, corresponding to a 1.7-fold increase in charge entry (Fig. 3A). In a similar manner, the average charge transfer was significantly increased by RIM1 from a value of ∼458 ± 107 to 791 ± 95 picocoulombs in cells expressing CaV1.3α1/CaVα2δ-1/CaVβ2 channels (Fig. 3B). When CaVβ3 was co-transfected, qualitatively similar results were obtained for both CaV1.2- and CaV1.3-containing channels after RIM1 expression (Fig. 3, A and B, and Table 1).
FIGURE 3.
RIM1 increases charge transfer into HEK-293 cells. A, comparison of total charge transfer (maximum current integrated over time) in HEK-293 cells expressing CaV1.2α1/CaVα2δ-1 channels with CaVβ2 or CaVβ3 in the absence (solid bars) and presence (open bars) of RIM1. Currents were elicited by 2-s depolarizing pulses from a Vh of −80 to 0 mV. B, comparison of total charge movement in HEK-293 cells expressing CaV1.3α1/CaVα2δ-1 channels with CaVβ2 or CaVβ3 in the absence and presence of RIM1 (as in A). Currents were elicited by 2-s depolarizing pulses from a Vh of −80 mV to −30 mV. *, significant differences (p < 0.05) compared with control without RIM1. Error bars, S.E.
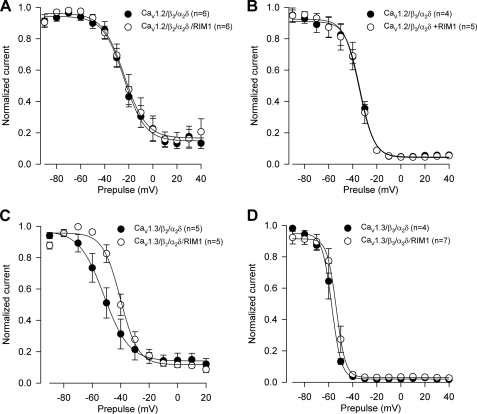
To study whether RIM1 had an effect on L-type channel availability, the voltage dependence of inactivation was evaluated using 10-s prepulse depolarizations from −90 to +40 mV, preceding a 140-ms test potential to 0 mV or −30 mV (for the CaV1.2α1- and CaV1.3α1-containing channels, respectively). Normalized current amplitudes were compiled for 4–7 cells and plotted against the prepulse voltage, and mean data points were well described by a sigmoid equation. Fits to the mean inactivation data points and the parameters from the best fits are given in Fig. 4 and Table 1. Interestingly, co-expression with RIM1 shifted V½ to the right about 10 mV for CaV1.3/CaVα2δ-1/CaVβ2 channels. In contrast, the V½ value was not significantly altered by RIM1 expression in CaV1.3/CaVα2δ-1/CaVβ3 and CaV1.2α1/CaVα2δ-1/CaVβ channels (Table 1). These results suggest that RIM1 affects mainly the rate of channel inactivation and has a minor impact on the inactivation of the channels at steady state. Therefore, we speculate that RIM1 has an important role in the transition rates between inactivation states while having less impact in the availability of the channels. However, given that RIM1 expression induces a shift in the inactivation curve of the currents through CaV1.3/CaVα2δ-1/CaVβ2, the possibility exists that the RIM1 effects may depend on channel subunit composition.
FIGURE 4.
Voltage dependence of inactivation for macroscopic currents through CaV1. 2α1- and CaV1.3α1-containing channels in the absence and presence of RIM1. Currents were elicited by a 10-s conditioning pulse from a Vh of −80 mV in 10-mV steps from −90 to +40 mV, followed by a test pulse to 0 or −30 mV for CaV1.2α1-containing (A and C) and CaV1.3α1-containing channel currents (B and D), respectively. The individual data points are means of 4–7 experiments. Error bars, S.E. The solid lines reflect fits via a sigmoid equation (the relevant parameters are given in Table 1).
The Lack of CaVβ Prevents the Effects of RIM1 on Recombinant L-type Channels
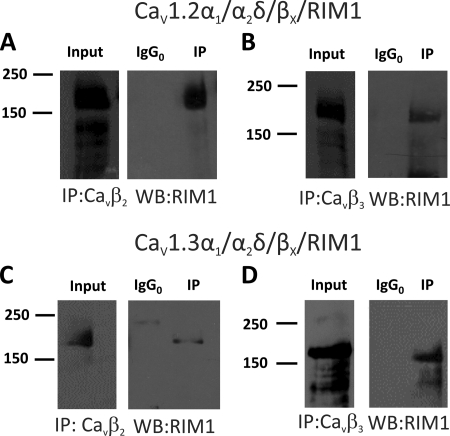
Seminal work by Kiyonaka et al. (16) established that RIM1 associates with different neuronal voltage-gated Ca2+ channels (CaV2.1 and CaV2.2) via interactions with the CaVβ subunit. In order to determine whether this mechanism is also valid for recombinant L-type channels (CaV1.2 and CaV1.3), a series of experiments using CaVβ2 and CaVβ3 antibodies were performed to study whether RIM1 could be immunoprecipitated in samples from transfected HEK-293 cells (Fig. 5). In these experiments, negative controls were obtained with anti-Sp1 antibodies. As shown in Fig. 5, A and B, immunoprecipitation with CaVβ2 antibodies results in a band between the size markers of 150 and 250 kDa (expected size 178 kDa) in both CaV1.2 and CaV1.3 channels. Similarly, using CaVβ3 antibodies, RIM1 could be immunoprecipitated in HEK-293 cells expressing CaV1.2 and CaV1.3 channels (Fig. 5, C and D). In all cases, the negative control (IgG0) did not co-precipitate with RIM1. These data provide direct evidence that expression of CaV1.2α1 or CaV1.3α1 does not hinder the formation of a complex between the CaVβ subunits and RIM1.
FIGURE 5.
RIM1 interacts with CaVβ subunits in HEK-293 cells. Proteins from HEK-293 cells co-transfected with CaV1.2α1/CaVα2δ-1 together with the CaVβ2 or CaVβ3 subunits were immunoprecipitated with anti-CaVβ2 (A), anti-CaVβ3 (B), or control (IgG0) antibodies and subjected to Western blot analysis with anti-RIM antibody. The ∼180-kDa RIM1 band is visualized in the immunoprecipitation (IP) lane. Likewise, proteins from HEK-293 cells co-transfected with CaV1.3α1/CaVα2δ-1 together with the CaVβ2 or CaVβ3 subunits were immunoprecipitated with the anti-CaVβ2 (C), anti-CaVβ3 (D), or control antibodies and applied to Western blots. Staining the immunoprecipitates with the RIM1 antibody identified the ∼180 kDa RIM1 band. In all cases, control experiments with the irrelevant antibody as a substitute for the anti-CaVβ antibodies failed to co-immunoprecipitate RIM1. The examples shown are representative of three separate experiments. In all cases, data were collected from the same experiment, and the images are shown separately because they were acquired with different time exposures.
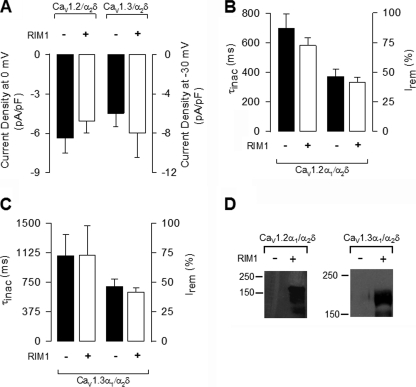
In order to confirm that the functional effects of RIM1 on L-type channels occur through its interaction with the CaVβ subunit, we characterized its effects on whole cell Ba2+ currents through recombinant CaV1.2 and CaV1.3 channels expressed in HEK-293 cells in the absence of CaVβ. Fig. 6 shows that, as expected, RIM1 expression did not result in appreciable changes in current density recorded by applying depolarizing pulses to 0 and −30 mV for CaV1.2α1- and CaV1.3α1-containing channels, respectively (Fig. 6A and Table 1). More importantly, co-expression of RIM1 did not affect inactivation kinetics of the L-type currents arising from recombinant CaV1.2 and CaV1.3 channels in the absence of the CaVβ subunit (Fig. 6, B and C, and Table 1). In these experiments, RIM1 expression was confirmed after cDNA transfection by Western blot analysis (Fig. 6D). Taken together, these results confirm the role of the CaVβ auxiliary subunit in structurally and functionally coupling RIM1 to L-type CaV channel complexes.
FIGURE 6.
The lack of CaVβ prevents the effects of RIM1 on recombinant L-type channels. A, averaged peak L-type current density recorded from HEK-293 cells co-transfected with CaV1.2α1/CaVα2δ-1 (without CaVβ) in the absence (solid bars) or presence of RIM1 (open bars). The peak amplitudes before and after co-expression of RIM1 were normalized for Cm. Ba2+ currents were elicited by 2-s pulses to 0 mV from a Vh of −80 mV for the CaV1.2 channel currents and to −30 mV in the case of the CaV1.3 channel currents. B and C, comparison of time constants of inactivation (left) and percentages of Irem (right) in cells expressing CaV1.2α1/CaVα2δ-1 channels and CaV1.3α1/CaVα2δ-1, respectively, in the absence (solid bars) or presence (open bars) of RIM1 (n = 16–25 cells). Shown is Western blot analysis of proteins from HEK-293 cells co-transfected with CaV1.2α1/CaVα2δ-1 with (+) or without (−) RIM1 using an anti-RIM antibody. The examples shown are representative of three separate experiments. Error bars, S.E.
RIM1 Regulates Native L-type CaV Channel Activity
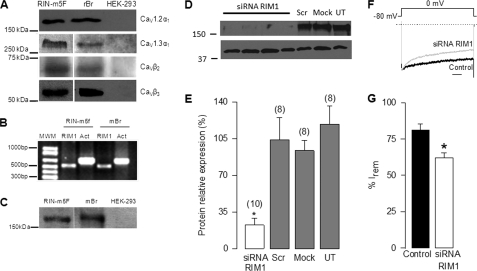
Once we established the regulation of recombinant L-type CaV channels by RIM1, we checked whether native channels were also regulated by RIM1 using the rat insulinoma RIN-m5F cell line as a model. To this end, RT-PCR and immunoblotting were first used as methods to analyze the expression of RIM1 and different subunits that compose the L-type channel complex. By using antibodies, conspicuous signals were consistently observed in the RIN-m5F cells for CaV1.2α1, CaV1.3α1, CaVβ2, and CaVβ3 subunits in Western blot experiments (Fig. 7A). Likewise, using specific primers, an expected cDNA fragment of 512 bp for RIM1 was amplified from RIN-m5F cells and from mouse brain used as control tissue (Fig. 7B). The expression of RIM1 was confirmed by Western blot analyses (Fig. 7C). The possible interaction between RIM1 and the L-type channels was then studied by both co-immunoprecipitation and knockdown of RIM1 using specific siRNAs.
FIGURE 7.
RIM1 knockdown alters inactivation of native Ca2+ currents in RIN-m5F cells. A, representative Western blots showing CaV1.2α1, CaV1.3α1, CaVβ2, and CaVβ3 channel subunit expression in rat insulinoma RIN-m5F cells as listed. Protein extracts of rat brain (rBr) and untransfected HEK-293 cells were used as respective positive and negative controls. B, RT-PCR analysis of RIM1 cDNA expression in RIN-m5F cells. Total RNA from the whole brain was used as a positive control. Actin (Act) was used as an internal control. Primer sequences are indicated under “Experimental Procedures.” C, representative Western blots showing RIM1 expression in RIN-m5F cells. Protein extracts of mouse brain (mBr) and untransfected HEK-293 cells were used as positive and negative controls, respectively. D, semiquantitative Western blot analysis from whole cell homogenate using a RIM antibody. RIN-m5F cells were incubated with siRNA targeting RIM1 for 48 h. Cells either transfected with scrambled siRNA (Scr) or mock-transfected with the transfection buffer alone (Mock) as well as untransfected (UT) serve as controls. E, Western blot showing the effect of siRNA on RIM1 protein expression. Data correspond to the average of 8–10 measurements. F, representative normalized traces of IBa in RIN-m5F cells in the control condition and after RIM1 knockdown. Scale bar, 250 ms. G, comparison of inactivation in control cells and cells incubated with the RIM1 siRNA. Inactivation of whole cell currents recorded in the RIN-m5F cells was estimated from the percentage of current remaining after 2-s pulses from a Vh of −80 to −30 mV (n = 12–18 cells).
First, to evaluate the siRNA silencing efficiency, RIM1 expression was determined by semiquantitative analysis of Western blots. Fig. 7D shows that the RIM1 expression level in RIN-m5F cells transfected with the RIM1 siRNA was significantly lower than those with scrambled siRNA control, whereas the actin expression levels remained essentially unchanged. Semiquantitative analysis indicates that siRNA decreased the levels of RIM1 to ∼20% of the levels observed in cells transfected with the control siRNA (Fig. 7E). Altogether, these data indicate that RIN-m5F cells express RIM1 and that RIM1 levels can be successfully down-regulated by RNA silencing.
In agreement with the results obtained with the heterologous expression system, we found that silencing endogenous RIM1 expression with siRNAs increases the extent of inactivation of whole cell native currents. Examples of normalized IBa traces elicited in RIN-m5F cells by 2-s depolarizing pulses from a Vh of −80 to 0 mV in the control condition and after knocking down RIM1 are shown in Fig. 7F. As noted, comparison of normalized superimposed records shows that currents from RIM1 knockdown cells inactivate more rapidly than those from control cells. The extent of inactivation defined by the I remaining decreased ∼25% in the RIM1 knockdown cells (Fig. 7G).
RIM1 Associates with L-type Channels in RIN-m5F Cells and Regulates Insulin Secretion
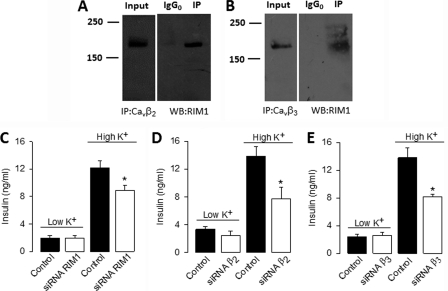
Using antibodies against CaVβ2 and CaVβ3, RIM1 could be co-immunoprecipitated in samples from RIN-m5F cells. Negative controls were obtained with Sp1 antibodies. Hence, probing of RIM1 immunoprecipitated with anti-CaVβ2 (Fig. 8A) and CaVβ3 (Fig. 8B) antibodies revealed a band of ∼180 kDa in the co-immunoprecipitated sample lane but not in the IgG0 control lane, indicative of the specificity of the immunoprecipitation.
FIGURE 8.
RIM1 interacts with native L-type channels through the CaVβ subunit and contributes to determine insulin secretion. A and B, proteins from RIN-m5F cells were immunoprecipitated with anti-CaVβ2, anti-CaVβ3, or control (IgG0) antibodies and subjected to Western blot analysis with anti-RIM antibody. The ∼180 kDa RIM1 band is visualized in the immunoprecipitation (IP) lane. In both cases, control experiments with the irrelevant antibody as a substitute for the anti-CaVβ antibodies failed to co-immunoprecipitate RIM1. Immunoprecipitation data were collected from the same experiment, and the images are shown separately because they were acquired with different time exposures. C–E, basal and high K+-induced insulin secretion from RIN-m5F cells after transfection with RIM1- and CaVβ-targeted siRNA compared with control (non-transfected) cells. RIN-m5F cells were transfected with RIM1 siRNA (open bars) and 48 h later incubated with KRB buffer containing 5 mm (low K+) or 40 mm (high K+) KCl. Insulin content in the supernatants was measured by ELISA as described under “Experimental Procedures.” The mean ± S.E. of three independent experiments is displayed.
Last, we investigated the physiological relevance of the RIM1 coupling to the L-type CaV channels by assessing insulin release from RIN-m5F cells in control conditions and after transfection with RIM1 siRNA. Basal insulin release to the culture medium remained unchanged in non-stimulated cells (Fig. 8C). In contrast, insulin release triggered by Ca2+ influx in response to high K+-induced membrane depolarization (extracellular K+ concentration was increased from 5 to 40 mm for 30 min) was significantly decreased (∼25%) in RIM1 knockdown cultures (Fig. 8C). Likewise, insulin release triggered by depolarization with high K+ was also significantly decreased by siRNAs specific to the CaVβ2 and CaVβ3 subunits (Fig. 8, D and E). Altogether, these data demonstrate the importance of L-type channel regulation by RIM1 for fine tuning insulin release.
DISCUSSION
The present study reveals that the coupling between RIM1 and the CaVβ auxiliary subunits is also operational in L-type CaV channels. This interaction decelerates L-type current inactivation, producing a sustained depolarization-induced Ca2+ influx in insulin-secreting cells that favors hormone release. RIM1 is a putative effector of Rab3 that associates selectively with the active form of the GTPase (31). RIM1 contains an N-terminal domain that interacts with Rab3 and two C2 domains located at the C terminus. Although mainly expressed in the brain, RIM1 is also expressed in pancreatic β-cells, where it is involved in insulin release (28). In line with this, we found that RIM1 expression significantly increased charge transfer into HEK-293 cells by slowing down the inactivation kinetics of L-type CaV1.2 and CaV1.3 channels. Likewise, our results show that siRNA-mediated RIM1 knockdown in RIN-m5F cells significantly affected L-type current inactivation and reduced insulin release triggered by depolarization with high K+. Together, these results suggest that RIM1 might play a role in docking the Rab3-bound vesicles near CaV channels, functionally coupling channel activity to the exocytotic machinery in insulin-secreting cells.
Likewise, by searching for possible binding partners of the RIM proteins, initial studies found that the C2A domain mediated the interaction of RIM1 with some synaptic proteins as well as with the pore-forming subunit of neuronal CaV1.2 channel (13). It has also been reported that the mouse RIM1 arginine-to-histidine substitution (R655H), which corresponds to the human autosomal dominant cone-rod dystrophy mutation, modifies RIM1 function in regulating L-type CaV1.4 channels of the retina (32) and that the II-III loop of the CaV1.2α1 subunit binds directly to the C2A domain of RIM2 in the INS-1 cells (14) for lipid raft targeting of the channels (15). Last, RIM proteins expressed in cochlear inner hair cells seem to be capable of modulating L-type CaV1.3 channel function (33). Although this identifies RIM proteins as scaffolding proteins with a role in maintaining a high CaV channel density at active zones, they have not yet attained general acceptance as critical tethering molecules. Wong and Stanley (19) found that co-immunostaining with RIM and anti-CaV2.2 antibodies neither co-localized nor co-varied at the transmitter release face and that the two proteins did not co-immunoprecipitate.
It should be noted, however, that parallel studies by Han et al. (34) and Kaeser et al. (35) have reported more recently an important role for RIM proteins in localizing CaV channels to active zones. Based on protein/protein interaction studies, generation of conditional KO mice, electrophysiological recordings, Ca2+ imaging, and quantitative immunofluorescence, these authors propose that the PDZ domains of RIM proteins stoichiometrically interact with CaV2 channels in vitro and that RIM proteins, by interacting directly through their PDZ domains with the CaVα1 subunits, are essential for tethering CaV channels to presynaptic terminals in vivo. This interaction speeds the rate of transmitter release by increasing the intrinsic Ca2+ sensitivity of release as well as by contributing to the tight co-localization of readily releasable vesicles with neuronal CaV channels (34, 35).
Similarly, recent studies by Mori and colleagues (16, 20) have documented a functional coupling of RIM1 with neuronal CaV channels mediated by its physical association with the CaVβ auxiliary subunit via the C2B domain at the C terminus region. This interaction significantly suppressed voltage-dependent channel inactivation (16, 20, 36), enhancing membrane docking of vesicles and potentiating neurotransmitter release (16, 20). Likewise, different RIMs have been shown to physically associate with CaVβ decelerating current inactivation, increasing depolarization-induced Ca2+ entry and enhancing neurotransmitter release (20). Interestingly, the results of our co-immunoprecipitation experiments have identified a RIM1-CaV channel complex formed by direct interaction of the CaVβ2 and CaVβ3 subunits with RIM1 heterologously expressed in HEK-293 cells. The identification of native RIM1-CaV channel complexes in RIN-m5F cells and the effect of the RIM1 knockdown on insulin release support a physiological role for the RIM1-CaVβ subunit interaction. In this context, it is well known that the CaVβ subunit interacts with the pore-forming CaVα1 subunit from the cytoplasmic side to enhance functional channel trafficking to the plasma membrane and to modify multiple kinetic properties (34, 37). In particular, functional studies have shown that the CaVβ subunit is a key determinant in CaV channel inactivation (38). For many types of high voltage-activated CaV channels, co-expression with CaVβ tends to increase the rate of inactivation (30, 39, 40). Therefore, the possibility exists that RIM1 may act on the CaVβ subunits to suppress the regulatory function of this auxiliary subunit on L-type CaV inactivation. As a consequence, association with CaVβ may enable RIM1 to play an important physiological role in hormone release. Decreased L-channel inactivation by RIM1 interaction implies that a substantially larger Ca2+ current would be maintained during depolarization facilitating insulin release.
Supplementary Material
Acknowledgments
We thank Dr. Kevin P. Campbell (University of Iowa) and Dr. Manuel Hernandez (Cinvestav-IPN, Mexico) for the generous gifts of CaV channels and α-actin antibodies, respectively.
Footnotes
This work was supported in part by grants from Consejo Nacional de Ciencia y Tenología (Conacyt, Mexico) (to R. F.) and from PAPIIT-UNAM (Grant IN210708) (to A. S.). This work was also supported by doctoral and postdoctoral fellowships from Conacyt and Instituto de Ciencia y Tecnología del Distrito Federal (ICyTDF, Mexico) (to M. G. and R. G.-R., respectively).

The on-line version of this article (available at http://www.jbc.org) contains supplemental Figs. 1–3.
REFERENCES
- 1. Yang S. N., Berggren P. O. (2006) Endocr. Rev. 27, 621–676 [DOI] [PubMed] [Google Scholar]
- 2. Hiriart M., Aguilar-Bryan L. (2008) Am. J. Physiol. Endocrinol Metab. 295, E1298–E1306 [DOI] [PubMed] [Google Scholar]
- 3. Catterall W. A., Perez-Reyes E., Snutch T. P., Striessnig J. (2005) Pharmacol Rev. 57, 411–425 [DOI] [PubMed] [Google Scholar]
- 4. Felix R. (2005) J. Recept. Signal. Transduct. Res. 25, 57–71 [DOI] [PubMed] [Google Scholar]
- 5. Ashcroft F. M., Rorsman P. (1989) Prog. Biophys. Mol. Biol. 54, 87–143 [DOI] [PubMed] [Google Scholar]
- 6. Mears D. (2004) J. Membr Biol. 200, 57–66 [DOI] [PubMed] [Google Scholar]
- 7. Satin L. S., Tavalin S. J., Kinard T. A., Teague J. (1995) Endocrinology 136, 4589–4601 [DOI] [PubMed] [Google Scholar]
- 8. Safayhi H., Haase H., Kramer U., Bihlmayer A., Roenfeldt M., Ammon H. P., Froschmayr M., Cassidy T. N., Morano I., Ahlijanian M. K., Striessnig J. (1997) Mol. Endocrinol. 11, 619–629 [DOI] [PubMed] [Google Scholar]
- 9. Wiser O., Bennett M. K., Atlas D. (1996) EMBO. J. 15, 4100–4110 [PMC free article] [PubMed] [Google Scholar]
- 10. Wiser O., Trus M., Hernández A., Renström E., Barg S., Rorsman P., Atlas D. (1999) Proc. Natl. Acad. Sci. U.S.A. 96, 248–253 [DOI] [PMC free article] [PubMed] [Google Scholar]
- 11. Namkung Y., Skrypnyk N., Jeong M. J., Lee T., Lee M. S., Kim H. L., Chin H., Suh P. G., Kim S. S., Shin H. S. (2001) J. Clin. Invest. 108, 1015–1022 [DOI] [PMC free article] [PubMed] [Google Scholar]
- 12. Schulla V., Renström E., Feil R., Feil S., Franklin I., Gjinovci A., Jing X. J., Laux D., Lundquist I., Magnuson M. A., Obermüller S., Olofsson C. S., Salehi A., Wendt A., Klugbauer N., Wollheim C. B., Rorsman P., Hofmann F. (2003) EMBO J. 22, 3844–3854 [DOI] [PMC free article] [PubMed] [Google Scholar]
- 13. Coppola T., Magnin-Luthi S., Perret-Menoud V., Gattesco S., Schiavo G., Regazzi R. (2001) J. Biol. Chem. 276, 32756–32762 [DOI] [PubMed] [Google Scholar]
- 14. Shibasaki T., Sunaga Y., Fujimoto K., Kashima Y., Seino S. (2004) J. Biol. Chem. 279, 7956–7961 [DOI] [PubMed] [Google Scholar]
- 15. Jacobo S. M., Guerra M. L., Jarrard R. E., Przybyla J. A., Liu G., Watts V. J., Hockerman G. H. (2009) J. Pharmacol. Exp. Ther. 330, 283–293 [DOI] [PMC free article] [PubMed] [Google Scholar]
- 16. Kiyonaka S., Wakamori M., Miki T., Uriu Y., Nonaka M., Bito H., Beedle A. M., Mori E., Hara Y., De Waard M., Kanagawa M., Itakura M., Takahashi M., Campbell K. P., Mori Y. (2007) Nat. Neurosci. 10, 691–701 [DOI] [PMC free article] [PubMed] [Google Scholar]
- 17. Hibino H., Pironkova R., Onwumere O., Vologodskaia M., Hudspeth A. J., Lesage F. (2002) Neuron 34, 411–423 [DOI] [PMC free article] [PubMed] [Google Scholar]
- 18. Khanna R., Li Q., Sun L., Collins T. J., Stanley E. F. (2006) Neuroscience 140, 1201–1208 [DOI] [PubMed] [Google Scholar]
- 19. Wong F. K., Stanley E. F. (2010) J. Neurochem. 112, 463–473 [DOI] [PubMed] [Google Scholar]
- 20. Uriu Y., Kiyonaka S., Miki T., Yagi M., Akiyama S., Mori E., Nakao A., Beedle A. M., Campbell K. P., Wakamori M., Mori Y. (2010) J. Biol. Chem. 285, 21750–21767 [DOI] [PMC free article] [PubMed] [Google Scholar]
- 21. Stanley E. F., Reese T. S., Wang G. Z. (2003) Eur. J. Neurosci. 18, 2403–2407 [DOI] [PubMed] [Google Scholar]
- 22. Hamill O. P., Marty A., Neher E., Sakmann B., Sigworth F. J. (1981) Pflugers Arch. 391, 85–100 [DOI] [PubMed] [Google Scholar]
- 23. Sandoval A., Andrade A., Beedle A. M., Campbell K. P., Felix R. (2007) J. Neurosci. 27, 3317–3327 [DOI] [PMC free article] [PubMed] [Google Scholar]
- 24. Sandoval A., Arikkath J., Monjaraz E., Campbell K. P., Felix R. (2007) Cell. Mol. Neurobiol. 27, 901–908 [DOI] [PMC free article] [PubMed] [Google Scholar]
- 25. Avila G., Sandoval A., Felix R. (2004) Cell. Mol. Neurobiol. 24, 317–330 [DOI] [PMC free article] [PubMed] [Google Scholar]
- 26. Liu H., Felix R., Gurnett C. A., De Waard M., Witcher D. R., Campbell K. P. (1996) J. Neurosci. 16, 7557–7565 [DOI] [PMC free article] [PubMed] [Google Scholar]
- 27. Scott V. E., De Waard M., Liu H., Gurnett C. A., Venzke D. P., Lennon V. A., Campbell K. P. (1996) J. Biol. Chem. 271, 3207–3212 [DOI] [PubMed] [Google Scholar]
- 28. Iezzi M., Regazzi R., Wollheim C. B. (2000) FEBS Lett. 474, 66–70 [DOI] [PubMed] [Google Scholar]
- 29. Andrade A., Sandoval A., González-Ramírez R., Lipscombe D., Campbell K. P., Felix R. (2009) Cell. Calcium 46, 282–292 [DOI] [PMC free article] [PubMed] [Google Scholar]
- 30. Yasuda T., Chen L., Barr W., McRory J. E., Lewis R. J., Adams D. J., Zamponi G. W. (2004) Eur. J. Neurosci. 20, 1–13 [DOI] [PubMed] [Google Scholar]
- 31. Wang Y., Okamoto M., Schmitz F., Hofmann K., Südhof T. C. (1997) Nature 388, 593–598 [DOI] [PubMed] [Google Scholar]
- 32. Miki T., Kiyonaka S., Uriu Y., De Waard M., Wakamori M., Beedle A. M., Campbell K. P., Mori Y. (2007) Channels 1, 144–147 [DOI] [PMC free article] [PubMed] [Google Scholar]
- 33. Gebhart M., Juhasz-Vedres G., Zuccotti A., Brandt N., Engel J., Trockenbacher A., Kaur G., Obermair G. J., Knipper M., Koschak A., Striessnig J. (2010) Mol. Cell. Neurosci. 44, 246–259 [DOI] [PubMed] [Google Scholar]
- 34. Han Y., Kaeser P. S., Südhof T. C., Schneggenburger R. (2011) Neuron 69, 304–316 [DOI] [PMC free article] [PubMed] [Google Scholar]
- 35. Kaeser P. S., Deng L., Wang Y., Dulubova I., Liu X., Rizo J., Südhof T. C. (2011) Cell 144, 282–295 [DOI] [PMC free article] [PubMed] [Google Scholar]
- 36. Karunasekara Y., Dulhunty A. F., Casarotto M. G. (2009) Eur. Biophys. J. 39, 75–81 [DOI] [PubMed] [Google Scholar]
- 37. Walker D., De Waard M. (1998) Trends Neurosci. 21, 148–154 [DOI] [PubMed] [Google Scholar]
- 38. Hering S., Berjukow S., Sokolov S., Marksteiner R., Weiss R. G., Kraus R., Timin E. N. (2000) J. Physiol. 528, 237–249 [DOI] [PMC free article] [PubMed] [Google Scholar]
- 39. Lacerda A. E., Kim H. S., Ruth P., Perez-Reyes E., Flockerzi V., Hofmann F., Birnbaumer L., Brown A. M. (1991) Nature 352, 527–530 [DOI] [PubMed] [Google Scholar]
- 40. Varadi G., Lory P., Schultz D., Varadi M., Schwartz A. (1991) Nature 352, 159–162 [DOI] [PubMed] [Google Scholar]
Associated Data
This section collects any data citations, data availability statements, or supplementary materials included in this article.


