Abstract
We study the mixture of extended and supercoiled DNA that occurs in a twisted DNA molecule under tension. Closed-form asymptotic solutions for the supercoiling radius, extension and torque of the molecule are obtained in the high-force limit where electrostatic and elastic effects dominate. We demonstrate that experimental data obey the extension and torque scaling laws apparent in our formulae, in the regime where thermal fluctuation effects are quenched by applied force.
Experiments on stretched, supercoiled DNA primarily measure the extension of the molecule as a function of its twisting, or more precisely as a function of change in double helix linking number Lk. [1]. Past the threshold for buckling of the molecule, one enters a mixed-phase regime where part of the molecule is extended and part of the molecule is plectonemically supercoiled; in this regime the extension depends linearly on linking number precisely because one is in a regime of two-phase coexistence [2, 3].
Although the origin of the linear dependence is understood [2, 4], the slopes of the extension versus linking number curves are not understood analytically. It is of broad interest to understand the slopes since in addition to being practically useful to predict the amount of length absorbed into plectonemic supercoiling, they contain information about the interplay of external force applied to the molecule with interactions between the tightly juxtaposed DNA double helices in the plectonemic region (primarily electrostatic in the regime of interest here) [5]. Below we analyze the parts of the “standard model” of DNA supercoiling relevant to the high-force limit. We obtain asymptotic formulae describing that limit, for the dependence of the extension versus linking number slopes and DNA torque on force and salt concentration, and we show that experimental data obey the scaling behavior implicit in our results in the high-force limit. Analytical formulae for the plectonemic supercoil radius and angle are predicted for future experiments.
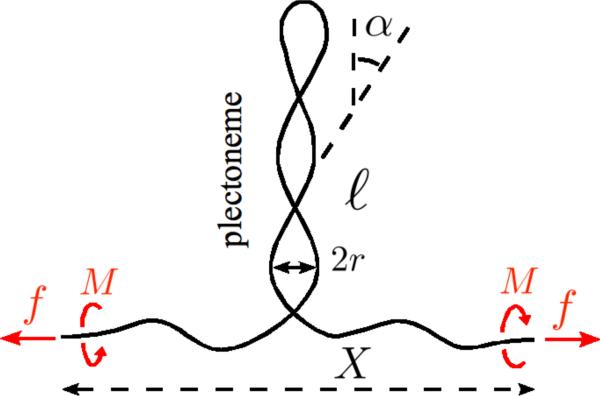
We write the free energy of a DNA molecule subject to applied torque and force in the regime where extended and plectonemically supercoiled DNA are in mechanical coexistence [3, 4, 6, 7]. The total molecule length L is partitioned between the two “phases”: (i) a plectonemic phase of length ℓ, where the filament has bending rigidity A, torsional rigidity C and adopts a superhelical shape of radius r and angle α; (ii) an extended worm-like-chain phase of length L − ℓ, see Fig. 1. The free energy of the extended phase is described in terms of the free energy per length of the untwisted molecule g(f) = f − kBT(f/A)1/2 + … [8], plus a twist energy using a twist modulus that includes effects of writhing fluctuations, Cs(f) = C [1 − (C/4A)kBT/(Af)1/2 [6]. The free energy of the plectonemic phase is that of two superhelices wrapped around each other with electrostatic interactions. The interaction energy U(r) is that of two straight charged cylinders with center axis separated by a distance of 2r, in the Debye-Huckle approximation of the Poisson-Boltzmann equation. For the double helix where two negative charges appear for each base pair this suggests the use of a linear charge density (in electron charge units) of ν = 1/b, where b = 0.17 nm is half of the 0.34 nm spacing of successive base pairs along DNA. However an effective charge is introduced to cope with two effects: (i) the fact that this charge is distributed on the surface of the cylindrical double helix of radius a = 1 nm rather than on its center axis; (ii) the asymptotics of the linear and nonlinear solutions of the Poisson-Boltzmann equation have to match for large separation distances. The effective charge is:
| (1) |
where LB is the Bjerrum length in water, the Debye length, and Kn(x) the nth modified Bessel function of the second kind [9, 10]. From Table III of [9], the parameter γ is computed to be γ = (1.64, 1.44, 1.27, 1.14) at salt concentrations (50,100,200,500) mM and for T = 296.5 K and LB = 0.7 nm. The interaction potential in the plectoneme is [3, 11]:
| (2) |
where both κD and ν depend on the salt concentration. We neglect confinement entropy [3] in the interaction potential for two reasons: (i) it is important for low forces and we presently focus on the moderate to high force regime; (ii) our focus is on an analytical solution so we consider a simple one-term U(r) (similarly no dependence of U on superhelical angle α is considered here).
FIG. 1.
Supercoiled DNA under force and torque. Molecule length is partitioned between two “phases”: an extended phase, and a plectonemic phase where strong self-interaction occurs.
The bending energy, given by the integral of the curvature squared of the molecule center line in the superhelical configuration, is a function of the superhelical radius r and angle α.
Adding together electrostatic, bending and twisting energy terms, the total free energy is:
| (3) |
where λs = 2πΔLks/(L − ℓ) is the linking angle density in the stretched part of the DNA (ΔLks is the excess linking number of the extended region), and τp = 2πΔTwp/ℓ is the twist angle density in the plectonemic DNA (ΔTwp is the excess twist in the plectoneme region).
Once force and ΔLk are specified, the remaining variables are determined by minimization of Eq. 3 subject to the constraint:
| (4) |
where ΔLk is the number of turns introduced into the DNA relative to the relaxed double helix linking number Lk0 (i.e., ΔLk = Lk − Lk0). The constraint on ΔLk is handled using a Lagrange multiplier M, i.e. by minimizing . Equilibrium values of the six variables λs, τp, α, ℓ, r, and M follow from solving where . The equilibrium value of M is the torque in the DNA.
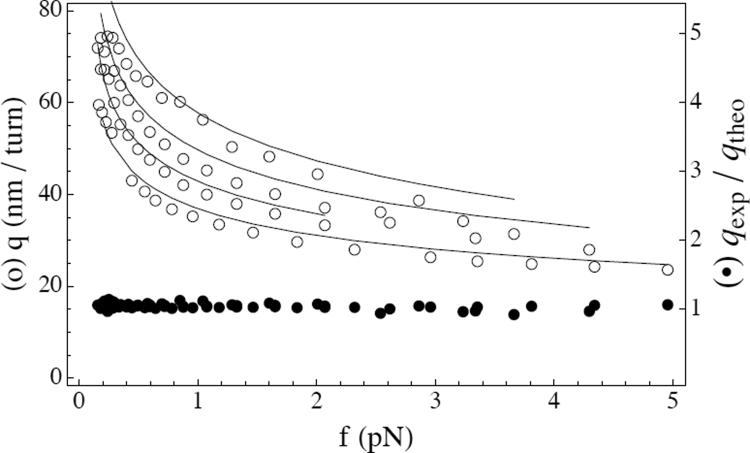
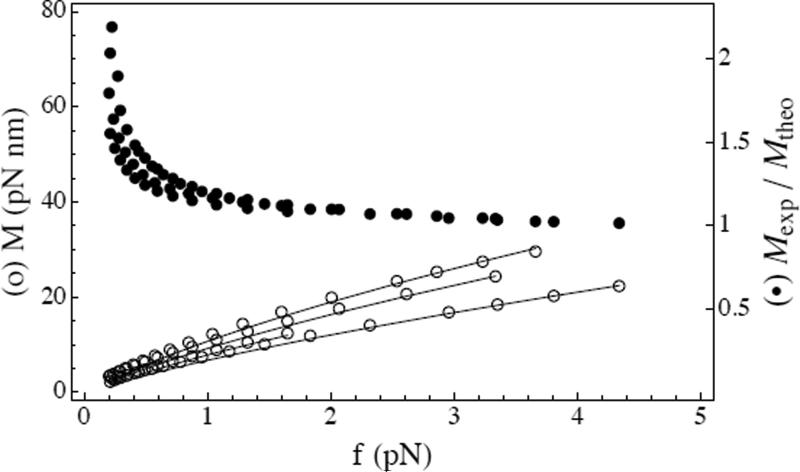
These nonlinear equations, when solved numerically, yield multiple solutions with either ℓ = 0, or ℓ ≠ 0. We here focus on the stable solution having ℓ > 0, which exists as soon as the added ΔLk is large enough [7]. The values of α, r, λs, τp, and M in this solution do not depend on ΔLk, and the value of ℓ varies linearly with ΔLk [7]. A consequence is that the mean extension decreases linearly with ΔLk: as linking is added more and more contour length passes from the extended phase to the plectonemic phase of the molecule. Fig. 2 shows that the slopes from experiment (data from Fig. 3 inset of Ref. [1]) are described well by this theory for four different salt concentrations (50, 100, 200, and 500 mM). Similarly, experimental and theoretical torques are in good accord (Fig. 3).
FIG. 2.
Comparison of experimental and theoretical slopes as function of the applied force, for 50, 100, 200, and 500 mM salt (top to bottom): (a) experimental data from Ref. [1] (circles); (b) theoretical solution of the full equations (continuous lines); (c) ratio of the experimental slopes to the formula in Eq. (16) (filled circles). Experimentally given values of A/kT = 46, 47, 44, 45 nm and C/kT = 94 nm were used.
FIG. 3.
Comparison of experimental and theoretical torques as function of the applied force for 50, 100, 200, and 500 mM salt: (a) experimental data from Ref. [1] (circles); (b) theoretical solution of the full equations (continuous lines); (c) ratio of the experimental torque to the formula in Eq. (17) (filled circles). Experimentally given values of A/kT = 46, 47, 44, 45 nm and C/kT = 94 nm were used.
We now extract the leading scaling behavior for the slope q and the torque M from the full equations, in the high-force limit. We first approximate Cs(f) ≃ C, which reduces the equilibrium equations to:
| (5a) |
| (5b) |
| (5c) |
Eqs. (5a) and (5c) are used to eliminate M, yielding:
| (6) |
Then multiplying Eq. (5b) by sin 2α and Eq. (5a) by cos 2α and summing, we obtain:
| (7) |
The variable α can then be eliminated from Eqs. (6) and (7) to yield one equation for the one variable r:
| (8) |
We introduce the dimensionless variable x := 2κDr. In the regime of moderate to large x and of low to moderate α, the leading order of Eq. (8) is , or :
| (9) |
| (10) |
where we have used K0(x) ≃ (π/(2x))1/2 e−x for large x. The approximate solution is x0 = Log K. Taking the first-order Newton-Raphson estimate of the root yields:
| (11) |
Once r is known, α is computed from Eq. (7):
| (12) |
And M from Eq. (5b):
Eqs. (11) and (12) yield, at lowest order:
| (14) |
We note that although our approximation always leads to a solution, this is not the case for the full equations . For the full equations, there are two r solutions at low forces, and no solutions beyond a force threshold (we only plot the solution with largest r value, which can be shown to be stable). The force threshold for disappearance of the stability of the large-r solution is salt-dependent, and can be as low as 3 pN at low salt (5 mM Na+); at forces beyond this threshold the electrostatic interaction cannot support the plectoneme, which will collapse in radius down to r ≈ 1 nm, with the two DNAs in close contact. This could explain the observations of plectoneme collapse of Ref. [12] and suggests that collapse transitions might be observable in single-DNA experiments. We note that once in the collapsed configuration, if one were to decrease the force, hysteresis of the collapsed state would be observed. We are analyzing this collapse phenomenon in more detail at present and will discuss it in a forthcoming paper.
Our formulae provide insight into the dependence of the slope q on force and salt concentration observed experimentally [1]. We compute neglecting (valid for large force), and taking λs ≃ τp:
| (15) |
Using Eq. (14), we arrive at:
| (16) |
which gives the salt and force dependence of the slope of a hat-curve in a supercoiling experiment. Fig. 2 shows experimental slopes divided by this theoretical prediction; the ratio is nearly 1 with only small variation with force and salt concentration, indicating that the experimental data closely follows this functional form.
We now examine the DNA torque M; Taylor expansion of (13) for small α yields . Using (14), we obtain the following approximate formula for M:
| (17) |
In Fig. 3 experimental torque values are divided by this theoretical prediction and we see that, when f is large enough, the ratio is near 1, with only small variation with f or salt concentration. As for the slopes q, experimental data for M closely follow this functional form, for sufficiently large force.
For forces in the range 0.25 pN ≤ f ≤ 5 pN and salt concentrations between 50mM and 500mM, we checked the accuracy of formulae (14), (16), and (17) against the solution of the full equations and found that the relative error was always below 13% (see Supplementary Materials [13]). Similarly, predicted results for the radius of the supercoils (Fig. 4) show only a small difference between the asymptotic result (Eq. 11) and the exact result of solving . Finally, comparing Eqs. (16) and (17), one sees that
| (18) |
This recovers a formula first discussed in Ref. [14] and which has been noted to describe experimental data for DNA torque [1].
FIG. 4.
Supercoiling radius as function of the force function g(f), computed with: (a) the full non-linear equations (plain lines, red); (b) formula in Eq. (11) (dashed lines, black) for the four salt concentration 50mM, 100mM, 200mM, and 500mM (top to bottom). The separation of the curves at high force is due to the non-linearities of , which are omitted in Eq. (11).
We have described an analytical treatment of a free energy model for coexisting extended and plectonemically supercoiled DNA, where we have taken the contributions which dominate for moderate to large forces, namely the elasticity and electrostatic self-repulsion of the DNA double helix. This model is simple enough that one can extract an analytical solution asymptotically valid for large forces. Our result for the slope of the extension as a function of linking number matches experimental data strikingly well, with all parameters set by experiment or previous theoretical work (i.e., for the electrostatic interaction). Our results provide a framework for analyzing the scaling behavior of DNA stretching-twisting experiments. We furthermore give theoretical predictions for the super-helical radius, super-helical angle, and torque in the molecule as functions of salt concentration and applied force.
In the computations presented in [5], a scaling factor of χ = 0.42 in the effective charge ν (thereby using ν* = χν(a)), plus a value a = 1.2 nm were used in order to obtain good agreement with experiments. We note that in our model, we have not had to resort to a nonstandard value of the DNA effective charge. We agree with the assertion of [7] and [5] that single-DNA twisting-pulling experiments provide a means to analyze DNA-DNA interactions. The electrostatic potentials in the literature are Debye-Huckel-like, i.e., decaying as (e−ρ)/ρ, where ρ = |r−r′| is the distance between interacting charges at r and r′, and they involve an effective charge that in turn depends on salt concentration. For example, Ubbink & Odijk [11] have used an effective charge ν* = ξ/LB with ξ given in their Table 7 (see also [15]). In counter-ion condensation theory of polyelectrolytes [16], the interaction energy also takes the same form as in Eq. (2), but with a salt-concentration-independent effective charge for DNA in water solution [7, 17]. The amplitude of the DNA-DNA interaction potential is sensitive to precisely where the charges are placed relative to the center of the double helix. This might explain the low values of effective charge inferred in [5]. Effective charges used by different authors are compared in the Supplementary Materials [13].
Finally we note that if the electrostatic-elastic theory were complete, then the rescaled slopes and torques in Figs. 2 and 3 would take on the value 1. While this limit is approached at high forces, at lower forces, there is disagreement, particularly in the case of the torques (Fig. 3). This effect is in part due to polymer confinement entropy [3], neglected here but which becomes important at low forces. There are also uncertainties about the measured low-force torque; the analysis of [1] required an estimate of torque as a boundary condition for integration of a thermodynamic “Maxwell relation” [18]. A more complete discussion of the model of this paper including confinement entropy, finite-size plectonemic and small-loop domain effects, and the collapse transition, is in preparation.
Experimental data from Ref. [1] was kindly provided in electronic form by Francesco Mosconi. Work at NU was supported by the US NSF through Grants DMR-0715099 and PHY-0852130, by the Chicago Biomedical Consortium and the Searle Funds at The Chicago Community Trust, and by NIH-NCI grant U54CA143869-01.
Supplementary Material
Footnotes
PACS numbers: 87.14.gk, 82.35.Rs, 87.15.A-, 87.15.La
References
- [1].Mosconi F, Allemand J-F, Bensimon D, Croquette V. Phys. Rev. Lett. 2009;102:078301. doi: 10.1103/PhysRevLett.102.078301. [DOI] [PubMed] [Google Scholar]
- [2].Marko JF, Siggia ED. Science. 1994;265:506. doi: 10.1126/science.8036491. [DOI] [PubMed] [Google Scholar]
- [3].Marko JF, Siggia ED. Phys. Rev. E. 1995;52:2912. doi: 10.1103/physreve.52.2912. [DOI] [PubMed] [Google Scholar]
- [4].Marko JF. Phys. Rev. E. 2007;76:021926. doi: 10.1103/PhysRevE.76.021926. [DOI] [PubMed] [Google Scholar]
- [5].Maffeo C, Schöpflin R, Brutzer H, Stehr R, Aksimentiev A, Wedemann G, Seidel R. Phys. Rev. Lett. 2010;105:158101. doi: 10.1103/PhysRevLett.105.158101. [DOI] [PMC free article] [PubMed] [Google Scholar]
- [6].Moroz JD, Nelson P. Proc. Nat. Acad. Sci. USA, USA. 1997;94:14418. doi: 10.1073/pnas.94.26.14418. [DOI] [PMC free article] [PubMed] [Google Scholar]
- [7].Clauvelin N, Audoly B, Neukirch S. Biophys. J. 2009;96:3716. doi: 10.1016/j.bpj.2009.02.032. [DOI] [PMC free article] [PubMed] [Google Scholar]
- [8].Marko JF, Siggia ED. Macromolecules. 1995;28:8759. [Google Scholar]
- [9].Stigter D, Colloid J. Int. Sci. 1975;53:296. [Google Scholar]
- [10].Schellman JA, Stigter D. Biopolymers. 1977;16:1415. doi: 10.1002/bip.1977.360160704. [DOI] [PubMed] [Google Scholar]
- [11].Ubbink J, Odijk T. Biophys. J. 1999;76:2502. doi: 10.1016/S0006-3495(99)77405-9. [DOI] [PMC free article] [PubMed] [Google Scholar]
- [12].Bednar J, Furrer P, Stasiak A, Dubochet J, Egelman EH, Bates AD. J. Mol. Biol. 1994;235:825. doi: 10.1006/jmbi.1994.1042. [DOI] [PubMed] [Google Scholar]
- [13].See supplementary material for two additional figures.
- [14].Clauvelin N, Audoly B, Neukirch S. Macromolecules. 2008;41:4479. [Google Scholar]
- [15].Vologodskii A, Cozzarelli N. Biopolymers. 1995;35:289. doi: 10.1002/bip.360350304. [DOI] [PubMed] [Google Scholar]
- [16].Manning GS. J. Chem. Phys. 1969;51:924. [Google Scholar]
- [17].Ray J, Manning GS. Langmuir. 1994;10:2450. [Google Scholar]
- [18].Zhang H, Marko JF. Phys. Rev. E. 2008;77:031916. doi: 10.1103/PhysRevE.77.031916. [DOI] [PubMed] [Google Scholar]
Associated Data
This section collects any data citations, data availability statements, or supplementary materials included in this article.


