

Abstract
Mouse photoreceptor function and survival critically depend on Ca2+-regulated retinal membrane guanylyl cyclase (RetGC), comprised of two isozymes, RetGC1 and RetGC2. We characterized the content, catalytic constants and regulation of native RetGC1 and RetGC2 isozymes using mice lacking guanylyl cyclase activating proteins GCAP1 and GCAP2 and deficient for either GUCY2F or GUCY2E genes, respectively. We found that the characteristics of both native RetGC isozymes were considerably different from other reported estimates made for mammalian RetGCs: the content of RetGC1 per mouse rod outer segments (ROS) was at least 3-fold lower, the molar ratio (RetGC2:RetGC1) 6-fold higher, and the catalytic constants of both GCAP-activated isozymes between 12 and 19-fold higher than previously measured in bovine ROS. The native RetGC isozymes had different basal activity and were accelerated 5 to 28-fold at physiological concentrations of GCAPs. RetGC2 alone was capable of contributing as much as 135-165 μM cGMP s−1 or almost 23-28% to the maximal cGMP synthesis rate in mouse ROS. At the maximal level of activation by GCAP, this isozyme alone could provide a significantly high rate of cGMP synthesis compared to what is expected for normal recovery of a mouse rod, and this can help explain some of the unresolved paradoxes of rod physiology. GCAP-activated native RetGC1 and RetGC2 were less sensitive to inhibition by Ca2+ in the presence of GCAP1 (EC50Ca ~132-139 nM) than GCAP2 (EC50Ca ~50-59 nM), thus arguing that Ca2+ sensor properties of GCAP in a functional RetGC/GCAP complex are defined not by a particular target isozyme but the intrinsic properties of GCAPs themselves.
Keywords: photoreceptors, guanylyl cyclase, guanylyl cyclase activating proteins, cGMP, retina
Cyclic GMP plays central role in vertebrate phototransduction by coupling rhodopsin with cGMP gated channels in rod outer segment (ROS) plasma membrane through the transducin —PDE6 cascade (reviewed in 1, 2). In the course of photoresponse, cGMP is first hydrolyzed by light-activated phosphodiesterase PDE6 and then replenished, through a Ca2+-feedback mechanism (1-4), by guanylyl cyclase (RetGC) controlled by Ca2+-sensitive guanylyl cyclase activating proteins, GCAP (5-9). When cGMP gated channels close in response to light, the reduced influx of Ca2+ converts GCAP (reviewed in 10, 11) from a Ca2+-bound (inhibitor) state to a Mg2+-bound (RetGC activator) state and accelerates re-synthesis of cGMP and expedites photoreceptor recovery and light adaptation (9, 12). Transgenic mouse models demonstrate that GCAP-dependent regulation of cGMP synthesis is critical for normal rod and cone physiology (9, 13-18) and involves multiple protein components needed to tune the normal recovery and light adaptation. There are several isoforms of GCAPs in vertebrate rods and cones (19-21); two of them - GCAP1 and GCAP2 (5-7, 22-23), are ubiquitous among all tested species, and both contribute to normal function of the rod (9, 13, 16), by entering stimulation of cGMP synthesis at different steps of rod photoresponse (16). The regulatory properties of the recombinant GCAPs produced in E. coli and insect cells (24-26) have been shown to adequately reflect the behavior of the endogenous retinal GCAPs in shaping rod photoresponses in vivo (14,16, 27).
GCAP-regulated RetGC exists as two homologous isozymes, RetGC1 and RetGC2 (8) (also known as GC-E and GC-F (28) or ROS-GC1 and ROS-GC2 (29)) encoded by two separate genes, in mice – by GUCY2E and GUCY2F, respectively. RetGC is a membrane protein with a single transmembrane helix connecting its “extracellular” portion with the “intracellular” segment comprised of a kinase-homology domain (KHD) and a catalytic domain (30). RetGC is active as a homodimer (31-33) with two active sites formed by two catalytic domains complementing each other (31, 33). RetGC1, the main and the first identified Ca2+/GCAP-regulated isozyme (6), has been linked to Leber’s congenital amaurosis and dominant cone-rod dystrophy (34, 35) – types of congenital blindness caused by mutations in the GUCY2D gene encoding RetGC1 in humans. RetGC1 is also absolutely required for cone function and survival (17, 18). Much less is understood about RetGC2, and the data about the kinetic and regulatory properties of the two isozymes and their relative content in ROS have been controversial. Previous reports have estimated that less than 4% of total RetGC activity in ROS could be carried by RetGC2 (36, 37) – yet this appears at odds with the fact that disruption of the GUCY2E gene neither abolishes responses recorded from mouse rods nor slows down their recovery kinetics (17, 18). There are several possible reasons why the kinetic and regulatory properties of RetGC isozymes and their contribution to the flux of cGMP in rods are controversial: because detergent solubilization for purification disrupts its interaction with GCAPs, purified RetGC does not retain its regulatory properties; the estimates of RetGC content in bovine retina vary considerably (36-38); and even though recombinant RetGC1 and RetGC2 can often serve as good models for studying the basic principles of regulation by GCAPs, their specific biochemical and regulatory characteristics can vary substantially between different expression systems (6, 29, 36, 39, 40). It also remains controversial what dominates Ca2+ sensitivity of RetGC regulation by GCAPs. One model argues that in both Ca2+- and Mg2+-liganded states GCAPs have similar affinity for the cyclase and that GCAP1, unlike calmodulin, does not drastically change their Ca2+ sensitivity upon interaction with the target enzyme (40). The alternative hypothesis advocates a dominant role of the cyclase in setting Ca2+ sensitivity of GCAPs (37).
Therefore, the purpose of our work was to determine the kinetic properties of RetGC1 and RetGC2 in their native environment of photoreceptor membranes, to evaluate their relative contribution to the flux of cGMP in photoreceptors and to determine if native RetGC isozymes differentially affect Ca2+ sensitivity of the RetGC/GCAP complexes. We describe here several key enzymatic characteristics of native RetGC isozymes in mouse ROS membranes, which are substantially different from previous estimates made for bovine RetGCs. The rate of cGMP synthesis in mouse ROS reaches much higher levels for both isozymes than would be expected based on study of bovine RetGCs, and the Ca2+ sensitivity of different RetGC/GCAP complexes is dominated by the isoform of GCAP, not the RetGC isozyme.
EXPERIMENTAL PROCEDURES
Mouse genetic models
All animal procedures were approved by Salus University IACUC protocol in compliance with the NIH guidelines. The GCAP1−/−GCAP2−/− knockout line produced by simultaneous disruption of the neighboring GUCA1A and GUCA1B genes (9) was a gift from Dr. Jeannie Chen (UCSC). RetGC1−/− line produced by the disruption of GUCY2E gene (GC-E null)(17), were a gift from Dr. David Garbers (University of Texas), and RetGC2−/− mice produced by disruption of GUCY2F gene (18) were rederived when transferred to the Salus University vivarium where both lines were crossed with each other or with the GCAP1−/−GCAP2−/− mice. Heterozygotes were then bred into three homozygous lines, RetGC1−/−GCAP1−/−GCAP2−/−; RetGC2−/−GCAP1−/−GCAP2−/−; and RetGC1−/−RetGC2−/−. Wild type C57BL6 mice maintained in the Salus University vivarium originated from Taconic.
Isolation of retinas and ROS fraction
All procedures were conducted under infrared illumination on ice unless otherwise noted. Mice (typically 20-30) of 1-3 months of age were dark adapted overnight and euthanized in the dark. The eyes were enucleated and the retinas were immediately dissected and placed in 20 μl/retina of TBS buffer solution (25 mM TrisHCl, 137 mM NaCl, 3 mM KCl) containing 5 mM MgCl2, 2 mM DTT, 0.2 mM ATP, and 20 μg/ml of leupeptin (Buffer A), pH 7.4. The retinas were then either immediately frozen in liquid N2 for subsequent use in whole-retina RetGC assays or pooled and processed for ROS isolation using density gradient centrifugation modified from (41). A 60% Optiprep solution (Sigma) was added to each ~0.5 ml of pooled retinal tissue in Buffer A to final concentration of ~8% and supplemented with an additional 0.4 ml 8% Optiprep in Buffer A. The suspension was then vortexed at ~1,600 RPM for 1 min, and centrifuged at 400 × g for 1 min at 4°C in a Tomy Seiko MTX-152 tabletop refrigerated centrifuge. The supernatant was collected, and the pellet was extracted three more times with 0.5 ml 8% Optiprep in Buffer A . The pooled supernatant fraction was vortexed for 2 min and centrifuged one more time to remove most of the remaining retinal debris and nuclei and mixed with an equal volume of Buffer A. The crude ROS-containing material was collected by centrifugation at 6,600 ×g for 1 min at 4°C. The pellets were gently re-suspended in 1 ml of 8% Optiprep solution in Buffer A, briefly vortexed and loaded on a 20%-30% Optiprep density gradient and centrifuged in a Beckman TLS 55 swing-bucket rotor at 75,600 × g for 40 min at 4°C. The main ROS band free from melanin contamination was collected, diluted in Buffer A and centrifuged at 6,600 × g for 2 min at 4°C. The pellet was resuspended in Buffer A, and the concentration of rhodopsin (typically ~2-4 mg/ml) was determined from an aliquot dissolved in TBS containing 1.3% (w/v) LDAO (Fluka) by measuring the absorbance at 500 nm before and after illumination for 5 min until completely bleached. Mouse rhodopsin concentrations were determined using a molar extinction coefficient of 42,000 M−1cm−1 (42). The isolated ROS fraction was divided into 10 μL aliquots. Tubes were wrapped in aluminum foil, frozen in liquid N2, and stored at −70°C.
GCAPs
Mouse GCAP1 (E6S) and GCAP2 cDNA amplified from mouse retinal cDNA using high-fidelity Pfu DNA polymerase were subcloned into the NcoI/BamHI sites of the pET11d vector (Novagen/Calbiochem), verified by DNA sequencing, and expressed in a BLR(DE3) E. coli strain harboring yeast N-myristoyl transferase (43). GCAPs were purified to at least 95% purity estimated after SDS PAGE as previously described (43, 44).
RetGC assay
RetGC activity was assayed under infrared illumination using infrared viewers as described previously (24, 44). Briefly, the assay mixture (25 μL) contained (unless indicated otherwise) 30 mM MOPS-KOH (pH 7.2), 60 mM KCl, 4 mM NaCl, 1mM DTT, 2 mM Ca2+/EGTA buffer with defined free Ca2+ and 1 mM free Mg2+, 0.3 mM ATP, 4 mM cGMP, 1 mM GTP, 10 mM creatine phosphate, 0.5 unit of creatine phosphokinase, 1 μCi of [α-32P]GTP, 0.1 μCi of [8-3H]cGMP (Perkin Elmer), PDE6 inhibitors zaprinast and dipyridamole, and variable concentrations of GCAPs. Retinal membranes were disrupted by freeze-thawing to provide unobstructed access of substrate and GCAPs. The reaction, which was linear for 12 min at 30°C, was stopped by heat inactivation at 95°C for 2 min, and the product of the reaction was quantified using a thin-layer chromatography on polyethylenimine cellulose plates (43).
Antibodies
Two rabbit polyclonal antibodies were raised against a portion of the cyclase intracellular segment showing maximal diversity between the two isozymes. The anti-RetGC1 KHD rabbit polyclonal antibody was produced against an Arg540-Asn815 recombinant fragment of human RetGC1 (45). The anti-RetGC2(GCF) KHD rabbit polyclonal antibody was produced against an Arg492-Leu642 recombinant fragment of mouse RetGC2 and purified by immunoaffinity chromatography using the purified recombinant fragment immobilized on CNBr-activated Sepharose CL-4B (GE Heath Sciences). Prior to use in the experiments, the antibodies were tested by immunoblotting on both recombinant purified mouse RetGC standards on the same blot. Each antibody produced a strong signal with its respective isozyme standard with no detectable reaction with the other isozyme at the dilutions used.
Recombinant RetGC and Protein Quantity Estimation by Immunoblotting
The cDNAs for RetGC1 and RetGC2 were amplified using a Finnzyme Phusion Flash DNA polymerase (New England Biolabs). The resulting products coding for RetGC1 and RetGC2 polypeptides started near the mid-portion of their leader sequences, Ala20 (RetGC1) or Leu11 (RetGC2). The cDNA fragments were inserted into the pET15b vector (Novagen/Calbiochem), inframe with the N-terminal cleavable 6X His Tag, verified by DNA sequencing and expressed in a BL21(DE3) CodonPlus E. coli strain (Agilent Technologies) after induction with 1 mM IPTG for 2.5 h at 37 °C. The induction of the expression was confirmed by immunoblotting. The expressed recombinant isozymes (RetGC1r and RetGC2r) accumulated in the insoluble fraction. Both RetGC1r and RetGC2r polypeptides were insoluble in standard buffer solutions and only partially soluble in the presence of urea or guanidine hydrochloride, which also lower the yield of the recombinant RetGCs eluted from the Ni-column. To remove shorter polypeptides (presumably products of premature termination or proteolysis), we additionally purified each full-size RetGC polypeptide by cutting their bands directly from 6% SDS PAGE gels and eluting them with an equal volume of the original 2 × Laemmli sample buffer for SDS PAGE. Solutions of the purified RetGC standards were calibrated by densitometry for concentration of the full-size polypeptide with purified bovine serum albumin as a series of quantity standard on the same Coomassie stained gel (a BioRad GS700 instrument). Aliquots of the stock solutions containing 0.46 mg/ml RetGC1r or 0.88 mg/ml of RetGC2r standards were stored frozen at −70°C. Aliquots were thawed and diluted in a Laemmli SDS sample buffer containing 0.2 mg/ml BSA and loaded next to the aliquots of wild type ROS containing in different cases 10 or 20 μg of rhodopsin on the same gel. After electrophoresis in 7% SDS PAGE using a conventional Laemmli Tris-glycine buffer system, proteins from the gel were transferred on PVDF membrane using an Invitrogen iBlot electroblotting system. The membranes were blocked overnight in a Pierce/ThermoFisher SuperBlock solution in TBS supplemented with 5% goat serum and 0.5% (v/v) Tween 20, probed with anti-RetGC1 or RetGC2 rabbit polyclonal antibody and developed using a Pierce/Thermo Scientific SuperSignal reagent kit and goat anti-rabbit peroxidase conjugates. The chemiluminescence images were collected using a FotoDyne Luminous FX instrument, and the strength of the RetGC signal in ROS sample was quantified from quasi-linear portions of the calibration curves produced by the respective RetGC standards. Four independent calibrations were performed for each RetGC isozyme.
Ca buffers
Free Ca2+ and Mg2+ concentrations were buffered using a series of Ca2+/EGTA mixtures prepared using Tsien and Pozzan method (46), and their free Ca2+ and Mg2+ concentrations were calculated by a Bound and Determined and MaxChelator software using Marks and Maxfield algorithm corrected for the effects of other components of the assay mixture, and the Ca2+/EGTA buffering was verified by fluorescent indicator dyes as previously described in detail (47).
RESULTS
Activation of native RetGC1 and RetGC2 by GCAP1 and GCAP2
To avoid the use of recombinant cyclase or ROS membranes subjected to vigorous multiple hypotonic extractions, which could potentially skew some of the properties of the native isozymes in the outer segment, we functionally segregated each isozyme while avoiding or minimizing the potentially disturbing preparative procedures through the use of mouse ROS intrinsically deprived of both endogenous GCAPs and one of the two RetGC isozymes. For that, we have bred combinations of RetGC1 or RetGC2 gene knockout mice (17, 18) in the genetic background of a double GCAP knockout, GCAP1−/−GCAP2−/− (9) and used a RetGC activity assay that allows us to measure photoreceptor cyclase activity even in a crude mouse retina homogenate (14, 16, 24). Retinal Ca2+ regulated photoreceptor guanylyl cyclase activity was undetectable in a double-knockout, RetGC1−/−RetGC2−/− (Fig. 1), at any free Ca2+ concentrations, consistent with both rods and cones in RetGC1−/−RetGC2−/− mice becoming completely non-responsive to light (18). The GCAP1−/−GCAP2−/− mice possess a full complement of RetGC1 and RetGC2 (9), yet, because mice do not have GCAP isoforms other than GCAP1 and GCAP2 only low basal cyclase activity can be detected in their retinas (Fig. 1)(9). It was neither sensitive to nor stimulated by Ca2+ within the entire physiological range. The loss of measurable RetGC activity in the absence of RetGC1 and RetGC2 was not an artifact of a spontaneous activation of PDE6 (Fig. 1B), either. This means that a combination of any RetGC isozyme knockout and the double GCAP knockout allows measurement of the remaining RetGC isozyme and its dependence on GCAPs and Ca2+ concentrations in the assay without being skewed by any other potential guanylyl cyclase or phosphodiesterase activities that may or may not be present in the retina. It also needs to be emphasized that purified recombinant GCAPs used in this study have been shown to regulate the collective retinal RetGC activity in a manner that was fully consistent with the physiology of mouse rods in vivo (14, 16, 24). Therefore, we reasoned that the regulatory properties of each native RetGC isozyme could be adequately addressed with the use of the recombinant mouse GCAPs.
Fig. 1. The specificity of RetGC activity assay in mouse retinas.

A. RetGC assay was conducted in the retinas of wild type (●), RetGC1−/−RetGC2−/− (17, 18) (▲) or GCAP1−/−GCAP2−/− (■) (9) mice collected in the dark and assayed under infrared illumination at 1 mM free Mg2+ and various free Ca2+ concentrations. B. The cGMP stability in the conditions of the retinal assay was not affected by elimination of RetGCs or GCAPs. RetGC assay mixture contained ca. 0.1 μCi of [8-3H]cGMP added as an internal standard. At the end of the assay, cGMP was recovered by TLC and the 3H radioactivity was normalized by its count relative to a control assay mixture containing retinal extract inactivated by boiling. For other details see Experimental Procedures.
The regulation of RetGC1 and RetGC2 by GCAPs, when measured directly in the retina homogenates, was different from what was previously observed in experiments with recombinant RetGC1 and RetGC2 expressed from baculovirus vector in insect cells (where GCAP1 was able to activate only RetGC1 and GCAP2 – both RetGC1 and RetGC2 (29, 48)). In contrast, both native RetGC isozymes were effectively stimulated by both GCAP1 and GCAP2 (Fig. 2, Table 1) within the concentration range reported for GCAP1 and GCAP2 in mammalian rods (36). RetGC1 was more sensitive to GCAP1 then GCAP2, and GCAP1 at saturation stimulated both RetGC1 and RetGC2 to a higher than or similar to GCAP2 levels (Fig. 2 C, D). The activity of RetGC2 was ~5-times lower than RetGC1 in a whole-retina homogenate (Fig. 2E). In contrast, RetGC2 activity was estimated to be ~25-fold lower than RetGC1 content in bovine ROS (36, 37). However, measuring activity “per retina” in whole retina homogenates may be subjective due to variations in the amount of the actual ROS material present after extractions of the retinas. Therefore, to more precisely determine the parameters of RetGC activity, in subsequent experiments we used ROS fractions collected from retinas by density gradient centrifugation, which were free from vast majority of contaminating retinal material (Fig. 3A, B). ROS fractions were equalized by rhodopsin concentration for the different genotypes. Immunoblotting of the ROS preparations probed with anti RetGC1 and anti-RetGC2 antibody (Fig. 3C) confirmed the presence of only one RetGC isozyme expected for each particular gene knockout combination. The isozymes were at 90% and 84% normal content of RetGC1 and RetGC2 in the wild type, respectively.
Fig. 2. GCAP-dependence of RetGC1 and RetGC2 isozymes in crude retinal homogenates.

Retinas were obtained from RetGC2−/−GCAP1−/−GCAP2−/− and RetGC1−/−GCAP1−/−GCAP2−/− triple knockout mice with the remaining RetGC1 or RetGC2 isozyme, respectively, rendered dependent on the exogenous GCAPs. A-D. The activity of RetGC1 (A, B) or RetGC2 (C, D) was measured in the presence of increasing concentrations of recombinant mouse GCAP1 (A, C) or GCAP2 (B, D); fit with the Michaelis hyperbolic function. E. Stimulated versus non-stimulated individual RetGC isozyme activity compared to the total RetGC activity in mouse retinas lacking GCAPs. RetGC activity was measured in the absence or in the presence of 10 μM mouse GCAP1 or GCAP2, as indicated, in RetGC2−/−GCAP1−/−GCAP2−/− retinas, RetGC1−/−GCAP1−/−GCAP2−/− retinas versus GCAP1−/−GCAP2−/− retinas retaining full complement of RetGC1 and RetGC2 (9). RetGC activity was measured in the presence of 2 mM EGTA (no Ca2+ added) and 1 mM free Mg2+. The data are summarized in Table 1.
Table 1. Properties of native RetGC isozymes in mouse ROS.
| Parameter | RetGC1a | RetGC2a |
|---|---|---|
| RetGC content, μg/mg rhodopsin | 2.1±0.07 (n=4) | 0.5±0.1 (n=4) |
| Rhodopsin:RetGC, molar ratio (monomers) | 1,400±500 (n=4) | 5,800±1,200 (n=4) |
| Concentration, μMb (whole ROS/in cytoplasm) |
3.2/5.8 | 0.8/1.4 |
| RetGC count per ROS, average b | 35,000 | 8,600 |
| Fraction of total RetGC count, % | 80 | 20 |
| KmGTP, mM Non-stimulated GCAP1-stimulated GCAP2-stimulated |
1.55±0.30 (n=3) 0.64±0.05 (n=3) 0.70±0.03 (n=3) |
3.18±0.83 (n=3) 0.63±0.03 (n=3) 0.79±0.09 (n=3) |
| Vmax, nmol cGMP min−1(mg rhodopsin)−1 Non-stimulated GCAP1-stimulated GCAP2-stimulated |
2.5±0.25 (n=3) 70±3.6 (n=3) 31 ±3.6 (n=3) |
4.4±0.6 (n=3) 25.1±1.56 (n=3) 20.5±0. 5 (n=3) |
| kcat, cGMP s−1: c Non-stimulated GCAP1-stimulated GCAP2-stimulated |
2.6±0.3 (n=3) 74±4 (n=3) 33 ±4 (n=3) |
20±2.7 (n=3) 116±7 (n=3) 94±2 (n=3) |
| cGMP concentration change rate in ROS at full activation, μM cGMP s−1 |
432d |
165 |
| Fraction of maximal cGMP synthesis achievable per ROS, % |
72d |
28 |
| Apparent affinity for GCAP1 (EC50), μM ROS membranes Retina homogenates |
1.30 ±0.11(n=4) 0.4±0.04 (n=5) |
2.36±0.06 (n=4) 2.05±0.32 (n=4) |
| Apparent affinity for GCAP2 (EC50), μM ROS membranes Retina homogenates |
1.25μM±0.11 (n=4) 2.8 μM±0.8 (n=5) |
0.74±0.03 (n=4) 0.69±0.11 (n=4) |
| [Ca2+]1/2 (at 1 mM Mg2+), nM GCAP1-stimulated GCAP2-stimulated |
139±3 (n=4) 59±4 (n=6) |
132±10 (n=3) 50±10 (n=3) |
Parameters derived from experiments described in Fig. 2 and 4-7, where applicable, are presented as mean average ± SEM, n
assuming 5 ×10⁷ rhodopsin molecules per mouse ROS, 10 pL cytoplasmic volume, and 8.2 mM concentration of rhodopsin exposed to cytosole in ROS (41) and molecular masses rounded to 120,000 and 40,000 for RetGC isozymes and rhodopsin, respectively
per monomer or a dimer with two active sites in it (33)
assuming that all RetGC1 activity in ROS fraction belongs to rods (we cannot exclude that a small fraction of this activity can be from cone membranes – see Discussion for details).
Fig. 3. ROS fractions isolated from mouse retinas contain individual native isozymes of RetGC.

A. Mouse ROS preparations before (left) and after (right) density gradient centrifugation; bar size: 30 μm. B. Gradient-purified fractions from RetGC2−/−GCAP1−/−GCAP2−/− (left) or RetGC1−/−GCAP1−/−GCAP2−/− (right) retinas containing highly enriched ROS; bar size: 20 μm. C. Only one RetGC isozyme remains in each triple-knockout mouse ROS fraction. The ROS fractions from WT and the RetGC1−/−GCAP1−/−GCAP2−/− or RetGC2−/−GCAP1−/−GCAP2−/− mice equalized by rhodopsin content (10 μg or rhodopsin per lane, left, or 20 μg of rhodopsin per lane, right) were tested after SDS-PAGE by immunoblotting probed with anti-human RetGC1KHD (left panel) or anti-mouse RetGC2KHD (right panel) antibodies.
The apparent affinities of RetGC1 and RetGC2 for GCAP1 versus GCAP2 were different from those previously reported for recombinant bovine or human RetGCs (29, 37, 48). This could be a species differences or more likely due to differences in membrane composition and/or microenvironment unavoidably created by different expression systems. Thus, it is important to compare this parameter for both isozymes directly in the native retinal membranes. As with whole-retina preparations, GCAP1 and GCAP2 activated both RetGC1 and RetGC2 (Fig. 4). Regulation by GCAPs in the isolated ROS fractions was similar to that observed in crude retinal homogenates. However, the difference between the EC50 values of GCAP1 versus GCAP2forRetGC1 was attenuated in purified ROS fraction (Table 1), possibly as a result of removal of excessive amount of retinal proteins capable of affecting this parameter in crude fraction. The apparent affinity of both native isozymes for GCAP1 and GCAP2 was within a micromolar range, similar to what was reported (36, 37), but showed only a modest selectivity, GCAP2>GCAP1, for RetGC2 (Table 1).
Fig. 4. GCAP-dependence of RetGC1 and RetGC2 isozymes in mouse ROS.
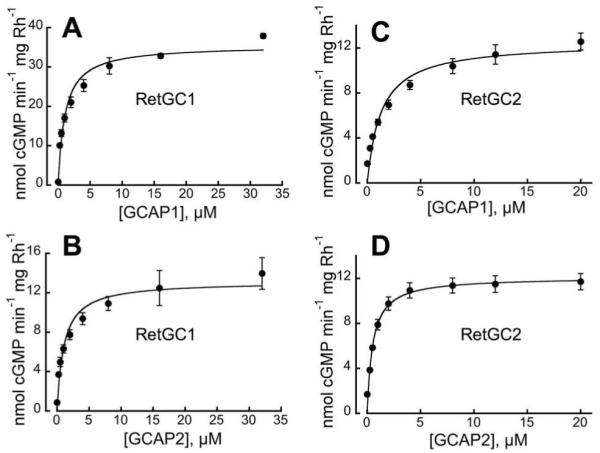
The ROS fractions from RetGC2−/−GCAP1−/−GCAP2−/− (A, B) or RetGC1−/−GCAP1−/−GCAP2−/− (C, D) retinas were reconstituted with increasing concentrations of purified mouse GCAP1 (A, C) or GCAP2 (B, D) in the presence of 2 mM EGTA (no Ca2+ added) and 1 mM free Mg2+. The activity was calculated per mg of rhodopsin (Rh) and the data were fitted with a Michaelis hyperbolic function. For other details see Experimental Procedures.
GCAP2 at saturation stimulated RetGC1 ~ 2.5-fold less effectively than GCAP1, while both GCAPs stimulated RetGC2 to nearly the same level, which was in agreement with RetGC2 expressed in HEK293 cells (37). RetGC2 activity, which was higher than expected in whole-retina preparations, not only remained very high after isolation of ROS, but further increased, to almost ~ 1/3 of the GCAP1-saturated RetGC1 activity, nearly matching the maximal level of RetGC1 stimulation by GCAP2 (Fig. 4, Table 1).
Catalytic properties, content and enzymatic efficiency of native RetGC isozymes
The catalytic properties of the two isozymes were analyzed assuming Michaelis-Menten kinetics (Fig. 5). For both RetGC1 and RetGC2, GCAPs increased apparent affinity for GTP (KmGTP) from ~1.6-3.2 mM to 0.6-0.8 mM (Fig. 5, Table 1), values similar to the KmGTP for total RetGC in bovine ROS fractions (6, 36). For both isozymes, activation by GCAPs also stimulated their maximal velocity: for RetGC1 from 2.5 to 74 nmol cGMP min−1 (mg rhodopsin)−1 and for RetGC2 from 4.4 to 25 nmol cGMP min−1 (mg rhodopsin)−1, much higher levels than reported for the bovine enzymes (36, 37).
Fig. 5. Michaelis-Menten analysis of RetGC1 and RetGC2 in mouse ROS.

The activity in ROS fractions isolated from RetGC2−/−GCAP1−/−GCAP2−/− (A-C) or RetGC1−/−GCAP1−/−GCAP2−/− (D-F) retinas was titrated with the GTP as a substrate under saturating 10 mM MgCl2 (~5 mM free Mg2+) in the presence of 2 mM EGTA (<1 nM free Ca2+), either in the absence (●) or in the presence of 14 μM GCAP1 (◆) or GCAP2 (▲). The double-reciprocal Lineweaver-Burk plot for RetGC1 (B, C) and RetGC2 (E, F) activities, at two different Y-axis scales, illustrates the increased affinity for the substrate and sharply increased Vmax for the GCAP-activated isozymes.
To determine the turnover number and catalytic efficiencies, we estimated RetGC1 and RetGC2 content in ROS by immunoblotting using a quasi-linear calibration. As the standards for calibration, we expressed recombinant mouse RetGC1 and RetGC2 in E. coli. Each RetGC standard reacted with the antibody produced against the KHD-containing fragment of the respective isozyme, but not with the antibody that was raised against the other isozyme. The purified recombinant RetGC1 and RetGC2 isozymes migrating in SDS PAGE electrophoresis as homogeneous 112 and 109 kDa bands respectively were calibrated by densitometry of Coomassie-stained gels against serial dilutions of purified BSA (Fig. 6A). The intensity of RetGC chemiluminescence in a sample of wild type ROS was measured up to a quasi-linear portion of the dose-response curve produced by purified recombinant RetGC standards on the same blot (Fig. 6B, C). From four independent measurements for each isozyme, the average content of RetGC1 and RetGC2 was ~2.1 and 0.5 ng per μg of rhodopsin (Table 1), respectively. For RetGC1, this corresponded to a molar ratio of one monomer per ~1,400 rhodopsin molecules, substantially lower than one cyclase monomer the per 260 to 440 rhodopsin estimates for bovine RetGC (36-38). In contrast, the abundance of RetGC2 protein, almost 1/4 that of RetGC1, was much higher than the 1:25 ratio RetGC2:RetGC1 described in (36, 37). Both isozymes combined yield ~1 cyclase monomer per 1,100 rhodopsin molecules, or ~1 catalytically active homodimer per 2,200 rhodopsin molecules. These differences likely reflect species differences, but the higher purity of recombinant standards used in our study may also contribute (Fig. 6A).
Fig. 6. Estimation of RetGC1 and RetGC2 content in mouse ROS using immunoblotting.

A. Calibration of recombinant RetGC standards. The purified recombinant standards (RetGC1r and RetGC2r, 5 μl and 2 μl, respectively) isolated from E. coli were subjected to SDS PAGE in 6% gel, next to the lanes containing purified BSA, then stained with Brilliant Blue R250 protein dye (left panel), and the integrated optical density of RetGC1r or RetGC2r band was measured up to the quasi-linear part of the calibration curve of BSA (right panel) and corresponded to 0.46±0.01 mg/ml and 0.88±0.04 mg/ml of the main polypeptide in the respective stock solutions. B, C. RetGC isozymes content in mouse ROS. The ROS sample from wild type retinas containing 10 μg (B) or 20 μg (C) rhodopsin was subjected to SDS PAGE in 6% gel next to the increasing dose of the mouse RetGC1r (B) or RetGC2r (C) standards, then transferred to PVDF membrane, probed with anti-RetGC1KHD (B) and anti-RetGC2KHD (C) antibodies, respectively, and developed by peroxidase-conjugated secondary antibody (top panels in B, C). The volume of chemiluminescence (arbitrary units) for each RetGC isozyme band was calibrated against the recombinant standards on the same blot. Each calibration was independently repeated four times. For other details see Experimental Procedures.
Ca2+-sensitivity of RetGC/GCAP regulation is dominated by GCAP, rather than RetGC isozyme
One of the key biochemical features in RetGC regulation is its Ca2+ sensitivity. Binding of Ca2+ versus Mg2+ determines the functional state of GCAP as inhibitor or activator of the cyclase under physiological conditions (24, 44, 47, 49), but free Mg2+ concentrations in ROS remain close to 1 mM and do not substantially change between light and dark in amphibian rods (50), so, assuming the same for mouse rods, the transition of GCAPs from their Ca2+ bound (inhibitory) to the Mg2+ bound (activated) state results from light-dependent change in free Ca2+ concentrations (51, 52). In mouse rods, this change is from ~23 nM in the light to ~250 nM in the dark (52). Bovine and mouse GCAP1 displays a lower Ca2+ sensitivity than GCAP2 in vitro at any tested Mg2+ concentrations (16, 24, 36, 40). This difference in GCAP sensitivity also correlates with the physiological changes in rod responses observed in GCAP2 knockout mice in vivo (16). However, in our experiments each GCAP isoform could activate both isozymes of RetGC in vitro. Consequently, we must address whether Ca2+ sensitivity of cyclase regulation by GCAP depends on a particular RetGC isozyme. Our experiments with native mouse cyclase isozymes (Fig. 7) did not reveal any difference in sensitivity to the same GCAP isoform between RetGC1 versus RetGC2. Ca2+ EC50 for GCAP1 was ~130 nM for both RetGC1 and RetGC2. The Ca2+ EC50 for GCAP2 was lower, ~50 nM, but again did not differ between RetGC1 and RetGC2. Moreover, the positive cooperativity for Ca2+ did not differ (Hill coefficient between 1.72 and 2.0 in all cases). Thus, Ca2+ sensitivity of the functional RetGC/GCAP complexes depends on the specific GCAP isoform rather than the RetGC isozyme (Table 1).
Fig.7. Calcium sensitivity of native RetGC isozymes regulation by GCAP1 and GCAP2.
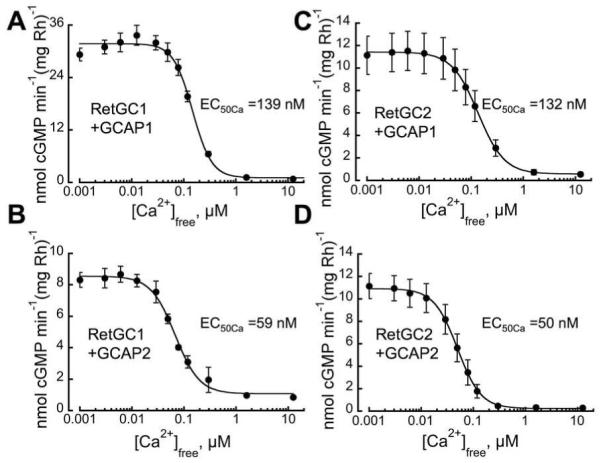
ROS isolated from RetGC2−/−GCAP1−/−GCAP2−/− (A, B) or RetGC1−/−GCAP1−/−GCAP2−/− (C, D) retinas were reconstituted with 10 μM GCAP1 (A, C) or GCAP2 (B, D) and assayed for cyclase activity in the presence of 2 mM Ca2+/EGTA buffer providing variable free Ca2+ concentrations at fixed 1 mM free Mg2+. Lines show the fits to the Hill equation: retGC activity = (maximal activity-minimal activity)/(1+([Ca2+]/EC50Ca)nH) + minimal activity, were nH (Hill coefficient) was within a narrow range of 1.7-2.0 for all experiments. The EC50Ca for GCAP1 averaged from several independent experiments similar to those shown in panels A-D was 139±3 nM, 4 (mean ±S.E., n) and 132±10 nM, 3, for RetGC1 and RetGC2, respectively; for GCAP2, it was respectively 59±4 nM, 4, and 50±10 nM, 6. The EC50Ca between GCAP1 and GCAP2 were statistically significantly different for both RetGC1 (unpaired t-test, two-tailed p<0.0001) and RetGC2 (p=0.0044), but the EC50Ca between RetGC1 (p=0.476) and RetGC2 (p=0.340) activated with either GCAP1 or GCAP2 were not.
DISCUSSION
The use of transgenic and gene-knockout mouse models has provided rapid progress in studying mammalian photoreceptor physiology, and it has also created an opportunity to determine the biochemical parameters of the proteins involved in signal transduction and adaptation of photoreceptors. We used a combination of mouse gene knockouts to functionally isolate individual mammalian RetGC isozymes in their native environment of ROS membranes. Although the attempts were made previously to evaluate the kinetic parameters of RetGC1 and RetGC2 using hypotonically washed bovine ROS membranes or recombinant RetGC isozymes of different species expressed in various cell cultures (6, 29, 36, 37, 45, 48), either both isozymes were present in the same membrane preparation (6, 36) or the properties of recombinant RetGCs displayed high variability between different expression systems (29, 36, 37, 45, 48), which complicates the interpretation of the data. The use of the transgenic mouse models in our study allowed to functionally separate RetGC1 and RetGC2 without their biochemical purification in detergent (which hampers GCAP-sensitive regulation) and without subjecting the ROS membranes to multiple hypotonic extractions that could potentially compromise the kinetic properties of the enzymes. The second important advantage we see in this approach is that it allows to correlate the biochemical properties of RetGC with the reported rod physiology in the same animal species that was derived from the comparison between wild type and GCAP knockout rod responses (12). Since the results from knockout models sometimes can be influenced by potential compensatory changes, RetGC activity from the knockout mice are not necessarily identical to those from the wild type mice, but we will also argue below that the properties of the native isozymes in our study are unlikely to be critically affected by the knockout genotypes.
The content and the catalytic properties of RetGC isozymes in mouse rods
The levels of RetGC activity in rod outer segment determined in our experiments was much higher than previously anticipated based on the study of bovine ROS membranes. Bovine ROS fraction containing both isozymes has an activity of 10-20 nmol cGMP min−1 (mg rhodopsin)−1 (6, 24, 36). In contrast, the activity of both RetGC isozymes in mouse ROS membranes is 5-10 fold higher (Fig. 5, Table 1). This could reflect major differences between rod physiology in these animal species (for example, mice are nocturnal animals and cows are not). This cannot however be verified because bovine rod electrophysiology has not been characterized. It could also reflect the stability of the bovine enzymes, which could be reduced during the time required for membrane preparation. It typically takes many hours before bovine eyes collected at the slaughterhouse can be properly dark adapted and dissected for isolation of the rod outer segments. Mice are dark adapted before the experiment, and it takes only minutes before retinas from dark-adapted mice can be placed in the controlled environment of a chilled buffer solution containing protease inhibitors and processed for ROS isolation. In addition, the ROS fraction in the GCAP knockout background used in our study did not require extensive hypotonic extraction procedures to remove endogenous GCAPs. This could also help maintain RetGC activity.
One possible caveat in using genetically isolated RetGC isozymes would be a possibility of their alteration via compensatory changes that frequently occur in transgenic and knockout animals. Although this possibility cannot be completely excluded, it does not appear to seriously affect our results. Importantly, the content of each isozyme in the triple-knockout models remains very similar to that of wild type when normalized to rhodopsin content in their membrane (Fig. 3). Proteins involved in cGMP flux have been characterized previously in RetGC2 knockout or double-GCAP knockout retinas (9, 18) The content of phototransduction enzymes and regulatory proteins was not remarkably different from the wild type. Disruption of RetGC1, however, does decrease GCAP content (18). That change is unlikely to affect our results, because GCAPs were completely removed in the double-gene knockout. Potential alterations in PDE6 cascade regulation would have little consequence because we measured RetGC in the dark, where the transduction cascade is silenced, and we deliberately inhibited the PDE6 activity to eliminate the opposing reaction of cGMP hydrolysis (Fig. 1). The enzymes related to GTP synthesis have not been analyzed, but they are not relevant for our measurements, because GTP, ATP, creatine kinase, and creatine phosphate are all supplied to the reaction externally. Therefore, even though it cannot be excluded that among thousands of different proteins expressed in photoreceptors, changes in the knockouts could indirectly affect biochemical properties of RetGC, we find no evidence suggesting that the RetGC properties in our models are critically altered by the genetic knockouts. We cannot a priori exclude that the stability of RetGC isozymes in mouse rods decreases when the cells lack GCAPs (53), but the RetGC activity that we measure is already at least 5 times higher than any RetGC activity previously reported in mammalian ROS. While it is possible that the cyclase activity is still an underestimate, the values observed satisfy the range of activity required for the mouse rod recovery (12).
Since all activities in experiments with ROS were normalized using their rhodopsin content, our results strongly argue that both the relative and the absolute activity of RetGC2 associated with mouse ROS is much higher than previously believed based on data from bovine ROS (36, 37). The RetGC2: RetGC1 ratio for the native mouse isozymes is at least 6-fold greater than that reported in bovine ROS (1:4 versus 1:25) (36, 37). The average rhodopsin count per mouse ROS is ~5×10⁷ monomers (41). This would correspond to ~35,000 RetGC1 and ~8,600 RetGC2 monomers in mouse ROS. With a ROS cytoplasmic volume of 10−14 L and a rhodopsin concentration in the cytoplasm of ROS of ~8.2 mM (41), the concentrations of the catalytic domains of the two isozymes exposed to the cytosol of the outer segment would be at ~ 5.8 and 1.4 μM, respectively. The two isozymes in vivo likely form homodimers (54), therefore, the concentration of each active RetGC dimer should be respectively 2.9 and 0.7 μM. However, because there are 2 active sites per dimer (31, 33), the concentration of active sites would still be equal to the concentration of the cyclase monomers. Mouse ROS contains ~1000 disks (41), and the overall RetGC content would correspond to the average ~ 20 active homodimers (~40 active sites) per disk, which makes the catalytic portion of RetGC noticeably less abundant in the ROS interdiskal space than most of other known proteins involved in phototransduction.
The kcat of non-stimulated cyclase in our experiments was almost 7-fold higher for RetGC2 than RetGC1 (20 versus 2.6 s−1, Table 1), and the maximally achievable activation by GCAPs increased the catalytic constant for RetGC1 nearly 28-fold (to 74 sec−1) and 5 to 6-fold for RetGC2 (to 116 s−1). These kcat values should not depend on how they are calculated in this case - “per monomer” or “per dimer”, because each dimer would convert two molecules of GTP at the same time (31, 33). To make the comparison with our data for the native mouse isozymes presented in Table 1 more accurate, it should be noted that the kcat estimates previously reported by Hwang et al. for bovine RetGC (36) were apparently calculated “per dimer” but without taking into account that the RetGC dimer actually has two active sites, not just one. If directly compared with our calculations, they would yield 3.0 and 2.4 s−1 for bovine RetGC1 activated by GCAP1 and GCAP2, respectively. Yet, even the overestimated k values of 5.9 and 4.8 s−1 cat in (36) taken at face value were markedly lower than the kcat of each native mouse isozyme activated by GCAP1 and GCAP2 in our experiments with native mouse isozymes (Table 1). Although at their maximal activation levels and at substrate saturation both RetGC1 and RetGC2 remain relatively low-efficiency enzymes (kcat/Km ~1-1.6 ×10⁵ M−1 s−1), their catalytic efficiencies are at least 10-fold greater than estimated in bovine ROS (36).
Contribution of RetGC1 and RetGC2 to the cGMP flux in mouse ROS
These data also indicate that each RetGC isozyme alone is capable of providing the levels of activity needed to satisfy the recovery kinetics in rods. The maximal velocity achievable for cGMP production in the outer segment by both isozymes together would provide cGMP concentration change rate of ~600 μM s−1 (Table 1), which even exceeds the required rate of 100-300 μM s−1 required during mouse rod recovery from excitation reported by Burns et al. (12). RetGC1 and RetGC2 can respectively contribute 72% and 28% to total cGMP production (Fig. 4, Table 1). The activity from RetGC2 (135 and 165 μM cGMP s−1 when activated by GCAP2 or GCAP1, respectively) is by itself within the required rate for cGMP concentration change in rod. This can explain, at least partially, why mouse rods lacking RetGC1 can recover from excitation in a timely manner (17, 18).
The values shown in Table 1 are based on the assumption that all photoreceptor RetGC activity measured in ROS fraction actually comes from rods. Although it is technically impossible at this point to accurately quantify the amount of mouse cone membranes in ROS preparation, the assumption is justified because cones in mouse retinas comprise just ~3% of the total photoreceptors count (55), and the cone outer segment volume is ~3-times smaller than that of ROS (56). Thus, cone photoreceptor membranes would constitute only ~1% of the total outer segment membrane amount in the retina. Nonetheless, cone outer segments often display brighter anti-RetGC1 immunofluorescence than ROS (6, 18) and therefore likely have a higher content of RetGC1. Supporting this, estimates from fish cone physiology argue that cones can maintain ~10 fold higher cGMP synthetic activity than rods (21). Applying these estimates to mouse cones suggests that no more than ~10% of the total RetGC1 activity measured in retinal homogenates (Fig. 2E) comes from cones. Furthermore, cone outer segments are notoriously more difficult to shake off the retina than ROS, therefore, we should expect that RetGC1 activity originating from cone outer segments in isolated ROS fraction is even less than 10%, and therefore should likely be close to the margins of error for the analysis. With RetGC2, practically all of its activity measured in the RetGC1−/− background must belong to ROS, because RetGC2 is not strongly expressed in cones and because cones do not survive in the RetGC1−/− retinas (17, 18).
Maximal RetGC activity in light adaptation
Whether or not additional factors can affect maximal RetGC activity in the light is still a question. The actual RetGC activity in vivo may not reach its maximally achievable catalytic capacity, because it would depend on the actual concentrations of GTP, GCAPs, and Ca2+ in ROS. The Km for GTP of both GCAP-activated isozymes is ~0.6-0.7 mM, close to what was reported before for RetGC in bovine ROS (6, 36). The concentration of GTP in amphibian ROS in the dark corresponds to ~0.3 mol GTP per mol rhodopsin (57). Assuming a similar ratio for mouse ROS, the concentration of GTP in the cytoplasm volume of the outer segment would then be near 2.5 mM. This concentration is high enough to nearly saturate RetGC with the substrate (Fig. 5, Table 1). However, GTP levels could decrease by 25-50% in the conditions of light adaptation (57-58). Thus, even at low Ca2+ (59, 60) when the activation of both RetGC isozymes in ROS is the highest, the cGMP synthesis rate for both RetGC isozymes could be at least 25% below its potential maximum due to the substrate limitations. Such a lower rate would still, however, provide a rate of cGMP synthesis compatible with the rod recovery (12).
Another important factor to consider is the affinity and the selectivity of RetGCs for GCAPs relative to their concentrations in vivo. Our data indicate that native RetGC2 has a modest preference for GCAP2 over GCAP1 (Fig. 2 & 4, Table 1). Whether GCAP selectivity differs for RetGC1 is harder to determine since we observed a small increase in the apparent affinities of RetGC1 for GCAP1 in crude retinal homogenates but not in isolated ROS fractions (Table 1). Nevertheless, both GCAPs bind either RetGC isozyme at low micromolar range. The content of GCAP1 and GCAP2 in outer segments is ~1 per 900 and 1,100 rhodopsin molecules, respectively (36). In a 10-pL cytosolic volume of ROS, therefore, their concentrations could reach 9 and 7.5 μM, respectively, clearly high enough for both GCAPs to activate RetGC1 and RetGC2 in vivo (Fig. 1 & 4) and to satisfy the equimolar binding stoichiometry (61) with either RetGC isozyme at saturation. Provided that there are no restrictions imposed by differential compartmentalization in vivo, both GCAPs should also be able to compete with each other for both RetGC isozymes in these conditions. In case of RetGC2, such competition would not affect its maximal activation, because both GCAP1 and GCAP2 stimulate RetGC2 equally well at saturation (Fig. 4 & 5, Table 1). In contrast, substitution of GCAP1 with GCAP2 would likely attenuate maximal RetGC1 activity, because GCAP2 activation of RetGC1 is only ~40% that of GCAP1 (Fig. 5, Table 1). It has been reported that RetGC1 may have different binding sites for GCAP1 and GCAP2, which could allow for a simultaneous action of both GCAPs (62), and it remains to be clarified in future experiments whether or not GCAPs act synergistically or oppose each other by competing for the same native cyclase isozyme.
Calcium sensitivity of RetGC/GCAP complexes
It has been hypothesized (37) that GCAP, much like calmodulin, dramatically changes its Ca2+ sensitivity as a result of interaction with the target enzyme and, consequently, its sensitivity can be very different when it interacts with different RetGC isozymes. That hypothesis is based on a shifted Ca2+ sensitivity of GCAP2/ROS-GC complexes produced by several mutations in GCAP2 outside its Ca2+ binding EF hand domains. However, since the equilibrium constants for the binding to the cyclase of the Ca2+-liganded versus Mg2+-liganded GCAP were not explicitly compared for each GCAP mutants in these experiments, it remains equally possible that the observed shifts in Ca2+ sensitivity in that study were due to the shifted affinities of Ca2+- versus Mg2+-liganded GCAP mutants for the cyclase, not by the different targets having impact on the Ca2+ sensitivity of GCAP per se. While we cannot directly confirm or disprove the “calmodulin-like” model for GCAPs (37) based on our data, the fact that two different native RetGC isozymes show exactly the same sensitivity in the presence of each of the two isoforms of GCAPs in our experiments (Fig. 7, Table 1) seriously challenges a calmodilin-like mechanism for GCAP1, especially because bovine GCAP1’s intrinsic affinity for Ca2+ at physiological concentrations of Mg2+ (apparent Kd~100 - 290 nM, ref. 47) is very close to the Ca2+ sensitivity of its complexes with both the RetGC1 and RetGC2 in the present study (Table 1). It was previously demonstrated that an R838S substitution in dimerization domain of RetGC1 shifts its Ca2+-sensitivity (31), but the shift is caused by alteration of the cyclase affinity for the activator versus inhibitor forms of GCAP, rather than by affecting Ca2+ sensitivity of the GCAP transition per se (40). However, regardless of the validity of the calmodulin-like model for GCAPs, Ca2+ sensitivity of native RetGC isozyme in its complex with GCAP is clearly defined by the GCAP isoform, not by the RetGC isozyme (Fig. 7, Table 1).
From the Ca2+/GCAP regulation of the native RetGC isozymes, we can also expect that depending on whether or not a promiscuous regulation of RetGCs by GCAPs takes place in the outer segment in vivo, the activity of each isozyme would respond to the same light-sensitive change in Ca2+ levels quite differently. For example, even though the maximal achievable activity for RetGC2 is nearly the same with GCAP1 and GCAP2 (Table 1), the RetGC2/GCAP1 complex would become activated sooner and RetGC2/GCAP2 complex later after illumination, because GCAP1 and GCAP2 turn into activators at higher and lower free Ca2+ concentrations, respectively (36, 16).
Concluding remarks
Mouse rods can respond to light and sufficiently quickly recover from excitation even in the absence of RetGC1 (17, 18). A direct comparison of the native RetGC isozymes in mouse retina using minimally perturbed conditions reveals some previously unexpected features about the role of different RetGC isozymes in regulation and activity levels in mammalian photoreceptors, which can help at least partially explain the paradoxical resilience of rod responses to elimination of the major isoform, RetGC1. We demonstrate here that both native RetGC1 and RetGC2 isozymes are important for cGMP synthesis in photoreceptors. Furthermore, cGMP regulation in rods in response to light now seems rather complicated, because none of the possible combinations between GCAP and RetGC isoforms is kinetically prohibited in vitro or produces a level of activity below that necessary for overall cGMP turnover in ROS in vivo. Therefore, it will be crucial to evaluate the functional relationships between the RetGC/GCAP complexes and their structural organization in the outer segment in vivo. Even though at this point we find no evidence for the biochemical restrictions on RetGC isozymes regulation by GCAP isoforms, it is possible that the promiscuous interaction between RetGC isozymes and GCAPs is, after all, restricted in vivo by other factors, such as structural organization and compartmentalization in the outer segment. Addressing this possibility would require further studies using different approaches.
ACKNOWLEDGEMENTS
We thank Dr. Jeannie Chen for a generous gift of GCAP1−/−GCAP2−/− double knockout mice, late Dr. David Garbers for a generous gift of RetGC1−/− (GC-E null) mouse line, and Dr. Michael E. Maguire for critical reading the manuscript and helpful suggestions. AMD is a Martin and Florence Hafter Chair Professor of Pharmacology and KP is a John H. Hord Professor of Pharmacology.
Funding: NIH grants EY11522 (AMD), EY08123 (WB), and EY008061 (KP); Pennsylvania Department of Health, (AMD)
ABBREVIATIONS
- BSA
bovine serum albumin
- EGTA
ethylene glycol-bis(2-aminoethylether)-N,N,N’,N’-tetraacetic acid
- DTT
dithiothreitol
- GCAP
guanylyl cyclase activating protein
- IPTG
isopropyl-β-D-thiogalactoside
- KHD
kinase homology domain
- LDAO
lauryldimethylamine-oxide
- MOPS
3-(N-morpholino) propanesulfonic acid
- PDE6
cGMP phosphodiesterase, isozyme 6
- RetGC
retinal guanylyl cyclase
- RetGC1r and RetGC2r
recombinant RetGC isozymes expressed in E. coli
- ROS
rod outer segment
- SDS
sodium dodecyl sulfate
REFERENCES
- 1.Fu Y, Yau KW. Phototransduction in mouse rods and cones. Pflugers Arch. 2007;454:805–819. doi: 10.1007/s00424-006-0194-y. [DOI] [PMC free article] [PubMed] [Google Scholar]
- 2.Pugh EN, Jr., Duda T, Sitaramayya A, Sharma RK. Photoreceptor guanylate cyclases: a review. Biosci Rep. 1997;17:429–473. doi: 10.1023/a:1027365520442. [DOI] [PubMed] [Google Scholar]
- 3.Hodgkin AL, Nunn BJ. Control of light-sensitive current in salamander rods. J Physiol. 1988;403:439–471. doi: 10.1113/jphysiol.1988.sp017258. [DOI] [PMC free article] [PubMed] [Google Scholar]
- 4.Koch KW, Stryer L. Highly cooperative feedback control of retinal rod guanylate cyclase by calcium ions. Nature. 1988;334:64–66. doi: 10.1038/334064a0. [DOI] [PubMed] [Google Scholar]
- 5.Gorczyca WA, Gray-Keller MP, Detwiler PB, Palczewski K. Purification and physiological evaluation of a guanylate cyclase activating protein from retinal rods. Proc Natl Acad Sci U S A. 1994;91:4014–4018. doi: 10.1073/pnas.91.9.4014. [DOI] [PMC free article] [PubMed] [Google Scholar]
- 6.Dizhoor AM, Lowe DG, Olshevskaya EV, Laura RP, Hurley JB. The human photoreceptor membrane guanylyl cyclase, RetGC, is present in outer segments and is regulated by calcium and a soluble activator. Neuron. 1994;12:1345–1352. doi: 10.1016/0896-6273(94)90449-9. [DOI] [PubMed] [Google Scholar]
- 7.Palczewski K, Subbaraya I, Gorczyca WA, Helekar BS, Ruiz CC, Ohguro H, Huang J, Zhao X, Crabb JW, Johnson RS, Walsh KA, Gray-Keller MP, Detwiller PB, Baehr W. Molecular cloning and characterization of retinal photoreceptor guanylyl cyclase-activating protein. Neuron. 1994;13:395–404. doi: 10.1016/0896-6273(94)90355-7. [DOI] [PubMed] [Google Scholar]
- 8.Lowe DG, Dizhoor AM, Liu K, Gu Q, Spencer M, Laura R, Lu L, Hurley JB. Cloning and expression of a second photoreceptor-specific membrane retina guanylyl cyclase (RetGC), RetGC-2. Proc Natl Acad Sci U S A. 1995;92:5535–5539. doi: 10.1073/pnas.92.12.5535. [DOI] [PMC free article] [PubMed] [Google Scholar]
- 9.Mendez A, Burns ME, Sokal I, Dizhoor AM, Baehr W, Palczewski K, Baylor DA, Chen J. Role of guanylate cyclase-activating proteins (GCAPs) in setting the flash sensitivity of rod photoreceptors. Proc Natl Acad Sci U S A. 2001;98:9948–9953. doi: 10.1073/pnas.171308998. [DOI] [PMC free article] [PubMed] [Google Scholar]
- 10.Dizhoor AM, Olshevskaya EV, Peshenko IV. Mg2+/Ca2+ cation binding cycle of guanylyl cyclase activating proteins (GCAPs): role in regulation of photoreceptor guanylyl cyclase. Mol Cell Biochem. 2010;334:117–124. doi: 10.1007/s11010-009-0328-6. [DOI] [PMC free article] [PubMed] [Google Scholar]
- 11.Stephen R, Filipek S, Palczewski K, Sousa MC. Ca2+ -dependent regulation of phototransduction. Photochem Photobiol. 2008;84:903–910. doi: 10.1111/j.1751-1097.2008.00323.x. [DOI] [PMC free article] [PubMed] [Google Scholar]
- 12.Burns ME, Mendez A, Chen J, Baylor DA. Dynamics of cyclic GMP synthesis in retinal rods. Neuron. 2002;36:81–91. doi: 10.1016/s0896-6273(02)00911-x. [DOI] [PubMed] [Google Scholar]
- 13.Howes KA, Pennesi ME, Sokal I, Church-Kopish J, Schmidt B, Margolis D, Frederick JM, Rieke F, Palczewski K, Wu SM, Detwiler PB, Baehr W. GCAP1 rescues rod photoreceptor response in GCAP1/GCAP2 knockout mice. Embo J. 2002;21:1545–1554. doi: 10.1093/emboj/21.7.1545. [DOI] [PMC free article] [PubMed] [Google Scholar]
- 14.Olshevskaya EV, Calvert PD, Woodruff ML, Peshenko IV, Savchenko AB, Makino CL, Ho YS, Fain GL, Dizhoor AM. The Y99C mutation in guanylyl cyclase-activating protein 1 increases intracellular Ca2+ and causes photoreceptor degeneration in transgenic mice. J Neurosci. 2004;24:6078–6085. doi: 10.1523/JNEUROSCI.0963-04.2004. [DOI] [PMC free article] [PubMed] [Google Scholar]
- 15.Pennesi ME, Howes KA, Baehr W, Wu SM. Guanylate cyclase-activating protein (GCAP) 1 rescues cone recovery kinetics in GCAP1/GCAP2 knockout mice. Proc Natl Acad Sci U S A. 2003;100:6783–6788. doi: 10.1073/pnas.1130102100. [DOI] [PMC free article] [PubMed] [Google Scholar]
- 16.Makino CL, Peshenko IV, Wen XH, Olshevskaya EV, Barrett R, Dizhoor AM. A role for GCAP2 in regulating the photoresponse. Guanylyl cyclase activation and rod electrophysiology in GUCA1B knock-out mice. J Biol Chem. 2008;283:29135–29143. doi: 10.1074/jbc.M804445200. [DOI] [PMC free article] [PubMed] [Google Scholar]
- 17.Yang RB, Robinson SW, Xiong WH, Yau KW, Birch DG, Garbers DL. Disruption of a retinal guanylyl cyclase gene leads to cone-specific dystrophy and paradoxical rod behavior. J Neurosci. 1999;19:5889–5897. doi: 10.1523/JNEUROSCI.19-14-05889.1999. [DOI] [PMC free article] [PubMed] [Google Scholar]
- 18.Baehr W, Karan S, Maeda T, Luo DG, Li S, Bronson JD, Watt CB, Yau KW, Frederick JM, Palczewski K. The function of guanylate cyclase 1 and guanylate cyclase 2 in rod and cone photoreceptors. J Biol Chem. 2007;282:8837–8847. doi: 10.1074/jbc.M610369200. [DOI] [PMC free article] [PubMed] [Google Scholar]
- 19.Imanishi Y, Li N, Sokal I, Sowa ME, Lichtarge O, Wensel TG, Saperstein DA, Baehr W, Palczewski K. Characterization of retinal guanylate cyclase-activating protein 3 (GCAP3) from zebrafish to man. Eur J Neurosci. 2002;15:63–78. doi: 10.1046/j.0953-816x.2001.01835.x. [DOI] [PMC free article] [PubMed] [Google Scholar]
- 20.Imanishi Y, Yang L, Sokal I, Filipek S, Palczewski K, Baehr W. Diversity of guanylate cyclase-activating proteins (GCAPs) in teleost fish: characterization of three novel GCAPs (GCAP4, GCAP5, GCAP7) from zebrafish (Danio rerio) and prediction of eight GCAPs (GCAP1-8) in pufferfish (Fugu rubripes) J Mol Evol. 2004;59:204–217. doi: 10.1007/s00239-004-2614-y. [DOI] [PMC free article] [PubMed] [Google Scholar]
- 21.Takemoto N, Tachibanaki S, Kawamura S. High cGMP synthetic activity in carp cones. Proc Natl Acad Sci U S A. 2009;106:11788–11793. doi: 10.1073/pnas.0812781106. [DOI] [PMC free article] [PubMed] [Google Scholar]
- 22.Dizhoor AM, Olshevskaya EV, Henzel WJ, Wong SC, Stults JT, Ankoudinova I, Hurley JB. Cloning, sequencing, and expression of a 24-kDa Ca(2+)-binding protein activating photoreceptor guanylyl cyclase. J Biol Chem. 1995;270:25200–25206. doi: 10.1074/jbc.270.42.25200. [DOI] [PubMed] [Google Scholar]
- 23.Gorczyca WA, Polans AS, Surgucheva IG, Subbaraya I, Baehr W, Palczewski K. Guanylyl cyclase activating protein. A calcium-sensitive regulator of phototransduction. J Biol Chem. 1995;270:22029–22036. doi: 10.1074/jbc.270.37.22029. [DOI] [PubMed] [Google Scholar]
- 24.Peshenko IV, Dizhoor AM. Guanylyl cyclase-activating proteins (GCAPs) are Ca2+/Mg2+ sensors: implications for photoreceptor guanylyl cyclase (RetGC) regulation in mammalian photoreceptors. J Biol Chem. 2004;279:16903–16906. doi: 10.1074/jbc.C400065200. [DOI] [PubMed] [Google Scholar]
- 25.Dizhoor AM, Boikov SG, Olshevskaya EV. Constitutive activation of photoreceptor guanylate cyclase by Y99C mutant of GCAP-1. Possible role in causing human autosomal dominant cone degeneration. J Biol Chem. 1998;273:17311–17314. doi: 10.1074/jbc.273.28.17311. [DOI] [PubMed] [Google Scholar]
- 26.Sokal I, Li N, Surgucheva I, Warren MJ, Payne AM, Bhattacharya SS, Baehr W, Palczewski K. GCAP1 (Y99C) mutant is constitutively active in autosomal dominant cone dystrophy. Mol Cell. 1998;2:129–133. doi: 10.1016/s1097-2765(00)80121-5. [DOI] [PubMed] [Google Scholar]
- 27.Woodruff ML, Olshevskaya EV, Savchenko AB, Peshenko IV, Barrett R, Bush RA, Sieving PA, Fain GL, Dizhoor AM. Constitutive excitation by Gly90Asp rhodopsin rescues rods from degeneration caused by elevated production of cGMP in the dark. J Neurosci. 2007;27:8805–8815. doi: 10.1523/JNEUROSCI.2751-07.2007. [DOI] [PMC free article] [PubMed] [Google Scholar]
- 28.Yang RB, Foster DC, Garbers DL, Fulle HJ. Two membrane forms of guanylyl cyclase found in the eye. Proc Natl Acad Sci U S A. 1995;92:602–606. doi: 10.1073/pnas.92.2.602. [DOI] [PMC free article] [PubMed] [Google Scholar]
- 29.Duda T, Goraczniak R, Surgucheva I, Rudnicka-Nawrot M, Gorczyca WA, Palczewski K, Sitaramayya A, Baehr W, Sharma RK. Calcium modulation of bovine photoreceptor guanylate cyclase. Biochemistry. 1996;35:8478–8482. doi: 10.1021/bi960752z. [DOI] [PubMed] [Google Scholar]
- 30.Garbers DL. The guanylyl cyclase receptors. Methods. 1999;19:477–484. doi: 10.1006/meth.1999.0890. [DOI] [PubMed] [Google Scholar]
- 31.Ramamurthy V, Tucker C, Wilkie SE, Daggett V, Hunt DM, Hurley JB. Interactions within the coiled-coil domain of RetGC-1 guanylyl cyclase are optimized for regulation rather than for high affinity. J Biol Chem. 2001;276:26218–26229. doi: 10.1074/jbc.M010495200. [DOI] [PubMed] [Google Scholar]
- 32.Tucker CL, Hurley JH, Miller TR, Hurley JB. Two amino acid substitutions convert a guanylyl cyclase, RetGC-1, into an adenylyl cyclase. Proc Natl Acad Sci U S A. 1998;95:5993–5997. doi: 10.1073/pnas.95.11.5993. [DOI] [PMC free article] [PubMed] [Google Scholar]
- 33.Liu Y, Ruoho AE, Rao VD, Hurley JH. Catalytic mechanism of the adenylyl and guanylyl cyclases: modeling and mutational analysis. Proc Natl Acad Sci U S A. 1997;94:13414–13419. doi: 10.1073/pnas.94.25.13414. [DOI] [PMC free article] [PubMed] [Google Scholar]
- 34.Perrault I, Rozet JM, Gerber S, Ghazi I, Ducroq D, Souied E, Leowski C, Bonnemaison M, Dufier JL, Munnich A, Kaplan J. Spectrum of retGC1 mutations in Leber’s congenital amaurosis. Eur J Hum Genet. 2000;8:578–582. doi: 10.1038/sj.ejhg.5200503. [DOI] [PubMed] [Google Scholar]
- 35.Perrault I, Rozet JM, Gerber S, Kelsell RE, Souied E, Cabot A, Hunt DM, Munnich A, Kaplan J. A retGC-1 mutation in autosomal dominant cone-rod dystrophy. Am J Hum Genet. 1998;63:651–654. doi: 10.1086/301985. [DOI] [PMC free article] [PubMed] [Google Scholar]
- 36.Hwang JY, Lange C, Helten A, Hoppner-Heitmann D, Duda T, Sharma RK, Koch KW. Regulatory modes of rod outer segment membrane guanylate cyclase differ in catalytic efficiency and Ca2+-sensitivity. Eur J Biochem. 2003;270:3814–3821. doi: 10.1046/j.1432-1033.2003.03770.x. [DOI] [PubMed] [Google Scholar]
- 37.Helten A, Saftel W, Koch KW. Expression level and activity profile of membrane bound guanylate cyclase type 2 in rod outer segments. J Neurochem. 2007;103:1439–46. doi: 10.1111/j.1471-4159.2007.04923.x. [DOI] [PubMed] [Google Scholar]
- 38.Aparicio JG, Applebury ML. The bovine photoreceptor outer segment guanylate cyclase: purification, kinetic properties, and molecular size. Protein Expr Purif. 1995;6:501–511. doi: 10.1006/prep.1995.1067. [DOI] [PubMed] [Google Scholar]
- 39.Duda T, Venkataraman V, Krishnan A, Sharma RK. Rod outer segment membrane guanylate cyclase type 1 (ROS-GC1) gene: structure, organization and regulation by phorbol ester, a protein kinase C activator. Mol Cell Biochem. 1998;189:63–70. doi: 10.1023/a:1006944629935. [DOI] [PubMed] [Google Scholar]
- 40.Peshenko IV, Moiseyev GP, Olshevskaya EV, Dizhoor AM. Factors that determine Ca2+ sensitivity of photoreceptor guanylyl cyclase. Kinetic analysis of the interaction between the Ca2+-bound and the Ca2+-free guanylyl cyclase activating proteins (GCAPs) and recombinant photoreceptor guanylyl cyclase 1 (RetGC-1) Biochemistry. 2004;43:13796–13804. doi: 10.1021/bi048943m. [DOI] [PubMed] [Google Scholar]
- 41.Nickell S, Park PS, Baumeister W, Palczewski K. Three-dimensional architecture of murine rod outer segments determined by cryoelectron tomography. J Cell Biol. 2007;177:917–925. doi: 10.1083/jcb.200612010. [DOI] [PMC free article] [PubMed] [Google Scholar]
- 42.Liang Y, Fotiadis D, Maeda T, Maeda A, Modzelewska A, Filipek S, Saperstein DA, Engel A, Palczewski K. Rhodopsin signaling and organization in heterozygote rhodopsin knockout mice. J Biol Chem. 2004;279:48189–48196. doi: 10.1074/jbc.M408362200. [DOI] [PMC free article] [PubMed] [Google Scholar]
- 43.Olshevskaya EV, Hughes RE, Hurley JB, Dizhoor AM. Calcium binding, but not a calcium-myristoyl switch, controls the ability of guanylyl cyclase-activating protein GCAP-2 to regulate photoreceptor guanylyl cyclase. J Biol Chem. 1997;272:14327–14333. doi: 10.1074/jbc.272.22.14327. [DOI] [PubMed] [Google Scholar]
- 44.Peshenko IV, Dizhoor AM. Activation and inhibition of photoreceptor guanylyl cyclase by guanylyl cyclase activating protein 1 (GCAP-1): the functional role of Mg2+/Ca2+ exchange in EF-hand domains. J Biol Chem. 2007;282:21645–21652. doi: 10.1074/jbc.M702368200. [DOI] [PMC free article] [PubMed] [Google Scholar]
- 45.Laura RP, Hurley JB. The kinase homology domain of retinal guanylyl cyclases 1 and 2 specifies the affinity and cooperativity of interaction with guanylyl cyclase activating protein-2. Biochemistry. 1998;37:11264–11271. doi: 10.1021/bi9809674. [DOI] [PubMed] [Google Scholar]
- 46.Tsien R, Pozzan T. Measurement of cytosolic free Ca2+ with quin2. Methods Enzymol. 1989;172:230–262. doi: 10.1016/s0076-6879(89)72017-6. [DOI] [PubMed] [Google Scholar]
- 47.Peshenko IV, Dizhoor AM. Ca2+ and Mg2+ binding properties of GCAP-1. Evidence that Mg2+-bound form is the physiological activator of photoreceptor guanylyl cyclase. J Biol Chem. 2006;281:23830–23841. doi: 10.1074/jbc.M600257200. [DOI] [PubMed] [Google Scholar]
- 48.Haeseleer F, Sokal I, Li N, Pettenati M, Rao N, Bronson D, Wechter R, Baehr W, Palczewski K. Molecular characterization of a third member of the guanylyl cyclase-activating protein subfamily. J Biol Chem. 1999;274:6526–6535. doi: 10.1074/jbc.274.10.6526. [DOI] [PubMed] [Google Scholar]
- 49.Lim S, Peshenko I, Dizhoor A, Ames JB. Effects of Ca2+, Mg2+, and myristoylation on guanylyl cyclase activating protein 1 structure and stability. Biochemistry. 2009;48:850–862. doi: 10.1021/bi801897p. [DOI] [PMC free article] [PubMed] [Google Scholar]
- 50.Chen C, Nakatani K, Koutalos Y. Free magnesium concentration in salamander photoreceptor outer segments. J Physiol. 2003;553:125–135. doi: 10.1113/jphysiol.2003.053280. [DOI] [PMC free article] [PubMed] [Google Scholar]
- 51.Gray-Keller MP, Detwiler PB. The calcium feedback signal in the phototransduction cascade of vertebrate rods. Neuron. 1994;13:849–861. doi: 10.1016/0896-6273(94)90251-8. [DOI] [PubMed] [Google Scholar]
- 52.Woodruff ML, Sampath AP, Matthews HR, Krasnoperova NV, Lem J, Fain GL. Measurement of cytoplasmic calcium concentration in the rods of wild-type and transducin knock-out mice. J Physiol. 2002;542:843–854. doi: 10.1113/jphysiol.2001.013987. [DOI] [PMC free article] [PubMed] [Google Scholar]
- 53.Tucker CL, Laura RP, Hurley JB. Domain-specific stabilization of photoreceptor membrane guanylyl cyclase by adenine nucleotides and guanylyl cyclase activating proteins (GCAPs) Biochemistry. 1997;36:11995–12000. doi: 10.1021/bi971212k. [DOI] [PubMed] [Google Scholar]
- 54.Yang RB, Garbers DL. Two eye guanylyl cyclases are expressed in the same photoreceptor cells and form homomers in preference to heteromers. J Biol Chem. 1997;272:13738–13742. doi: 10.1074/jbc.272.21.13738. [DOI] [PubMed] [Google Scholar]
- 55.Jeon CJ, Strettoi E, Masland RH. The major cell populations of the mouse retina. J Neurosci. 1998;18:8936–8946. doi: 10.1523/JNEUROSCI.18-21-08936.1998. [DOI] [PMC free article] [PubMed] [Google Scholar]
- 56.Daniele LL, Lillo C, Lyubarsky AL, Nikonov SS, Philp N, Mears AJ, Swaroop A, Williams DS, Pugh EN., Jr. Cone-like morphological, molecular, and electrophysiological features of the photoreceptors of the Nrl knockout mouse. Invest Ophthalmol Vis Sci. 2005;46:2156–2167. doi: 10.1167/iovs.04-1427. [DOI] [PMC free article] [PubMed] [Google Scholar]
- 57.Biernbaum MS, Bownds MD. Light-induced changes in GTP and ATP in frog rod photoreceptors. Comparison with recovery of dark current and light sensitivity during dark adaptation. J Gen Physiol. 1985;85:107–121. doi: 10.1085/jgp.85.1.107. [DOI] [PMC free article] [PubMed] [Google Scholar]
- 58.Okawa H, Sampath AP, Laughlin SB, Fain GL. ATP consumption by mammalian rod photoreceptors in darkness and in light. Curr Biol. 2008;18:1917–1921. doi: 10.1016/j.cub.2008.10.029. [DOI] [PMC free article] [PubMed] [Google Scholar]
- 59.Gray-Keller MP, Detwiler PB. The calcium feedback signal in the phototransduction cascade of vertebrate rods. Neuron. 1994;13:849–861. doi: 10.1016/0896-6273(94)90251-8. [DOI] [PubMed] [Google Scholar]
- 60.Woodruff ML, Sampath AP, Matthews HR, Krasnoperova NV, Lem J, Fain GL. Measurement of cytoplasmic calcium concentration in the rods of wild-type and transducin knock-out mice. J Physiol. 2002;542:843–854. doi: 10.1113/jphysiol.2001.013987. [DOI] [PMC free article] [PubMed] [Google Scholar]
- 61.Peshenko IV, Olshevskaya EV, Yao S, Ezzeldin HH, Pittler SJ, Dizhoor AM. Activation of retinal guanylyl cyclase RetGC1 by GCAP1: stoichiometry of binding and effect of new LCA-related mutations. Biochemistry. 2010;49:709–717. doi: 10.1021/bi901495y. [DOI] [PMC free article] [PubMed] [Google Scholar]
- 62.Duda T, Fik-Rymarkiewicz E, Venkataraman V, Krishnan R, Koch KW, Sharma RK. The calcium-sensor guanylate cyclase activating protein type 2 specific site in rod outer segment membrane guanylate cyclase type 1. Biochemistry. 2005;44:7336–7345. doi: 10.1021/bi050068x. [DOI] [PubMed] [Google Scholar]