


Abstract
Transcription factor activity is largely regulated through post-translational modification. Here, we report the first integrative model of transcription that includes both interactions between transcription factors and promoters, and between transcription factors and modifying enzymes. Simulations indicate that our method is robust against noise. We validated our tool on a well-studied stress response network in yeast and on a STAT1-mediated regulatory network in human B cells. Our work represents a significant step toward a comprehensive model of gene transcription.
INTRODUCTION
Transcription is a critical step in the expression of all gene products, and is coordinately regulated to induce broad changes in the cellular state. Eukaryotic gene transcription follows an elaborate sequence of events involving modification enzymes, transcription factors (TFs), co-factors and RNA polymerase (1–3). Constructing a comprehensive model of gene transcription that incorporates these various biological processes holds the potential to decipher systems-level behavior in the cell (4,5). A crucial component of transcriptional control relies on sequence-specific binding of TF proteins to short DNA sites in the relative vicinity of the target gene. However, an effective interaction between the TF and the gene's regulatory elements is critically mediated by other cellular processes and signaling pathways.
In response to various stimuli, cell signaling pathways relay information to the nucleus and alter the transcriptome, often via post-translational modification (PTM) of the TF proteins (6–10). Numerous types of chemical modifications of TF proteins have been documented, including phosphorylation (11), acetylation (12,13) and methylation (14). A classic example of PTM-mediated transcriptional regulation involves the TF CREB, which requires phosphorylation of serine at position 133 in order to promote transcription. This serine residue is targeted by multiple signaling pathways, and coordinates different transcriptional programs depending on other modified residues (8). In this way, PTM-dependent TFs act as ‘molecular switchboards’ mapping upstream signals to gene transcripts and ultimately coordinating complex cellular responses to internal and external stimuli (7,8).
For many TFs, the full cohort of regulatory PTMs and the modifying enzymes responsible for catalyzing their addition and removal are not known. However, new experimental techniques (15–17) now provide additional clues for this level of regulation. Given the importance of PTMs in determining TF activity and the eventual control of gene transcription, it is imperative that models of transcriptional regulatory networks incorporate PTMs and the mediating modification enzymes.
Most approaches to infer transcriptional regulatory networks consider only regulatory interactions, or ‘network edges’, between TFs and target genes, and do not include the modulators of these TF–gene interactions, such as modification enzymes [see (4,5,18) for recent reviews and (19–27) for specific examples]. Although a few computational methods have been developed to infer modulators of TF–gene interactions (28–34), none of these methods infer the target genes and upstream modifiers of a TF concurrently, nor do they integrate heterogeneous data sources.
Here we propose the first principled computational model of gene transcription that explicitly incorporates interactions between modifying enzymes and TFs, thus extending the prevalent view of TF–gene connectivity to modifier–TF–gene connectivity. Our method, called ‘Modification-dependent Network-based Transcriptional Estimator’ (MONSTER), combines expression compendia with other data sources indicative of physical interactions to simultaneously infer the target genes and upstream modifiers of each TF. We first use simulated data sets to demonstrate that our computational model and the parameter estimation procedure are robust against noise from a variety of sources. Next, we use a well-studied stress–response regulatory network in the model system Saccharomyces cerevisiae to demonstrate the accuracy of MONSTER on experimental data.
Finally, we apply MONSTER to investigate the STAT1-mediated regulatory network in human B cells. B cells play a critical role in adaptive immune response, and dysregulation of B cell networks can lead to a number of human diseases including autoimmune disorders (35), leukemias (36) and lymphomas (37). A highly pleiotropic TF, STAT1 is a critical mediator of B cell development and function and is subject to complex post-translational regulation (38–41). MONSTER predicts a module of STAT1 target genes and modifying enzymes active in B cells, which is well-supported by the STAT1 literature, and includes novel hypotheses about the role of STAT1 in specific signaling pathways.
MATERIALS AND METHODS
Overview of MONSTER network model
The computational problem addressed here is the inference of a regulatory network model that incorporates: (i) interactions between TFs and gene regulatory regions and (ii) interactions between TFs and their modifying enzymes. Here, we introduce the mathematical foundation of our model, which is represented graphically in Figure 1. We denote individual variables in italics and use bold font to denote corresponding vectors and matrices of variables (see Supplementary Tables S1 and S2 for a guide to our notation).
Figure 1.

Conceptual diagram of network model with relationships to model equations. Input data is shown in green and model parameters are shown in blue. Expression matrices g, f and h correspond to samples t for genes i, TFs j and enzymes k, respectively. Prior matrices b, m, a and s are derived from TF binding data, TF motif data, protein–protein interaction data and protein motif data, respectively. Model parameters include TF–Gene edges C and TF–modifier edges D, TF activities β, TF–modifier synergy terms γ, TF-specific prior weights w and modifier-specific prior weights u.
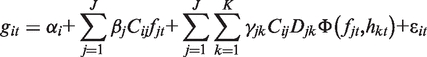
The primary input for our method is an expression compendium encompassing N target genes, J TFs and K modifiers, all across T sample conditions. We define the expression git of each target gene i in each condition t as a function of four additive components: (i) basal expression αi, (ii) direct influence from regulating TFs, (iii) synergistic influence from specific TF–modifier pairs and (iv) an error component εit encompassing technical and biological noise. These components are formally defined in the following equation:
 |
(1) |
We apply Equation (1) to all genes i from 1 to N and all samples t from 1 to T. The terms fjt and hkt denote the expression values of TFs j and modifiers k, respectively. Each TF j is assigned an ‘influence’ parameter βj, which describes the linear relationship between TF expression and target gene expression. Each TF–gene pair is assigned an ‘edge’ indicator variable Cij, such that Cij = 1 if TF j is a regulator of gene i and Cij = 0 otherwise. Thus, TF j only directly affects the subset of genes where Cij = 1. Modifiers differ from TFs in our model in that they do not influence target gene expression directly, but rather indirectly by modulating TF activity. In the second summation term, each TF–modifier pair (j,k) has an influence parameter γjk and an edge indicator variable Djk, analogous to the βj and Cij variables, respectively. All TF–modifier synergy effects are assumed to follow a non-linear function of the expression values, denoted by Φ. In this work we use a sign-corrected product, which is based on the biological intuition that synergistic effects require sufficient expression of both the TF and modifier to take effect (see Section 1 in Supplementary Data). Error parameters εit are assumed to be normally distributed with unknown model-wide variance σ2. The inference problem can now be approached as a probabilistic search for optimal parameters that minimize the error variance σ2.
We integrate additional knowledge of network structure by defining prior probabilities for the edge variables C and D. In particular, the C variables are given prior probabilities derived from a weighted combination of two sources:
| (2) |
In our applications, bij is a prior probability derived from ChIP-seq binding experiments for TF j and mij is a prior probability derived from scanning gene promoters with a positional weight matrix (PWM) describing the preferred binding sites of TF j. The weight parameter wj provides a way to dynamically determine the relative quality of prior knowledge for each TF. Similarly, priors for Djk are derived from additional data sources a and s, analogous to Equation (2):
| (3) |
Here, ajk is derived from protein–protein interactions and sjk is derived from PWMs describing modifier-specific substrate recognition motifs. Table 1 lists the data source we used in specific analyses. Note that when only a single type of prior is available for either C or D edge variables, then Equation (2) or (3) simplifies to using only the one available prior directly, without weighting.
Table 1.
Model inputs
| Variable(s) | Summary | Data type | References |
|---|---|---|---|
| Yeast application | |||
| g, f and h | Compendium of yeast microarray experiments | Gene expression | (24) |
| m | MSN2/4 binding sites | PWM | (47) |
| a | Yeast kinase substrate profilesa | PWM | (53) |
| Human B-cell application | |||
| g, f and h | Human B cells, B cell-derived cancers and cell lines | Affymetrix HGU95A gene expression | GEO:GSE2350 (44) |
| b | STAT1 ChIP-seq in IFN-γ-treated HeLa S3 cell line | Illumina DNA sequence reads | GEO:GSE12782 (51) |
| m | STAT1 binding sites in response to IFN-α/β (ISRE) | PWM | TRANSFAC: M00258 (48) |
| m | STAT binding sites in response to IFN-γ (GAS) | PWM | (49) |
| a | STRING Database, ‘experimental’ and ‘pathway’ channelsb | Protein–protein interactions | (54) |
Data sources used as input for model applications, organized by application and model variable. All relevant literature citations and database accessions are shown in the ‘References’ column.
aWe found that corresponding interactions in STRING were too sparse for this application.
bIn order to include a larger set of modifying enzymes, we did not rely on kinase-specific profiles for this application.
Summary of model-fitting procedure
Given the expression data and the priors, we estimate the posterior probabilities for all model parameters. We used a variable-selection linear regression model as defined in Equations (1–3), extending the model described by Chen et al. (24). Our overall estimation procedure is conceptually similar to Gibbs Sampling (42), but is more localized in its exploration of the solution space, and therefore more tractable for large networks. In order to estimate the posterior probability of the model, we performed multiple replicates of a novel heuristic model-fitting procedure. We initialized this procedure by selecting a network based solely on the prior probabilities. We then fit all numeric parameters to this initial network using linear regression. From this initial model state we iteratively maximized the individual posterior probabilities of each variable conditioned on the current values of all other variables. After converging on a local maximum, we repeatedly resample the edge indicator variables (C, D and γ) in order to specifically estimate the network posterior probabilities. Once estimated, the posterior probabilities of C and D can be used to probabilistically infer a network with connectivity between target genes, TFs and modifying enzymes. In addition, the best-fit values of other parameters such as β and γ can be used to infer the strength and directionality of these interactions. Multiple replicates of the model-fitting procedure were averaged together for increased robustness, if they corresponded to similar networks. Further details and equations are provided in Section 1 in Supplementary Data.
Detecting multiple alternative network models
Our model is generally over-parameterized relative to the available data and it is possible for MONSTER to find multiple model-fitting solutions that encompass completely different networks. Network models predicted by replicate runs of our model-fitting method were analyzed by hierarchical clustering (43) to check for the occurrence of multiple solution modes (see Section 1 in Supplementary Data). Resulting dendrograms were visually inspected for the presence of well-separated clusters. In the case of the STAT1 network, three well-separated solution modes were observed, and we analyzed the models corresponding to similar networks separately (see Section 5 in Supplementary Data).
Data simulation
Input data matrices (g, f, h, b, m, a, s) were simulated for a network containing N = 200 target genes, J = 10 TFs and K = 100 modifiers measured under T = 100 conditions. Network parameters and expression values in f and h were sampled at random. Expression data for g was then computed using Equation (1), with εit terms randomly sampled for σ2 ranging from 0 to 1. Noisy prior probabilities (b, m, a, s) were randomly sampled to be informative, but also noisy and insufficient to predict the network structure exactly. Data simulation is fully described in Section 2 in Supplementary Data.
Data pre-processing and normalization
The input data variables (g, f, h) are derived from a compendium of microarray experiments in both the yeast and human applications (Table 1). The yeast expression compendium was previously compiled and normalized by Chen et al. (24). This compendium includes 314 samples compiled from 18 studies covering a diverse set of conditions such as cellular stresses and cell cycle phases. The expression compendium for human B cells and related cancers (44) was downloaded in Affymetrix HGU95A raw format and processed with RMA (45) in BioConductor (46). This compendium includes 336 samples from 62 different human B cell sources, including 39 cell lines. Both yeast and human gene expression profiles were further normalized such that each profile had a mean of 0 and 1 SD on the log-scale. This final normalization strengthens the model assumption that residual error terms follow a normal distribution with 0 mean and model-wide variance. Some expression profiles corresponding to the same TF or modifying enzyme were combined as described in Section 2 in Supplementary Data.
TF–gene priors m were calculated using PWMs for both the yeast and STAT1 analyses. PWMs for yeast MSN2 and MSN4, previously generated by Harbison et al. (47), were scanned against the 700 bp upstream region of each gene. Two separate PWMs for STAT1 corresponding to ISRE (48) and GAS sites (49) were both scanned against the 1-kb upstream regions of each target gene. In all cases, the most significant PWM P-value (50) in each promoter was converted to a prior probability (24).
Additional TF–gene priors b were derived for the human B cell application. We processed the reads from STAT1 ChIP-seq in IFN-γ-treated HeLa S3 cells (51) with GLITR (52). Peak scores were compared to input controls and converted to probabilities (see Section 2 in Supplementary Data). TF–target gene priors b were calculated as the maximum peak probability within the 1 kb upstream region of each gene transcription start site.
In both the yeast and human applications, a single matrix was used for the prior probabilities of TF–modifier interactions. For the yeast application, only kinases were considered as candidate modifiers, and a PWM describing the substrate specificity of each kinase was calculated using the Predikin web server (53). Each PWM was scanned across the entire protein sequence of each TF to compute prior probabilities s using the same general method as for TF binding site PWMs (24). For the human B cell application, TF–modifier prior matrix a for all kinases and phosphatases were derived from the STRING database using only the channels corresponding to ‘experimental evidence’ and ‘pathway’ sources in order to focus on physical, rather than functional, associations (54). Further details on all data pre-processing methods are described in Section 2 in Supplementary Data.
Human B cell expression shuffling control
The expression profiles (rows) in g, f and h were each shuffled randomly to disrupt any biological regulatory signal in the data. We then repeated our model-fitting method 10 times, using the same prior probabilities in m, b and a, and averaged together the model results. We repeated this entire procedure 10 times and compared the distributions of model parameters across all shuffled models to those in the primary STAT1 model.
MINDY analysis
As a comparison, we also analyzed the expression data listed in Table 1 using MINDY v2.0 (10/28/07) (30), obtained from the authors’ website. We ran the algorithm using the same expression profiles as for MONSTER in both applications, using no thresholds, and default values for all other parameters. We first used the global MI value to score each TF–gene edge i,j. We then selected a number of top genes for each TF comparable to the number of genes predicted by MONSTER and used the maximum absolute ΔMI value over these genes to score each TF–modifier edge j,k. In the yeast application, we computed an ROC curve for the global MI values based on the known targets of MSN2/4, and ranked all kinases based on the max ΔMI score for either MSN2 or MSN4. In the human B cell application, we ranked all STAT1 target genes and modifiers based on the MINDY scores, and selected the same number of targets and modifiers as in the primary STAT1 network predicted by MONSTER.
Functional enrichment analysis
Functional enrichment analysis of putative STAT1 target genes was performed using a hypergeometric test on each available annotation using the BioConductor package ‘GOstats’ (46). We excluded all GO terms one or two levels below the ontology root, as these tend to be the broadest and least informative. As a comparison to individual data sources, we selected the same number of probe sets predicted by MONSTER from lists of target genes ranked by each of the input data sets alone, and by the MINDY analysis. We then repeated the enrichment analysis for each of these lists, tabulated the enriched terms for all lists and applied Bonferroni correction for multiple testing (55). We reported all terms for which the corrected P-value is <0.05 in at least one of the target gene lists. P-values that were >1 after Bonferroni correction are reported as ‘—’.
RESULTS
MONSTER infers simulated networks with high accuracy and is robust against noise
We first evaluated our model-fitting procedure using simulations. We generated a random network of genes, TFs and modifiers, and simulated noisy expression data from Equation (1). We also simulated noisy priors, as described in Section 2 in Supplementary Data. Given the simulated data, we estimated the posterior probabilities of all model parameters using our model-fitting method. We visualized the performance of estimated posterior probabilities C and D using a Receiver Operating Characteristic (ROC) curve, and quantified the accuracy by the area under the curve (AUC) metric. We found that MONSTER perfectly recovered the TF–gene edges (AUC = 1), out-performing the simulated priors and the TF–gene expression correlation (AUCs < 0.75, Supplementary Figure S1A). TF–modifier edges were harder to infer, owing to their indirect effect on gene expression. However, MONSTER predicted these edges with greater accuracy (AUC = 0.78) than either simulated prior type alone (AUCs < 0.7, Supplementary Figure S1B). We further assessed the effect of various types of noise on the accuracy of MONSTER. We simulated three sources of noise: (i) individual expression values, (ii) the inclusion of additional genes unconnected to the network and (iii) the inclusion of additional, uninformative expression samples (Supplementary Figure S1C–E). Only the noise from source (iii) had any effect on model accuracy, and in all cases MONSTER remained more accurate than each individual data type alone. Based on our detailed simulation studies, we conclude that our model-fitting method can reconstruct an underlying network model despite substantial noise, and with greater accuracy than the individual input data sources. A complete description of our simulated data analysis is provided in Supplementary Data, Section 3.
MONSTER accurately predicts target genes and upstream kinases for stress response regulators MSN2/4 in S. cerevisiae
To assess the utility of our model for biological inference from experimental data, we applied MONSTER to a well-studied stress response network in the yeast S. cerevisiae. We chose a network based around the TFs MSN2 and MSN4 in order to validate against existing knowledge of target genes (9,56) and upstream signaling components (9,57,58) for these two TFs. MSN2/4 function redundantly to regulate a core transcriptional response to most cellular stresses (59,60). Both TFs are regulated primarily at the post-translational level, with various kinases controlling their nuclear localization (57,58). We prepared an input data set as summarized in Table 1. From a compendium of 314 microarray samples (24), we extracted expression profiles for the following genes: (i) the genes encoding MSN2 and MSN4, (ii) 40 known MSN2/4 target genes, compiled in the PTM-Switchboard database (9), (iii) all 81 yeast kinase genes with available expression profiles in the compendium (24) and (iv) 40 additional ‘decoy’ target genes selected at random from the remaining expression data, ensuring that no decoy gene had any Gene Ontology (GO) (61) annotation suggesting involvement in stress response (Supplementary Table S3). We used PWMs for MSN2 and MSN4 from (47) to derive TF–gene edge priors m and we used protein PWMs for each kinase derived from the Predikin server (53) to derive TF–modifier edge priors s.
We used MONSTER to fit all model parameters to the network of 80 target genes, 2 TFs and 81 modifiers. We first assessed the accuracy with which MONSTER predicted known target genes for both MSN2 and MSN4. We constructed a ROC curve measuring the overall separation of true and decoy target genes using the MONSTER posterior edge probabilities C. For comparison, we assessed how accurately the MSN2/4 targets could be predicted using either the PWM-based prior probabilities alone, or the TF–gene expression correlations. In addition, we compared the performance of MONSTER with a previously published tool—MINDY, which uses TF–gene expression mutual information (MI) to predict the TF targets (30). For each of the three alternative approaches, we computed the ROC curve and AUC (Figure 2). We found that the posterior edge probabilities estimated by our model had the highest AUC (0.87), indicating the best separation of true and false TF–gene edges. Thus, in predicting the TF–gene network, MONSTER provides a significant improvement over each individual data source used as input (bootstrap P = 0.005), and a significant improvement over the expression-based MINDY method (bootstrap P < 10−5). For example, at 10% false positive rate, MINDY correctly predicts 29% of the targets while MONSTER was able to correctly predict 78% of the targets—a 2.7-fold improvement.
Figure 2.

ROC curves of MSN2/4 target gene selection in yeast network models. Curves are drawn by computing the sensitivity and specificity from known and decoy target genes at all possible thresholds for: (i) the magnitude of correlation between TF and target gene expression profiles (dashed blue line, AUC = 0.63); (ii) the prior probabilities m derived from PWMs (dotted blue line, AUC = 0.73); (iii) the posterior probabilities from MONSTER with no kinases (solid blue line, AUC = 0.82); (iv) the posterior probabilities from MONSTER with TF-kinase synergy terms (solid green lines, AUC = 0.87) and (v) the global MI estimated by MINDY (solid red line, AUC = 0.6). The difference between the AUC values for the MONSTER models with and without kinases is significant with P-value = 0.0018 based on bootstrap tests.
We next assessed the accuracy with which MONSTER identified known modifiers of TF activity. MSN2/4 are regulated in response to a wide range of cellular conditions (57,59) and many of the kinases in our input data are likely to have some indirect effect on MSN2/4 activity. However, there is a small set of kinases in our input data that have experimental evidence for direct regulation of MSN2/4 proteins, specifically PKA (58,62,63), SNF1 (57), RIM11/GSK3 (64), SSN3 (65) and YAK1 (66) (Table 2). MONSTER estimated significantly higher posterior probabilities D and influence parameters γ for these known kinases, as compared to all other input kinases (Mann–Whitney test P = 0.007 for D, P = 0.047 for |γ|). By comparison, neither the prior probability alone [based on the Predikin tool (53)], nor a ranking based on the MINDY (30) analysis (see ‘Materials and Methods’ section), significantly favors the known kinases modifying MSN2/4 activity. Furthermore, the rankings of the known kinases based on MONSTER analysis are significantly better than the rankings based on either Predikin alone (Mann–Whitney P = 0.047) or the MINDY results (P = 0.036). Finally, we also show that the inclusion of kinases in the model significantly improves the accuracy of MSN2/4 target prediction (Supplementary Table S4, bootstrap P = 0.0018; see Section 4 in Supplementary Data). We also performed 5-fold cross-validation and found that the inclusion of kinases in our model does not increase the tendency for over-fitting, despite the increase in the number of parameters (see Section 4 in Supplementary Data).
Table 2.
Known MSN2/4-regulating kinases
| Known kinases |
MONSTER results |
Predikin |
MINDY |
||||||
|---|---|---|---|---|---|---|---|---|---|
| Symbol | Reference(s) | Role | P(Djk = 1) | γjk | Rank | Prior | Rank | Max(ΔMI) | Rank |
| TPK1 | (58,62,63) | − | 0.59 | 0.10 | 30 | 0.81 | 35 | 0.18 | 50 |
| TPK2 | (58,62,63) | − | 0.97 | −0.13 | 7 | 0.82 | 35 | 0.18 | 55 |
| TPK3 | (58,62,63) | − | 0.90 | 0.07 | 14 | 0.82 | 35 | 0.23 | 16 |
| SNF1 | (57) | − | 0.73 | 0.07 | 22 | 0.95 | 10 | 0.29 | 4 |
| RIM11 | (64) | + | 1.00 | 0.22 | 1 | 0.85 | 32 | 0.18 | 49 |
| SSN3 | (65) | − | 0.54 | 0.06 | 34 | 0.85 | 10 | 0.15 | 73 |
| YAK1 | (66) | + | 0.58 | 0.09 | 31 | 0.58 | 60 | 0.18 | 52 |
Kinases known to regulate MSN2/4 (columns 1–3) with corresponding results from MONSTER applied to yeast input data (columns 4–6). MONSTER results are reported for the TF with the highest posterior of connectivity to each kinase. Results include the posterior probability P(Djk = 1), the associated influence parameter γjk and the rank (out of 81) of the posterior among all kinase connections to the TF. For comparison, the prior probability and rank of this TF-kinase connection are shown in columns 7 and 8. The maximum differential MI predicted by MINDY and the corresponding rank are shown in columns 9 and 10. Overall, the rankings from MONSTER for these known kinases (column 6) are significantly better than the rankings from Predikin (column 8, Mann–Whitney P = 0.047) and the rankings from MINDY (column 10, Mann–Whitney P = 0.036).
A modification-dependent regulatory network mediated by STAT1 in human B cells
STAT1 is a highly pleiotropic TF known to mediate cellular responses to a broad range of cytokines and growth factors in many human tissues, and improper STAT1 activity is implicated in human immune disorders and cancers (39–41). Although the mechanistic details of STAT1 regulation in many of these processes are not known, it is now clear that a variety of upstream signals converge at STAT1 and evidence for regulation by a wide range of signaling pathways continues to grow (38–40). To gain a better mechanistic understanding of STAT1's pleiotropic function, additional knowledge is needed regarding the modifying enzymes targeting STAT1 and their influence on the expression of specific STAT1 target genes.
The STAT1-mediated regulatory network is a particularly attractive application for MONSTER due to the availability of a variety of relevant high throughput datasets (Table 1). We obtained the model input expression matrices g, f and h from a compendium of 336 expression samples from human B cells, related cancers and cell lines (44). We merged highly correlated probe sets corresponding to the same TF or modifier, but many target genes and modifiers are represented by multiple probe sets in this analysis.
We derived the TF–gene prior matrix b from a ChIP-seq experiment for STAT1 binding in response to IFN-γ (51). We derived the TF–gene prior matrix m by analyzing gene promoters with two STAT1 PWMs related to IFN-α/β and -γ response elements (48,49). In this initial application, we considered only modifiers related to phosphorylation (kinases and phosphatases), which is known to be the primary regulator of STAT1 activity (38), and derived a single TF–modifier prior matrix a from the STRING database (54). Details of data pre-processing are described in Section 2 in Supplementary Data. We then applied MONSTER to input data covering 7026 target genes, 1 TF (STAT1) and 323 modifiers (kinases and phosphatases).
Consistent with a pleiotropic role for STAT1, and the fact that our expression data covers a wide range of network perturbations, MONSTER predicted three distinct network models. We analyzed the statistical and functional properties of all three models (see Section 5 in Supplementary Data). For brevity, here we present the ‘primary’ network model, which was the most balanced in terms of its fit to all input data sources, and which predicted the most likely set of target genes under active STAT1 regulation in B cells.
Our primary STAT1 network model predicts that STAT1 regulates the transcription of 1559 input genes. As shown in Figure 3A, the predicted target genes generally have a greater expression correlation with STAT1 than the remaining input genes. The same is true when we compare the priors b and m for the predicted target genes against all remaining input genes (Figure 3B and C). However, none of these properties, by themselves, accurately discriminate the same set of target genes predicted by MONSTER. Therefore, the model-based prediction of network edges integrates the information embedded in the priors and the expression data. Interestingly, the model correctly predicts STAT1 as an activator, rather than repressor, of these target genes (38,40).
Figure 3.

Network edge properties of predicted STAT1 target genes. Histograms for STAT1 target genes predicted by the primary network model (black filled bars) and all other input target genes (white filled bars with black outline). Distributions are shown for (A) absolute correlations between STAT1 and target gene expression profiles across all input samples, (B) ChIP-seq-based prior probabilities for STAT1 binding in the gene's proximal promoter and (C) PWM-based prior probabilities for STAT1 binding in the gene's proximal promoter.
We first determined whether the predicted targets are enriched for known targets of STAT1. Robertson et al. (49) compiled a list of experimentally verified direct targets of STAT1, including 23 genes in our input data. Of these, 18 (78%) were predicted by MONSTER (Supplementary Table S5, hypergeometric test enrichment P = 1.7 × 10⁻⁸). The network of target genes is also enriched for GO (61) and KEGG Pathway (67) annotations relevant to both STAT1 and B cell functions (Table 3). As in the yeast application, we compared the MONSTER predictions with those obtained using individual priors, using STAT1-gene expression correlation, or by applying the MINDY tool (30). Many of the annotations enriched among the MONSTER predicted genes are not significantly enriched among the same number of target genes predicted by the alternative methods, including MINDY (Table 3, right-hand columns).
Table 3.
Annotation enrichment for predicted STAT1 target genes
| GO biological process | MONSTER | Expr | ChIP-Seq | PWM | MINDY |
|---|---|---|---|---|---|
| Signal transduction | 6E-08 | – | – | – | – |
| Regulation of I-kappaB kinase/NF-kappaB cascade | 7E-06 | – | – | – | – |
| Regulation of signal transduction | 5E-05 | – | – | – | – |
| I-kappaB kinase/NF-kappaB cascade | 2E-04 | – | – | – | – |
| Inflammatory response | 4E-04 | – | – | 0.049 | – |
| Positive regulation of I-kappaB kinase/NF-kappaB cascade | 4E-04 | – | – | – | – |
| Intracellular signaling cascade | 7E-04 | – | – | – | – |
| Response to wounding | 8E-04 | – | – | 0.351 | – |
| Cell death | 0.002 | – | – | – | – |
| Response to virus | 0.003 | – | – | – | – |
| Protein kinase cascade | 0.004 | – | – | – | – |
| Programmed cell death | 0.005 | – | – | – | – |
| Apoptosis | 0.007 | – | – | – | – |
| Negative regulation of biological process | 0.010 | – | – | – | – |
| Biopolymer metabolic process | – | – | 3E-07 | – | 0.027 |
| Nucleobase, nucleoside, nucleotide and nucleic acid metabolic process | – | – | 2E-06 | – | 0.003 |
| RNA metabolic process | – | – | 0.006 | – | – |
| Regulation of cellular metabolic process | – | – | 0.007 | – | – |
| Regulation of nucleobase, nucleoside, nucleotide and nucleic acid metabolic process | – | – | 0.016 | – | – |
| Response to DNA damage stimulus | – | – | 0.038 | – | 0.340 |
| DNA metabolic process | – | – | 0.607 | – | – |
| DNA replication | – | – | – | – | 0.004 |
| KEGG PATHWAY | |||||
| Leukocyte transendothelial migration | 3E-07 | – | – | – | – |
| Focal adhesion | 1E-05 | – | – | – | – |
| Cell adhesion molecules (CAMs) | 0.009 | – | – | – | – |
| T-cell receptor signaling pathway | 0.010 | 0.839 | – | – | – |
| Cytokine–cytokine receptor interaction | 0.012 | – | – | – | – |
| ECM–receptor interaction | 0.020 | – | – | – | – |
| Pyrimidine metabolism | – | – | – | – | 3E-04 |
| RNA polymerase | – | – | – | – | 0.049 |
| Purine metabolism | – | – | – | – | 0.049 |
Significantly enriched terms (1st column) for gene targets in primary STAT1 network, using all gene targets in the input data as the background, with Bonferroni-corrected P-values (2nd column). As a control, corrected P-values are also shown for the most correlated genes (3rd column), genes with the highest ChIP-seq and PWM-based priors (4th and 5th columns), and genes with the highest MINDY score (6th column). P-values that were ≥1 after Bonferroni-correction are listed as ‘−’, and all other P-values greater than 0.05 are italicized to indicate lack of significance.
Our network model also predicts 20 kinases and 1 phosphatase (Figure 4) as upstream regulators of STAT1 activity, including all 4 members of the Janus Kinase family, which are well-characterized activators of the STAT TF family (40). Based on the γ values, the most influential modifier in our STAT1 network model is JAK1, which has experimentally characterized roles in both Types I and II interferon signal transduction through STAT1 (41). Additional literature supporting each predicted modifier is summarized in Supplementary Table S6. Overall, 18 (86%) of the predicted modifiers have existing evidence for specific regulation of STAT1 transcriptional activity. By comparison, only 30% of the top modifiers predicted by MINDY are currently supported by literature evidence (Supplementary Table S7). MINDY did not predict any of the well-characterized JAKs as highly ranked STAT1 modifiers; JAK1 ranked 142 out of 510, and was the most highly ranked JAK in the MINDY analysis.
Figure 4.

STAT1 modifiers predicted by MONSTER primary network model. All predicted modifiers have P(Djk = 1) > 0.9 and |γjk| > 0.05 and are ordered by decreasing |γjk|. DUSP3 and LCK are modeled by multiple, uncorrelated probe sets and therefore have multiple γjk parameters.
While MONSTER predicts kinases reasonably well, it predicts only a few phosphatases. A well-characterized phosphatase modifier of STAT1—TC-PTP/TC45 (68) (referred to by the alias PTPN2 in our data set)—was predicted by our model, but did not have a strong enough absolute gamma factor to make our list of high-confidence STAT1 modifiers. An overall paucity of predicted phosphatases is likely because phosphatases are relatively under-studied compared to kinases, and may have inherently less functional specificity, leading to sparse and less informative priors. MINDY does not utilize the prior knowledge and relies solely on expression data. As a result, while MINDY predicts three known phosphatases (but also fails to predict the well-characterized TC-PTP/TC45/PTPN2), it also predicts four phosphatases with no evidence of modifying STAT1 (43% specificity).
As a control, we repeatedly shuffled the expression values within each gene profile and recomputed the MONSTER network model. In all cases, the shuffled model predicted fewer target genes and upstream modifiers for STAT1, with weaker β and γ influence parameters (Figure 5). This control empirically demonstrates that our predicted network is the result of coherent signal in both the expression and network prior data.
Figure 5.

Primary STAT1 network model versus shuffled expression controls. Distributions of model parameters for primary STAT1 network (black filled bars) and for the networks obtained from randomly shuffled expression data (white filled bars with black outline) for: (A) STAT1–gene posterior probabilities, (B) STAT1–modifier posterior probabilities, (C) STAT1 βj parameters and (D) STAT1–modifier γjk magnitudes.
We expect the predicted modifiers of STAT1 to be functionally linked to the predicted targets of STAT1. To test this, we first extracted functional association scores from the STRING database (54) for all pairs (i,k) containing a target gene and a modifier from our input data. However, to avoid any biases due to a greater expression similarity between the target gene and the modifier, we excluded the ‘co-expression’ channel and recomputed the STRING scores. We found that the pairs for which gene i and modifier k were both predicted as part of the STAT1-mediated network overlapped significantly with pairs predicted to have functional associations by STRING (Fisher exact test P < 2.2 × 10⁻¹⁶). Furthermore, the distribution of defined STRING association scores was higher for network pairs predicted by MONSTER (Supplementary Figure S2, Mann–Whitney test P < 2.2 × 10⁻¹⁶).
DISCUSSION
In this work, we have presented a novel model-based method to infer regulatory networks—MONSTER—that simultaneously predicts TF–gene and TF–modifier interactions by integrating heterogeneous data types in a probabilistic framework. Our simulation studies show that MONSTER is robust against a variety of noise sources. We have further demonstrated the validity and usefulness of our method through applications to a stress response network in S. cerevisiae and a STAT1-mediated network in human B cells.
MONSTER is an accurate and practical tool for inferring modification-dependent regulatory interactions
A fundamental challenge in computational biology is to construct models that are both biologically comprehensive and computationally tractable. The TF–modifier interactions capture a critical and oft ignored aspect of transcriptional regulatory networks, but also render the model highly parameterized. As a result, the exploration of possible models presents a computational and statistical challenge.
Chen et al. (24) used a similar—but simpler—model and were able to estimate the joint posterior distribution over all parameters using standard Gibbs Sampling (42). Our model is substantially more complex due to the additional network layer of TF–modifier connectivity, and we were unable to accurately estimate posterior probabilities using Gibbs Sampling (data not shown). As a practical alternative, we fit the model parameters using a heuristic that identifies a sufficiently good solution for biological inference in the cases studied here. In general terms, MONSTER leverages the prior knowledge of network structure, and combines the merits of both maximization and sampling approaches.
In certain instances, replicate runs can produce distinct networks. In the B-cell application, clustering the network parameters estimated from individual runs revealed three distinct networks. It is possible that all three predicted networks are correct, and capture distinct biological roles of STAT1 (see Section 5 in Supplementary Data). Given the apparent biological validity of our model, and the general challenges it presents for standard model-fitting procedures, further work is merited to explore alternate methods for model estimation and summarization of multiple network structure predictions.
Approximating TF and modifying enzyme activities from their transcript levels
MONSTER relies on an assumption common to most expression-based network inference methods—that TF and modifier transcript levels are indicative of their relative activity (4,5,22,24,30,44). The validity of this assumption is known to vary widely between different TFs (69), and is also likely to vary for each modifier. Our model improves the estimate of TF activity through the use of TF–modifier synergy effects, exemplified by the results obtained for yeast MSN2/4. Specifically, MONSTER identifies known targets of MSN2/4 with improved accuracy when using the full model with TF–modifier synergistic effects.
Our initial results also suggest that, when observed over a sufficient number of conditions, there is substantial biological signal in the expression profiles of modifying enzymes. In the yeast application, the expression level of the known MSN2/4 modifier TPK1 varied 78-fold across the included conditions. Similarly, expression of JAK1 varied 14-fold across the B cell samples. Although many modifying enzymes are regulated at the post-translational level, there seems to be significant perturbation occurring at the transcript level, which is likely to affect their signaling activity.
Accurate prediction of TF–modifier edges is particularly challenging. It is possible that modifiers with lower transcript variability may go undetected by our model. This reduced variability in expression can be partly mitigated by having a larger and/or different set of expression samples, as well as more accurate TF–modifier priors. Therefore, the sensitivity of modifier prediction is reduced, in part, by the available data, and does not necessarily reflect an inherent limitation of our method.
Interpreting the TF–modifier effect parameter γ
In addition to assigning a posterior probability for each TF–modifier interaction, we also estimate an influence parameter γ. The magnitude of this parameter can be used as an additional filter for the inference of TF–modifier interactions that affect gene transcription. In our yeast application, the magnitudes of γ parameter for the known MSN2/4-regulating kinases were all >0.05, and were significantly larger compared to the other kinases (Mann–Whitney P = 0.047, Table 2). In our human B cell application, JAK1 is known to be a highly influential regulator of both IFN-α/β and IFN-γ-dependent STAT1 activity (41), and also has the strongest effect on STAT1 (γ = 0.29) in our primary STAT1 network model.
The sign of each γ parameter potentially provides information on whether the modifier up- or downregulates the activity of the target TF. For example, in our yeast application, the γ values associated with several known modifiers are consistent with their known inhibitory or activating roles (Table 2). The primary STAT1 network model correctly identifies JAK1 (γ = 0.29), TYK2 (γ = 0.08) and JAK2 (γ = 0.05) as positive regulators of STAT1 activity (41). Many of the other γ parameter values for predicted STAT1 modifiers are supported by literature evidence (Supplementary Table S6). MONSTER predicts a negative γ value for JAK3. In absence of experimental evidence to support this, we can only speculate that JAK3 may negatively regulate STAT1 activity. However, an alternative explanation may be that the model is fit to steady state expression values, and therefore cannot capture any feedback loops that may alter the observed relationship between modifier and TF. Therefore, while MONSTER accurately infers TF–modifier edges, the dynamics of these regulatory relationships need to be further scrutinized under specific experimental conditions.
MONSTER provides biological insights into the STAT1 network in human B cells
MONSTER predicted a large module of target genes regulated by STAT1 in human B cells. This module is significantly enriched for known direct targets of STAT1. Moreover, the genes in the module are enriched for GO biological processes relevant to STAT1, such as ‘apoptosis’ (70) and ‘I-kappaB kinase/NF-kappaB cascade’ (71). Other enriched GO terms suggest general STAT1 and B cell functions, i.e. ‘response to virus’ and ‘inflammatory response’ (Table 3). Importantly, many of these annotations are not enriched among the top target genes as predicted by ChIP-seq, PWM or expression correlation analysis alone. Overall the functional enrichment analysis of predicted target genes support the relevance of our network model to the TF and cell type we analyzed.
The primary STAT1 network model inferred by MONSTER also provides a compelling list of potential STAT1 modifiers, including known, suspected and novel regulators of STAT1 transcriptional activity. Many of the STAT1 modifiers predicted by MONSTER are annotated for pathways related to the immune system, while STAT1 interaction partners predicted only by STRING are not (Supplementary Table S8). However, there are relatively few modifiers predicted by either method, as is expected, and many of these modifiers are poorly annotated, limiting our ability to reliably assess the statistical significance of this observation. Overall, 86% of our predicted modifiers are supported by literature evidence (Supplementary Table S6), with the exception of several novel predictions discussed below.
MONSTER predicts a novel association between the dual-specificity phosphatase DUSP3/VHR and STAT1 transcriptional activity. This phosphatase has been shown to dephosphorylate STAT5 in interferon signaling (72) and inactivate Erk2 and Jnk downstream of the T cell antigen receptor (73). VH1, the vaccinia virus homolog of DUSP3, is known to block STAT1 activation during infection (74). However, our analysis is the first to suggest a link between endogenous DUSP3 and STAT1 transcriptional control.
MONSTER also predicts Receptor-Interacting Protein Kinase 1 (RIPK1) as a modifier of STAT1 transcriptional activity. RIPK1 is a kinase known to interact with TNF receptor 1 (TNFR1) resulting in a switch between the pro-apoptotic and anti-apoptotic responses to TNF-α. Experiments in 293T cells have shown that STAT1 can competitively bind TNFR1, displacing the interaction with RIPK1, and disrupting downstream signaling through the NF-κB pathway independent of STAT1 nuclear import or DNA binding (71). Cancer progression models in mice have shown that TNF-α can suppress tumor growth in a STAT1-dependent manner (75). Our model is the first to suggest that RIPK1 may antagonize signaling through STAT1 in a way that affects STAT1 target gene transcription. In combination with the predicted STAT1 target genes related to apoptosis and NF-κB signaling (Table 3), our network suggests a critical role for STAT1 in balancing the pro-apoptotic and pro-survival responses to TNF-α in tumor progression.
Comparison to alternative methods
A comprehensive model-based approach to predict both the downstream targets as well as the upstream regulators of a TF has not been previously reported. However, the individual prior sources used as input to our model constitute methods for predicting either target genes or TF modifiers, and therefore provide a reasonable point of comparison for each of these types of predictions in our model. Furthermore, the MINDY algorithm (30), an extension of the popular ARACNE algorithm for network inference (22), can be used to simultaneously predict target genes and modifiers for a TF, although it differs from MONSTER in two critical ways: (i) MINDY scores individual modifier–TF–gene triplets using ΔMI, rather than constructing a comprehensive network model and (ii) MINDY relies solely on expression data and does not take advantage of the additional data sources used for the MONSTER analysis. However, it is one of the closest available algorithms to our application in terms of functionality, and therefore was a reasonable choice for comparison.
In the yeast application, we found that MONSTER significantly out-performed MINDY in terms of predicting both known MSN2/4 target genes and known MSN2/4 modifying kinases. Based on the AUC metric, MINDY predicted MSN2/4 target genes with approximately the same accuracy as expression correlation, which is not surprising given that both measures are based on the same underlying data. At a false positive rate of 10%, MONSTER predicted more than twice as many correct MSN2/4 target genes as MINDY. MINDY performs poorly in this case most likely because MSN2 and MSN4 are primarily regulated at the post-translational level, and therefore the transcript profiles of these TFs alone have limited ability to model their activity. Adjusting MINDY kernel parameter did not improve these predictions (data not shown). Similarly, in terms of predicting kinases, MONSTER significantly outperformed MINDY. While the known kinases were among the top ranked according to MONSTER (Mann–Whitney P = 0.007), this was not the case for MINDY-based ranking (P = 0.58). We note that our yeast application outperformed MINDY using only a single set of priors for each type of network connection. Additional data sources will likely further improve these results, but are currently not available in sufficient quality for use in this application (see Section 2.2 in Supplementary Data).
In the human B cell application, MINDY predicted a set of STAT1 target genes with completely different functional enrichments, and only predicted two of the same STAT1 modifiers. The STAT1 target genes predicted by MINDY is predominantly enriched for pathway terms indicative of general transcription or cell growth, rather than terms shared by STAT1, or indicative of immune-related processes as observed in the MONSTER analysis. The alternate set of STAT1 modifiers predicted by MINDY is only weakly supported by the literature (Supplementary Table S7).
In conclusion, we have developed a network inference tool, MONSTER, which infers modifier–TF–gene networks from a combination of expression data and prior probabilities of physical interactions. MONSTER is extremely flexible and can be applied to any of the growing compendia of high-throughput data describing gene expression, protein–DNA interactions and enzyme–substrate interactions. Recent developments in protein microarrays (15,76,77), peptide library screening (16,78) and mass spectrometry (17,79,80) have made it possible to assay a much wider range of PTM types with greater sensitivity, and can further refine computational predictions of enzyme-specific substrates. These collective breakthroughs in PTM research represent a major opportunity to expand regulatory network models beyond the scope of simple TF–gene interactions. MONSTER provides a powerful framework to analyze these and future proteomic datasets in conjunction with expression and protein-DNA interaction data. The potential uses for MONSTER are broad, ranging from large-scale network inference for elucidating systems-level properties, to focused analysis of a specific TF under post-translational regulation.
AVAILABILITY
The source code for MONSTER is available from the authors upon request.
SUPPLEMENTARY DATA
Supplementary Data are available at NAR Online.
FUNDING
This work was supported by the National Institutes of Health (GM085226 to S.H. and HG000046 to L.J.E.). Funding for open access charge: National Institutes of Health R01 (GM085226).
Conflict of interest statement. None declared.
Supplementary Material
ACKNOWLEDGEMENTS
The authors would like to thank Geetu Tuteja for providing support and background sequence data for the GLITR application, Greg Gonye and Matthew Hansen for feedback on this article and Gary Chen for correspondences regarding the COGRIM application. S.H., S.T.J. and L.J.E. conceived and designed the project. L.J.E. implemented the algorithm and carried out the analysis. S.H. and L.J.E. wrote the article.
REFERENCES
- 1.Ptashne M, Gann A. Transcriptional activation by recruitment. Nature. 1997;386:569–577. doi: 10.1038/386569a0. [DOI] [PubMed] [Google Scholar]
- 2.Kadonaga JT. Regulation of RNA polymerase II transcription by sequence-specific DNA binding factors. Cell. 2004;116:247–257. doi: 10.1016/s0092-8674(03)01078-x. [DOI] [PubMed] [Google Scholar]
- 3.Hannenhalli S. Eukaryotic transcription factor binding sites—modeling and integrative search methods. Bioinformatics. 2008;24:1325–1331. doi: 10.1093/bioinformatics/btn198. [DOI] [PubMed] [Google Scholar]
- 4.Blais A, Dynlacht BD. Constructing transcriptional regulatory networks. Genes Dev. 2005;19:1499–1511. doi: 10.1101/gad.1325605. [DOI] [PubMed] [Google Scholar]
- 5.Kim HD, Shay T, O'Shea EK, Regev A. Transcriptional regulatory circuits: predicting numbers from alphabets. Science. 2009;325:429–432. doi: 10.1126/science.1171347. [DOI] [PMC free article] [PubMed] [Google Scholar]
- 6.Berk AJ. Regulation of eukaryotic transcription factors by post-translational modification. Biochim. Biophys. Acta. 1989;1009:103–109. doi: 10.1016/0167-4781(89)90087-0. [DOI] [PubMed] [Google Scholar]
- 7.Brivanlou AH, Darnell JE. Signal transduction and the control of gene expression. Science. 2002;295:813–818. doi: 10.1126/science.1066355. [DOI] [PubMed] [Google Scholar]
- 8.Khidekel N, Hsieh-Wilson LC. A ‘molecular switchboard’—covalent modifications to proteins and their impact on transcription. Org. Biomol. Chem. 2004;2:1–7. doi: 10.1039/b312466e. [DOI] [PubMed] [Google Scholar]
- 9.Everett L, Vo A, Hannenhalli S. PTM-Switchboard—a database of posttranslational modifications of transcription factors, the mediating enzymes and target genes. Nucleic Acids Res. 2009;37(Database issue):D66–D71. doi: 10.1093/nar/gkn731. [DOI] [PMC free article] [PubMed] [Google Scholar]
- 10.Everett L, Hansen M, Hannenhalli S. Regulating the regulators: modulators of transcription factor activity. Methods Mol. Biol. 2010;674:297–312. doi: 10.1007/978-1-60761-854-6_19. [DOI] [PubMed] [Google Scholar]
- 11.Holmberg CI, Tran SEF, Eriksson JE, Sistonen L. Multisite phosphorylation provides sophisticated regulation of transcription factors. Trends Biochem. Sci. 2002;27:619–627. doi: 10.1016/s0968-0004(02)02207-7. [DOI] [PubMed] [Google Scholar]
- 12.Freiman RN, Tjian R. Regulating the regulators: lysine modifications make their mark. Cell. 2003;112:11–17. doi: 10.1016/s0092-8674(02)01278-3. [DOI] [PubMed] [Google Scholar]
- 13.Sterner DE, Berger SL. Acetylation of histones and transcription-related factors. Microbiol. Mol. Biol. Rev. 2000;64:435–459. doi: 10.1128/mmbr.64.2.435-459.2000. [DOI] [PMC free article] [PubMed] [Google Scholar]
- 14.Lee DY, Teyssier C, Strahl BD, Stallcup MR. Role of protein methylation in regulation of transcription. Endocr. Rev. 2005;26:147–170. doi: 10.1210/er.2004-0008. [DOI] [PubMed] [Google Scholar]
- 15.Fasolo J, Snyder M. Protein microarrays. Methods Mol. Biol. 2009;548:209–222. doi: 10.1007/978-1-59745-540-4_12. [DOI] [PMC free article] [PubMed] [Google Scholar]
- 16.Turk BE, Hutti JE, Cantley LC. Determining protein kinase substrate specificity by parallel solution-phase assay of large numbers of peptide substrates. Nat. Protoc. 2006;1:375–379. doi: 10.1038/nprot.2006.57. [DOI] [PubMed] [Google Scholar]
- 17.Zhao Y, Jensen ON. Modification-specific proteomics: strategies for characterization of post-translational modifications using enrichment techniques. Proteomics. 2009;9:4632–4641. doi: 10.1002/pmic.200900398. [DOI] [PMC free article] [PubMed] [Google Scholar]
- 18.Bussemaker HJ, Foat BC, Ward LD. Predictive modeling of genome-wide mRNA expression: from modules to molecules. Annu. Rev. Biophys. Biomol. Struct. 2007;36:329–347. doi: 10.1146/annurev.biophys.36.040306.132725. [DOI] [PubMed] [Google Scholar]
- 19.Bussemaker HJ, Li H, Siggia ED. Regulatory element detection using correlation with expression. Nat. Genet. 2001;27:167–171. doi: 10.1038/84792. [DOI] [PubMed] [Google Scholar]
- 20.Hannenhalli S, Levy S. Transcriptional regulation of protein complexes and biological pathways. Mamm. Genome. 2003;14:611–619. doi: 10.1007/s00335-002-2260-x. [DOI] [PubMed] [Google Scholar]
- 21.Magwene PM, Kim J. Estimating genomic coexpression networks using first-order conditional independence. Genome Biol. 2004;5:R100. doi: 10.1186/gb-2004-5-12-r100. [DOI] [PMC free article] [PubMed] [Google Scholar]
- 22.Margolin AA, Nemenman I, Basso K, Wiggins C, Stolovitzky G, Dalla Favera R, Califano A. ARACNE: an algorithm for the reconstruction of gene regulatory networks in a mammalian cellular context. BMC Bioinformatics. 2006;7(Suppl. 1):S7. doi: 10.1186/1471-2105-7-S1-S7. [DOI] [PMC free article] [PubMed] [Google Scholar]
- 23.Faith JJ, Hayete B, Thaden JT, Mogno I, Wierzbowski J, Cottarel G, Kasif S, Collins JJ, Gardner TS. Large-scale mapping and validation of Escherichia coli transcriptional regulation from a compendium of expression profiles. PLoS Biol. 2007;5:e8. doi: 10.1371/journal.pbio.0050008. [DOI] [PMC free article] [PubMed] [Google Scholar]
- 24.Chen G, Jensen ST, Stoeckert CJ. Clustering of genes into regulons using integrated modeling-COGRIM. Genome Biol. 2007;8:R4. doi: 10.1186/gb-2007-8-1-r4. [DOI] [PMC free article] [PubMed] [Google Scholar]
- 25.Vadigepalli R, Chakravarthula P, Zak DE, Schwaber JS, Gonye GE. PAINT: a promoter analysis and interaction network generation tool for gene regulatory network identification. OMICS. 2003;7:235–252. doi: 10.1089/153623103322452378. [DOI] [PubMed] [Google Scholar]
- 26.Gonye GE, Chakravarthula P, Schwaber JS, Vadigepalli R. From promoter analysis to transcriptional regulatory network prediction using PAINT. Methods Mol. Biol. 2007;408:49–68. doi: 10.1007/978-1-59745-547-3_4. [DOI] [PubMed] [Google Scholar]
- 27.Kundaje A, Xin X, Lan C, Lianoglou S, Zhou M, Zhang L, Leslie C. A predictive model of the oxygen and heme regulatory network in yeast. PLoS Comput. Biol. 2008;4:e1000224. doi: 10.1371/journal.pcbi.1000224. [DOI] [PMC free article] [PubMed] [Google Scholar]
- 28.Hansen M, Everett L, Singh L, Hannenhalli S. Mimosa: mixture model of co-expression to detect modulators of regulatory interaction. Algorithms Mol. Biol. 2010;5:4. doi: 10.1186/1748-7188-5-4. [DOI] [PMC free article] [PubMed] [Google Scholar]
- 29.Zhang J, Ji Y, Zhang L. Extracting three-way gene interactions from microarray data. Bioinformatics. 2007;23:2903–2909. doi: 10.1093/bioinformatics/btm482. [DOI] [PubMed] [Google Scholar]
- 30.Wang K, Saito M, Bisikirska BC, Alvarez MJ, Lim WK, Rajbhandari P, Shen Q, Nemenman I, Basso K, Margolin AA, et al. Genome-wide identification of post-translational modulators of transcription factor activity in human B cells. Nat. Biotechnol. 2009;27:829–839. doi: 10.1038/nbt.1563. [DOI] [PMC free article] [PubMed] [Google Scholar]
- 31.Li KC. Genome-wide coexpression dynamics: theory and application. Proc. Natl Acad. Sci. USA. 2002;99:16875–16880. doi: 10.1073/pnas.252466999. [DOI] [PMC free article] [PubMed] [Google Scholar]
- 32.Steinfeld I, Shamir R, Kupiec M. A genome-wide analysis in Saccharomyces cerevisiae demonstrates the influence of chromatin modifiers on transcription. Nat. Genet. 2007;39:303–309. doi: 10.1038/ng1965. [DOI] [PubMed] [Google Scholar]
- 33.Cheng C, Fabrizio P, Ge H, Longo VD, Li LM. Inference of transcription modification in long-live yeast strains from their expression profiles. BMC Genomics. 2007;8:219. doi: 10.1186/1471-2164-8-219. [DOI] [PMC free article] [PubMed] [Google Scholar]
- 34.Babur O, Demir E, Gönen M, Sander C, Dogrusoz U. Discovering modulators of gene expression. Nucleic Acids Res. 2010;38:5648–5656. doi: 10.1093/nar/gkq287. [DOI] [PMC free article] [PubMed] [Google Scholar]
- 35.Viau M, Zouali M. B-lymphocytes, innate immunity, and autoimmunity. Clin. Immunol. 2005;114:17–26. doi: 10.1016/j.clim.2004.08.019. [DOI] [PubMed] [Google Scholar]
- 36.Lin TS, Mahajan S, Frank DA. STAT signaling in the pathogenesis and treatment of leukemias. Oncogene. 2000;19:2496–2504. doi: 10.1038/sj.onc.1203486. [DOI] [PubMed] [Google Scholar]
- 37.Shaffer AL, Rosenwald A, Staudt LM. Lymphoid malignancies: the dark side of B-cell differentiation. Nat. Rev. Immunol. 2002;2:920–932. doi: 10.1038/nri953. [DOI] [PubMed] [Google Scholar]
- 38.Darnell JE. STATs and gene regulation. Science. 1997;277:1630–1635. doi: 10.1126/science.277.5332.1630. [DOI] [PubMed] [Google Scholar]
- 39.Platanias LC. Mechanisms of type-I- and type-II-interferon-mediated signalling. Nat. Rev. Immunol. 2005;5:375–386. doi: 10.1038/nri1604. [DOI] [PubMed] [Google Scholar]
- 40.Shuai K, Liu B. Regulation of JAK-STAT signalling in the immune system. Nat. Rev. Immunol. 2003;3:900–911. doi: 10.1038/nri1226. [DOI] [PubMed] [Google Scholar]
- 41.Brierley MM, Fish EN. Stats: multifaceted regulators of transcription. J. Interferon. Cytokine Res. 2005;25:733–744. doi: 10.1089/jir.2005.25.733. [DOI] [PubMed] [Google Scholar]
- 42.Geman S, Geman D. Stochastic relaxation, Gibbs distributions, and the Bayesian restoration of images. IEEE Trans. Pattern Anal. Mach. Intell. 1984;6:721–741. doi: 10.1109/tpami.1984.4767596. [DOI] [PubMed] [Google Scholar]
- 43.Hartigan JA. Clustering Algorithms. NY: John Wiley & Sons, Inc.; 1975. [Google Scholar]
- 44.Basso K, Margolin AA, Stolovitzky G, Klein U, Dalla-Favera R, Califano A. Reverse engineering of regulatory networks in human B cells. Nat. Genet. 2005;37:382–390. doi: 10.1038/ng1532. [DOI] [PubMed] [Google Scholar]
- 45.Irizarry RA, Bolstad BM, Collin F, Cope LM, Hobbs B, Speed TP. Summaries of Affymetrix GeneChip probe level data. Nucleic Acids Res. 2003;31:e15. doi: 10.1093/nar/gng015. [DOI] [PMC free article] [PubMed] [Google Scholar]
- 46.Gentleman RC, Carey VJ, Bates DM, Bolstad B, Dettling M, Dudoit S, Ellis B, Gautier L, Ge Y, Gentry J, et al. Bioconductor: open software development for computational biology and bioinformatics. Genome Biol. 2004;5:R80. doi: 10.1186/gb-2004-5-10-r80. [DOI] [PMC free article] [PubMed] [Google Scholar]
- 47.Harbison CT, Gordon DB, Lee TI, Rinaldi NJ, Macisaac KD, Danford TW, Hannett NM, Tagne JB, Reynolds DB, Yoo J, et al. Transcriptional regulatory code of a eukaryotic genome. Nature. 2004;431:99–104. doi: 10.1038/nature02800. [DOI] [PMC free article] [PubMed] [Google Scholar]
- 48.Wingender E, Dietze P, Karas H, Knüppel R. TRANSFAC: a database on transcription factors and their DNA binding sites. Nucleic Acids Res. 1996;24:238–241. doi: 10.1093/nar/24.1.238. [DOI] [PMC free article] [PubMed] [Google Scholar]
- 49.Robertson G, Hirst M, Bainbridge M, Bilenky M, Zhao Y, Zeng T, Euskirchen G, Bernier B, Varhol R, Delaney A, et al. Genome-wide profiles of STAT1 DNA association using chromatin immunoprecipitation and massively parallel sequencing. Nat. Methods. 2007;4:651–657. doi: 10.1038/nmeth1068. [DOI] [PubMed] [Google Scholar]
- 50.Levy S, Hannenhalli S. Identification of transcription factor binding sites in the human genome sequence. Mamm. Genome. 2002;13:510–514. doi: 10.1007/s00335-002-2175-6. [DOI] [PubMed] [Google Scholar]
- 51.Rozowsky J, Euskirchen G, Auerbach RK, Zhang ZD, Gibson T, Bjornson R, Carriero N, Snyder M, Gerstein MB. PeakSeq enables systematic scoring of ChIP-seq experiments relative to controls. Nat. Biotechnol. 2009;27:66–75. doi: 10.1038/nbt.1518. [DOI] [PMC free article] [PubMed] [Google Scholar]
- 52.Tuteja G, White P, Schug J, Kaestner KH. Extracting transcription factor targets from ChIP-Seq data. Nucleic Acids Res. 2009;37:e113. doi: 10.1093/nar/gkp536. [DOI] [PMC free article] [PubMed] [Google Scholar]
- 53.Saunders NFW, Kobe B. The Predikin webserver: improved prediction of protein kinase peptide specificity using structural information. Nucleic Acids Res. 2008;36(Web Server issue):W286–W290. doi: 10.1093/nar/gkn279. [DOI] [PMC free article] [PubMed] [Google Scholar]
- 54.Jensen LJ, Kuhn M, Stark M, Chaffron S, Creevey C, Muller J, Doerks T, Julien P, Roth A, Simonovic M, et al. STRING 8–a global view on proteins and their functional interactions in 630 organisms. Nucleic Acids Res. 2009;37(Database issue):D412–D416. doi: 10.1093/nar/gkn760. [DOI] [PMC free article] [PubMed] [Google Scholar]
- 55.Ewens WJ, Grant GR. NY: Springer; 2005. Statistical methods in bioinformatics. [Google Scholar]
- 56.Moskvina E, Schüller C, Maurer CT, Mager WH, Ruis H. A search in the genome of Saccharomyces cerevisiae for genes regulated via stress response elements. Yeast. 1998;14:1041–1050. doi: 10.1002/(SICI)1097-0061(199808)14:11<1041::AID-YEA296>3.0.CO;2-4. [DOI] [PubMed] [Google Scholar]
- 57.Mayordomo I, Estruch F, Sanz P. Convergence of the target of rapamycin and the Snf1 protein kinase pathways in the regulation of the subcellular localization of Msn2, a transcriptional activator of STRE (Stress Response Element)-regulated genes. J. Biol. Chem. 2002;277:35650–35656. doi: 10.1074/jbc.M204198200. [DOI] [PubMed] [Google Scholar]
- 58.Smith A, Ward MP, Garrett S. Yeast PKA represses Msn2p/Msn4p-dependent gene expression to regulate growth, stress response and glycogen accumulation. EMBO J. 1998;17:3556–3564. doi: 10.1093/emboj/17.13.3556. [DOI] [PMC free article] [PubMed] [Google Scholar]
- 59.Gasch AP, Spellman PT, Kao CM, Carmel-Harel O, Eisen MB, Storz G, Botstein D, Brown PO. Genomic expression programs in the response of yeast cells to environmental changes. Mol. Biol. Cell. 2000;11:4241–4257. doi: 10.1091/mbc.11.12.4241. [DOI] [PMC free article] [PubMed] [Google Scholar]
- 60.Causton HC, Ren B, Koh SS, Harbison CT, Kanin E, Jennings EG, Lee TI, True HL, Lander ES, Young RA. Remodeling of yeast genome expression in response to environmental changes. Mol. Biol. Cell. 2001;12:323–337. doi: 10.1091/mbc.12.2.323. [DOI] [PMC free article] [PubMed] [Google Scholar]
- 61.Ashburner M, Ball CA, Blake JA, Botstein D, Butler H, Cherry JM, Davis AP, Dolinski K, Dwight SS, Eppig JT, et al. Gene ontology: tool for the unification of biology. The Gene Ontology Consortium. Nat. Genet. 2000;25:25–29. doi: 10.1038/75556. [DOI] [PMC free article] [PubMed] [Google Scholar]
- 62.Görner W, Durchschlag E, Martinez-Pastor MT, Estruch F, Ammerer G, Hamilton B, Ruis H, Schüller C. Nuclear localization of the C2H2 zinc finger protein Msn2p is regulated by stress and protein kinase A activity. Genes Dev. 1998;12:586–597. doi: 10.1101/gad.12.4.586. [DOI] [PMC free article] [PubMed] [Google Scholar]
- 63.Garreau H, Hasan RN, Renault G, Estruch F, Boy-Marcotte E, Jacquet M. Hyperphosphorylation of Msn2p and Msn4p in response to heat shock and the diauxic shift is inhibited by cAMP in Saccharomyces cerevisiae. Microbiology. 2000;146(Pt 9):2113–2120. doi: 10.1099/00221287-146-9-2113. [DOI] [PubMed] [Google Scholar]
- 64.Hirata Y, Andoh T, Asahara T, Kikuchi A. Yeast glycogen synthase kinase-3 activates Msn2p-dependent transcription of stress responsive genes. Mol. Biol. Cell. 2003;14:302–312. doi: 10.1091/mbc.E02-05-0247. [DOI] [PMC free article] [PubMed] [Google Scholar]
- 65.Chi Y, Huddleston MJ, Zhang X, Young RA, Annan RS, Carr SA, Deshaies RJ. Negative regulation of Gcn4 and Msn2 transcription factors by Srb10 cyclin-dependent kinase. Genes Dev. 2001;15:1078–1092. doi: 10.1101/gad.867501. [DOI] [PMC free article] [PubMed] [Google Scholar]
- 66.Lee P, Cho BR, Joo HS, Hahn JS. Yeast Yak1 kinase, a bridge between PKA and stress-responsive transcription factors, Hsf1 and Msn2/Msn4. Mol. Microbiol. 2008;70:882–895. doi: 10.1111/j.1365-2958.2008.06450.x. [DOI] [PubMed] [Google Scholar]
- 67.Ogata H, Goto S, Sato K, Fujibuchi W, Bono H, Kanehisa M. KEGG: Kyoto Encyclopedia of Genes and Genomes. Nucleic Acids Res. 1999;27:29–34. doi: 10.1093/nar/27.1.29. [DOI] [PMC free article] [PubMed] [Google Scholar]
- 68.ten Hoeve J, de Jesus Ibarra-Sanchez M, Fu Y, Zhu W, Tremblay M, David M, Shuai K. Identification of a nuclear Stat1 protein tyrosine phosphatase. Mol. Cell. Biol. 2002;22:5662–5668. doi: 10.1128/MCB.22.16.5662-5668.2002. [DOI] [PMC free article] [PubMed] [Google Scholar]
- 69.Boorsma A, Lu XJ, Zakrzewska A, Klis FM, Bussemaker HJ. Inferring condition-specific modulation of transcription factor activity in yeast through regulon-based analysis of genomewide expression. PLoS ONE. 2008;3:e3112. doi: 10.1371/journal.pone.0003112. [DOI] [PMC free article] [PubMed] [Google Scholar]
- 70.Huang YQ, Li JJ, Karpatkin S. Thrombin inhibits tumor cell growth in association with up-regulation of p21(waf/cip1) and caspases via a p53-independent, STAT-1-dependent pathway. J. Biol. Chem. 2000;275:6462–6468. doi: 10.1074/jbc.275.9.6462. [DOI] [PubMed] [Google Scholar]
- 71.Wang Y, Wu TR, Cai S, Welte T, Chin YE. Stat1 as a component of tumor necrosis factor alpha receptor 1-TRADD signaling complex to inhibit NF-kappaB activation. Mol. Cell. Biol. 2000;20:4505–4512. doi: 10.1128/mcb.20.13.4505-4512.2000. [DOI] [PMC free article] [PubMed] [Google Scholar]
- 72.Hoyt R, Zhu W, Cerignoli F, Alonso A, Mustelin T, David M. Cutting edge: selective tyrosine dephosphorylation of interferon-activated nuclear STAT5 by the VHR phosphatase. J. Immunol. 2007;179:3402–3406. doi: 10.4049/jimmunol.179.6.3402. [DOI] [PMC free article] [PubMed] [Google Scholar]
- 73.Alonso A, Rahmouni S, Williams S, van Stipdonk M, Jaroszewski L, Godzik A, Abraham RT, Schoenberger SP, Mustelin T. Tyrosine phosphorylation of VHR phosphatase by ZAP-70. Nat. Immunol. 2003;4:44–48. doi: 10.1038/ni856. [DOI] [PubMed] [Google Scholar]
- 74.Najarro P, Traktman P, Lewis JA. Vaccinia virus blocks gamma interferon signal transduction: viral VH1 phosphatase reverses Stat1 activation. J. Virol. 2001;75:3185–3196. doi: 10.1128/JVI.75.7.3185-3196.2001. [DOI] [PMC free article] [PubMed] [Google Scholar]
- 75.Wu TH, Pabin CN, Qin Z, Blankenstein T, Philip M, Dignam J, Schreiber K, Schreiber H. Long-term suppression of tumor growth by TNF requires a Stat1- and IFN regulatory factor 1-dependent IFN-gamma pathway but not IL-12 or IL-18. J. Immunol. 2004;172:3243–3251. doi: 10.4049/jimmunol.172.5.3243. [DOI] [PubMed] [Google Scholar]
- 76.Ptacek J, Devgan G, Michaud G, Zhu H, Zhu X, Fasolo J, Guo H, Jona G, Breitkreutz A, Sopko R, et al. Global analysis of protein phosphorylation in yeast. Nature. 2005;438:679–684. doi: 10.1038/nature04187. [DOI] [PubMed] [Google Scholar]
- 77.Lin YY, Lu JY, Zhang J, Walter W, Dang W, Wan J, Tao SC, Qian J, Zhao Y, Boeke JD, et al. Protein acetylation microarray reveals that NuA4 controls key metabolic target regulating gluconeogenesis. Cell. 2009;136:1073–1084. doi: 10.1016/j.cell.2009.01.033. [DOI] [PMC free article] [PubMed] [Google Scholar]
- 78.Mok J, Kim PM, Lam HYK, Piccirillo S, Zhou X, Jeschke GR, Sheridan DL, Parker SA, Desai V, Jwa M, et al. Deciphering protein kinase specificity through large-scale analysis of yeast phosphorylation site motifs. Sci. Signal. 2010;3:ra12. doi: 10.1126/scisignal.2000482. [DOI] [PMC free article] [PubMed] [Google Scholar]
- 79.Jensen ON. Interpreting the protein language using proteomics. Nat. Rev. Mol. Cell. Biol. 2006;7:391–403. doi: 10.1038/nrm1939. [DOI] [PubMed] [Google Scholar]
- 80.Witze ES, Old WM, Resing KA, Ahn NG. Mapping protein post-translational modifications with mass spectrometry. Nat. Methods. 2007;4:798–806. doi: 10.1038/nmeth1100. [DOI] [PubMed] [Google Scholar]
Associated Data
This section collects any data citations, data availability statements, or supplementary materials included in this article.