Abstract
Motivation: Next-generation targeted resequencing of genome-wide association study (GWAS)-associated genomic regions is a common approach for follow-up of indirect association of common alleles. However, it is prohibitively expensive to sequence all the samples from a well-powered GWAS study with sufficient depth of coverage to accurately call rare genotypes. As a result, many studies may use next-generation sequencing for single nucleotide polymorphism (SNP) discovery in a smaller number of samples, with the intent to genotype candidate SNPs with rare alleles captured by resequencing. This approach is reasonable, but may be inefficient for rare alleles if samples are not carefully selected for the resequencing experiment.
Results: We have developed a probability-based approach, SampleSeq, to select samples for a targeted resequencing experiment that increases the yield of rare disease alleles substantially over random sampling of cases or controls or sampling based on genotypes at associated SNPs from GWAS data. This technique allows for smaller sample sizes for resequencing experiments, or allows the capture of rarer risk alleles. When following up multiple regions, SampleSeq selects subjects with an even representation of all the regions. SampleSeq also can be used to calculate the sample size needed for the resequencing to increase the chance of successful capture of rare alleles of desired frequencies.
Software: http://biostat.mc.vanderbilt.edu/SampleSeq
Contact: chun.li@vanderbilt.edu
Supplementary information: Supplementary data are available at Bioinformatics online.
1 INTRODUCTION
Genome-wide association studies (GWAS) are based on the premise that densely genotyped common alleles will have statistical power to detect causal associations with traits at nearby, ungenotyped common mutations through short-range linkage disequilibrium (LD). The basis for this strategy is the common disease common variant (CDCV) hypothesis (Reich and Lander, 2001). This approach has been proven to be effective in many scenarios for mapping small genomic regions to traits (see the National Human Genome Research Institute Catalog of Published Genome-Wide Association Studies) (Manolio et al., 2008; McCarthy et al., 2008). However, the predominantly small effect sizes encountered thus far in investigations of most traits have provided no explanation for a large proportion of the trait variance attributable to heritable factors (Maher, 2008; Manolio et al., 2009). Some effort to describe this phenomenon has suggested that hundreds or thousands of SNPs may each have a very subtle influence on the risk of some psychiatric traits (Purcell et al., 2009). These observations seem to support an adjustment of the CDCV model to allow for the possibility that rare alleles might also exert a major influence on common traits (Bodmer and Bonilla, 2008; Pritchard, 2001; Schork et al., 2009). This modification of CDCV, known as common disease rare variant (CDRV), postulates that alleles with strong effects on traits are likely to be rare due to purifying selective pressure and recent time to coalescence due to the rapid expansion of human populations (Pritchard, 2001). Additionally, it has been shown in simulations that multiple rare alleles with strong effects can stochastically aggregate onto the haplotypic background of a common allele and produce genome-wide significant association signals, a scenario termed synthetic association (Dickson et al., 2010). Further support for the CDRV hypothesis comes from observational studies where the average allele frequency of SNPs with predicted effects on proteins was smaller than the average allele frequency of intronic or synonymous variants (Cargill et al., 1999; Gorlov et al., 2008; Wong et al., 2003). Estimates from human Mendelian traits, human–chimpanzee divergence data and human genetic variation suggested that ~53% of new missense mutations have mildly deleterious effects, and that up to 70% of low-frequency missense alleles are mildly deleterious (Kryukov et al., 2007).
A rare trait allele may not be annotated in the databases of common variants maintained by the International HapMap Organization or dbSNP, thereby excluding the possibility of detecting that SNP through imputation and subsequent association analysis. The constellation of causal alleles may also be unique for each population of human subjects, where sensitive functional gene or regulatory regions are perturbed by independent sets of rare mutations that occurred after geographic or cultural barriers led to increased genetic distance (Tishkoff et al., 2009). Thus, the same associated allele from GWAS across multiple ethnic groups does not necessarily imply the same underlying architecture of causal alleles in LD. Furthermore, our simulations suggest that rare disease-causing variants may not be captured at all by the modest samples of each population isolate from the 1000 Genomes Project, regardless of the high error rates for rare genotype calls from that study due to low coverage. Resequencing is then the best available means of discovering these rare SNPs in a GWAS sample and ultimately detecting the relationship between these alleles and traits.
To successfully discover the mutations that determine trait susceptibility, detailed assays that directly capture all genetic variation in a region are required (Cirulli and Goldstein, 2010). This can be accomplished most efficiently using next-generation sequencing technology to resequence subjects for the implicated loci (Service, 2006). While next-generation sequencing technologies have substantially decreased the financial cost of resequencing large genomic regions relative to Sanger sequencing technology, it is still not generally feasible to resequence all the subjects that were used to isolate a genomic region via GWAS. Thereby, some strategy is necessary for employing sequencing technology that is cost-effective. One possibility is to resequence a small number of cases and controls or persons with extreme trait values and evaluate the observed genetic variation for association with traits to screen rare variants prior to larger genotyping experiments; however, this approach will suffer from low statistical power at the screening step due to the infrequent exposure rate of rare alleles, and potentially suffer from inflated type I error rates (Li and Leal, 2009) as a result of ascertainment bias in cases. An alternative approach is not to attempt to associate alleles from resequencing data with the trait, but to discover rare alleles by resequencing, and then assay these SNPs with conventional genotyping methods in the entire available pool of study subjects. The effectiveness of this approach will be limited by the power to capture rare alleles in the targeted loci, which is directly related to the selection of subjects for the resequencing experiment (Li and Leal, 2009). For SNP discovery, targeted resequencing study designs can be tailored for efficient capture of rare disease alleles in small samples, by using the information available at nearby trait-associated SNPs.
In this article, we present SampleSeq, an algorithm for enriching the yield of rare or uncommon disease alleles in a sample of unrelated study subjects by choosing subjects according to their observed associated alleles and trait information. When multiple regions are to be sequenced, SampleSeq selects subjects with a balanced representation of all the regions. SampleSeq can also estimate the sample size required to detect a hypothetical disease allele, and thus can optimize a resequencing study to preserve resources for subsequent genotyping or other investigations.
2 METHODS
We first describe our method for selecting subjects for sequencing a single region. We then extend the method to sequencing multiple regions. Finally, we describe simulation strategies for evaluating our method.
2.1 Sequencing a single region
Let A be a disease-associated common SNP, with alleles A and a and allele frequencies pA and pa, respectively. Let D be the true disease SNP close to SNP A, with alleles D and d and allele frequencies pD and pd, respectively. SNP D may not have been genotyped in previous stages of the investigation, and the common SNP A serves as a proxy for SNP D. The assumption of a single disease SNP simplifies the derivation, but it does not appear to be necessary as will be shown in our simulation results. As our method seeks to calculate the expected count of disease variants for each subject by conditioning on his SNP A genotype and affection status, we assume genotypes at SNP A are available for all subjects, and further that resequencing will be performed at sufficient depth to accurately call rare genotypes in small sample sizes. Suppose allele a is the ‘risk’ allele, in positive LD with allele d and is either the major or minor allele at SNP A, and allele d is the real disease variant. When d is a rare variant, it is reasonable to assume that it originated on the background of allele a and almost no recombination has since occurred between them; we describe the rationale for this assumption in Section 4. Then pd<pa, and the four haplotype frequencies are pdA, pda=pd−pdA, pDa=pa−pd+pdA and pDA=pA−pdA. Since almost no recombination has occurred between the two loci, it is reasonable to assume pdA is much smaller than pd, otherwise the LD between the two loci would be too weak to make SNP A a good proxy and be identified in a GWAS. When pdA≈0 , we have pda≈pd, pDa≈pa−pd and pDA≈pA. This assumption is not required for the calculations below, although it is implemented in the current version of our software for ease of computation. Our simulations did not have this requirement either (see Section 2.4). Let Ga and Gd be the genotypes at the loci: Ga=0,1,2 for AA, Aa, aa and Gd=0,1,2 for DD, Dd, dd, respectively. We assume Hardy–Weinberg equilibrium (HWE) at the SNPs in the population. Let Y be the disease status, 1 for cases and 0 for controls. Let fi=P(Y=1|Gd=i) (i=0,1,2) be the penetrances for genotypes DD, Dd and dd, respectively, and K be the disease prevalence in the population.
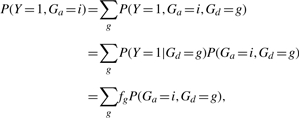
Our goal is to calculate the expected count of allele d, E(Gd|Ga,Y), given each subject's genotype at SNP A and affection status, and select subjects accordingly. To achieve this, we first calculate P(Gd=g|Ga, Y) for g=0,1,2. Note that
where the denominator is P(Ga,Y)=∑GdP(Gd,Ga,Y) and the numerator is P(Gd,Ga,Y)=P(Gd,Ga)P(Y|Gd,Ga)=P(Gd,Ga)P(Y|Gd). The genotype probability P(Gd,Ga) is a function of haplotype frequencies under HWE. The probability P(Y|Gd=i)=fi when Y=1, and 1−fi when Y=0. We now show how to obtain fi. Note that
where P(Ga=i|Y=1) is the case frequency for genotype Ga=i. Since
 |
we have
 |
and can solve for f0, f1, f2 using these linear equations.
In the above calculation, the case genotype frequencies P(Ga=i|Y=1) can be estimated from the data at hand. The haplotype frequencies depend on the allele frequencies at SNPs A and D. The SNP A allele frequencies pA and pa can be estimated as weighted averages of case and control allele frequencies; for example,  , where
  and
and  are the frequencies of allele A in the cases and controls, respectively. When the disease prevalence is very low,
  . The investigator needs to specify pd, for which we will show that often a range is sufficient. We also need the information on disease prevalence K, which often is available from external sources and also can be specified as a range.
Once we have calculated P(Gd|Ga,Y), the expected count of allele d can be easily calculated as
 |
If we focus on a single region, then the subjects can be ranked according to their expected count of allele d. The top ranked subjects can be selected for sequencing to ensure the highest chance of detecting rare disease variants. We will discuss stopping criteria and sample size determination at the end of the next section.
2.2 Sequencing multiple regions
In practice, investigators may want to fine map multiple regions simultaneously. Our method can be extended for this scenario. We assume there are M regions to sequence and they are unlinked to each other. For subject i and region j(i=1,…,n and j=1,…,M), let Gijd and Gija be the genotypes at the real disease SNP and the reported associated common SNP, respectively. Because the regions are unlinked, the above calculations can be carried out separately for each region, with Eij=E(Gijd|Gija,Yi). One might want to rank the subjects according to the expected number of disease variants over all regions,
and select top ranked subjects. However, as the regions can differ in key characteristics such as risk allele frequency and strength of disease association, the top ranked subjects may contribute unevenly to the regions. As a result, this selection strategy may lead to overrepresentation of one region and lack of representation for another. A more efficient procedure is to select the top ranked subjects one at a time, each time tallying the cumulative expected count of disease variants for each region, denoted by Cj for region j. Once a region j has reached Cj≥c, a prespecified target number of disease variants, we re-rank the remaining subjects based on ∑k:Ck<cEik, calculated by excluding the region, and continue to select top ranked subjects. This process is repeated every time a region reaches C≥c.
We may stop the process when all regions have reached C≥c. The number of selected subjects is the sample size needed to have C≥c for all regions. If the number of selected subjects is fewer than planned, the resources could be preserved for subsequent follow-up. If the investigator wants to select more subjects, he may either raise the target value c and redo the selection or continue selecting from the remaining subjects according to their Ei. Although this algorithm allows investigators to determine the sample size needed to reach C≥c for all regions, as the disease variant frequency pd that is used in calculation of Eik may be different than the real disease variant frequency, the target value c may be far from the true number of disease variants in the selected subjects, as will be seen in our simulation results. However, our simulations also showed that even when pd was misspecified, SampleSeq performed well compared to the alternative approaches we simulated.
2.3 Missing and imputed genotypes
In practice, missing genotypes exist due to various reasons. In SampleSeq, when genotype Gija is unavailable, Eij is calculated as a weighted average
where P(Gija=g|Yi) is the estimated genotype frequency of g in cases or controls, depending on the value of Yi. Similarly, a missing genotype may be imputed from the haplotype distribution of the population and observed haplotypes in the study subjects. When genotype Gija is imputed, Eij can be calculated as a weighted average using the posterior probabilities of the imputed SNP as weights:
where GF denotes flanking marker genotypes.
2.4 Simulation strategy
We simulated case–control data with one or multiple disease regions, each harboring one or multiple disease variants with additive effects on trait risk. For rare variants, additive effect is practically equivalent to dominant effect as there are mostly only two genotypes, DD and Dd. To simulate realistic sequence-level genetic data from human populations, we employed the coalescent simulation software cosi, with parameters developed to calibrate the LD profile of simulated data to the observed LD profile from human populations (Schaffner et al., 2005). Additionally, we used the recombination map from the International HapMap Project to model the probability of recombination in specified genomic regions. We randomly chose five disease regions between 125 kb and 250 kb in length, and for each region, we used cosi to generate a pool of 25 000 haplotypes. It is possible that associations between rare variants and common proxies might extend over longer physical distances than 250 kb; however, these simulations were computationally intensive to perform on a large scale. We note that there is no size limitation for our method and software.
We simulated three scenarios: (i) CDRV with one rare disease variant per region; (ii) synthetic association (Dickson et al., 2010) with 10 rare disease variants per region; and (iii) CDCV with one common disease variant per region. For the CDRV scenario, we simulated various settings of prevalence (K=0.01, 0.05, 0.1, 0.2) and disease variant minor allele frequencies (MAFs, range 0.0025–0.01, denoted as MAFmin and MAFmax), with odds ratios (ORs) in the range 2–6 (denoted by ORmin and ORmax). The OR of a disease variant was determined according to its MAF through the following formula:
For the synthetic association scenario, we simulated one level of prevalence (K=0.01), and placed 10 random rare disease alleles with MAF in the range 0.0025–0.01 in each of five independent genomic regions, with OR in the range 2–6. For the CDCV scenario, we simulated one prevalence (K=0.01) with OR in the range 1.1–1.5, and various disease allele frequencies (0.01, 0.05, 0.15, 0.25).
For each combination of prevalence and ORs, a disease model was established with
where (G1,G2,…,GM) is an individual's joint genotype at the M disease SNPs, and the coefficients βj were determined based on the prevalence and ORs.
To simulate a control, a pair of haplotypes from each region was randomly drawn, and a random number in (0, 1) was drawn and compared to the penetrance from the disease model to determine if the subject is a control. To simulate cases, the probability of a having a multilocus genotype conditional on being a case was calculated for all possible genotypes from the M disease SNPs using the equation:
A multilocus genotype across all disease SNPs was then randomly selected according to this conditional distribution, and haplotypes consistent with that genotype were randomly chosen from the haplotype pools simulated by cosi.
For each scenario and each prevalence level, we generated 100 replicates of 2000 cases and 2000 controls. We then identified a proxy marker (i.e. SNP A) for each region with 1.1<OR<1.5 and 0.2<MAF<0.4. These criteria were chosen to emulate typical associations from GWAS, and to allow the association between disease and SNP A to arise naturally as a result of LD between SNPs A and D, which were calibrated to resemble the LD profile of European-ancestry populations. On average the D′ between SNPs A and D was 0.88, with a range of 0.8–1 across all CDRV simulations; in other words, pdA could be non-zero in our simulated data. For the synthetic association scenario, we did not impose any restrictions on the relationship between SNP A and the real trait SNPs, so that some of the risk alleles might fall on the low-risk background of SNP A.
In addition to SampleSeq, we also considered other approaches to selecting the same number of subjects, including (i) random selection of controls; (ii) random selection of cases; (iii) selection of subjects ranked by dosage of proxy marker risk alleles; and (iv) selection of cases ranked by dosage of proxy marker risk alleles. For all these approaches, we counted the total number of disease variants per region that were captured in the selected subjects for sample sizes from 50 to 500 in increments of 50 subjects. For the simulated data, we also counted the maximum number of disease variants that can be carried for each given sample size.
3 RESULTS
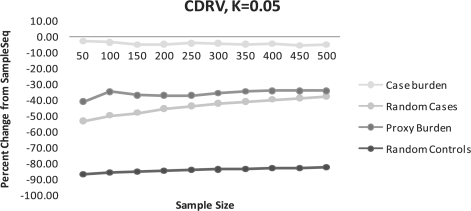
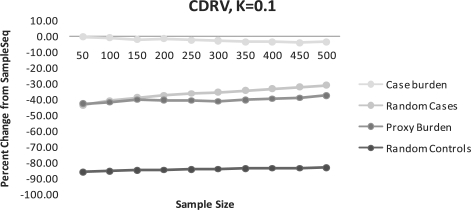
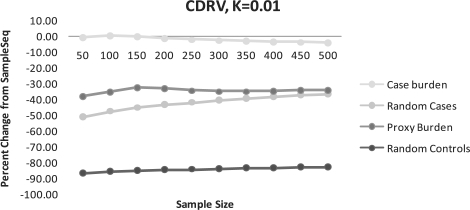
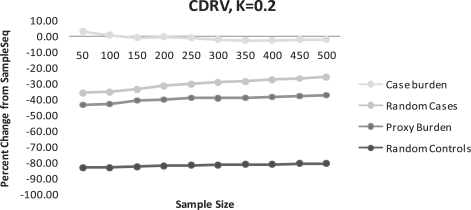
For all simulated scenarios, we calculated the number of rare disease alleles captured. For the CDRV scenarios, where the allele frequency of the trait locus is well-estimated, the SampleSeq algorithm consistently provided higher yields of captured disease alleles than the other methods for all sample size thresholds (Figs 1–4, Supplementary Tables S1–4). These results demonstrate the benefit in efficiency that SampleSeq can provide over the other alternatives. The yield of rare disease alleles provided by SampleSeq is a little higher over all sample sizes than by ranking case subjects by their burden of risk alleles. The other three alternative approaches were less efficient than SampleSeq by large percentages. Among the four alternative approaches, those relying on the burden of the proxy marker risk alleles were better than those not using this information, and those focusing on cases were better than those not limited to cases. These results are as expected as both the burden of marker risk alleles and disease status are informative for the likelihood of carrying real disease variants. As SampleSeq is able to appropriately combine these two pieces of information, it often results in a more efficient selection of subjects than the alternatives. When only one piece of information was used, using the burden of proxy marker alleles performed similarly to the random selection of cases, with the former being slightly better when the prevalence was K=0.01 and 0.05 and the latter slightly better when K=0.1 and 0.2. We also observed that as trait prevalence increased, the total number of captured rare disease alleles decreased (Supplementary Tables S1–4). This was due to the fact that the same number of disease variants with similar effects would account for a high fraction of heritability for a low prevalence disease than for a high prevalence disease, which resulted in a higher likelihood for a patient of a low prevalence disease to carry a disease variant in the targeted regions in our simulations. We also simulated a single region of size 1 Mb with a single disease variant; the results followed the same pattern (data not shown).
Fig. 2.
(CDRV) Percent change of disease alleles captured compared to SampleSeq using alternative methods. K=0.05, assuming a disease allele frequency of 0.01 in calculation of Eik.
Fig. 3.
(CDRV) Percent change of disease alleles captured compared to SampleSeq using alternative methods. K=0.1, assuming a disease allele frequency of 0.01 in calculation of Eik.
Fig. 1.
(CDRV) Percent change of disease alleles captured compared to SampleSeq using alternative methods. K=0.01, assuming a disease allele frequency of 0.01 in calculation of Eik.
Fig. 4.
(CDRV) Percent change of disease alleles captured compared to SampleSeq using alternative methods. K=0.2, assuming a disease allele frequency of 0.01 in calculation of Eik.
We note that SampleSeq is sensitive to very low values of pd as the algorithm is involved with solving linear equations, for which the solutions will be highly variable due to nearly singular matrices at very small values of pd. Our experience is that pd should be at least  . For example, to select subjects from a pool of ncase+ncontrol=2000 subjects, setting pd=0.005 is good but the performance will become less optimal for pd<0.005. This limitation is computational. Our simulations showed that assuming pd=0.01 was relatively robust to misspecification of the true frequency of d within the range we simulated, and performed well over all scenarios (data not shown).
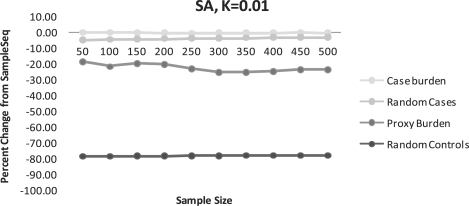
When we simulated the synthetic association (SA) scenario (Fig. 5, Supplementary Table S5), we observed similar patterns as for the CDRV scenario, although all methods captured a higher proportion of the maximum number of possible disease alleles than the CDRV scenario. SampleSeq captured an average of 75% of the maximum possible disease alleles over all sample sizes. In our simulated scenario, the random selection of cases performed much better than using the burden of proxy marker alleles. This is most likely due to the large number of disease alleles to be found among the cases on both allelic backgrounds of SNP A compared to the number of causal alleles in controls.
Fig. 5.
(SA) Percent change of disease alleles captured compared to SampleSeq using alternative methods. K=0.01, assuming a disease allele frequency of 0.01 in calculation of Eik.
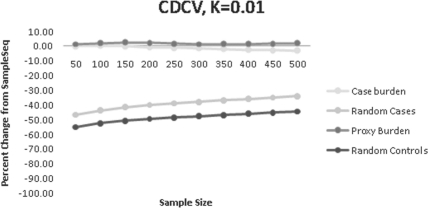
For the CDCV scenario, we compared SampleSeq to the alternative methods when the disease alleles were not rare, but we assumed that pd=0.01 in our calculations. In these experiments, SampleSeq was slightly more efficient than the burden of proxy alleles in cases, and was slightly less efficient than the burden of proxy risk alleles regardless of case status (Fig. 6, Supplementary Table S6). This was also true when pd was close to the true frequency of d. Also notable was the generally smaller magnitude of differences among the other three methods. These results are due to the presence of many disease alleles in both cases and controls, as a result of the subtle effect sizes simulated in this scenario.
Fig. 6.
(CDCV) Percent change of disease alleles captured compared to SampleSeq using alternative methods. K=0.01, assuming a disease allele frequency of 0.01 in calculation of Eik.
We further summarized the results of these simulations by comparing the average expected counts of disease alleles as determined by SampleSeq, E(d), to the average count of observed disease alleles, d, for each scenario and sample size (Table 1). As the calculation of Eik is based on a hypothetical disease variant frequency (pd=0.01 in our calculations), E(d) may not match the true number of disease alleles. For the CDRV scenarios, where the frequency of d was between 0.0025 and 0.01, the ratio of the average expected to observed alleles across sample sizes were 1.7 for K=0.01, 2.0 for K=0.05, 2.9 for K=0.1, and 2.7 for K=0.2. When the allele frequency of d was constrained to fall within the range 0.009–0.011, and pd was set to 0.01, the ratio of E(d) to d was 1.3 for K=0.01. However, for the SA scenario, the ratio of average E(d) to d was 0.41, although this value is counting the observation of all disease alleles in a region, where there were 10 disease alleles in the simulation per region. Also for the CDCV scenario, the ratio of average E(d) to d was 0.27, demonstrating that our method is based on finding rare disease alleles, and that if the disease alleles are common, they will occur much more often than expected by SampleSeq assuming a rare pd. Although Eik changes as the hypothetical disease variant frequency changes, using these estimates to rank subjects when an incorrect allele frequency is used in the calculation is still an effective means of selecting subjects. To demonstrate this, we calculated E(d) under pd=0.1, 0.01 and 0.001, using the simulation parameters from the experiment in Figure 1, and present their correlation coefficients in Table 2. While the magnitude of the value of E(d) is proportional to the assumed value of pd, the ranking of subjects is similar even when pd is misspecified.
Table 1.
The average cumulative expected count of disease alleles, denoted E(d), and the actual observed average count of disease alleles, denoted d, for each scenario in Figs 1–6, denoted F1–F6, for each of 10 sample sizes
| Size | CDRV |
SA |
CDCV |
|||||||||
|---|---|---|---|---|---|---|---|---|---|---|---|---|
| F1 E(d) | F1 d | F2 E(d) | F2 d | F3 E(d) | F3 d | F4 E(d) | F4 d | F5 E(d) | F5 d | F6 E(d) | F6 d | |
| 50 | 60.61 | 33.01 | 57.77 | 27.37 | 54.19 | 17.02 | 41.11 | 13.29 | 126.25 | 250.83 | 91.49 | 326.19 |
| 100 | 112.43 | 61.4 | 106.16 | 50.73 | 100.19 | 32.44 | 76.66 | 26.24 | 236.61 | 499.71 | 171.66 | 617.27 |
| 150 | 159.77 | 88.14 | 150.05 | 73.62 | 142.48 | 47.04 | 109.77 | 38.45 | 339.02 | 747.42 | 249.07 | 892.26 |
| 200 | 203.92 | 113.85 | 190.93 | 93.46 | 182.28 | 61.19 | 140.98 | 49.65 | 433.72 | 994.22 | 318.45 | 1159.36 |
| 250 | 245.86 | 138.59 | 229.21 | 113.05 | 219.95 | 75.08 | 170.25 | 61.00 | 523.99 | 1240.19 | 385.29 | 1421.55 |
| 300 | 286.01 | 162.67 | 266.24 | 131.73 | 256.05 | 88.91 | 197.91 | 72.24 | 611.43 | 1485.35 | 449.50 | 1678.27 |
| 350 | 323.93 | 186.10 | 302.01 | 150.83 | 290.30 | 102.26 | 225.60 | 83.32 | 696.42 | 1729.79 | 509.24 | 1926.32 |
| 400 | 360.35 | 208.67 | 335.85 | 168.82 | 322.98 | 114.54 | 252.02 | 94.1 | 779.41 | 1972.88 | 569.92 | 2170.27 |
| 450 | 394.54 | 230.64 | 367.42 | 187.19 | 353.79 | 127.4 | 276.51 | 104.51 | 859.65 | 2215.47 | 634.62 | 2405.16 |
| 500 | 429.20 | 253.22 | 398.36 | 203.89 | 385.89 | 138.76 | 300.98 | 114.68 | 936.72 | 2459.95 | 676.23 | 2632.34 |
Table 2.
Correlation coefficient between E(d) from three settings of pd
| pd=0.1 | pd=0.01 | pd=0.001 | |
|---|---|---|---|
| pd=0.1 | – | 0.908 | 0.841 |
| pd=0.01 | 0.938 | – | 0.988 |
| pd=0.001 | 0.928 | 0.999 | – |
Five regions, one rare disease variant per region, K=0.01. Correlations for cases are in the upper triangle and those for controls are in the lower triangle.
4 DISCUSSION
Targeted resequencing using next-generation sequencing technology allows investigators to fine map regions identified in GWAS to localize true variants. Since it is generally not feasible for an investigator to sequence everybody in a large GWAS, questions arise as to the optimal design of follow-up studies aimed at identifying novel, particularly rare, variants that may explain the GWAS signals: the optimal balance between numbers of subjects, depth of sequencing and sizes of regions; follow-up by further sequencing of selected variants or imputation; whether to use DNA pooling or family-based designs; choice of specific subjects for sequencing, etc. (D.Thomas and F.Yang, personal communication). We developed SampleSeq to address the last issue.
We have conducted a simulation study of several scenarios that have been postulated to represent the genetic architecture of common complex traits in human populations. We explored individual rare variants with strong effects, the synthetic association scenario with multiple rare variants per region and the CDCV model to evaluate our approach for capturing causal alleles. We demonstrated that SampleSeq can estimate the count of rare causal alleles in a sample of subjects from a case–control study, estimate the sample size required to capture a specified number of alleles in each region of interest and select subjects to optimize and balance the capture of alleles across an arbitrary number of regions.
When designing a next-generation resequencing study, a compromise must be struck between read depth and sample size. Regardless of the balance between these parameters, the allele frequency in the sample will be the primary determinant of whether genotypes are called accurately. By increasing the frequency of a disease allele in a sample of subjects, the accuracy of genotype calls and the chance that any resequencing study design will detect the presence of that allele will be improved. To increase the chance of detecting disease variants in a targeted resequencing study, an intuitive strategy is to select cases according to the dosage of risk alleles at the reported associated SNP (Thomas et al., 2009). Our results showed that this is indeed a good strategy compared to random selection of cases or controls. However, because of incomplete penetrance, a control subject homozygous for risk alleles at several loci may have a higher chance of carrying a real disease variant than a case subject who is heterozygous for some of those risk alleles. SampleSeq allows us to quantify their probabilities of carrying real disease variants and then select subjects accordingly.
We observe that compared to random controls, samples of random cases have much better performance for discovering rare disease alleles, which is consistent with previous studies (Li and Leal, 2009). Some investigators may choose to evaluate a set of controls in order to perform screening with association tests before proceeding to large-scale variant-based genotyping. This is likely the most effective strategy when resources are abundant for resequencing studies and sample sizes are large. However, when sample sizes are small, we would expect most of the ability to detect the presence of rare disease alleles in the population to come from the cases. As the majority of samples selected by SampleSeq will be cases, in some situations, it may be reasonable to resequence some controls to augment the SampleSeq selection. The control subjects could then be used to screen variants for frequency differences and prioritize for genotyping. This comparison would be biased due to the frequency enrichment achieved by SampleSeq, but could help discern the SNPs that should be tested for association with the trait with unbiased approaches, such as genotyping in the full cohort. However, reallocating resources to sequence additional controls would also lower the chance of seeing real disease variants in the cases. If the number of subjects that can be resequenced is small, we advocate also using the sequence context and putative biological impact of variants to prioritize SNPs for genotyping, as there will not be a large amount of statistical information for comparing rare variant frequencies in small samples.
Some recent research has shown that association testing from sequence data may provide slightly more statistical power than variant-based genotyping on a per-subject basis (Liu and Leal, 2010) using two recently developed tests of association (Li and Leal, 2008; Madsen and Browning, 2009). However, we note that due to the large difference in the cost of resequencing to the cost of variant-based genotyping, on a per-unit of resources basis, many more subjects could be genotyped with variant-based methods than could be resequenced. Thereby, the statistical power to detect an association might be considerably better in a large sample of variant-based genotypes than in a small sample of sequence-based genotypes, utilizing the same resources. The goal of this work is to optimize the resources expended for resequencing studies, preserving DNA samples and financial assets for subsequent steps in investigations.
The key element of the model that provides SampleSeq with a performance advantage over counting common risk alleles is the assumption of rare ancestral recombination between SNPs A and D. We assumed that disease variant d originated on the ‘risk’ allele a background, which resulted in three haplotypes, AD, aD and ad. To break up the LD between the SNPs through recombination, the recombination event needs to occur in the double heterogyzotes, for which the frequency is quite low as d is rare. Moreover, if the two SNPs are close enough to have very low recombination fraction between them, then the chance of breaking up the LD between the SNPs will be small. This is supported by our simulation data; the recombinant haplotype frequency averaged 3.7×10⁻⁴ across all our CDRV haplotype pools, suggesting pdA≈0 is a reasonable assumption. It is implemented in our software for the ease of computation. In simulations where this assumption was badly violated, such as the CDCV scenario, the performance of SampleSeq was still competitive with the burden of risk alleles in cases.
We also noted that as the prevalence in our simulations increased, but the ORs of rare disease variants was held constant, the proportion of cases not carrying any risk alleles at any of the target disease loci increased. This observation is a result of our simulation strategy, but it is perhaps worthy of note that high-prevalence traits may require many more rare risk alleles than low-prevalence traits for the CDRV model to account for most of the trait heritability for a highly heritable common trait. Thereby, if there are not a large number of associated regions identified for a high-prevalence trait, it is possible that the yield of rare disease alleles from a resequencing study of that trait may be small, as additional trait variation may be due to untargeted regions or environmental influences.
As next-generation sequencing technology matures, the need for targeted resequencing of association study-implicated regions for fine-mapping of mutations may eventually expire. However, for researchers who do not have access to tremendous financial resources or the most current sequencing platforms, targeted resequencing followed by variant-based genotyping of candidate SNPs is likely the most direct and cost-efficient means of fine-mapping of causal rare mutations. Additionally, this approach capitalizes on previous discoveries, rather than pursuing agnostic resequencing of whole genomes or exomes. While agnostic approaches to discovery will and should be taken, we believe there is also a role for hypothesis-based resequencing studies in human genetic epidemiology in the foreseeable future. The SampleSeq software is available at http://biostat.mc.vanderbilt.edu/SampleSeq
Supplementary Material
ACKNOWLEDGEMENTS
We would like to thank Digna R. Velez Edwards and Martin Kohli for helpful discussions on these topics.
Funding: National Institutes of Health (grant R01HG004517) (to T.L.E. and C.L., in part); Vanderbilt Clinical and Translational Research Scholar award (5KL2RR024975) (to T.L.E., in part).
Conflict of Interest: none declared.
REFERENCES
- Bodmer W., Bonilla C. Common and rare variants in multifactorial susceptibility to common diseases. Nat. Genet. 2008;40:695–701. doi: 10.1038/ng.f.136. [DOI] [PMC free article] [PubMed] [Google Scholar]
- Cargill M., et al. Characterization of single-nucleotide polymorphisms in coding regions of human genes. Nat. Genet. 1999;22:231–238. doi: 10.1038/10290. [DOI] [PubMed] [Google Scholar]
- Cirulli E.T., Goldstein D.B. Uncovering the roles of rare variants in common disease through whole-genome sequencing. Nat. Rev. Genet. 2010;11:415–425. doi: 10.1038/nrg2779. [DOI] [PubMed] [Google Scholar]
- Dickson S.P., et al. Rare variants create synthetic genome-wide associations. PLoS Biol. 2010;8:e1000294. doi: 10.1371/journal.pbio.1000294. [DOI] [PMC free article] [PubMed] [Google Scholar]
- Gorlov I.P., et al. Shifting paradigm of association studies: value of rare single-nucleotide polymorphisms. Am. J. Hum. Genet. 2008;82:100–112. doi: 10.1016/j.ajhg.2007.09.006. [DOI] [PMC free article] [PubMed] [Google Scholar]
- Kryukov G.V., et al. Most rare missense alleles are deleterious in humans: implications for complex disease and association studies. Am. J. Hum. Genet. 2007;80:727–739. doi: 10.1086/513473. [DOI] [PMC free article] [PubMed] [Google Scholar]
- Li B., Leal S.M. Methods for detecting associations with rare variants for common diseases: application to analysis of sequence data. Am. J. Hum. Genet. 2008;83:311–321. doi: 10.1016/j.ajhg.2008.06.024. [DOI] [PMC free article] [PubMed] [Google Scholar]
- Li B., Leal S.M. Discovery of rare variants via sequencing: implications for the design of complex trait association studies. PLoS Genet. 2009;5:e1000481. doi: 10.1371/journal.pgen.1000481. [DOI] [PMC free article] [PubMed] [Google Scholar]
- Liu D.J., Leal S.M. Replication strategies for rare variant complex trait association studies via next-generation sequencing. Am. J. Hum. Genet. 2010;87:790–801. doi: 10.1016/j.ajhg.2010.10.025. [DOI] [PMC free article] [PubMed] [Google Scholar]
- Madsen B.E., Browning S.R. A groupwise association test for rare mutations using a weighted sum statistic. PLoS Genet. 2009;5:e10003. doi: 10.1371/journal.pgen.1000384. [DOI] [PMC free article] [PubMed] [Google Scholar]
- Maher B. Personal genomes: the case of the missing heritability. Nature. 2008;456:18–21. doi: 10.1038/456018a. [DOI] [PubMed] [Google Scholar]
- Manolio T.A., et al. A HapMap harvest of insights into the genetics of common disease. J. Clin. Invest. 2008;118:1590–1605. doi: 10.1172/JCI34772. [DOI] [PMC free article] [PubMed] [Google Scholar]
- Manolio T.A., et al. Finding the missing heritability of complex diseases. Nature. 2009;461:747–753. doi: 10.1038/nature08494. [DOI] [PMC free article] [PubMed] [Google Scholar]
- McCarthy M.I., et al. Genome-wide association studies for complex traits: consensus, uncertainty and challenges. Nat. Rev. Genet. 2008;9:356–369. doi: 10.1038/nrg2344. [DOI] [PubMed] [Google Scholar]
- Pritchard J.K. Are rare variants responsible for susceptibility to complex diseases? Am. J. Hum. Genet. 2001;69:124–137. doi: 10.1086/321272. [DOI] [PMC free article] [PubMed] [Google Scholar]
- Purcell S.M., et al. Common polygenic variation contributes to risk of schizophrenia and bipolar disorder. Nature. 2009;460:748–752. doi: 10.1038/nature08185. [DOI] [PMC free article] [PubMed] [Google Scholar]
- Reich D.E., Lander E.S. On the allelic spectrum of human disease. Trends Genet. 2001;17:502–510. doi: 10.1016/s0168-9525(01)02410-6. [DOI] [PubMed] [Google Scholar]
- Schaffner S.F., et al. Calibrating a coalescent simulation of human genome sequence variation. Genome Res. 2005;15:1576–1583. doi: 10.1101/gr.3709305. [DOI] [PMC free article] [PubMed] [Google Scholar]
- Schork N.J., et al. Common vs. rare allele hypotheses for complex diseases. Curr. Opin. Genet. Dev. 2009;19:212–219. doi: 10.1016/j.gde.2009.04.010. [DOI] [PMC free article] [PubMed] [Google Scholar]
- Service R.F. Gene sequencing. The race for the $1000 genome. Science. 2006;311:1544–1546. doi: 10.1126/science.311.5767.1544. [DOI] [PubMed] [Google Scholar]
- Tishkoff S.A., et al. The genetic structure and history of Africans and African Americans. Science. 2009;324:1035–1044. doi: 10.1126/science.1172257. [DOI] [PMC free article] [PubMed] [Google Scholar]
- Thomas D.C., et al. Methodological issues in multistage genome-wide association studies. Stat. Sci. 2009;24:414–429. doi: 10.1214/09-sts288. [DOI] [PMC free article] [PubMed] [Google Scholar]
- Wong G.K., et al. A population threshold for functional polymorphisms. Genome Res. 2003;13:1873–1879. doi: 10.1101/gr.1324303. [DOI] [PMC free article] [PubMed] [Google Scholar]
Associated Data
This section collects any data citations, data availability statements, or supplementary materials included in this article.


