Abstract
Purpose
To quantify the morphological features of the optic nerve head using radial polynomials, to use these morphometric models as the basis for classification of glaucomatous optic neuropathy glaucomatous optic neuropathy via an automated decision tree induction algorithm, and to compare these classification results with established methods.
Methods
A cohort of patients with high-risk ocular hypertension or early glaucoma (n = 179) and a second cohort of normal subjects (n = 96) were evaluated for glaucomatous optic neuropathy using stereographic disc photography and confocal scanning laser tomography. Morphological features of the optic nerve head region were modeled from the tomography data using pseudo-Zernike radial polynomials and features derived from these models were used as the basis for classification by a decision tree induction algorithm. Decision tree classification performance was compared with expert classification of stereographic disc photos and analysis of neural retinal rim thickness by Moorfields Regression Analysis (MRA).
Results
Root mean squared (RMS) error of the morphometric models decreased asymptotically with additional polynomial coefficients, from 62 ± 0.5 μm (32 coefficients) to 32 ± 5.7 μm (256 coefficients). Optimal morphometric classification was derived from a subset of 64 total features and had low sensitivity (69%), high specificity (88%), very good accuracy (80%), and area under the ROC curve (AUROC) was 88% (95% CI = 78 to 98%). By comparison, MRA classification of the same records had a comparatively poorer sensitivity (55%), but had higher specificity (95%), with similar overall accuracy (78%) and AUROC curve, 83% (95 % CI = 70 to 96%).
Conclusions
Pseudo-Zernike radial polynomials provide a mathematically compact and faithful morphological representation of the structural features of the optic nerve head. This morphometric method of glaucomatous optic neuropathy classification has greater sensitivity, and similar overall classification performance (AUROC) when compared with classification by neural retinal rim thickness by MRA in patients with high-risk ocular hypertension and early glaucoma.
Keywords: Glaucoma, Optic Nerve, Modeling, Classification, Machine Learning
Introduction
In recent years, clinical imaging techniques such as confocal scanning laser tomography, optical coherence tomography, and scanning laser polarimetry have played an increasingly important role in the diagnosis and management of glaucoma.1-7 Each of these imaging methods generates a great amount of data providing a precise, quantitative description of the anatomical structural features of the optic nerve and surrounding neuroretinal tissues. Best methods of analysis, interpretation, and display of the resulting information for the support of clinical decision making are an area of active research and the motive for this study.
Detecting glaucomatous optic neuropathy based on morphological characteristics of the optic nerve head is a challenge compounded by the wide spectrum of normal anatomical variation seen in the optic nerve head. The difficulty of this task is even greater in patients with early stages of disease and when examiners are without the benefit of longitudinal observations. Several strategies have been developed by others to help address this challenge. For example, neural networks and wavelet-Fourier analysis are two strategies that have been used by others to improve detection of glaucomatous optic neuropathy from nerve fiber layer thickness scans.8, 9 Bowd and colleagues have demonstrated the ability to detect the signature features of glaucomatous optic neuropathy from measurements of the retinal nerve fiber using Optical Coherence Tomography (OCT) imaging.10 Multivariate regression analysis of the neuroretinal rim thickness, linear discriminant functions, and support vector machines were each used with scanning laser tomography data to detect glaucomatous optic neuropathy.11-13 Each of these strategies was devised to address a specific imaging technique or a particular aspect of glaucoma.
In work closely related to this research, Swindale and colleagues modeled scanning laser tomography measurements of the optic cup with a Gaussian template to derive a morphological basis for the classification of glaucomatous optic neuropathy.14 While this Gaussian model provides a good global description of the optic cup, this approach cannot capture local structural features, e.g. notching of the neuroretinal rim or other locally varying structural details associated with glaucomatous optic neuropathy. More flexible and complex mathematical functions could, in theory, provide a better basis for the wide-ranging and often locally varying structural features seen in normal and diseased optic nerves. We hypothesized that modeling the optic nerve with more complex polynomials functions would provide a better basis for structural classification of glaucomatous optic neuropathy.
In previous work involving different ocular structures, we have used a series of orthogonal circular polynomials (Zernike polynomials) to successfully model the morphological features of the cornea and then used these modeled features as input for a machine learning classifier to detect keratoconus.15 Using an analogous strategy, the three objectives of this research were (1) to use a related orthogonal series of radial polynomials (pseudo-Zernike polynomials) to quantitatively model the morphological features of the optic nerve head from confocal scanning laser tomography data and then (2) use these morphometric models as the basis for classification of normal and glaucomatous optic neuropathy by machine learning methods, and finally, (3) to determine the classification performance of our morphometric analysis with expert evaluation of stereographic disc photography and Moorfields Regression Analysis in patients with high-risk ocular hypertension and early glaucoma.
Methods
Subjects
A total of 275 subjects were recruited from the Portland, Oregon metropolitan area as participants in the Perimetry and Psychophysics in Glaucoma Study (Discoveries in Sight clinical research facility, Legacy Health Systems, Portland, OR). All subjects underwent a full ophthalmologic eye examination that included visual field testing–Humphrey Field Analyzer II, 24-2 test procedure with the SITA Standard or Full Threshold test strategy. In one cohort (n = 179), subjects included individuals with high-risk ocular hypertension (bilateral untreated intraocular pressure ≥ 22 mmHg) as well as individuals with early glaucoma (Mean Deviation [MD] −6 dB or better). Subjects were required to have one or more additional risk factors for glaucoma, or for disease progression listed as inclusion criteria in Table 1.16 Additional details regarding these subjects are described in previous publications.17 A second cohort of normal subjects (n = 96) were combined with these high-risk subjects to form the total study sample. Participants from this normal group were excluded if they had any signs of glaucomatous optic neuropathy or an abnormal visual field assessed by standard automated perimetry, Table 1. This research conformed to the tenets of the Declarations of Helsinki; all participants provided informed consent as participants in the primary study, the Perimetry and Psychophysics in Glaucoma study, which was approved by the Legacy Health System Institutional Review Board (IRB).
Table 1.
Subject Inclusion and Exclusion
| Inclusion Criteria for High-Risk Ocular Hypertension and Early Glaucoma Cohort* |
| History of glaucoma treatment |
| History of migraine |
| Reynaud’s syndrome or vasospasm |
| African-American ancestry |
| Age > 70 years |
| History of systemic hypertension |
| Diet-controlled diabetes |
| Visual field loss (Abnormal GHT or PSD (p < .05%)), with Mean Deviation (MD) better than −6 dB at baseline. |
| Exclusion Criteria |
| Other previous or current ocular pathology |
| Previous ocular surgery (except successful cataract surgery) |
| Prior neurological surgery or disease |
| Visual acuity worse than 20/40 in either eye |
| Refractive error worse than ±5.00 D sphere and 2.00 D cylinder |
| Diabetes requiring medication |
| Additional Exclusion Criteria for Normal Comparison Cohort |
| Abnormal GHT test: SAP 24-2 program |
| Cup-disc ratio asymmetry > 0.2 |
| Possible neuroretinal rim thinning, notching, narrowing |
| Disc hemorrhage |
Subjects in the High-Risk Ocular Hypertension and Early Glaucoma cohort were required to have one or more of the listed inclusion criteria. GHT = Glaucoma Hemifield Test; PSD = Pattern Standard Deviation; SAP = standard automated threshold perimetry
Subjects received both stereographic disc photography (model 3-Dx; Nidek, Fremont, CA) and confocal scanning laser tomography examinations (HRT 1.0, Heidelberg Engineering, Vista, CA) less than 30 days apart. Two fellowship-trained glaucoma specialists independently graded the stereo disc photos as described previously, 17 noting any signs of glaucomatous optic neuropathy such as a cup-disc ratio asymmetry > 0.2, global or localized neuroretinal rim thinning, sectoral nerve fiber bundle defects, narrowing, or disc hemorrhage. Any disagreements between examiners were adjudicated by a third expert examiner. The final categorical assignments of Normal and glaucomatous optic neuropathy served as the reference standard for comparisons with other classification methods.
Confocal scanning laser tomography was performed by an experienced ophthalmic technician using the HRT (Heidelberg Engineering, GmbH, Vista, CA, USA). A minimum of three scans were taken with a 10° field centered on the optic disc. Images were corrected for astigmatism >1D and corneal magnification due to corneal curvature. Contour lines outlining the disc margin were drawn by experienced examiners while simultaneously viewing stereoscopic photographs of the disc to enable classification using Moorfields Regression Analysis.11 The numeric topographical data were exported and processed for further analysis as described below.
Morphometric Modeling with Radial Polynomials
The morphological features of the optic disc that we measured using confocal scanning laser tomography were mathematically modeled with pseudo-Zernike polynomials.18 Like the more familiar and related Zernike polynomials, each of the circular, radially symmetric orthogonal geometric modes are combined in varying proportions to model arbitrarily complex surfaces—in this case the morphological features of the optic disc. The polynomial modes are scaled to unit variance over a unit circle. Thus, each individual polynomial coefficient provides independent and proportional information about the contribution of its related mode to the overall fitted surface.19 For the interested reader, additional details regarding the mathematical properties of these polynomials and their use can be found elsewhere.19, 20
One eye from each subject was randomly selected to evaluate the fidelity of the calculated morphological models (RMS error) and the computational time associated with increasing model complexity. For each record, the HRT elevation data array was centered on the optic disc and cropped to a maximum diameter of 2.1 mm.21, 22 This was sufficient to capture the entire optic nerve head and a small portion of the adjacent peripapillary tissue.23, 24 All left eye data were reflected about the central vertical axis to represent mirror symmetric right eyes allowing us to combine right and left eye data for subsequent statistical analysis. We computed a number of different morphological models for each record using custom routines written in MatLab (Natik, MA), varying the model complexity from 16 to 256 total polynomial coefficients.
Morphological Classification
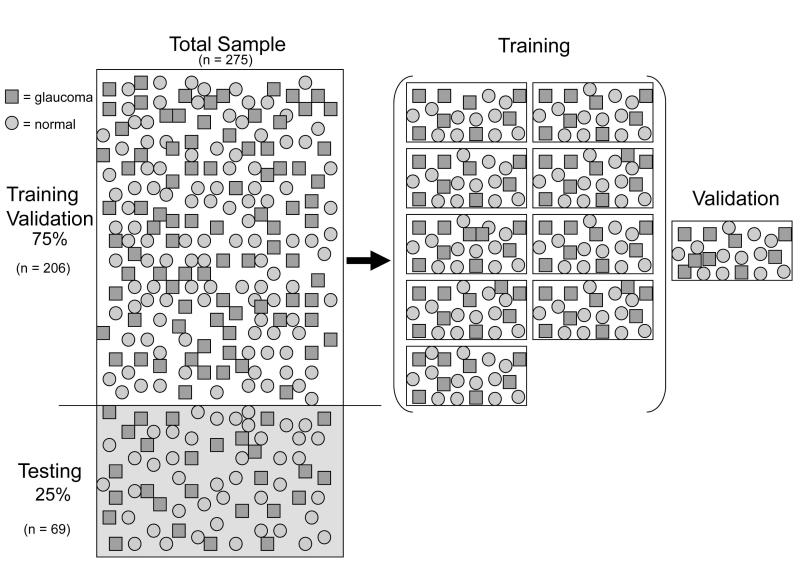
The confocal scanning laser tomography data from the fellow eyes, which were not used in the modeling experiments described above, were fit with a pseudo-Zernike polynomial (64 coefficients). These morphological models were then used to develop and test the performance of a machine learning classifier designed to differentiate normal and glaucomatous optic disc morphology. These data were divided into training (75%; n = 206/275) and testing (25%; n = 69/275) partitions that were stratified such that the number of normal and glaucomatous eyes were proportional to the total sample, Figure 1. The training data partition was used to develop and validate the performance of the decision tree classifier using conventional 10-fold cross-validation techniques.25 The testing data partition was held-out to evaluate the performance of the final best classifier.
Figure 1.
Illustration of how the classification data were managed (□ = Glaucoma, ○ =Normal). The total sample was divided into training and test subsets (75% / 25%). The Training data (n=206/275) were further stratified into 10 equal partitions. Nine partitions were used to induce a classification tree while the 10th partition (validation) was held-out to evaluation performance of the induced decision tree. For each of 10 iterations, the validation partition was swapped with a new partition and another decision tree was induced and then validated. The final best classifier was then evaluated on the previously unused test subset (n = 69/275).
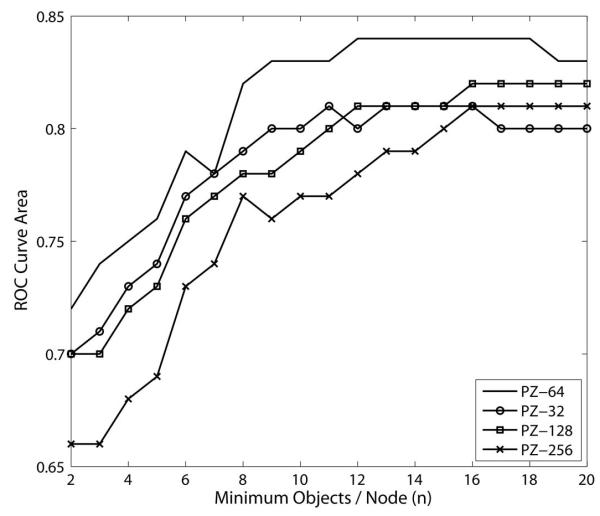
The individual pseudo-Zernike mode coefficients were selected as numeric input features for the C4.5 decision tree induction algorithm (Weka data mining suite v 3.5.2).26 Based on the morphological input features provided, the algorithm was used to quantitatively derive the best subset of features necessary to distinguish between the two categorical classes of interest: Normal and glaucomatous optic neuropathy. An example of the conditional classification rules that are the output of this algorithm is shown in Figure 2.27, 28 In separate experiments not presented here,29 we systematically evaluated the required morphological model resolution and any user-specified decision tree algorithm parameters in order to maximize decision tree classification performance using area underneath the ROC curve (AUROC) as the criterion. Decision tree classification performance was optimal when optic disc morphology was modeled with 64 pseudo-Zernike coefficients; we therefore used these models in all subsequent classification experiments. As shown in Figure 3 and in detail elsewhere,29 this morphological representation of the raw tomography data had consistently greater ROC curve area when compared to models generated with 32, 128 or 256 polynomials.
Figure 2.
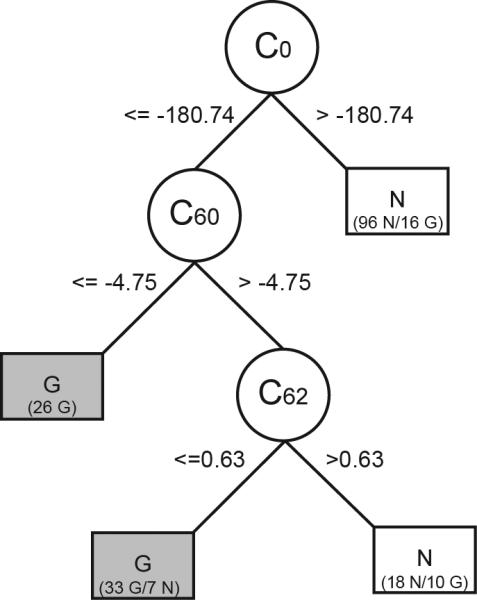
Decision tree structure is comprised of branches, nodes and leaves. Each node is an individual polynomial coefficient hierarchically selected as the most relevant attribute for separating the two categories of interest. Branches of the decision tree represent a conditional test upon the value of each attribute at that node. Leaves correspond to the terminal nodes containing individual records that are given a single classification label, e.g. G = glaucoma, N = normal. A leaf with mixed class representation is labeled with the majority class and a breakdown of the number of subjects from each group is given, e.g. (33 G/N 7) where 33 subjects were correctly labeled as glaucoma and 7 were false positive errors.
Figure 3.
Plot of classification performance (ROC curve area) as a function of model complexity (minimum number of objects per node. Better classification (larger AUROC) is achieved with a total of 64 polynomial coefficients. Likewise, a more complex decision tree with many branches (fewer objects per node) does not produce the best classification performance. PZ-## = pseudo-Zernike model with the corresponding number of polynomial coefficients.
Classification Comparisons
During the development phase, the training data partition was used to estimate classification performance measures such as sensitivity, specificity, accuracy, and area underneath the ROC curve. These metrics are reported as the mean of multiple iterations from the 10-fold cross-validation. During the test phase, the optimal decision tree structure derived from training was used to classify data from the previously unused test data partition. Classification performance of the optimal decision tree model was compared against Moorfields Regression Analysis. To make comparisons between the binary decision tree classifier and Moorfields Regression Analysis, we combined the Borderline and Outside Normal Limits categories forming a single glaucomatous optic neuropathy class to create a binary classifier. Area underneath the ROC curves were estimated using a binormal assumption with Stata v. 11.0 (College Station, TX).
To visualize the structural features that differed between the two categories and to better discern the morphological basis for classification of glaucomatous optic neuropathy, we constructed a morphological surface from the pseudo-Zernike coefficients that was representative of each patient category. This was done by setting the model coefficients equal to values from the decision tree along with the remaining coefficients proportional to the median values representative of each class, either normal or glaucomatous optic neuropathy. This visualization provides an intuitive way to visualize and graphically interpret the quantitative morphological differences observed between the two patient categories studied.
Results
The subjects evaluated in this study were predominantly female (60%) and white (83%). The average age of these subjects was 57 ± 13 years. Classification of the 275 eyes by expert examiners using stereographic disc photography resulted in a total of 163 eyes with normal optic discs (59%) and 112 eyes (41%) with glaucomatous optic neuropathy. With some exceptions, visual function in both groups of subjects was normal when measured by standard automated perimetry. The distribution of visual field Mean Deviation when subjects were grouped by stereographic disc photography classifications was not statistically different at the p < .05 level (Mann-Whitney test, p = .05). The median and inter-quartile range for the Normal group was +0.96 (IQR = +0.13 to +1.71 dB) and for the glaucomatous optic neuropathy group was +0.64 (IQR = −0.40 to +1.55 dB).
Morphometric Modeling
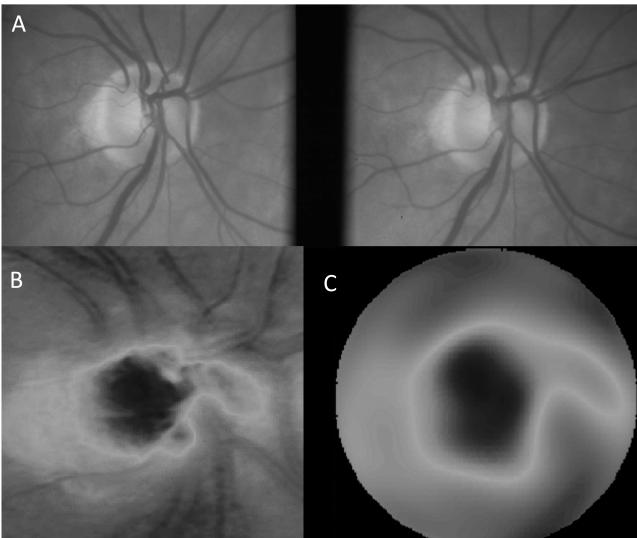
Modeling the morphological features of the optic disc from confocal scanning laser tomography elevation data with pseudo-Zernike polynomials was computationally intensive. The time required to compute the coefficients for these polynomial models using our customized algorithms increased linearly as a function of the number of computed coefficients (increasing model complexity). The time required to compute the 32 coefficient morphological model was 5 ± 0.5 s, 64 coefficients required 11±1.0 s and 256 coefficients took 61 ± 5.7 s. A representative example comparing the raw tomography elevation data to a 64 coefficient morphometric model along with the stereographic disc photo is shown in Figure 4. The Moorfields Regression Analysis category for this eye was “Within Normal Limits.” The full report for this case is provided as supplemental content online (Figure MRA 1, Supplemental Digital Content 1). The residual model error decreased asymptotically as additional coefficients were included in the morphometric model. The RMS error of the 64 coefficient pseudo-Zernike model was 51±1μm. While the model error was reduced to 32±5 μm with 256 coefficients, the computational time increased greatly.
Figure 4.
Example of pseudo-Zernike model of the optic disc data; stereographic disc photo (A); raw elevation data of the confocal scanning laser tomography examination (B); pseudo-Zernike model of the elevation data using a total of 64 polynomial coefficients (C). The RMS error of this fit was 31 μm.
Morphological Classification
The best decision tree classification performance was the product of a compact decision tree structure that included a total of 3 pseudo-Zernike polynomial coefficients. The resulting decision tree is shown in Figure 2. The first geometric mode, C0, is a plane whose elevation corresponds to the mean height of the optic disc and surrounding peripapillary tissue and is related to the diameter and depth of the cup. Thus, applying the rule from the first branch of the decision tree (Figure 2), a mean surface height less than 181 μm could differentiate 79% (96/121) of all eyes with normal optic discs in this training sample. Knowing the value of two additional polynomial modes (C60 and C62) helped to further separate eyes with glaucomatous optic neuropathy from the remaining eyes with normal optic discs.
Classification Comparisons
Repeated trials with 10-fold cross validation on the training data provided initial estimates of classification performance as well as the variability of those estimates (mean ± SD): accuracy was 84 ± 15% and ROC curve area was 85 ± 15%. Final performance of the optimal decision tree classifier was determined using the previously unseen test data partition. Final classification performance on the test data partition was consistent with estimates from the training data and is summarized in Table 2: accuracy was 80% and ROC curve area was 88% (95% CI = 78 to 98%); which was not statistically different from the training performance estimates (t-test; p>.05). This indicates that the training and testing data partitions were representative of one another and the sampling methods used to partition the data were fair. Sensitivity of this classification method on these data was 53.3% at 95% specificity. Agreement with the stereo disc grading standard was estimated using the Kappa statistic (0.58, p < .001).
Table 2.
Decision Tree Classification Performance
| Decision Tree Class |
||||
|---|---|---|---|---|
| Photo Class | GON | Normal | Total | |
| GON | 20 | 9 | 29 | Sensitivity = 20/29 = 69% |
| Normal | 5 | 35 | 40 | Specificity = 35/40 = 88% |
| Total | 25 | 44 | 69 | Accuracy = (20+35)/69 = 80% |
Comparison of Classification Assignments by Stereographic Disc Photography (Photo Class) and Decision Tree Classification GON = Glaucomatous Optic Neuropathy; AUROC = 88%; Kappa = 0.58. Sensitivity at 95% specificity was 50.3%.
Classification performance of these data using Moorfields Regression Analysis was performed for the same test data described above, Table 3. There were a total of 15 disagreements between the photographic and Moorfields Regression Analysis classification methods—13 false negative and 2 false positive cases (accuracy = 78%). Using stereo disc photography as the standard, Moorfields Regression Analysis had poorer sensitivity in our test sample, 55% (16 of 29 eyes correctly identified as glaucomatous optic neuropathy) and excellent specificity; 95% (38 of 40 eyes correctly identified as normal optic discs). Sensitivity of the Moorfields Regression Analysis classification method on these data was 19.9% at 95% specificity. Agreement with stereo disc grading was estimated using the Kappa statistic (0.55, p < .001).
Table 3.
Moorfields Regression Classification Performance
| MRA Class |
||||
|---|---|---|---|---|
| Photo Class | GON | Normal | Total | |
| GON | 16 | 13 | 29 | Sensitivity = 16/29 = 55% |
| Normal | 2 | 38 | 40 | Specificity = 38/40 = 95% |
| Total | 18 | 51 | 69 | Accuracy = (16+38)/69 = 78% |
Comparison of Classification Assignments by Stereographic Disc Photography (Photo Class) and Moorfields Regression Analysis (MRA); GON = Glaucomatous Optic Neuropathy; Borderline and Outside Normal Limits categories were combined to create binary MRA class assignments; AUROC = 83%; Kappa = 0.53. Sensitivity at 95% specificity was 19.9%.
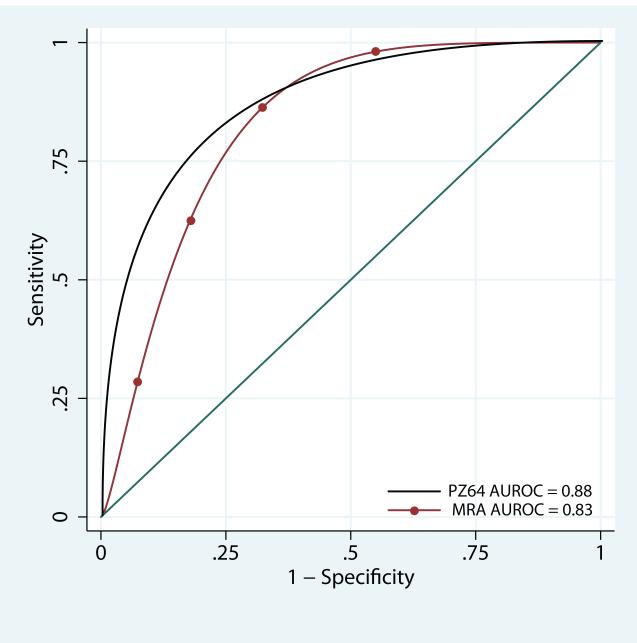
A comparison of the ROC curve area for our morphometric classification method and Moorfields Regression Analysis is shown in Figure 5. The ROC curve area for the Moorfields Regression Analysis was 83% (95% CI = 70 to 96%). The ROC curve area for our morphometric classification method was 88% (95% CI = 78 to 98%); this difference was not statistically significant (chi square; p =.10).
Figure 5.
Receiver Operator Characteristic Curves for the two classification methods evaluated: a decision tree classifier developed from a pseudo-Zernike model with 64 coefficients (PZ64) and Moorfields Regression Analysis (MRA). Area under the ROC curve (AUROC) is given in the legend.
Classification Visualization
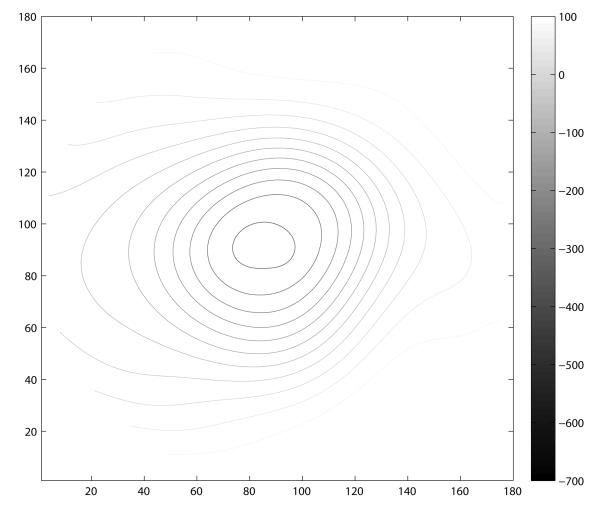
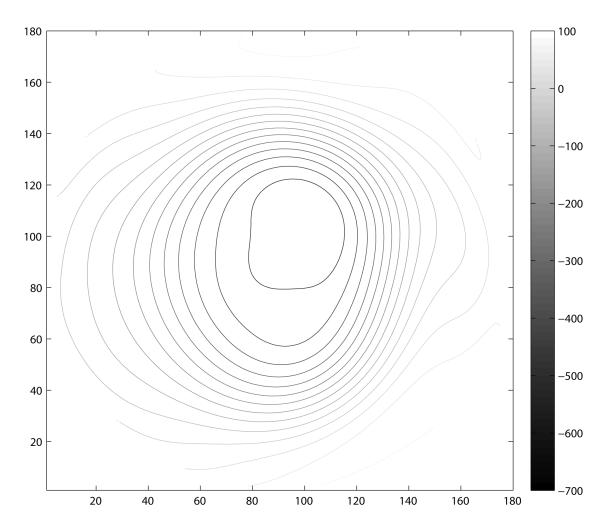
A contour map for each patient category (normal and glaucomatous optic neuropathy) was constructed by combining the polynomial modes comprising the decision tree along with the median values of the remaining polynomial modes for each respective subject category. The constructed morphological model creates a representative visualization for each patient category. The resulting contour map for each patient group is shown in Figure 6. Analogous to the isometric contour lines of a geological topographic map, each contour line represents a 50 μm change in elevation. These contour plots illustrate the common morphological features that differentiate these two groups using these methods. Notable differences include a larger area of deeper cupping (corresponding to C0), vertical ovalization of the cup, and more steeply sloped walls (corresponding to the higher order terms of the model C60 and C62) in the group classified as glaucomatous optic neuropathy.
Figure 6.
Visualization of the classification attributes modeled with 64 pseudo-Zernike coefficients by patient category. Isometric contour lines are separated by 50 μm increments in both plots. These models were constructed from the median attributes of the representative class as assigned by the decision tree classifier. Eyes categorized as normal (A) had characteristically shallow contour with a horizontally oriented elliptical shape. In contrast, the eyes classified as Glaucomatous optic neuropathy (B) had a larger, deeper, and more steeply contoured peripapillary region. In contrast to the normal class, this model of glaucomatous optic neuropathy demonstrates vertical ovalization
Discussion
Although structural features associated with glaucomatous optic neuropathy do not always precede loss of visual function, it has been reported that this is frequently the case.30-33 This observation motivated our efforts to seek a morphological basis for the classification of glaucomatous optic neuropathy. Our results demonstrate the evaluation of a novel shape-based method to classify glaucomatous optic neuropathy in a population of patients at high-risk for glaucomatous optic neuropathy or with early disease.
This study had limited racial diversity and was primarily white. The Ocular Hypertension Treatment Study demonstrated that different racial groups are associated with different anatomical structural characteristics, e.g. larger discs were observed in patients of African American or Hispanic ethnicity.34, 35 It is not known how this classification strategy would perform using a different ethnic sample of patients or with patients that have established glaucoma. We would expect that patients with established glaucoma would show even better sensitivity by this method.
By design, the subjects evaluated in this study were especially challenging and particularly well suited for testing methods to distinguish eyes with normal optic discs from those with early glaucomatous optic neuropathy that differ only by structural features. Most of the subjects evaluated in this study had little to no visual field loss identifiable by standard automated perimetry. This is in contrast to the work by Swindale and colleagues who contrasted the morphological characteristics of normal patients with others who had confirmed visual field defects caused by glaucoma that were more extensive. It would be interesting to compare these two different morphological modeling methods on a common dataset, especially one that represents the full range of early and late-stage glaucomatous optic neuropathy. Our intentions in this study were to compare our approach with methods that are clinically familiar and widely accessible (e.g. Moorfields Regression Aglobalnalysis). As expected, our patients who were relatively mild on the disease spectrum challenged the sensitivity of our morphological methods of classification as well as the Moorfields Regression Analysis. Our decision tree approach had similar overall accuracy and total AUROC, but had greater sensitivity. Moorfields Regression Analysis on this same sample had high specificity, but comparatively poorer sensitivity; the majority of errors were false-negative classifications (13/15 errors). These classification methods are not based upon the same features and are therefore providing fundamentally different information. Moorfields Regression Analysis is based on a multivariate regression analysis of the neural retinal rim thickness. In contrast, our method captures both global and local morphological features of glaucomatous optic neuropathy in addition to features of the neural retinal rim including disc size, depth, cup shape (e.g. vertical ovalization), and slope of the cup wall. We find that these additional features appear to be important for correct classification of early glaucomatous optic neuropathy.
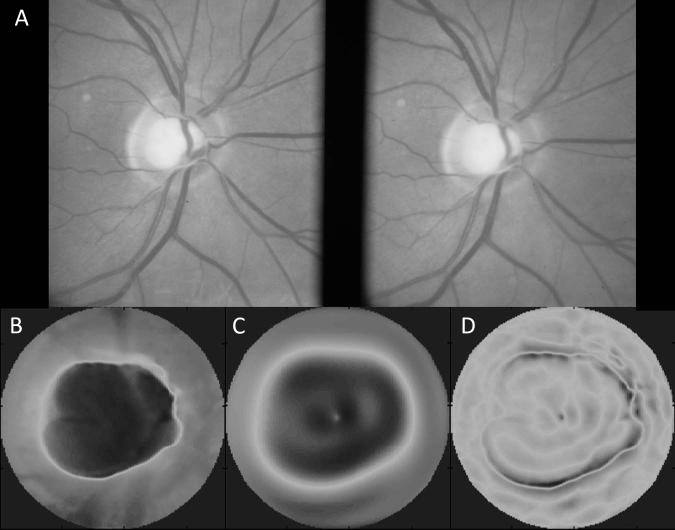
Our use of radial polynomial modes as a surrogate morphological classification feature is one of the primary contributions of this work. In this research, we have extended the use of radial polynomial functions that are widely used for other purposes in vision science, e.g. to model the structural features of optical wavefront aberrations, or the anatomical features of the corneal surface. Using a polynomial series related to the familiar Zernike polynomials, we show that pseudo-Zernike polynomials capture morphological features of the optic disc with good fidelity. Moreover, we show that this modeling method provides a compact representation of those features and preserves the structural details needed to discern the features of early glaucomatous optic neuropathy. Although we fit the data at varying levels of resolution, from low (32 polynomial coefficients) to high resolution (up to 256 coefficients), the model complexity required to produce the best basis for classification was relatively low—64 total coefficients (Figure 3). This is advantageous as the computational time required to generate these polynomial coefficients can be considerable and having too many may make their use impractical. While most eyes could be modeled with good fidelity, in a few cases, these polynomial models had high RMS error (> 50 μm), Figure 7. The Moorfields Regression Analysis associated with the case presented in Figure 7 classified this eye as “Borderline” and the full report is provided as Supplemental Digital Content (Figure MRA2, Supplemental Digital Content 2). The common pattern observed in these eyes was a very high elevation gradient at the edge of the optic cup. Without exception, these eyes were glaucomatous and had a steeply sloped cup margin that was not well fit by the polynomial models. While we did not include RMS error as a candidate feature for the basis of classification, these high gradients and localized RMS errors may also be useful for disease detection.
Figure 7.
Sample of an optic disc with high RMS error (RMSE = 76 μm); stereographic disc photo (A) and raw elevation data (B) show a relatively large optic disc with deep cup and steeply sloped walls. The third panel (C) shows the pseudo-Zernike fit to the raw data. Some visible fitting errors are evident within the optic cup. The final panel (D) shows the spatial distribution of the residual error between the raw data (B) and the pseudo-Zernike model (C). The majority of errors with high magnitude occur near the disc margin where the gradient magnitude is greatest.
This observation also points out a limitation of our morphological modeling approach. Fitting the structural data with these pseudo-Zernike polynomials results in greater detail and less residual error than fitting the data with a uniform Gaussian, nevertheless, it still results in some smoothing of the data and this loss of detail may sacrifice some information needed for optimal classification. This was in part the reasoning behind our use of models with multiple levels of resolution (e.g. 32-256 polynomial coefficients). The lack of improvement in classification accuracy with higher-order models suggests that additional coefficients were not providing additional useful information, but were adding significantly to the computational burden.
Modeling the anatomical features of the optic nerve with radial polynomials has another important purpose: to expose the morphological features of the optic nerve for use by machine learning methods. Most previous methods have used traditional summary data (e.g. cup/disc ratio, disc area, cup volume, etc.) or combinations of these summary indices as input for machine classifiers.12, 36 Our morphological modeling methods permit us to use a compact and faithful representation of the raw instrument data while preserving relevant details.
The modeled morphological features produced a decision tree that is compact, requiring only three polynomial coefficients, and is easily interpreted as a series of conditional logical tests of these three attributes. The first attribute, C0, corresponds to the mean height of optic disc. It is more difficult to assign any direct anatomical correspondence to the higher order modes of the morphological model. A fundamental property of these polynomials is that the profile of the center of the mode becomes less complex for terms that have higher angular frequency, e.g. C62. Thus, modes with lower angular frequency, e.g. C60 will have a greater gradient magnitude near the center when compared with C62. Conversely, C62 will have a greater peripheral gradient magnitude by comparison. Lower coefficients will therefore be associated with steeper cup walls at varying diameters. These observations are consistent with greater negative coefficient values associated with the glaucomatous optic neuropathy as predicted by the decision tree classifier. When these polynomial modes are combined with the median class attributes (Figure 6), the resulting contour surfaces show several characteristics typical of glaucomatous optic neuropathy. The contour surface of the normal category has a relatively smaller and shallower depression of the optic cup, with more gently sloping walls. This is evident by comparing the contour plots provided in Figure 6 where each contour line represents an increment of 50 μm change in depth. Also apparent is the difference in the degree of vertical ovalization of the cup. The normal category has contour lines that reveal a horizontally oriented elliptical shape and the glaucomatous optic neuropathy category has a distinctly vertically oriented elliptical shape. While these differences help discriminate between these two patient groups on a cross-sectional basis, how these same features evolve with disease onset and progression is the subject of ongoing work.
The decision tree classification approach that we employed is one of many supervised learning methods, which depend on training data that have been separately categorized based upon prior knowledge. We chose expert classification of stereographic disc photography as the classification standard for this study since it is arguably the most relevant comparison and the most widely used clinical standard for evaluation of structural change associated with glaucomatous optic neuropathy.17, 33, 37-41 A common limitation of such supervised learning methods is that classification performance is limited to the agreement with the selected standard.
Swindale and colleagues have shown by different methods and in patients with disease defined by confirmed visual field loss, that several of the same features we have shown are important for correct classification of glaucomatous optic neuropathy.14 In their work, they modeled confocal scanning laser tomography data, but used a model based a priori on a two-dimensional Gaussian surface. Similar to what we show, they found that horizontal and vertical curvature in the peripapillary region helped to discriminate between normal and glaucomatous eyes respectively. They also found that steepness of the cup wall, e.g. curvature gradient in the cup was a useful discriminating feature. They further suggested the need to characterize additional features not captured by their Gaussian-based model as we have tried to do in this research. They suggested that local features such as cup excavations or rim notching might be useful discriminating features and this is part of what we attempted to address in our research. Unlike the methods of Swindale and colleagues, the decision tree classification method we describe has no assumed morphological model of the glaucomatous optic disc. It is derived from the data, and is therefore easily capable of incorporating a wide range of variant morphological characteristics into the definition of normal and diseased eyes. While our modeling methods may capture additional features, abrupt discontinuities in the data caused by distinctly local features (e.g. steep cup wall gradients) still prove difficult for our current methods. It may be possible to modify our approach and develop specific modeling methods capable of representing local anomalies better, however, as we tune our methods preferentially detect local features it will be more challenging to separate subtle local anatomical features from natural anatomical variation.
In an approach similar to ours, Artes and colleagues fit confocal scanning laser tomography data from 51 normal and 85 glaucoma patients with as many as 256 Zernike polynomials to model the optic nerve head features and then classified patients using two different machine learning methods.42 They used multilayer perceptrons (MLP) and support vector machines (SVM) to classify their data. Their reported accuracy for the MLP was 74% and SVM was 87%. They too evaluated several levels of model resolution, but unlike our findings, they found that more polynomial coefficients were required to achieve best classification performance (47 polynomial terms). Consistent with our findings, they also reported that additional coefficients resulted in lower overall classification accuracy (87% with 47 terms, 79% with 254 terms). There is a point at which increasing the number of terms in the polynomial model contributes no additional information and therefore no improvement in the ability to separate these two patient categories. The magnitude of higher-order polynomials asymptotically declines and their variability increases with increasing model complexity. Our results demonstrate that a 7th order polynomial fit captures much of the fundamental difference between these two groups. It is possible that our use of pseudo-Zernike polynomials explains the fewer number of coefficients that were required with our modeling methods. An additional advantage of our approach is that the use of a decision tree classifier permits the user to easily visualize the basis for categorical assignments as opposed to other black-box machine learning methods like neural networks and support-vector machines.
Decision trees provide a non-parametric means of partitioning the data into discrete categories that produces an easily interpretable set of rules for classification. Alternative machine-learning-based methods of classification exist that may offer better classification performance. The tradeoff of these alternative approaches is that they often sacrifice interpretability for improved classification performance. For example, meta-classifiers (e.g. boosting and bagging techniques) that can be used in combination with traditional decision tree algorithms, parametric decision trees, support vector machines and other techniques may provide greater classification performance, but provide little to no insight for the user about how or why a particular case was classified as it was. Using support vector machines and neural networks, Artes and colleagues reported similar classification performance compared to what we show here, but these methods do not permit clinicians to know the basis of classification assignments by these methods, e.g. what features contributed to the resulting categories. The accuracy of our current methods may be improved upon by using a combination of ensemble techniques known as boosting and bagging.43 We have previously used these ensemble techniques to improve decision tree performance for keratoconus detection.44 While this decision tree classification method permits cross-sectional classification of data it may also be adapted for longitudinal analysis and this is the subject of ongoing research.
Supplementary Material
Acknowledgments
The authors gratefully acknowledge contributions from the following individuals: Cindy Blachly and Thie Smith (data collection); Emily Patterson, Annisa Jamil and George A. Cioffi (photo grading); Brad Fortune (photo grading data aggregation).
Support: MDT National Institutes of Health K23 EY16225 CAJ National Institutes of Health R01 EY03424 SP National Science Foundation CAREER, IIS - 0347662
Footnotes
Disclosure: MD Twa: Other clinical research funding from Heidelberg engineering CA Johnson: None S Parthasarathy: None MA Bullimore: None
List of Supplemental Digital Content MRA1_235R.pdf MRA2_209R.pdf
This is a PDF file of an unedited manuscript that has been accepted for publication. As a service to our customers we are providing this early version of the manuscript. The manuscript will undergo copyediting, typesetting, and review of the resulting proof before it is published in its final citable form. Please note that during the production process errors may be discovered which could affect the content, and all legal disclaimers that apply to the journal pertain.
References
- 1.Burk RO, Volcker HE. Current imaging of the optic disk and retinal nerve fiber layer. Curr Opin Ophthalmol. 1996;7:99–108. doi: 10.1097/00055735-199604000-00017. [DOI] [PubMed] [Google Scholar]
- 2.Weinreb RN, Zangwill LM. Imaging technologies for assessing neuroprotection in glaucomatous optic neuropathy. Eur J Ophthalmol. 1999;9(Suppl 1):S40–43. doi: 10.1177/112067219900901S14. [DOI] [PubMed] [Google Scholar]
- 3.Johnson CA, Cioffi GA, Liebmann JR, Sample PA, Zangwill LM, Weinreb RN. The relationship between structural and functional alterations in glaucoma: a review. Semin Ophthalmol. 2000;15:221–233. doi: 10.3109/08820530009037873. [DOI] [PubMed] [Google Scholar]
- 4.Zangwill LM, Williams J, Berry CC, Knauer S, Weinreb RN. A comparison of optical coherence tomography and retinal nerve fiber layer photography for detection of nerve fiber layer damage in glaucoma. Ophthalmology. 2000;107:1309–1315. doi: 10.1016/s0161-6420(00)00168-8. [DOI] [PubMed] [Google Scholar]
- 5.Burgoyne CF, Downs JC, Bellezza AJ, Hart RT. Three-dimensional reconstruction of normal and early glaucoma monkey optic nerve head connective tissues. Invest Ophthalmol Vis Sci. 2004;45:4388–4399. doi: 10.1167/iovs.04-0022. [DOI] [PubMed] [Google Scholar]
- 6.Greenfield DS, Weinreb RN. Role of optic nerve imaging in glaucoma clinical practice and clinical trials. Am J Ophthalmol. 2008;145:598–603. doi: 10.1016/j.ajo.2007.12.018. [DOI] [PMC free article] [PubMed] [Google Scholar]
- 7.Huang ML, Chen HY, Lin JC. Rule extraction for glaucoma detection with summary data from StratusOCT. Invest Ophthalmol Vis Sci. 2007;48:244–250. doi: 10.1167/iovs.06-0320. [DOI] [PubMed] [Google Scholar]
- 8.Reus NJ, Lemij HG. Diagnostic accuracy of the GDx VCC for glaucoma. Ophthalmology. 2004;111:1860–1865. doi: 10.1016/j.ophtha.2004.04.024. [DOI] [PubMed] [Google Scholar]
- 9.Essock EA, Zheng Y, Gunvant P. Analysis of GDx-VCC polarimetry data by Wavelet-Fourier analysis across glaucoma stages. Invest Ophthalmol Vis Sci. 2005;46:2838–2847. doi: 10.1167/iovs.04-1156. [DOI] [PubMed] [Google Scholar]
- 10.Bowd C, Weinreb RN, Williams JM, Zangwill LM. The retinal nerve fiber layer thickness in ocular hypertensive, normal, and glaucomatous eyes with optical coherence tomography. Arch Ophthalmol. 2000;118:22–26. doi: 10.1001/archopht.118.1.22. [DOI] [PubMed] [Google Scholar]
- 11.Wollstein G, Garway-Heath DF, Hitchings RA. Identification of early glaucoma cases with the scanning laser ophthalmoscope. Ophthalmology. 1998;105:1557–1563. doi: 10.1016/S0161-6420(98)98047-2. [DOI] [PubMed] [Google Scholar]
- 12.Iester M, Jonas JB, Mardin CY, Budde WM. Discriminant analysis models for early detection of glaucomatous optic disc changes. Br J Ophthalmol. 2000;84:464–468. doi: 10.1136/bjo.84.5.464. [DOI] [PMC free article] [PubMed] [Google Scholar]
- 13.Zangwill LM, Chan K, Bowd C, et al. Heidelberg retina tomograph measurements of the optic disc and parapapillary retina for detecting glaucoma analyzed by machine learning classifiers. Invest Ophthalmol Vis Sci. 2004;45:3144–3151. doi: 10.1167/iovs.04-0202. [DOI] [PMC free article] [PubMed] [Google Scholar]
- 14.Swindale NV, Stjepanovic G, Chin A, Mikelberg FS. Automated analysis of normal and glaucomatous optic nerve head topography images. Invest Ophthalmol Vis Sci. 2000;41:1730–1742. [PubMed] [Google Scholar]
- 15.Twa MD, Parthasarathy S, Roberts C, Mahmoud AM, Raasch TW, Bullimore MA. Automated decision tree classification of corneal shape. Optom Vis Sci. 2005;82:1038–1046. doi: 10.1097/01.opx.0000192350.01045.6f. [DOI] [PMC free article] [PubMed] [Google Scholar]
- 16.Hodapp E, Parrish RI, Anderson D. Clinical decisions in glaucoma. The CV Mosby Co.; St Louis: 1993. pp. 52–61. [Google Scholar]
- 17.Fortune B, Demirel S, Zhang X, et al. Comparing multifocal VEP and standard automated perimetry in high-risk ocular hypertension and early glaucoma. Invest Ophthalmol Vis Sci. 2007;48:1173–1180. doi: 10.1167/iovs.06-0561. [DOI] [PubMed] [Google Scholar]
- 18.Bhatia AB, Wolf E. On the circle polynomials of Zernike and related orthogonal sets. Proc Cambridge Philosoph Soc. 1954;50:40–48. [Google Scholar]
- 19.Teh CH, Chin RT. On image analysis by the methods of moments. IEEE T Pattern Anal. 1988;10:496–513. [Google Scholar]
- 20.Iskander DR, Morelande MR, Collins MJ, Davis B. Modeling of corneal surfaces with radial polynomials. IEEE Trans Biomed Eng. 2002;49:320328. doi: 10.1109/10.991159. [DOI] [PubMed] [Google Scholar]
- 21.Huynh SC, Wang XY, Burlutsky G, Mitchell P. Symmetry of optical coherence tomography retinal measurements in young children. American journal of ophthalmology. 2007;143:518–520. doi: 10.1016/j.ajo.2006.09.050. [DOI] [PubMed] [Google Scholar]
- 22.Ong LS, Mitchell P, Healey PR, Cumming RG. Asymmetry in optic disc parameters: the Blue Mountains Eye Study. Investigative ophthalmology & visual science. 1999;40:849–857. [PubMed] [Google Scholar]
- 23.Jonas JB, Gusek GC, Naumann GO. Optic disc, cup and neuroretinal rim size, configuration and correlations in normal eyes. Invest Ophthalmol Vis Sci. 1988;29:1151–1158. [PubMed] [Google Scholar]
- 24.Quigley HA, Brown AE, Morrison JD, Drance SM. The size and shape of the optic disc in normal human eyes. Arch Ophthalmol. 1990;108:51–57. doi: 10.1001/archopht.1990.01070030057028. [DOI] [PubMed] [Google Scholar]
- 25.Kohavi R. A Study of Cross-Validation and Bootstrap for Accuracy Estimation and Model Selection. International Joint Conference on Artificial Intelligence. 1995:1137–1145. [Google Scholar]
- 26.Frank E, Hall M, Trigg L, Holmes G, Witten IH. Data mining in bioinformatics using Weka. Bioinformatics. 2004;20:2479–2481. doi: 10.1093/bioinformatics/bth261. [DOI] [PubMed] [Google Scholar]
- 27.Quinlan JR. Induction of decision trees. Machine Learning. 1986;1:81–106. [Google Scholar]
- 28.Quinlan JR. C4.5 : programs for machine learning. x. Morgan Kaufmann Publishers; San Mateo, Calif.: 1993. p. 302. [Google Scholar]
- 29.Twa MD. Vision Science. The Ohio State University; Columbus, OH: 2006. Structural Classification of Glaucomatous Optic Neuropathy; p. 141. [Google Scholar]
- 30.Caprioli J. Correlation of visual function with optic nerve and nerve fiber layer structure in glaucoma. Surv Ophthalmol. 1989;33(Suppl):319–330. [PubMed] [Google Scholar]
- 31.Funk J. Early detection of glaucoma by longitudinal monitoring of the optic disc structure. Graefes Arch Clin Exp Ophthalmol. 1991;229:57–61. doi: 10.1007/BF00172262. [DOI] [PubMed] [Google Scholar]
- 32.Greenfield DS. Optic nerve and retinal nerve fiber layer analyzers in glaucoma. Curr Opin Ophthalmol. 2002;13:68–76. doi: 10.1097/00055735-200204000-00003. [DOI] [PubMed] [Google Scholar]
- 33.Medeiros FA, Vizzeri G, Zangwill LM, Alencar LM, Sample PA, Weinreb RN. Comparison of retinal nerve fiber layer and optic disc imaging for diagnosing glaucoma in patients suspected of having the disease. Ophthalmology. 2008;115:1340–1346. doi: 10.1016/j.ophtha.2007.11.008. [DOI] [PMC free article] [PubMed] [Google Scholar]
- 34.Zangwill LM, Weinreb RN, Beiser JA, et al. Baseline topographic optic disc measurementsare associated with the development of primary open-angle glaucoma: the Confocal Scanning Laser Ophthalmoscopy Ancillary Study to the Ocular Hypertension Treatment Study. Arch Ophthalmol. 2005;123:1188–1197. doi: 10.1001/archopht.123.9.1188. [DOI] [PubMed] [Google Scholar]
- 35.Zangwill LM, Weinreb RN, Berry CC, et al. Racial differences in optic disc topography: baseline results from the confocal scanning laser ophthalmoscopy ancillary study to the ocular hypertension treatment study. Arch Ophthalmol. 2004;122:22–28. doi: 10.1001/archopht.122.1.22. [DOI] [PubMed] [Google Scholar]
- 36.Bowd C, Chan K, Zangwill LM, et al. Comparing neural networks and linear discriminant functions for glaucoma detection using confocal scanning laser ophthalmoscopy of the optic disc. Invest Ophthalmol Vis Sci. 2002;43:3444–3454. [PubMed] [Google Scholar]
- 37.Bowd C, Balasubramanian M, Weinreb RN, et al. Performance of Confocal Scanning Laser Tomograph Topographic Change Analysis (TCA) for Assessing Glaucomatous Progression. Invest Ophthalmol Vis Sci. 2008 doi: 10.1167/iovs.08-2136. [DOI] [PMC free article] [PubMed] [Google Scholar]
- 38.Boes DA, Spaeth GL, Mills RP, Smith M, Nicholl JE, Clifton BC. Relative optic cup depth assessments using three stereo photograph viewing methods. J Glaucoma. 1996;5:9–14. [PubMed] [Google Scholar]
- 39.Girkin CA, McGwin G, Jr., Long C, DeLeon-Ortega J, Graf CM, Everett AW. Subjective and objective optic nerve assessment in African Americans and whites. Invest Ophthalmol Vis Sci. 2004;45:2272–2278. doi: 10.1167/iovs.03-0996. [DOI] [PubMed] [Google Scholar]
- 40.Harper R, Reeves B. The sensitivity and specificity of direct ophthalmoscopic optic disc assessment in screening for glaucoma: a multivariate analysis. Graefes Arch Clin Exp Ophthalmol. 2000;238:949–955. doi: 10.1007/s004170000209. [DOI] [PubMed] [Google Scholar]
- 41.Jampel HD, Friedman D, Quigley H, et al. Agreement among glaucoma specialists in assessing progressive disc changes from photographs in open-angle glaucoma patients. Am J Ophthalmol. 2009;147:39–44. e31. doi: 10.1016/j.ajo.2008.07.023. [DOI] [PMC free article] [PubMed] [Google Scholar]
- 42.Yu J, Abidi SS, Artes P, McIntyre A, Heywood M. Diagnostic support for glaucoma using retinal images: a hybrid image analysis and data mining approach. Stud Health Technol Inform. 2005;116:187–192. [PubMed] [Google Scholar]
- 43.Quinlan JR. Bagging, Boosting, and C4.5. 13th American Association for Artificial Intelligence National Conference on Artificial Intelligence; Portland, OR: AAAI/MIT Press; 1996. pp. 725–730. [Google Scholar]
- 44.Twa MD, Parthasarathy S, Raasch TW, Bullimore MA. Decision tree classification of spatial data patterns from videokeratography using Zernike polynomials. In: Barbara D, Kamath C, editors. 3rd Annual SIAM International Conference on Data Mining; San Francisco, CA: Society for Industrial and Applied Mathematics; 2003. pp. 3–12. [Google Scholar]
Associated Data
This section collects any data citations, data availability statements, or supplementary materials included in this article.


