

Summary
The hippocampus is critical to remembering the flow of events in distinct experiences and, in doing so, bridges temporal gaps between discontiguous events. Here we report a robust hippocampal representation of sequence memories, highlighted by “time cells” that encode successive moments during an empty temporal gap between the key events, while at the same times encoding location and ongoing behavior. Furthermore, just as most place cells “remap” when a salient spatial cue is altered, most time cells form qualitatively different representations (“re-time”) when the main temporal parameter is altered. Hippocampal neurons also differentially encode the key events and disambiguate different event sequences to compose unique, temporally organized representations of specific experiences. These findings suggest that hippocampal neural ensembles segment temporally organized memories much the same as they represent locations of important events in spatially defined environments.
Introduction
A fundamental feature of episodic memory is the temporal organization of serial events that compose a unique experience (Tulving, 1972, 1983). Considerable data indicate that the hippocampus is critical to episodic memory in humans (Vargha-Khadem et al., 1997; Steinvorth et al., 2005) and animals (Fortin et al., 2004; Ergorul & Eichenbaum, 2004; Day et al., 2003). Specific to the temporal organization of episodic memory, the hippocampus is essential to remembering unique sequences of events as well as the ability to disambiguate sequences that share common events in animals (Fortin et al., 2002; Kesner et al., 2002; Agster et al., 2002) and humans (Kumaran & Maguire, 2006; Ross et al., 2009; Lehn et al., 2009; Turbidy & Davachi, 2010; Brown et al., 2010). Furthermore, studies on animals (Meck et al., 1984; Moyer et al., 1990; Agster et al., 2002; Kesner et al., 2005; Farovik et al., 2009) and humans (Staresina & Davachi, 2009; Hales et al., 2009; Hales & Brewer, 2010) have shown that the hippocampus is particularly involved in bridging temporal gaps that are devoid of specific external cues in order to bind discontiguous events that compose sequential memories.
How do hippocampal neurons represent the temporal organization of extended experiences and bridge temporal gaps between discontiguous events? To investigate these issues, we recorded hippocampal neural activity as rats distinguished sequences composed of two events separated by a temporal gap (Figure 1; Kesner et al., 2005). Each trial began with the rat sampling one of two objects, followed by a 10 s empty delay, then as the delay ended, finished with presentation of one of two odors mixed with playground sand in a flower-pot. Each odor was associated with one of the objects, such that if the odor followed its paired object, the rat could dig in the sand to retrieve a buried reward (Go response). Alternatively, if the odor followed the object with which it was not paired, no reward was available in the odor pot; but if the animal withheld digging (NoGo response), a reward could be obtained at a separate location. Importantly, even though the sequences were presented repeatedly, on each trial the rat had to remember the initial object in order to respond correctly to the odor presented at the end of the sequence. This paradigm provides the opportunity to examine whether hippocampal neurons encode sequential events and to explore how hippocampal neuronal activity bridges and disambiguates the identical empty delay between the object and odor that compose each sequence.
Figure 1.
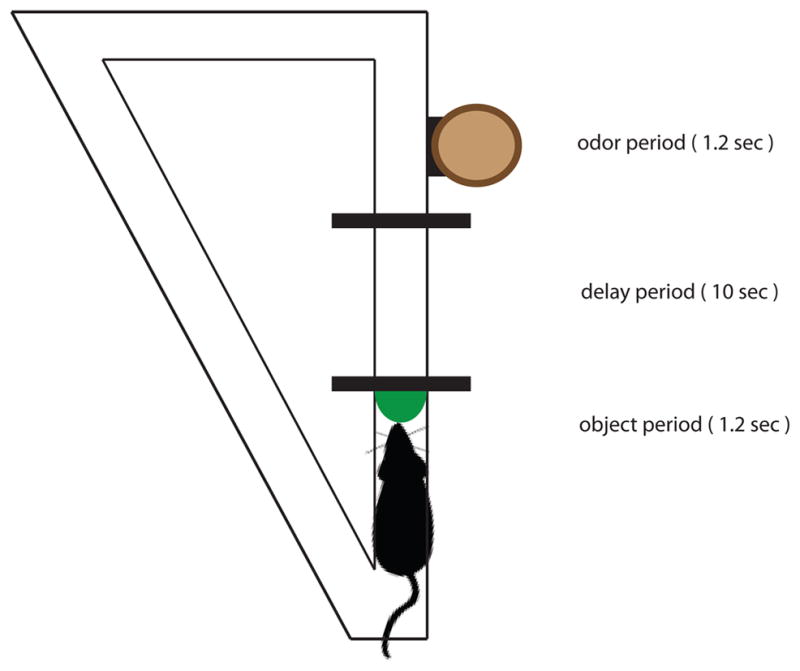
The trial structure for object-delay-odor sequences.
Results and Discussion
Rats learned the sequences over several training sessions, then performed the task as recordings were taken from multiple tetrode arrays implanted in the pyramidal cell layer of dorsal CA1. Here we focus on six 72–117 trial recording sessions from 4 rats where average performance was 77± 5% (range 71 – 84%). Using established criteria, a total of 333 putative pyramidal neurons were isolated (56 ± 20.33/session; range 18–73). The overall average firing rate of these cells was 0.44 ± 0.40 Hz, consistent with the low firing rate typically observed in pyramidal cells. In addition, we distinguished pyramidal cells from putative interneurons by spike waveform analyses (see Methods) and none fit the same cluster criteria on the same electrode across sessions. We analyzed the firing patterns of all neurons that fired ≥ 0.1 Hz during a key trial period (Figure 1): the Object period, when the rat’s nose approached within 1 mm of the object for 1.2 s; the Delay, when the rat entered the Delay zone for approximately 10 s; and the Odor period, when the rat’s nose crossed over the lip of the odor pot for a maximum of 1.2 s or when the rat withdrew, thus ensuring that the rat’s nose was over the pot during the Odor period.
Hippocampal neurons fire at successive times in each trial period
Figure 2 illustrates the firing patterns of representative neurons active in each period. 215 neurons (65% of the total recorded) were active in one or more periods (128 or 59% in more than one period). Of the 99 neurons (30% of the total recorded) activated during the Object period, a broad range of firing patterns was observed, differing in onset time and maximum firing rate (Figure 2, column 1). Some neurons had phasic responses within the first 500 ms and others activated later with responses sustained to the end of that period. The 175 neurons (53% of the total recorded) that fired during the Delay were typically striking in their selectivity to specific moments in the Delay (Figure 2 column 2 depicts the firing patterns of 7 simultaneously recorded neurons). Finally, the 93 neurons (28% of the total recorded) that responded during the Odor period also fired at successive times and the magnitude and pattern of activation differed considerably (Figure 2 right column). Of these, 48 (52%) responded differentially depending on whether the Odor period was followed by a Go or NoGo response (17 more strongly on Go trials and 31 more strongly on NoGo trials; these proportions did not significantly differ; binomial test, two-tailed; H0: p = 0.5; p = 0.06).
Figure 2.

Hippocampal neurons activate serially during each trial period of object-delay-odor sequences. Raster plots for example trials and PSTHs for the entire session are shown for 7 example neurons in each trial period. In the Odor period, data are separated for Go (green) and NoGo (red) trials..
Neuronal ensembles signal time, as well as location and behavior, during the Delay period
We call the neurons that become active during the temporal gap between object and odor presentations “time cells” because, similar to hippocampal “place cells” that fire when the rat is at specific loci in a spatially defined environment, time cells fire at successive moments within a temporally defined period. This characterization of these cells is most striking in larger ensembles of neurons recorded simultaneously. Figure 3a–d illustrates averaged normalized firing rates across all trials from four representative recordings sessions for each rat, including only cells that met a minimum criterion for Delay activity. In each case, the mean peak firing rate for each time cell occurred at sequential moments, and the overlap among firing periods from even these small ensembles of time cells bridge the entire Delay. Notably, the spread of the firing period for each neuron increased with the peak firing time, which might reflect an accumulated error in timing from the outset of the Delay (e.g., Gibbon et al., 1984), non-linear time coding (e.g., Staddon and Higa, 1999), or both. At the ensemble level, the neural population in each session strongly encoded the time passed between moments in the Delay (Figure 4a; linear regression F(7, 29) = 10.05, p<0.001), similar to our previous report of population coding of sequential events (Manns et al., 2007; see Supplemental Material).
Figure 3.

(a–d) Ensembles of hippocampal time cells fire at sequential moments during the Delay. Each panel includes data from simultaneously neurons from a different rat. Each row represents the normalized firing rate (100 ms bins) for one single neuron over the course of the Delay averaged over all trials in the recording session for each cell that met the minimum firing criterion. In each panel, the neurons are sorted by increasing latency of the maximum firing rate. (e–h) The average normalized temporal modulation, independent of location, direction, speed, and their interactions for Delay periods in the recording sessions corresponding to a–d. The number of neurons in each of these ensembles differs from that in each of the corresponding panels a–d because this analysis included all neurons for which the investigated parameters converged on their maximum likelihood estimates.
Figure 4.

(a) During the Delay period, the ensemble of neurons track the amount of time that has passed between two different moments. Each point shows a normalized Mahalanobis distance between the population vector observed at lags of different lengths. Each line represents a different recording session. (b) The Mahalanobis distance (mean ± se) for the neural population is shown for different lags during the Object (green) and Odor (red) period, as well as the first and last 1.2 s of the Delay period (blue and cyan respectively).
Location, head direction, and running speed, could also account at least in part for the apparent temporal coding (McNaughton et al., 1983; Leutgeb, 2000; but see Muller et al., 1994; Czurkó et al., 1999). To determine whether a time signal is present when these factors are removed, we used a Generalized Linear Model (GLM) that included time, X–Y position, head direction, speed, velocity and interactions among these variables to characterize all neurons in each ensemble for which the parameters converged on their maximum likelihood estimates (see Supplemental Material). Furthermore, using a specific type of projection, we block-diagonalized the covariance matrix of the estimated parameters to isolate the part of the time covariate that is independent from all remaining covariates, providing an index of pure temporal modulation (see Supplemental Material). The results show that, even when the influences of location, direction, speed, velocity, and their interactions are removed, temporal modulation for each neuron still selectively peaks at specific moments and the temporal organization of these timing signals is preserved across the ensemble and bridges the Delay period (Figure 3e–h).
To investigate in detail how location and behavioral variables influenced firing patterns, we first examined whether the rats developed stereotyped behavioral sequences, often observed during periods that precede a reward (Skinner, 1948). Behavior was indeed partially stereotyped such that during the first second of the Delay, rats typically ran directly to the end of the Delay zone, then retreated back towards the beginning. Subsequently, they typically reared against one wall and occasionally changed location (Figure S1), thus permitting an analysis of the extent to which time and other factors influenced firing rate during these mediating behaviors.
We first computed the neuron’s firing rate with reference to the rat’s position during the entire Delay using traditional occupancy normalized firing rate histograms and also created spatial firing rate maps for each successive 1-sec segment of the Delay (Figure 5 illustrates the results from 15 simultaneously neurons; see Methods). This analysis revealed that most of the space occupied by the rat during the first second of the Delay is not occupied again. However, there was substantial overlap among the positions that were occupied from 1 s until the end of the Delay, allowing an examination of how firing patterns changed over the remainder of the Delay. Remarkably, each of these neurons fired only when the rat was at one place, but its firing rate varied across time. Thus, for each neuron shown in Figure 5, one can see that the cell fired maximally, or only, within some of the time segments, even though the rat occupied the same places in other time segments. ANOVAs indicated that 87 out of the 167 Delay neurons (52%) varied in firing rate over Time independent of Position (significant main effect of Time; p ≤ 0.05). Thus, confirming the results of the GLM analyses described above, the firing rates of most hippocampal neurons signaled a combination of time and space. These convergent results indicate that, in addition to their well known spatial coding, temporal coding is a robust property of hippocampal neurons. We also conducted the same analysis on the influences of head direction and running speed during the Delay (Figure S2). ANOVAs revealed a main effect of Time in relation to head direction and running speed for 73% (122/167) and 79% (132/167) of Delay neurons respectively. Both of these proportions were higher than that observed for position, indicating that the firing rates of these cells was more influenced by time than by head direction or running speed (χ21 test, both p’s < 0.001). In addition, for 77 out of these 167 Delay neurons (46%), the firing rate in relation to location, head direction, and running speed depended on the passage of time during the Delay. These analyses indicate that, while time is strongly signaled by these neurons, their activity also reflects location and behavioral variables.
Figure 5.

Spatial activity during the Delay depends on time. Spatial firing rate maps for for 15 simultaneously-recorded neurons. For each cell, the top map is for the entire Delay and maps below focus on successive 1-s segments of the Delay. At the bottom is the temporal firing map in the same format as Figure 3.
Finally, because of the prominent role of place coding in views on hippocampal neural activity, we focused an additional analysis on a direct and quantitative comparison of the influence of time and location on neural activity during the Delay period; these analyses do not consider direction, speed, or their interactions. Using our GLM framework, we computed the likelihood of the data making use of only Space or Time as the main variable and compared them to the likelihood of the data using a model that included the other variable as a covariate (see Methods and Supplemental Material). These analyses indicated that Time was informative in addition to Space for 131 (75%) of the Delay neurons (χ25 > 11.1, p < 0.05). Similarly, for 138 (80%) of the Delay neurons, the addition of Space augmented the amount of information already provided by Time (χ25 > 11.1, p < 0.05). These proportions do not differ (χ21 = 0.6, p = 0.43).
For 48 of the 175 Delay neurons (27%), activity was best explained using only Time or Space because including both as covariates did not sufficiently improve the model. To evaluate whether Space or Time was more influential in these neurons, we compared the goodness of fit measure (i.e., the Akaike Information Criterion) obtained for a model that included only Space or only Time. For 20 out of these 48 neurons, Time provided a better fit than a model that included only Space while Space provided a better fit in the remaining 28 neurons. These proportions do not differ (χ21 = 2.04, p =0.15). Nevertheless, for the majority of the Delay neurons (127/175 or 73%), both Space and Time together provided significantly more information than either variable by itself suggesting that both influence their activity. For these neurons, we also asked which dimension was more informative by defining a neuron’s spatiotemporal information content (STIC). For each neuron, the STIC was computed by noting the increase in the likelihood of the model when one covariate – Space or Time – was added to a model that already included the other variable. The STIC was defined as positive when the addition of the Time covariate to the Space model was relatively more informative than the addition of the Space covariate to the Time model. Similarly, the STIC was negative when the opposite pattern was observed. The STIC of 67 neurons favored Time while that of 60 neurons favored Space (Figure S3), and the mean of the distribution of STICs across the neuronal population did not differ from 0 (single sample t-test, H0: mean of the STIC = 0; t126 = 0.18, p = 0.86). Therefore the population is equivalently influenced by both variables and, within the population, the relative information provided by each dimension varies along a continuum. The combined results of these analyses show that activity during the Delay reflects a balanced combination of spatial and temporal information across the population.
Hippocampal time cells encode absolute and relative time, or “re-time” during the Delay period when temporal cues are altered
We next examined whether time cells consistently represented absolute or relative time within the Delay when the duration of that period was altered. In separate sessions that involved three of the four rats, we recorded from an additional 237 neurons (79 ± 27 per session) as the animals performed the task in three Blocks of trials. For two rats, the Delay in the first Block was approximately the standard 10 s. The second Block of trials began with an abrupt and approximate doubling of the Delay. In the third Block, the Delay was returned to the standard. For the third rat, the first Delay was 5.7 s, the second 11.6 s and the third 19.8 s. The three rats performed an average of 55 (range = 46 – 69) trials during Block 1, 59 trials (range = 36–73) during Block 2, and 45 trials (range = 22–90) during Block 3.
We analyzed 80 neurons (34% of the total recorded) whose activity exceeded 0.1 Hz during the Delay of at least one of the trial Blocks. We used a cross-correlational method to test whether the temporal firing pattern of each neuron reliably differed across Blocks (see Methods and Supplemental Material). This analysis identified 29 neurons (37% of the active population) whose Delay activity was similar across Blocks of trials. We consider these neurons with stable firing patterns to represent absolute time since the onset of the Delay. Examples of absolute-time cells that fire at successively later times into the Delay are shown in the first (from the left) four panels of Figure 6a. We also modified the cross correlational analysis to explore whether neurons rescaled their Delay activity consistent with the doubling in the length of the Delay. Here data from the longer Delay was compressed to match the time scale of the shorter Delay, and this analysis identified 5 neurons that rescaled their activity, suggesting these cells signaled relative time in the Delay; an example of a relative-time cell is presented in the last panel in Figure 6a.
Figure 6.

Neurons maintain their timing or “re-time” when the length of the Delay is abruptly changed. (a, b) Raster plots showing spiking activity from five different neurons referenced to the beginning of the Delay (entire period shown in yellow bars).
(a) Cells that fire at the same time during initial and changed Delays (left 4 panels) and a cell that scaled its timing (right-most panel). (b) Cells that “re-time” when the Delay is increased. (c–f) Spatial firing rate maps during the Delay across successive trial blocks. The format for each trial block is the same as in Figure 5.
The remaining 51 neurons (63%) altered their firing patterns to changes in the Delay in a manner not explained by absolute or relative timing — a phenomenon we will refer to as “re-timing”. When spatial or other variables are changed, hippocampal place cells “re-map” by quantitative changes in firing rate or by qualitative changes in firing pattern including ceasing their activity, becoming active, or changing the place associated with high firing rate (Leutgeb et al., 2005a). Here, similarly, time cells “re-timed” by changing firing rate or by ceasing activity, becoming active when they were previously inactive, or changing their temporal firing pattern when the Delay was increased. Figure 6b provides examples of the variety of re-timing responses to increasing the Delay. The first (from the left) cell fired briskly early in the Delay of Block 1, then faded several trials into Block 2. The second cell showed the opposite pattern: weak activity early in Block 1 and strong early firing after the Delay was increased. The third and fourth cells did not fire in Block 1 and formed distinct timing patterns in Block 2. Finally, the fifth cell was active both early and late in the Delay in Block 1 and its response to lengthening the Delay was to maintain both times, one relative to beginning and the other relative to the end of the Delay. Note that re-timing typically did not occur immediately when the Delay was increased. Comparisons of firing rates within the “time-fields” across trials after the Delay was increased showed that re-timing did not happen immediately but occurred after a variable number of trials, either suddenly or gradually, in different cells (Figure S4).
Neurons that showed absolute and relative timing, as well as re-timing were observed in simultaneously recorded ensembles, ranging 29–54% for absolute and relative timing versus 45–71% for re-timing, suggesting each neuron coded moments in the Delay independently of the others. In addition, two rats were returned to their standard Delay during Block 3, allowing us to assess whether neurons that re-timed returned to the pattern of activity that was observed when the standard Delay was reintroduced. The cross correlation analysis indicated that most neurons (90%, 46/51) that re-timed in Block 2 maintained the altered pattern through Block 3, similar to the hysteresis reported for partial remapping of place cells (Leutgeb et al., 2005b). The remaining 5 neurons appeared to return to a firing pattern in Block 3 that resembled that in Block 1. Examples of both types of responses in Block 3 are presented in Figure 6b.
One possible explanation for re-timing is that the performance of the rat deteriorated when the Delay was lengthened. For two rats, changing the Delay had no apparent effect on performance and this was confirmed by comparing performances in each Block (two-sample t-tests; all p’s> 0.17). A third rat did show a transient decrease in performance from Block 1 to the first third of Block 2 trials (two-sample t-test; t58 = 3.25, p = 0.002). However, its performance recovered during the last two thirds of Block 2 (two-sample t-test; t71 = 2.07, p = 0.04) and was otherwise stable throughout the recording session (for all remaining comparisons: two-sample t-tests, all p’s > 0.18). Note also that, whereas performance for all rats was equally strong in Blocks 1 and 3, when the lengths of the Delays were equal, re-timing that occurred in Block 2 often persisted into Block 3. Thus, re-timing appears unrelated to changes in task performance.
It is also possible that re-timing might be secondary to changes in the locations the rat occupied during sequential time segments when the Delay was lengthened. To address this possibility we compared second-to-second spatial firing rate maps for the early part of the Delay across all trial Blocks. Figure 6c-f shows examples of four neurons whose spatial activity strongly depended on time within particular trial Blocks. Between Blocks, lengthening or returning the Delay to its standard length brought about robust changes in temporal firing patterns, even though the rats occupied the same locations at comparable times in all trial Blocks.
These results show that re-timing is not attributable to differences in behavior during Delays of different lengths, but rather is caused by altering a highly salient temporal parameter that characterizes the Delay event. Combining these findings, changing the duration of the Delay revealed that, while a minority of neurons encode absolute or relative time, the majority form qualitatively distinct representations when the critical temporal cue was altered and most of these maintain the new patterns when the delay is shortened to the original length.
Hippocampal neuronal ensembles signal time during the Object and Odor periods
In order to assess whether a neuronal ensemble tracked the passage of time at each trial period, we used a two-way ANOVA using factors Lag and Trial Period to compare the similarity of the population vector at different lags during the Object, Odor and first 1.2 s (Early) and last 1.2 s (Late) phases of the Delay period. This analysis revealed a main effect of Lag (F(4, 20) = 34.74, p< 0.001), Trial Period (F(3,15) = 9.94, p = 0.001) and an interaction between the two factors (F(12,60) = 3.17, p=0.002). Separate one-way ANOVAs confirmed a main effect of Lag (all p’s < 0.002) and a significant linear component (all p’s< 0.03) such that the population vector became less similar as Lag increased during all trial periods, indicating temporal coding throughout the trial. Furthermore, a comparison of the change in the similarity of the population vector between Lag 1 and Lag 5 (ΔL) indicates that time is coded at higher resolution early in the trial (F(1, 11) = 23.81, p< 0.001; ΔL for Delay-Early and Object compared to ΔL for Delay Late and Odor in Figure 4b).
We also conducted GLM analysis to directly compare the extent to which time and location influence firing during the Object and Odor periods; these analyses do not consider other behavioral variables. Unlike the Delay neurons, the activity from almost three-quarters (72/99 or 72%) of the neurons active in the Object period was best explained by Space or Time, but not both variables. For 43 (60%) of these 72 Object neurons, the inclusion of Space without Time in the model provided a more parsimonious account of the data. In 29 neurons (40%), Time by itself was sufficient to explain neural activity and the proportion of these neurons was different than that explained by Space (χ21 = 4.70, p = 0.03). For the remaining 27 out of 99 Object neurons, activity was explained best by both Time and Space and the STIC from 13 of these neurons favored Time while that of 14 neurons favored Space. The results obtained from neurons active during the Odor period were similar. Of the 72 neurons that were active during Go trials, Space or Time by itself provided a better account of the data for 67 (93%) of them. In this group of neurons, time was informative for 30 out of 67 (45%) of the neurons while Space was more informative for the remaining 42 (55%) neurons. These proportions do not differ (χ21 = 3.36, p = 0.07). The activity from the remaining five neurons were influenced by a combination of Space and Time, with Time was more informative for 2 out of the 5 neurons and Space was more informative for 3. There were no differences between the proportion of neurons more informative for Space than Time in the Delay (95/175, 54%) compared to the Object (42/99, 44%; χ21 = 3.10, p = 0.08) or Odor periods (32/72, 42%; χ21 = 1.60, p = 0.20). That said, during the Delay, a much higher proportion of neurons (73%) encode a combination of both temporal and spatial information compared to the Object (28%) or Odor (7%) periods (χ21 test, both p’s < 0.001). These results suggest that Space and Time were encoded differently during the trial periods.
Hippocampal neurons distinguish event sequences
For each trial period, we determined the proportion of neurons that distinguished trials beginning with different objects. Using a GLM approach that included time and position (but not other variables) as parameters, we formulated one model in which the parameters were the same beginning with either object and another that differed depending on which object began the trial (i.e., the latter model had twice the number of parameters as the first). The models were compared using a likelihood ratio test to test the null hypothesis that augmenting a model with “object-selective parameters” makes no difference (p < 0.05). This analysis revealed that the firing patterns from a significant proportion of neurons within each trial period differed depending on which object began the trial, with the firing pattern differing in the magnitude or temporal pattern of activity or both (Figure 7). Of 99 neurons that fired during the Object period, 31 (31%) were object selective. Of 175 cells active during the Delay, 54 (31%) fired differentially depending on which object initiated the sequence. Because some neurons were sensitive to the difference between a Go and NoGo response, we separately analyzed these trials, thus ensuring that the behavioral response was the same across the two odors being compared even though the event sequence was different. Of the 93 neurons activated during the Odor period, 30 (32%) fired differently depending on the object that began the sequence. There was no significant difference in the proportion of neurons that responded differently to the Object during Go trials (10/30) versus NoGo trials (14/30) (χ21 = 0.63, p = 0.43). We observed 6 neurons that were object selective during both Go and NoGo trials. The proportion of object selective neurons across the Object, Delay, and Odor periods do not significantly differ (all χ21 < 0.02, all p’s > 0.92).
Figure 7.

Neurons distinguish trial event sequences. Similar to the format of Figure 2, each panel includes a raster plot and PSTH from a neuron active during one of the trial periods for all correct trials. The data from are separated according to whether Object 1 (blue) or Object 2 (red) began the trial sequence.
Movement and local field potential (LFP) patterns do not account for differences in firing patterns that distinguish event sequences
Different firing patterns associated with distinct trial sequences might be due to variation in behavioral activity or LFP patterns, rather than the specific events that compose each sequence. To examine this possibility we indexed behavioral activity as the total distance traveled (summed from successive X–Y coordinates) during each trial period and compared activity between trials that began with different objects. In four recording sessions on three different rats, the distance traveled during the Object period differed depending on the object presented (paired t-test’s; all p’s < 0.005), but in two recording sessions from one rat, it did not (p = 0.15 and p = 0.53). Notably, neurons that distinguished the objects were observed during sessions where activity differed between the two types of trials (26 out of 78 cells or 33%) as well as during sessions where activity levels did not differ (5 out of 21 cells or 24%) and these proportions do not differ (χ21= 1.24, p = 0.27). This finding indicates that, while activity level might reflect different exploratory patterns that contribute to differences in firing patterns during object exploration, hippocampal neurons distinguish the objects even when activity levels did not differ. In contrast, there was no difference in the activity levels for trials that began with different objects during the Delay (all p’s > 0.07, range 0.07–0.93) or the Odor period (all p’s > 0.21, range 0.21 – 0.96).
We also calculated trial averaged time-frequency spectrograms for 1–40 Hz taken from each tetrode during each trial period for trials that began with either object (Figure S5). LFPs were strongly modulated in the theta band (4–12 Hz) during each trial period, so our statistical analyses used ANOVA to examine the influences on relative power of the Object, Time, and Frequency within the 4–12 Hz (theta) band. In all trial periods spectral density was not uniformly distributed within the 4–12 Hz band. During the Delay, in 19 of 57 tetrodes, theta power differed depending on the Object (17 out of these 19 tetrodes were from two recording sessions), but did not significantly differ in the remaining 38 tetrodes. Neurons that distinguished Delays preceded by different objects were observed both in tetrodes that differentiated objects by theta power (20 out of 57 cells or 35%) and those that did not (34 out of 118 or 29%), and these proportions did not differ (χ21 = 0.45, p = 0.50). There was no evidence of a relationship between the proportion of object selective neurons on a tetrode and the reliability of theta power in predicting the object (rank correlation, p-value for Object; τ = −0.05, p = 0.62). During both the Object and Odor periods, in only some of the tetrodes (Object: 25 out of 57; Odor 16 out of 57) did theta power differ depending on the Object, and neurons that distinguished the objects were observed both in tetrodes in which theta differed between objects (Object: 12 out of 32 or 38%; Odor: 1 out of 10 or 10%) and in tetrodes in which theta did not differentiate the objects (Object: 19 out of 67 or 28%; Odor: 9 out of 20 or 45%). These proportions do not differ for either trial period (Object: χ21= 0.75, p = 0.37; Odor: χ21 = 2.27, p = 0.132). The rank correlation analysis indicated no relationship between the object-related theta power difference and the proportion of object-selective neurons recorded from the same tetrode for either trial period (rank correlation, p-value for Object; Object: τ = 0.08, p = 0.43; Odor: τ = 0.16, P = 0.15).
These analyses indicate that theta is prevalent during all periods of task performance and that theta power in only a minority of tetrodes distinguishes the objects that began the sequence in each trial period. Furthermore, object selective neurons are observed both in tetrodes where theta power differentiates the objects and those in which it does not in each trial period, indicating that differences in theta power are neither necessary nor sufficient for producing object selective neurons.
Temporal representation by hippocampal neurons
The present findings reveal that a very large proportion of hippocampal neurons encode each sequential moment in a series of events that compose a distinct repeated experience. Hippocampal neurons fired at a sequence of times during key events that occur reliably at particular moments (the objects and odors) and “time cells” encoded sequential moments during an extended discontiguity between those identifiable events. Many hippocampal neurons encoded specific non-spatial stimuli (the object and odors) as well as behavioral responses (Go and NoGo). Most impressively, the time cells that were active during the discontiguity between the key events fired differentially depending on how the sequence began, indicating that the ensembles contained information about each specific sequence during the Delays when the ongoing behavioral events and general location are the same for different sequences. Thus hippocampal neuronal ensembles temporally organize and disambiguate distinct sequences of events that compose specific repeated experiences.
The evidence that neurons that fire at particular moments in the Delay period are “time cells” parallels the evidence that hippocampal neurons that fire at particular locations in space are “place cells”. Thus the strongest current evidence for hippocampal place cells is two-fold: (1) Place cells provide a spatial signal when other potential influences are removed, as observed in recordings from animals moving in random patterns in an open field (Muller et al., 1987a). (2) The firing patterns of place cells are controlled by spatial cues, such that place cells alter their firing patterns when those cues are changed (Muller et al., 1987b). Notably, in addition, several experiments have held constant all spatial cues but varied the behavioral or cognitive demands, and the common result is that many place cells “re-map”, showing that their spatial firing properties are also dependent on non-spatial variables (Eichenbaum et al., 1999). Here we provide parallel evidence for time cells: (1) Time cells provide a temporal signal even when the influences of other prominent variables are statistically removed. (2) The temporal firing patterns of these neurons change when the key temporal cue (the length of the delay period) is altered and behavior and spatial cues are unchanged. In addition, the firing patterns of time cells are also dependent on location and other behavioral variables, just as the spatial activity of place cells is also dependent on non-spatial variables. We believe the term “time cell” is appropriate to describe the temporal coding properties of these hippocampal neurons, just as the term “place cell” is appropriate to describe their spatial firing patterns.
Previous work on hippocampal neuronal activity in rats performing T-maze alternation tasks has shown that hippocampal neuronal ensembles similarly disambiguate overlapping spatial routes (Frank et al., 2000; Wood et al., 2000; reviewed in Shapiro et al., 2006). In an extension of those studies, Pastalkova et al. (2008) revealed the existence of hippocampal neurons that fire at specific moments as rats walk on a running wheel between trials, and some of these cells distinguished subsequent left and right turn trials. The present observations indicate that hippocampal neurons also encode specific times between non-spatial events and disambiguate non-spatial sequences, extending the observation of time cells to filling gaps within a specific non-spatial memory.
Several models have proposed that hippocampal neuronal activity supports the temporal organization of memories by the encoding and retrieval of specific events that compose a sequence, by distinct representations of common events in overlapping sequences, and by bridging gaps between discontiguous events (Rawlins, 1985; Levy, 1989; Wallenstein et al. 1998; Jenson & Lisman, 2005; Howard et al., 2005). In support of these models, experimental studies on both humans (Gelbard-Sagiv et al., 2008; Paz et al., 2010) and animals (Louie & Wilson, 2001; Foster & Wilson, 2006; Karlsson & Frank, 2009; Davidson et al., 2009) have shown that hippocampal neuronal ensembles “replay” specific event representations following learning. Temporal order in episodic memories is also supported by a gradually changing representation of the temporal context of successive events (Manns et al., 2007). That study did not determine how the temporal organization of neural activity bridges the gap between discontiguous events and, because the sequences were trial-unique, that study did not show how specific sequences are encoded within the changing temporal context signal. The current findings are entirely compatible with those earlier results, and now show that distinct repeated experiences are represented by sequential neuronal firing patterns that reflect both the changing temporal context and a specific series of events.
Our examination of changes in time cell firing patterns following alteration of the Delay revealed that hippocampal neurons respond in diverse ways when the key temporal parameter in a sequence is modified. Some time cells fired at the same absolute or relative time to the delay onset, but most developed qualitatively different firing patterns under distinct delay periods. This pattern of responses to changing the delay period are reminiscent of the prominent observation of “partial remapping” of place cells when salient spatial cues are altered (e.g., Muller & Kubie, 1987; Breese et al., 1989; Markus et al., 1995; Sharp et al., 1995; Shapiro et al., 1997; Skaggs & McNaughton, 1998). Thus, when salient spatial parameters or task demands are altered in rats traversing open fields, some hippocampal place cells maintain their firing patterns but others cease firing, begin firing, or fire with qualitatively different patterns related to the animal’s location even within the same recording session.
As animals performed this task, they occupied different locations in each sequential trial period, and they could move during each trial period. These variations in behavior allowed us to determine that, in addition to time and the object that began each sequence, both behavioral variation and place contributed to the differences in firing patterns between and within trial periods. In particular, during the Delay when there were no differences between overt stimuli and behavior, the activity of most cells was strongly and equivalently influenced by a combination of time and place. As typically observed in studies on place cells, the activity of time cells were also influenced by behavioral variations reflected in head direction and speed (reviewed in Eichenbaum, 2004). In addition, notably, previous studies have shown that hippocampal neurons encode ongoing behavioral context as well as spatial location, head direction, and speed (e.g., Wood et al., 2000). The present results extend this broad range of contextual variables that affect single neuron activity to the flow of time in bridging of temporal gaps within sequences of events.
Five main findings indicate that hippocampal representation of time during sequential events is quite similar to its representation of space as animals explore an open field. (1) A large proportion of hippocampal neurons are engaged during performance of a sequence memory task, just as a large fraction of hippocampal neurons are place cells when rats are engaged in spatial exploration (Thompson & Best, 1989; Muller, 1996). (2) Time cells fire at discrete moments during “empty” periods in a temporally organized memory, much as place cells encode discrete locations devoid of specific stimuli as animals traverse an open space (Muller, 1996). (3) Hippocampal neural activity signals the nature and timing of salient events that occur at particular moments in temporal sequences, just as place cells encode specific events in the locations they occur in space (Komorowski et al., 2009; Manns & Eichenbaum, 2009). (4) Time cells disambiguate overlapping sequence memories, just as place cells disambiguate overlapping routes through a maze (Wood et al., 2000; Frank et al., 2000; Ferbinteanu & Shapiro, 2006). (5) Time cells partially “re-time” when a key temporal parameter is altered, just as place cells partially “re-map” when critical spatial cues are altered (Muller & Kubie, 1987b). These findings suggest that place cells and time cells may reflect fundamental mechanisms by which hippocampal neuronal networks parse any spatio-temporal context into quantal units of where and when important events occur. Speculating further, while place cells and time cells are appropriately named for the variables they represent in spatially and temporally defined behavioral paradigms, they may be processing information that is fundamentally neither spatial nor temporal. Rather, it seems possible that hippocampal neuronal ensembles may bridge and thereby organize elements in any conceptual organization of remembered events.
Experimental Procedures
Subjects, behavioral and electrophysiological procedures
Four male Long-Evans rats were food restricted and maintained at a weight of 400–450 g. The behavioral procedure was a modified version of an object-trace-odor paired-associate task in which performance depends on hippocampal (CA1) function (Kesner et al., 2006; for details, see Supplemental Material). The rats were prepared for surgery once they acquired the task and performance was stable (>70% on three consecutive sessions). Following a standard surgical protocol (e.g., Manns et al., 2007; Komorowski et al., 2009), a 23 tetrode hyperdrive was implanted into the left hemisphere of the rat’s dorsal hippocampus (AP= −3.6 mm; ML= 2.8 mm). Each tetrode consisted of four nichrome wires (12.5 μm diameter; California Fine Wire, CA) gold plated to lower the impedance to 200 kΩ at 1 kHz. At the end of surgery, each tetrode was lowered ~850 μm into tissue. After 5–7 days of recovery, the tetrodes were lowered over 7–14 days towards the CA1 layer, using the progressive increase in theta amplitude, the appearance of sharp-wave events, and finally theta-modulated and complex-cell spiking to localize CA1 (Fox and Ranck, 1981, Buzsaki et al., 1983). After the experiments, 25 μA of current was passed through each tetrode for 30 s before perfusion and histological confirmation of tetrode placement.
Once the tetrodes were placed in their desired location, the rats were tested for 1–2 hours including 72 – 117 trials for each recording session. The electrical signal recorded from the tips of the tetrodes were referenced to a common skull screw and differentially filtered for single unit activity (154 Hz – 8.8 kHz) and local field potentials (1.5 – 400 Hz). The amplified potentials from each wire were digitized at 40 kHz and monitored with the Multineuron Acquisition Processor (Plexon Inc., Dallas, TX). Action potentials from single neurons were isolated using time-amplitude window discrimination through Offline Sorter (Plexon Inc., Dallas, TX). We used conventional methods to identify putative pyramidal neurons and distinguish them from interneurons based on firing rates and waveforms (Csicsvari et al., 1999— see also Figure S6 for representative waveforms). Individual pyramidal neurons were isolated by visualizing combinations of waveform features (square root of the power, spike-valley, valley, peak, principal components and time-stamps) extracted from wires making up a single tetrode (i.e., “cluster cutting”). Single neuron selectivity was verified by the inter-spike interval histograms that contained no successive spikes within a 2 ms refractory period. Single neuron stability was verified by comparing clusters across trials.
Behavioral scoring and event-related neural activity
The rat’s behavior was recorded throughout testing with digital video (30 frames/s) using Cineplex Video Tracker (Plexon Inc., Dallas, TX). The video was synchronized to the neural data and the rat’s position was tracked using two light-emitting diodes (LED) on the recording head stage. The position of the rat was confirmed offline using Cineplex software (Plexon Inc., Dallas, TX) by running thoroughly through each testing session and correcting any anomalies that arose during LED tracking. Positions of the two LED coodinates were used to compute head direction in each videoframe. Behavioral events were scored off line using the same software.
For each trial, spike trains obtained from single neurons were aligned to the onset of the trial period of interest (defined above). For the Object period, 1.2 s of data were taken starting from when the rat’s nose came ~1 mm from the object. The spike trains during the Delay were aligned starting from the beginning of the Delay and terminated at the end of the Delay (defined above). Finally, for the Odor period, the spike trains were aligned starting from onset of the Odor period (defined above). All rats spent at least 1.2 s over the pot during each Go trial. Therefore, we used 1.2 s of the spike trains starting from Odor period onset to evaluate neural activity during these trials. For NoGo trials, across recording sessions the rat’s spent 1.03 ± 0.03 s (mean ± s.e.) dwelling over the pot. As such, for NoGo trials, the end of the Odor period was defined as the time at which the rat’s head re-crossed the imaginary plane (see above) as it refrained from digging and retracted his head from the pot. If the rat spent more than 1.2 s sampling the odor on NoGo trials, the odor sampling time was set to 1.2 s. This criterion ensured that the Odor period corresponded to the rat’s head dwelling over the sand and odor media in the pot.
Constructing perivent stimulus histograms and raster plots
PSTHs were made by using custom scripts for Matlab (MathWorks, Natick, MA) or purchased software (Neuroexplorer, Plexon Inc. Dallas, TX). For Figures 2 and 7, we used 50 ms time-bins and a Gaussian kernel with σ = 150 ms to smooth the data during the Object and Odor period. For the Delay, we used 200-ms time-bins and a Gaussian kernel with σ = 600 ms to smooth the data. For Figure 3, we used 100-ms time-bin and a Gaussian kernel with σ = 300 ms to smooth the data.
Analysis methods
A generalized linear model framework was used to perform statistical modeling of neural activity. All analyses were performed on custom code using Matlab (Natick, MA). The spike trains during the trial period of interest were modeled as point processes and analyzed within a generalized linear model framework (McCullagh and Nelder, 1989; Daley and Vere-Jones, 2003; Brown et al., 2003; Truccolo et al., 2005). Further details on these analyses are provided in the Supplemental Material.
To evaluate the similarity between temporal firing patterns during the Delay across trial Blocks, we computed the Kendall rank correlation coefficient (τ) between pairs of PSTHs (500 ms time-bins) that were made using spiking activity from each trial Block. For Blocks 2 and 3, we excluded the first 10 trials in making the PSTH as initial inspection confirmed that many neurons did not change their pattern of activity immediately. This process gave us τ summarizing the similarity in activity between all pairs of trial Blocks. Resampling methods were used to in order to confirm whether a τ for two Blocks was unusually low. That is, we obtained an empirical distribution of τ obtained under the null hypothesis that pattern of activity for two Blocks were the same. The τ computed between two Blocks was considered to have changed if it was lower than 99% of the τ values obtained for the empirical distribution under the null hypothesis. Using this approach, we could determine whether a neuron changed its firing pattern from Block to Block. To test whether a neuron rescaled its Delay activity when the Delay was doubled, the same approach was taken but the PSTH for the longer Delay used time-bins whose duration was also doubled. Further details on this analysis are provided in the Supplemental Material.
To assess the effect of time on firing rate related to the rat’s position, we generated spatial firing rate maps for the Delay zone as 1 cm by 1 cm bins, and calculated occupancy-normalized firing rates. To assess firing rates related to head direction, we assigned each head direction observation to one of sixty, non-overlapping 6° bins and calculated occupancy-normalized firing rates for each bin. Speed firing rate plots were based on computations of the difference in the X–Y position for successive frames, assigned to one of thirty speed bins that spanned 0 – 30 cm/s, and occupancy normalized firing rates were calculated for each bin. ANOVAs were performed on trial by trial, unfiltered firing rates for each 1-s segment of the Delay. We used only those bins whose firing rate could be estimated in all of the 1-s segments across trials, allowing an ANOVA with factors Time and Bin to test whether Time modulated neural activity. Further details on this method are provided in the Supplemental Material.
Analysis of local field potential (LFP) frequency as a function of time used the multi-taper functions written for Matlab that are freely available as part of the Chronux toolbox (P. Mitra; http://www.chronux.org). For the Delay, the trial-averaged multi-tapered spectrum was determined (mtspectrumc.m) using a window size of 1 s that started at the beginning of the Delay and was slid across time using 100-ms increments. For the Object and Odor periods, a window size of 1.2 s was time locked to the beginning of the either period and slid with one 100-ms increment. The trial-averaged spectrum was computed separately depending on the Object that was presented. For a given tetrode, in order to test whether theta (i.e., 4–12 Hz) power differed depending on the object presented during each trial period, a trial-average spectrogram was generated using the same parameters as above except that the frequency range was confined to 4–12 Hz. Further details of the ANOVAs performed on the LFPs are provided in the Supplemental Material.
Supplementary Material
Hippocampal “time cells” bridge discontiguous events
Hippocampal neuronal activity signals the timing of key events in sequences
Hippocampal neuronal activity differentiates distinct types of sequences
Time cells partially “re-time” when the key temporal parameter is changed
Acknowledgments
This work was supported by NIMH grant MH71702. We’d like to thank Charlotte Wincott, Stephen Carrow, and Steve Ramirez for their enthusiastic assistance.
Footnotes
Publisher's Disclaimer: This is a PDF file of an unedited manuscript that has been accepted for publication. As a service to our customers we are providing this early version of the manuscript. The manuscript will undergo copyediting, typesetting, and review of the resulting proof before it is published in its final citable form. Please note that during the production process errors may be discovered which could affect the content, and all legal disclaimers that apply to the journal pertain.
References
- Agster KL, Fortin NJ, Eichenbaum H. The hippocampus and disambiguation of overlapping sequences. J Neurosci. 2002;22:5760–5768. doi: 10.1523/JNEUROSCI.22-13-05760.2002. [DOI] [PMC free article] [PubMed] [Google Scholar]
- Breese CR, Hampson RE, Deadwyler SA. Hippocampal place cells: stereotypy and plasticity. J Neurosci. 1989;9:1097–1111. doi: 10.1523/JNEUROSCI.09-04-01097.1989. [DOI] [PMC free article] [PubMed] [Google Scholar]
- Brown EN, Barbieri R, Eden UT, Frank LM. Likelihood methods for neural spike train data analysis. In: Feng J, editor. Computational Neuroscience: A Comprehensive Approach. London: CRC Press; 2003. pp. 253–286. [Google Scholar]
- Brown TI, Ross RS, Keller JB, Hasselmo ME, Stern CE. Which way was I going? Contextual retrieval supports the disambiguation of well learned overlapping navigational routes. J Neurosci. 2010;26:7414–7422. doi: 10.1523/JNEUROSCI.6021-09.2010. [DOI] [PMC free article] [PubMed] [Google Scholar]
- Buzsáki G, Leung LW, Vanderwolf CH. Cellular bases of hippocampal EEG in the behaving rat. Brain Res. 1983;287:139–171. doi: 10.1016/0165-0173(83)90037-1. [DOI] [PubMed] [Google Scholar]
- Csicsvari J, Hirase H, Czurko A, Mamiya A, Buzsaki G. Oscillatory coupling of hippocampal pyramidal cells interneurons in the behaving rat. JNeurosci. 1999;19:274–287. doi: 10.1523/JNEUROSCI.19-01-00274.1999. [DOI] [PMC free article] [PubMed] [Google Scholar]
- Czurkó A, Hirase H, Csicsvari J, Buzsáki G. Sustained activation of hippocampal pyramidal cells by ‘space clamping’ in a running wheel. Eur J Neurosci. 1999;11:344–352. doi: 10.1046/j.1460-9568.1999.00446.x. [DOI] [PubMed] [Google Scholar]
- Daley D, Vere-Jones D. An introduction to the theory of point processes. New York: Springer-Verlag; 2003. [Google Scholar]
- Davidson TJ, Kloosterman F, Wilson MA. Hippocampal replay of extended experience. Neuron. 2007;63:497–507. doi: 10.1016/j.neuron.2009.07.027. [DOI] [PMC free article] [PubMed] [Google Scholar]
- Day M, Langston R, Morris RGM. Glutamate-receptor-mediated encoding and retrieval of paired associate learning. Nature. 2003;424:205–209. doi: 10.1038/nature01769. [DOI] [PubMed] [Google Scholar]
- Eichenbaum H, Dudchencko P, Wood E, Shapiro M, Tanila H. The hippocampus, memory, and place cells: Is it spatial memory or a memory space? Neuron. 1999;23:209–226. doi: 10.1016/s0896-6273(00)80773-4. [DOI] [PubMed] [Google Scholar]
- Eichenbaum H. Hippocampus: Cognitive processes and neural representations that underlie declarative memory. Neuron. 2004;44:109–120. doi: 10.1016/j.neuron.2004.08.028. [DOI] [PubMed] [Google Scholar]
- Ergorul C, Eichenbaum H. The hippocampus for “what,” “where,” and “when”. Learn Mem. 2004;11:397–405. doi: 10.1101/lm.73304. [DOI] [PMC free article] [PubMed] [Google Scholar]
- Farovik A, Dupont LM, Eichenbaum H. Distinct roles for dorsal CA3 and CA1 in memory for sequential nonspatial events. Learn Mem. 2009;17:12–17. doi: 10.1101/lm.1616209. [DOI] [PMC free article] [PubMed] [Google Scholar]
- Ferbinteanu J, Shapiro ML. Prospective and retrospective memory coding in the hippocampus. Neuron. 2003:1227–1239. doi: 10.1016/s0896-6273(03)00752-9. [DOI] [PubMed] [Google Scholar]
- Fortin NJ, Agster KL, Eichenabaum HB. Critical role of the hippocampus in memory for sequences of events. Nat Neurosci. 2002;5:458–462. doi: 10.1038/nn834. [DOI] [PMC free article] [PubMed] [Google Scholar]
- Fortin NJ, Wright SP, Eichenbaum H. Recollection-like memory retrieval in rats is dependent on the hippocampus. Nature. 2004;431:188–191. doi: 10.1038/nature02853. [DOI] [PMC free article] [PubMed] [Google Scholar]
- Foster DJ, Wilson MA. Reverse replay of behavioural sequences in hippocampal place cells during awake state. Nature. 2006;440:680–683. doi: 10.1038/nature04587. [DOI] [PubMed] [Google Scholar]
- Fox SE, Ranck JB. Electrophysiological characteristics of hippocampal complex-spiking and theta cells. Exp Brain Res. 1981;41:399–410. doi: 10.1007/BF00238898. [DOI] [PubMed] [Google Scholar]
- Frank LM, Brown EN, Wilson M. Trajectory encoding in the hippocampus and entorhinal cortex. Neuron. 2000;27:169–178. doi: 10.1016/s0896-6273(00)00018-0. [DOI] [PubMed] [Google Scholar]
- Gelhard-Sagiv H, Mukamel R, Harel M, Malach R, Fried I. Internally generated reactivation of single neurons in human hippocampus during free recall. Science. 2008;322:96–101. doi: 10.1126/science.1164685. [DOI] [PMC free article] [PubMed] [Google Scholar]
- Gibbon J, Church RM, Meck WH. Scalar timing in memory. Ann N Y Acad Sci. 1984;423:52–77. doi: 10.1111/j.1749-6632.1984.tb23417.x. [DOI] [PubMed] [Google Scholar]
- Hales JB, Israel SL, Swann NC, Brewer JB. Dissociation of frontal and medial temporal lobe activity in maintenance and binding of sequentially presented paired associates. J Cogn Neurosci. 2009;21:1244–1254. doi: 10.1162/jocn.2009.21096. [DOI] [PMC free article] [PubMed] [Google Scholar]
- Hales JB, Brewer JB. Activity in the hippocampus and neocortical working memory regions predicts successful associative memory for temporally discontiguous events. Neuropsychologia. 2010;48:3351–3359. doi: 10.1016/j.neuropsychologia.2010.07.025. [DOI] [PMC free article] [PubMed] [Google Scholar]
- Howard MW, Fotedar MS, Datey AV, Hasselmo ME. The temporal context model in spatial navigation and relational learning: toward a common explanation of medial temporal lobe function across domains. Psychol Rev. 2005;112:75–116. doi: 10.1037/0033-295X.112.1.75. [DOI] [PMC free article] [PubMed] [Google Scholar]
- Jensen O, Lisman JE. Hippocampal sequence-encoding driven by a cortical multi-item working memory buffer. Trends Neurosci. 2005;28:67–82. doi: 10.1016/j.tins.2004.12.001. [DOI] [PubMed] [Google Scholar]
- Karlsson MP, Frank LM. Awake replay of remote experiences in the hippocampus. Nat Neurosci. 2009;12:913–918. doi: 10.1038/nn.2344. [DOI] [PMC free article] [PubMed] [Google Scholar]
- Kesner RP, Gilbert PE, Barua LA. The role of the hippocampus in memory for the temporal order of a sequence of odors. Behav Neurosci. 2002;116:286–290. doi: 10.1037//0735-7044.116.2.286. [DOI] [PubMed] [Google Scholar]
- Kesner RP, Hunsaker MR, Gilbert PE. The role of CA1 in the acquisition of an object-trace-odor paired associate task. Behav Neurosci. 2005;119:781–786. doi: 10.1037/0735-7044.119.3.781. [DOI] [PubMed] [Google Scholar]
- Kobayashi T, Nishijo H, Fukuda M, Bures J, Ono T. Task-dependent representations in rat hippocampal place neurons. J Neurophysiol. 1997;78:597–613. doi: 10.1152/jn.1997.78.2.597. [DOI] [PubMed] [Google Scholar]
- Komorowski RW, Manns JR, Eichenbaum H. Robust conjunctive item-place coding by hippocampal neurons parallels learning and what happens where. J Neurosci. 2009;29:9918–9929. doi: 10.1523/JNEUROSCI.1378-09.2009. [DOI] [PMC free article] [PubMed] [Google Scholar]
- Kumaran D, Maguire EA. The dynamics of hippocampal activation during encoding of overlapping sequences. Neuron. 2006;49:617–629. doi: 10.1016/j.neuron.2005.12.024. [DOI] [PubMed] [Google Scholar]
- Lehn H, Steffanach HA, van Strien NM, Veltman DJ, Witter MP, Håberg AK. A specific role of the human hippocampus in recall of temporal sequences. J Neurosci. 2009;29:475–484. doi: 10.1523/JNEUROSCI.5370-08.2009. [DOI] [PMC free article] [PubMed] [Google Scholar]
- Leutgeb S, Leutgeb JK, Barnes CA, Moser EI, McNaughton BL, Moser MB. Independent codes for spatial and episodic memory in hippocampal neuronal ensembles. Science. 2005a;309:619–623. doi: 10.1126/science.1114037. [DOI] [PubMed] [Google Scholar]
- Leutgeb JK, Leutgeb S, Treves A, Meyer R, Barnes CA, McNaughton BL, Moser MB, Moser EI. Progressive transformation of hippocampal neuronal representations in “morphed” environments. Neuron. 2005b;48:345–358. doi: 10.1016/j.neuron.2005.09.007. [DOI] [PubMed] [Google Scholar]
- Leutgeb S, Ragozzino KE, Mizumori SJ. Convergence of head direction and place information in the CA1 region of hippocampus. Neuroscience. 2000;100:11–19. doi: 10.1016/s0306-4522(00)00258-x. [DOI] [PubMed] [Google Scholar]
- Levy WB. A computational approach to hippocampal function. In: Bower G, editor. Computational Modeling of Learning In Simple Neural Systems. Orlando, FL: Academic Press; 1989. pp. 243–305. [Google Scholar]
- Louie K, Wilson MA. Temporally structured replay of awake hippocampal ensemble activity during rapid eye movement sleep. Neuron. 2001;29:145–156. doi: 10.1016/s0896-6273(01)00186-6. [DOI] [PubMed] [Google Scholar]
- Manns JR, Howard MW, Eichenbaum H. Gradual changes in hippocampal activity support remember the order of events. Neuron. 2007;26:530–540. doi: 10.1016/j.neuron.2007.08.017. [DOI] [PMC free article] [PubMed] [Google Scholar]
- Manns JR, Eichenbaum H. A cognitive map for object memory in the hippocampus. Learn Mem. 2009;16:616–624. doi: 10.1101/lm.1484509. [DOI] [PMC free article] [PubMed] [Google Scholar]
- Markus EJ, Qin YL, Leonard B, Skaggs WE, McNaughton BL, Barnes CA. Interactions between location and task affect the spatial and directional firing of hippocampal neurons. J Neurosci. 1995;15:7079–7094. doi: 10.1523/JNEUROSCI.15-11-07079.1995. [DOI] [PMC free article] [PubMed] [Google Scholar]
- McCullagh P, Nelder JA. Generalized Linear Models. Boca Raton, FL: Chapman & Hall/CRC; 1989. [Google Scholar]
- McNaughton BL, Barnes CA, O’Keefe J. The contributions of position, direction, and velocity to single unit activity in the hippocampus of freely-moving rats. Exp Brain Res. 1983;52:41–49. doi: 10.1007/BF00237147. [DOI] [PubMed] [Google Scholar]
- Meck WH, Church RM, Olton DS. Hippocampus, time, and memory. Behav Neurosci. 1984;98:3–22. doi: 10.1037//0735-7044.98.1.3. [DOI] [PubMed] [Google Scholar]
- Moyer JR, Deyo RA, Disterhoft JF. Hippcampectomy disrupts trace eye-blink conditioning in rabbits. Behav Neurosci. 1990;104:243–252. doi: 10.1037//0735-7044.104.2.243. [DOI] [PubMed] [Google Scholar]
- Muller RU, Kubie JL, Ranck JB., Jr Spatial firing patterns of hippocampal complex spike cells in a fixed environment. J Neurosci. 1987a;7:1935–1950. doi: 10.1523/JNEUROSCI.07-07-01935.1987. [DOI] [PMC free article] [PubMed] [Google Scholar]
- Muller RU, Kubie JL. The effects of changes in the environment of the spatial firing of hippocampal complex-spike cells. J Neurosci. 1987b;7:1951–1968. doi: 10.1523/JNEUROSCI.07-07-01951.1987. [DOI] [PMC free article] [PubMed] [Google Scholar]
- Muller RU, Bostock E, Taube JS, Kubie JL. On the directional firing properties of hippocampal place cells. J Neurosci. 1994;14:7235–7251. doi: 10.1523/JNEUROSCI.14-12-07235.1994. [DOI] [PMC free article] [PubMed] [Google Scholar]
- Muller RU. A quarter of a century of place cells. Neuron. 1996;17:813–822. doi: 10.1016/s0896-6273(00)80214-7. [DOI] [PubMed] [Google Scholar]
- O’Keefe J, Dostrovsky J. The hippocampus as a spatial map. Preliminary evidence from unit activity in the freely-moving rat. Brain Res. 1971;34:171–175. doi: 10.1016/0006-8993(71)90358-1. [DOI] [PubMed] [Google Scholar]
- Paz R, Gelhard-Sagiv H, Mukamel R, Harel M, Malach R, Fried I. A neural substrate in the human hippocampus for linking successive events. Proc Natl Acad Sci USA. 2010;107:6046–6051. doi: 10.1073/pnas.0910834107. [DOI] [PMC free article] [PubMed] [Google Scholar]
- Rawlins JNP. Associations across time: the hippocampus as a temporary store. Brain Behav Sci. 1985;8:479–496. [Google Scholar]
- Ross RS, Brown TI, Stern CE. The retrieval of learned sequences engages the hippocampus: Evidence from fMRI. Hippocampus. 2009;19:790–799. doi: 10.1002/hipo.20558. [DOI] [PMC free article] [PubMed] [Google Scholar]
- Shapiro ML, Tanila H, Eichenbaum H. Cues that hippocamapl place cells encode: dynamic and hierarchical representation of local and distal stimuli. Hippocampus. 1997;7:624–642. doi: 10.1002/(SICI)1098-1063(1997)7:6<624::AID-HIPO5>3.0.CO;2-E. [DOI] [PubMed] [Google Scholar]
- Shapiro ML, Kennedy PJ, Ferbinteanu J. Representing episodes in the mammalian brain. Curr Opin Neurobiol. 2006;16:701–709. doi: 10.1016/j.conb.2006.08.017. [DOI] [PubMed] [Google Scholar]
- Sharp PE, Blair HT, Etkin D, Tzanetos DB. Influences of vestibular and visual motion information on the spatial firing patterns of hippocampal place cells. J Neurosci. 1995;15:173–189. doi: 10.1523/JNEUROSCI.15-01-00173.1995. [DOI] [PMC free article] [PubMed] [Google Scholar]
- Skaggs WE, McNaughton BL. Spatial firing properties of hippocampal CA1 populations in an environment containing two visually identical regions. J Neurosci. 1998;18:8455–8466. doi: 10.1523/JNEUROSCI.18-20-08455.1998. [DOI] [PMC free article] [PubMed] [Google Scholar]
- Skinner BF. “Superstition” in the pigeon. J Exp Psychol. 1948;38:1968–1972. doi: 10.1037/h0055873. [DOI] [PubMed] [Google Scholar]
- Staddon JER, Higa JJ. Time and memory: towards a pacemaker-free theory of interval timing. J Exp Anal Behav. 1999;71:215–251. doi: 10.1901/jeab.1999.71-215. [DOI] [PMC free article] [PubMed] [Google Scholar]
- Staresina BP, Davachi L. Mind the gap: binding experiences across space and time in the human hippocampus. Neuron. 2009;63:267–276. doi: 10.1016/j.neuron.2009.06.024. [DOI] [PMC free article] [PubMed] [Google Scholar]
- Steinvorth S, Levine B, Corkin S. Medial temporal lobe structures are needed to re-experience remote autobiographical memories: evidence from H.M. and W.R. Neuropsychologia. 2005;43:479–496. doi: 10.1016/j.neuropsychologia.2005.01.001. [DOI] [PubMed] [Google Scholar]
- Thompson LT, Best PJ. Place cells and silent cells in the hippocampus of freely behaving rats. J Neurosci. 1989;9:2382–2390. doi: 10.1523/JNEUROSCI.09-07-02382.1989. [DOI] [PMC free article] [PubMed] [Google Scholar]
- Truccolo W, Eden UT, Fellows MR, Donoghue JP, Brown EN. A point process framework for relating neural spiking activity to spiking history, neural ensemble, and extrinsic covariate effects. J Neurophysiol. 2005;93:1074–1089. doi: 10.1152/jn.00697.2004. [DOI] [PubMed] [Google Scholar]
- Tulving E. Episodic and semantic memory. In: Tulving E, Donaldson W, editors. Organization of Memory. New York: Academic Press; 1972. pp. 381–403. [Google Scholar]
- Tulving E. Elements of Episodic Memory. New York: Oxford University Press; 1983. [Google Scholar]
- Turbidy S, Davachi L. Medial temporal lobe to episodic sequence encoding. Cereb Cortex. 2011;21:272–280. doi: 10.1093/cercor/bhq092. [DOI] [PMC free article] [PubMed] [Google Scholar]
- Vargha-Khadem F, Gadian DG, Watkins KE, Connelly A, Van Paesschen W, Mishkin M. Differential effects of early hippocampal pathology on episodic and semantic memory. Science. 1997;277:376–380. doi: 10.1126/science.277.5324.376. [DOI] [PubMed] [Google Scholar]
- Wallenstein GV, Eichenbaum H, Hasselmo ME. The hippocampus as an associator of discontiguous events. Trends Neurosci. 1998;21:317–323. doi: 10.1016/s0166-2236(97)01220-4. [DOI] [PubMed] [Google Scholar]
- Wood ER, Dudchenko PA, Robitsek RJ, Eichenbaum H. Hippocampal neurons encode information about different types of memory episodes occurring in the same location. Neuron. 2000;27:623–633. doi: 10.1016/s0896-6273(00)00071-4. [DOI] [PubMed] [Google Scholar]
Associated Data
This section collects any data citations, data availability statements, or supplementary materials included in this article.